Furmanite — Q1 2011 Earnings Presentation
17 slides from Furmanite's earnings presentation, May 10, 2011
Slide 1: Furmanite Corporation Quarter Ended March 31, 2011
Furmanite Corporation QUARTER ENDED MARCH 31, 2011 Charles R. Cox, Chairman & CEO Joseph E. Milliron, President & COO Robert S. Muff, Principal Financial Officer

Slide 2: Forward-looking statements
Certain of the Company's statements in this presentation are not purely historical, and as such are "forward-looking statements" within the meaning of the Private Securities Litigation Reform Act of 1995. These include statements regarding management's plans, beliefs, expectations, intentions or pro
Slide 3: Furmanite Corporation Quarter Ended March 31, 2011
Furmanite Corporation QUARTER ENDED MARCH 31, 2011 Charles R. Cox, Chairman & CEO 3

Slide 4: Our Mission
Our Mission: To safely and cost-effectively provide World Class solutions for the full range of each Customer's unique local needs - from routine to the most challenging - and to make Furmanite their most trusted Global provider of every Specialty Service we offer. "Delivering World Class Solutions

Slide 5: Company values
Safety above all else Integrity and Ethical conduct Customer Responsiveness Perfect Service and Products Global Teamwork and Collaboration 5 Leadership Innovation and Differentiation Continuous Improvement and Growth Urgency, Passion and Commitment Professional and Positive Make Furmanite the compan
Slide 6: Financial Review
Furmanite Corporation QUARTER ENDED MARCH 31, 2011 Financial Review Robert S. Muff, Principal Financial Officer 6
Slide 7: Consolidated Income Statements
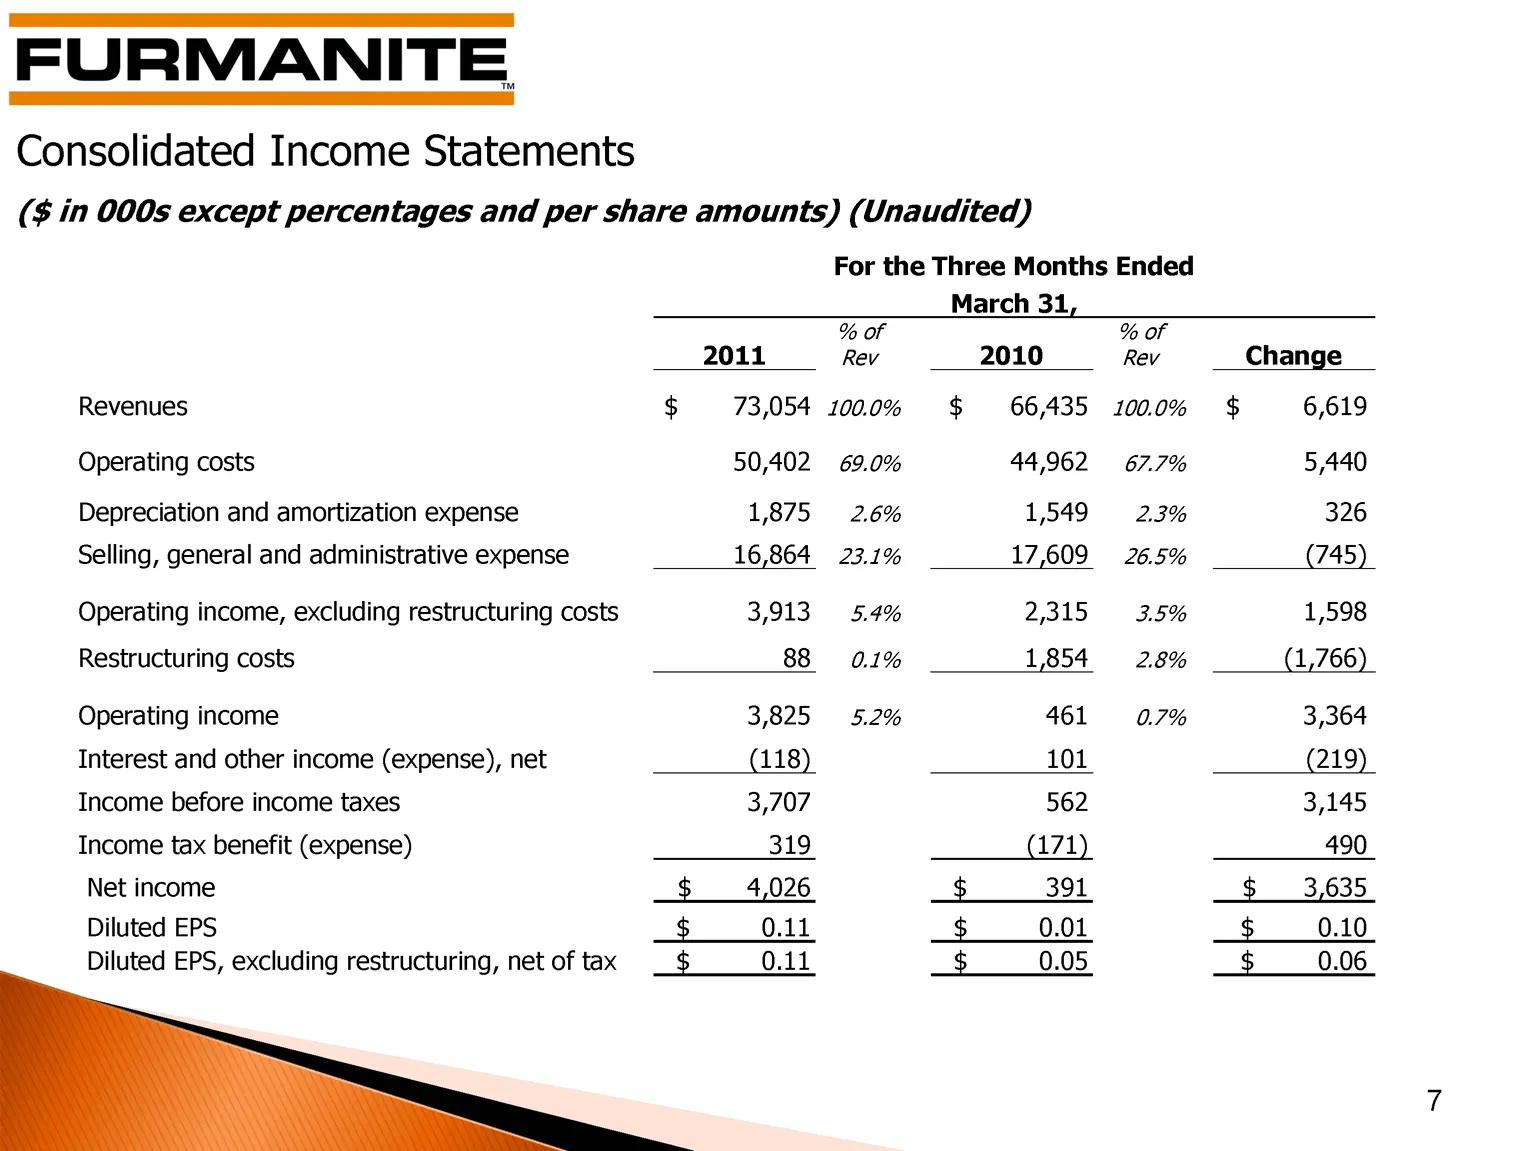
Consolidated Income Statements ($ in 000s except percentages and per share amounts) (Unaudited) 7 For the Three Months Ended For the Three Months Ended For the Three Months Ended For the Three Months Ended For the Three Months Ended For the Three Months Ended For the Three Months Ended March 31, Mar
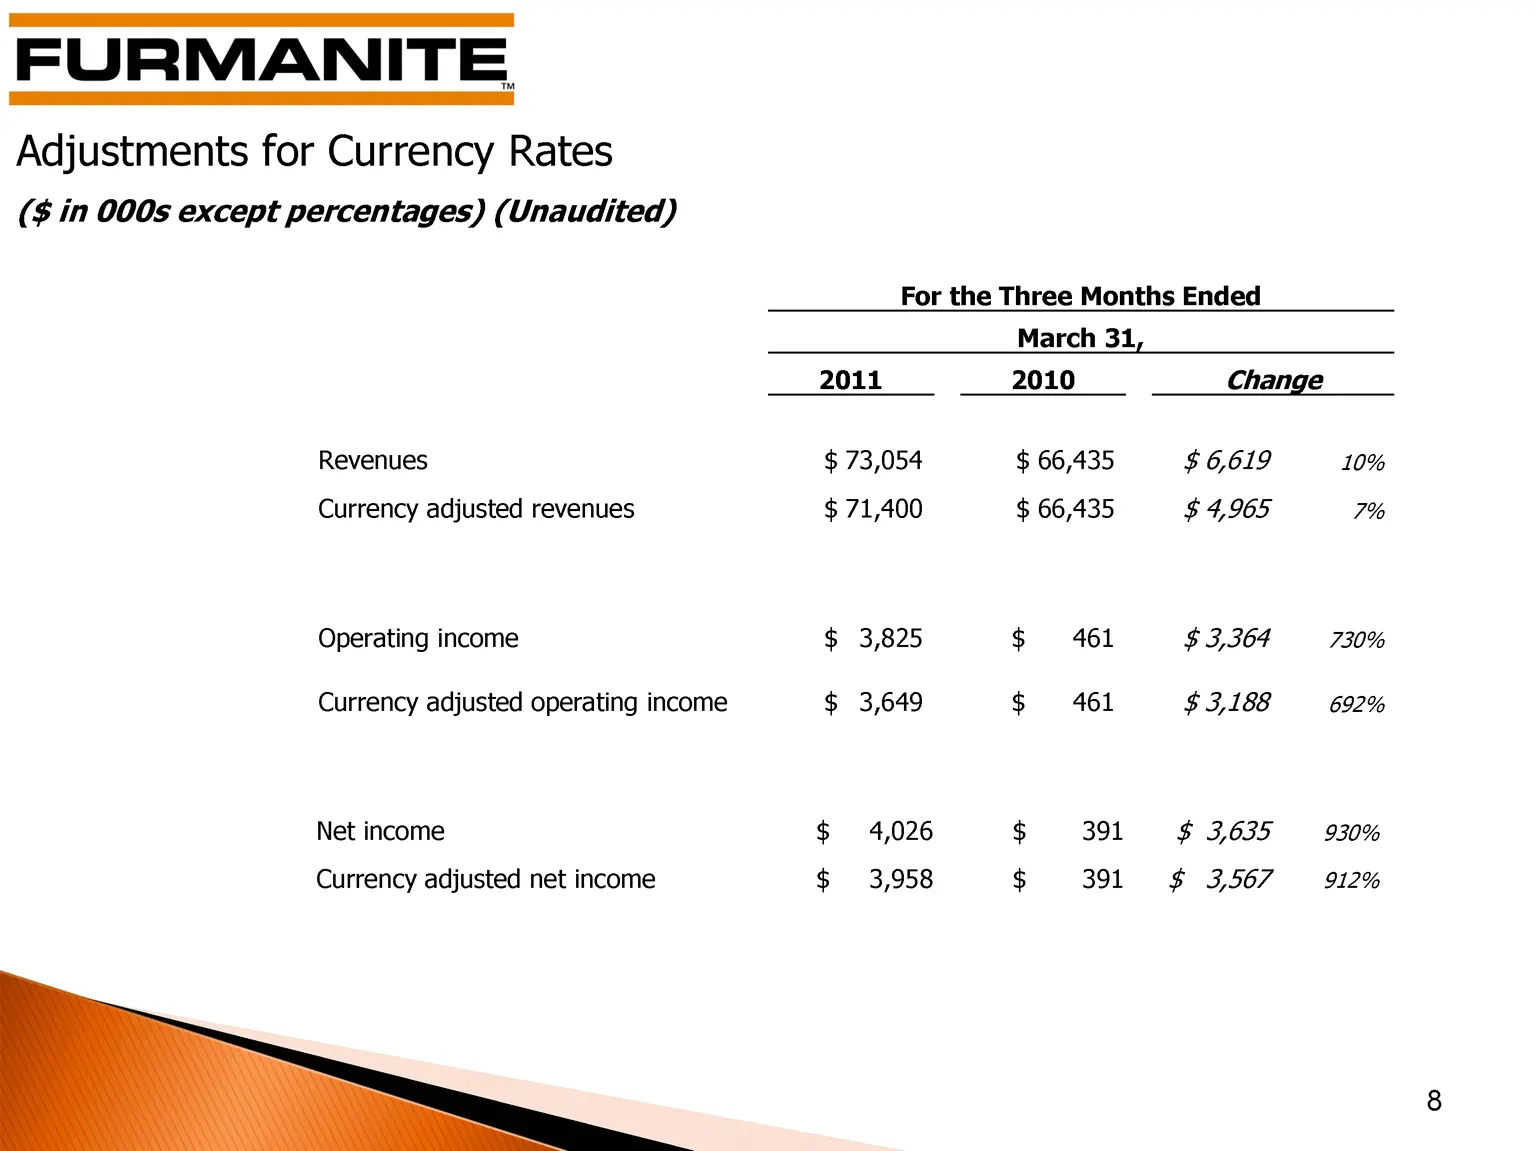
Slide 8: Adjustments for Currency Rates
Adjustments for Currency Rates ($ in 000s except percentages) (Unaudited) 8 For the Three Months Ended For the Three Months Ended For the Three Months Ended For the Three Months Ended For the Three Months Ended For the Three Months Ended For the Three Months Ended March 31, March 31, March 31, March
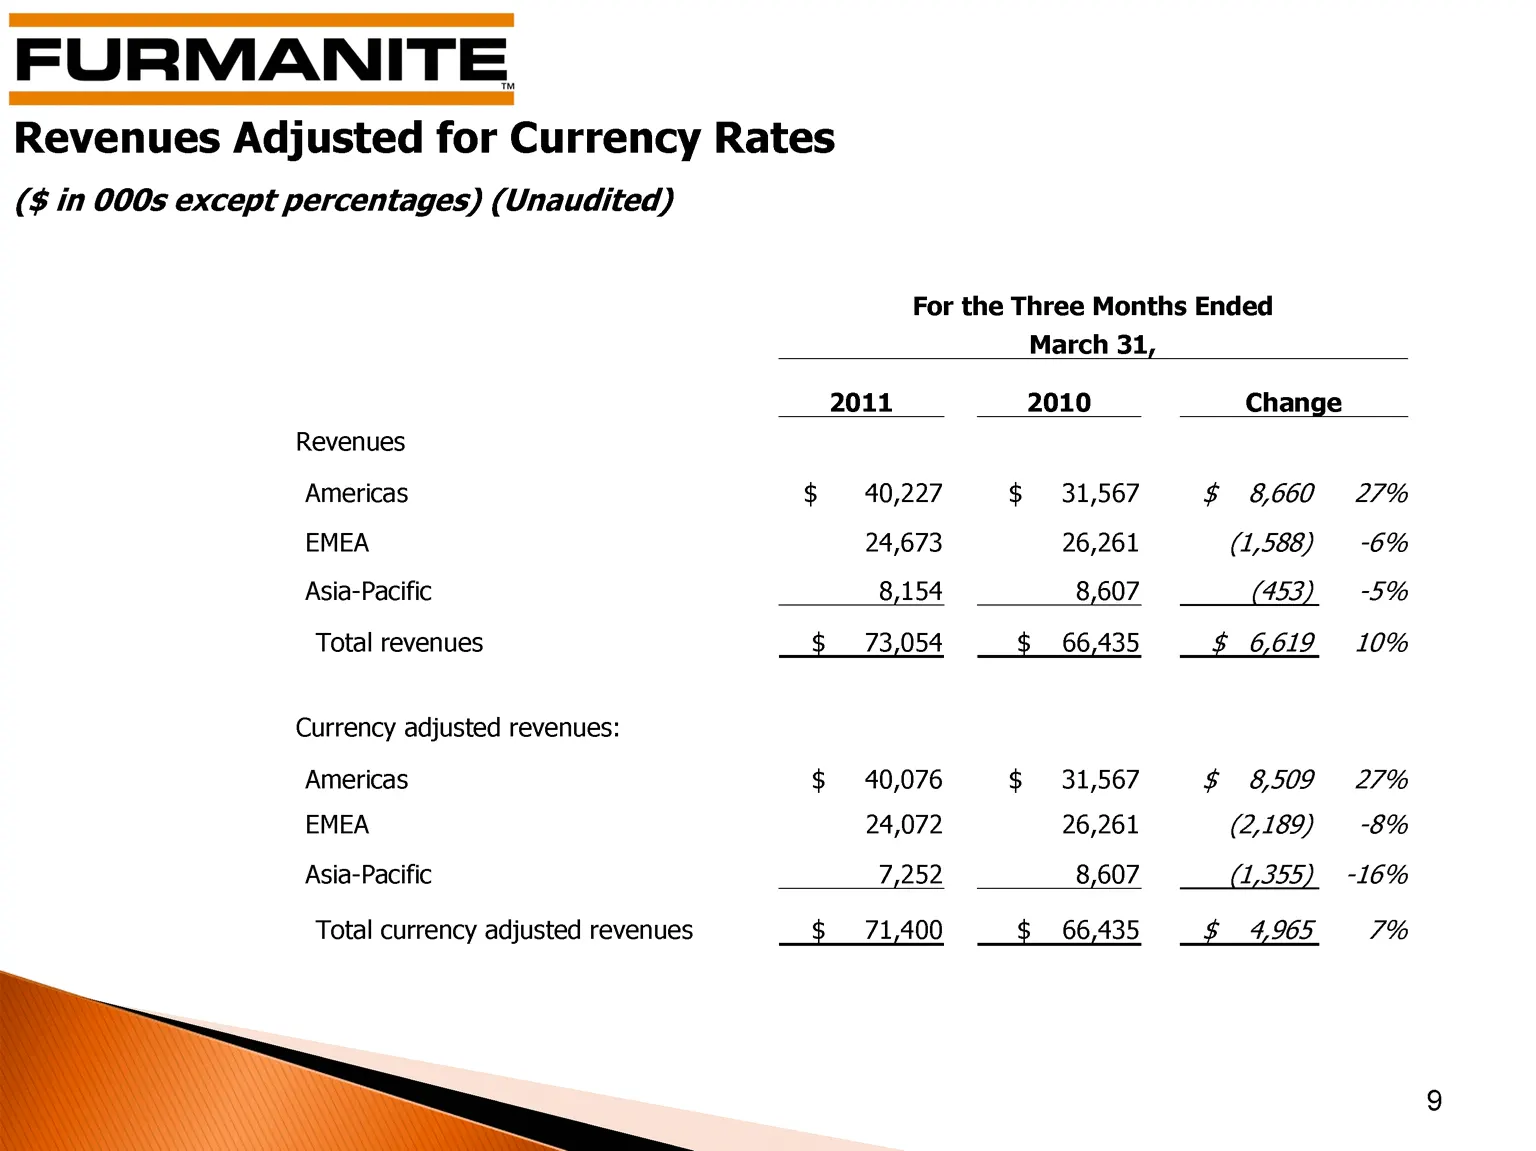
Slide 9: Revenues Adjusted for Currency Rates
Revenues Adjusted for Currency Rates ($ in 000s except percentages) (Unaudited) 9 For the Three Months Ended For the Three Months Ended For the Three Months Ended For the Three Months Ended For the Three Months Ended For the Three Months Ended For the Three Months Ended March 31, March 31, March 31,
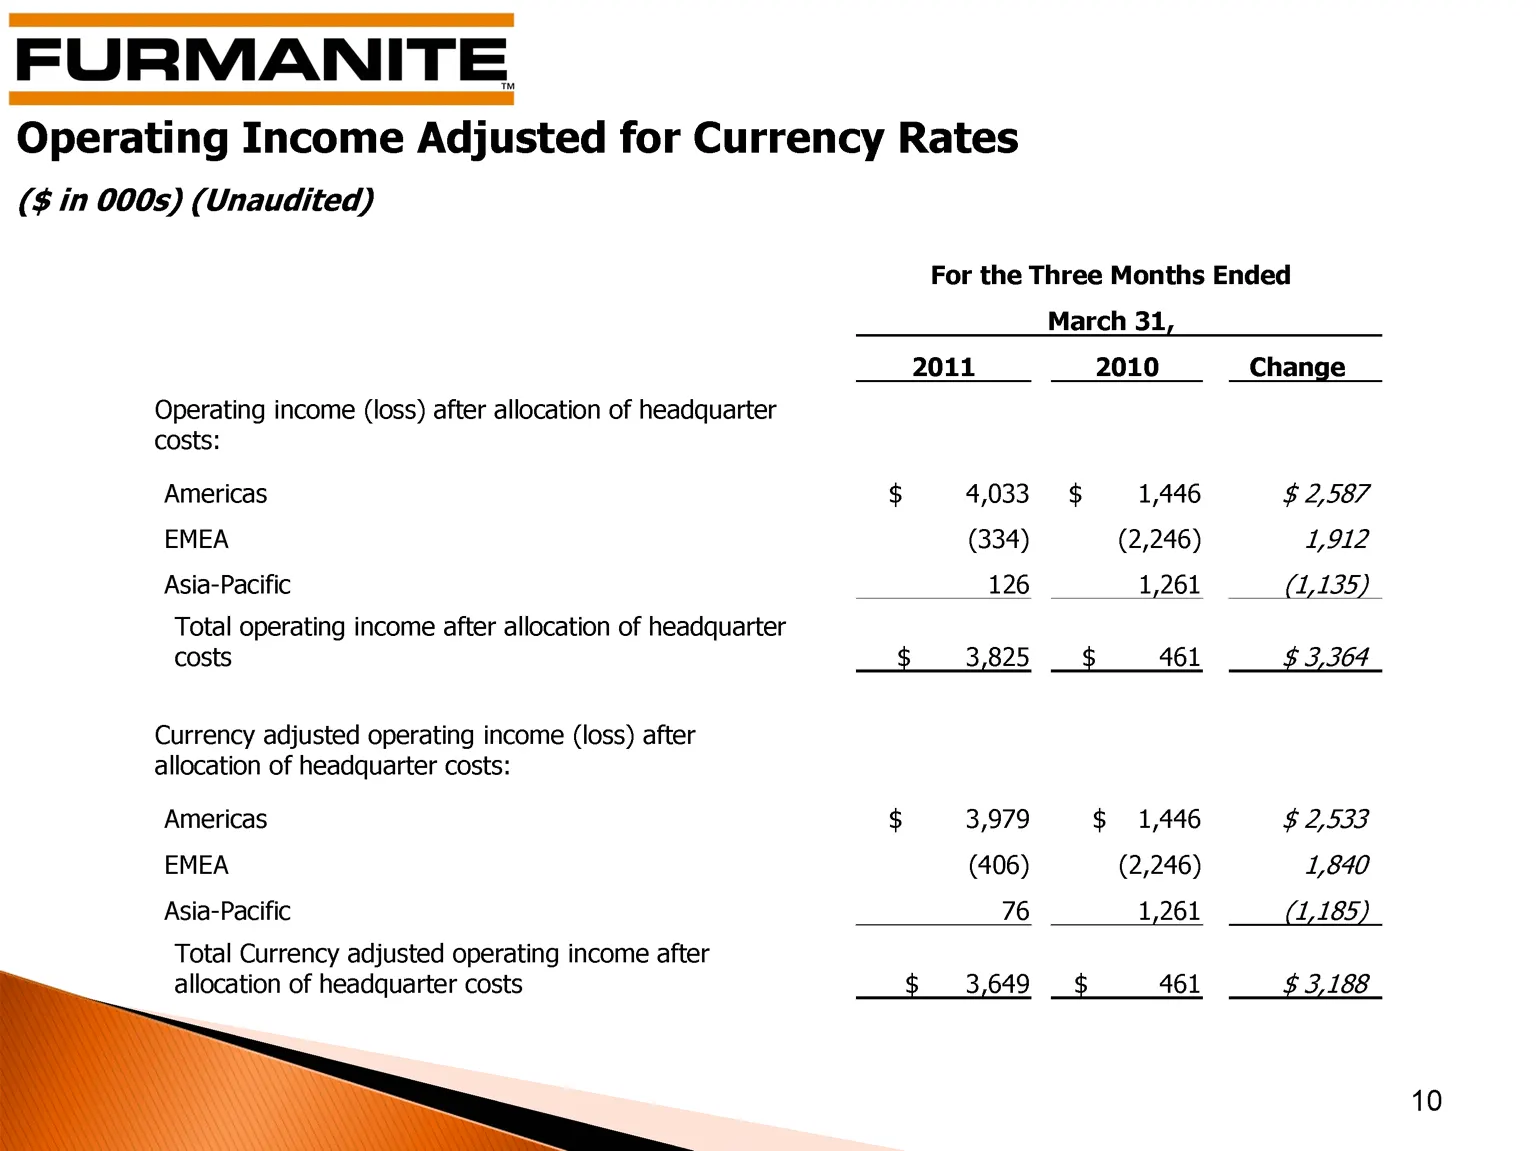
Slide 10: Operating Income Adjusted for Currency Rates
Operating Income Adjusted for Currency Rates ($ in 000s) (Unaudited) 10 For the Three Months Ended For the Three Months Ended For the Three Months Ended For the Three Months Ended For the Three Months Ended March 31, March 31, March 31, March 31, March 31, 2011 2010 Change Operating income (loss) af
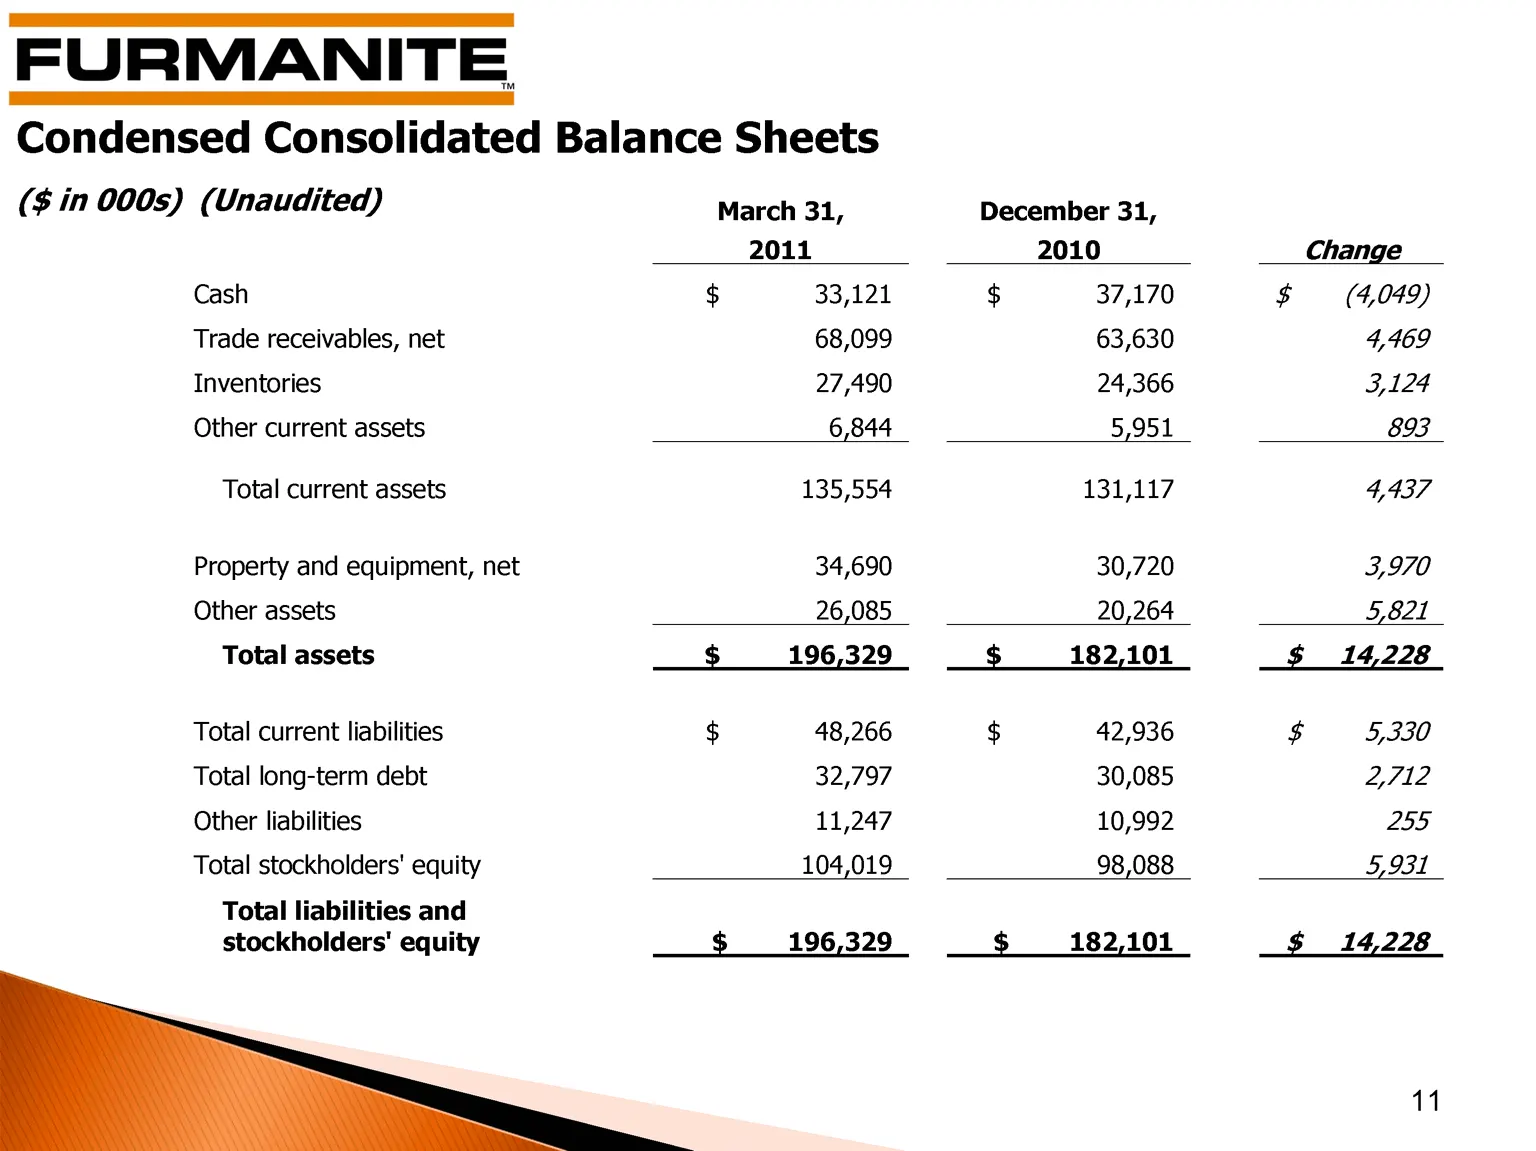
Slide 11: Condensed Consolidated Balance Sheets
Condensed Consolidated Balance Sheets ($ in 000s) (Unaudited) 11 March 31, December 31, 2011 2010 Change Cash $ 33,121 $ 37,170 $ (4,049) Trade receivables, net 68,099 63,630 4,469 Inventories 27,490 24,366 3,124 Other current assets 6,844 5,951 893 Total current assets 135,554 131,117 4,437 Propert
Slide 12: Condensed Consolidated Cash Flows
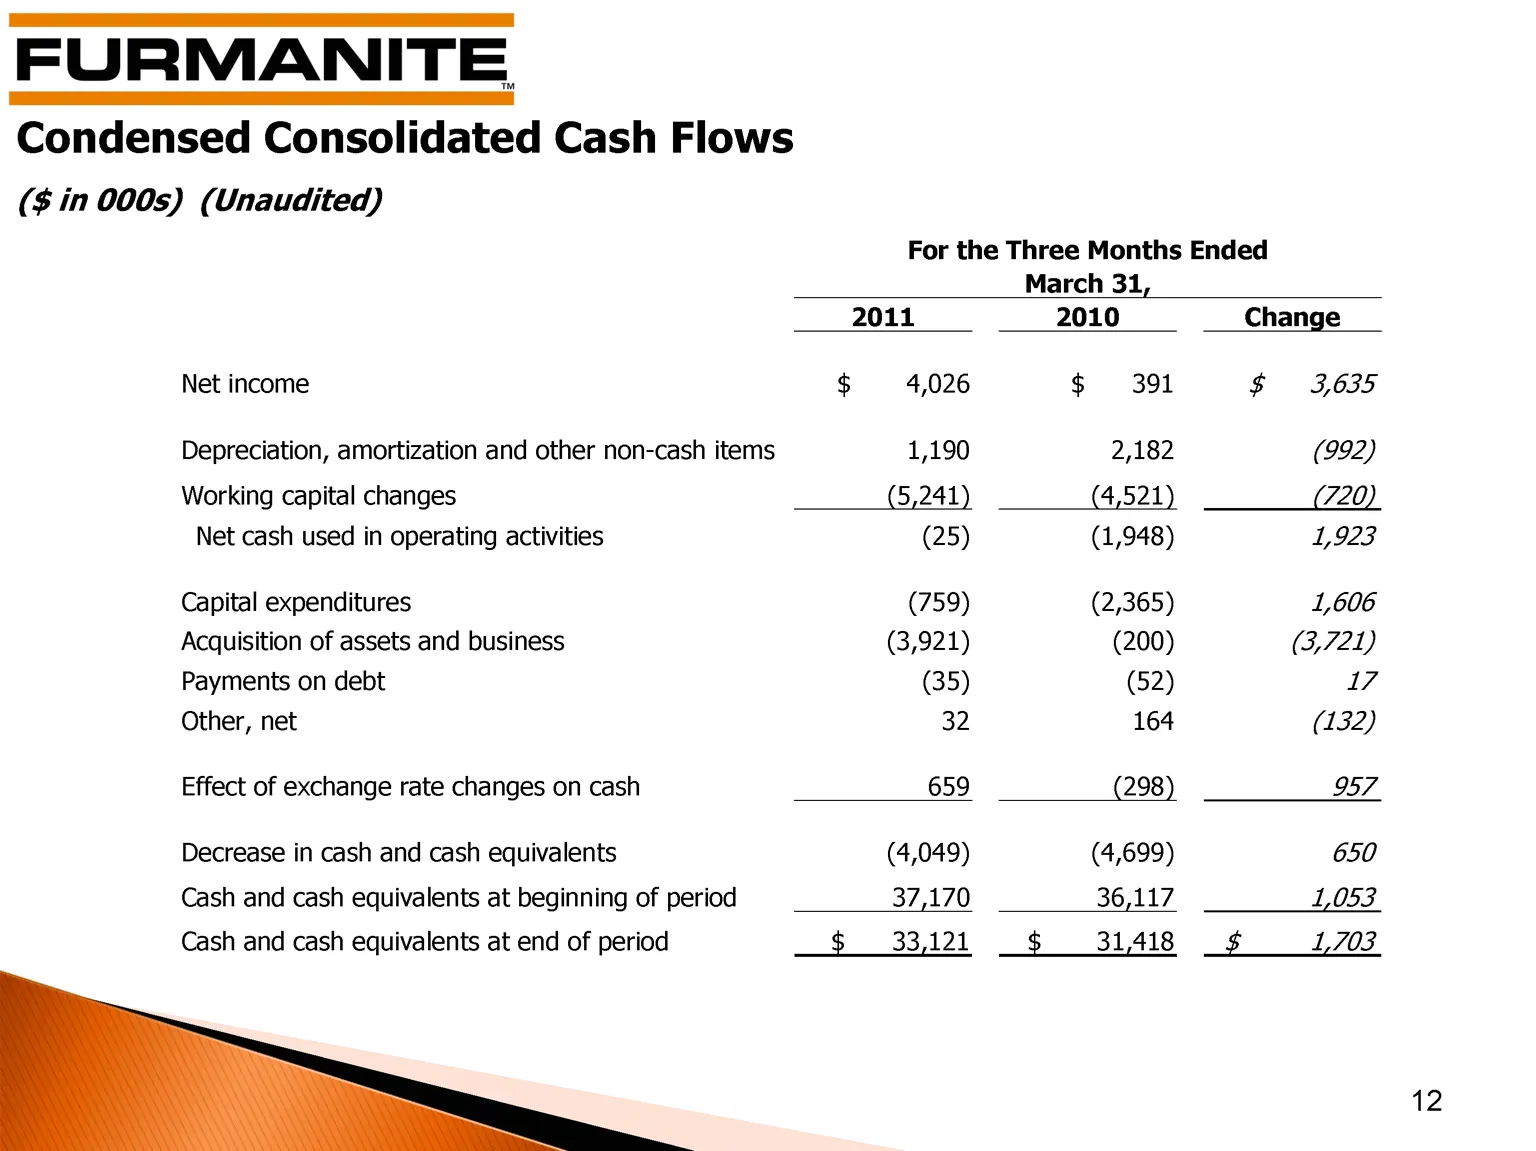
Condensed Consolidated Cash Flows ($ in 000s) (Unaudited) 12 For the Three Months Ended For the Three Months Ended For the Three Months Ended For the Three Months Ended For the Three Months Ended March 31, March 31, March 31, March 31, March 31, 2011 2010 Change Net income $ 4,026 $ 391 $ 3,635 Depr
Slide 13: Q1 2011 Operations Review
Furmanite Corporation Q1 2011 Operations Review Joseph E. Milliron, President and Chief Operating Officer 13
Slide 14: Global Service Network
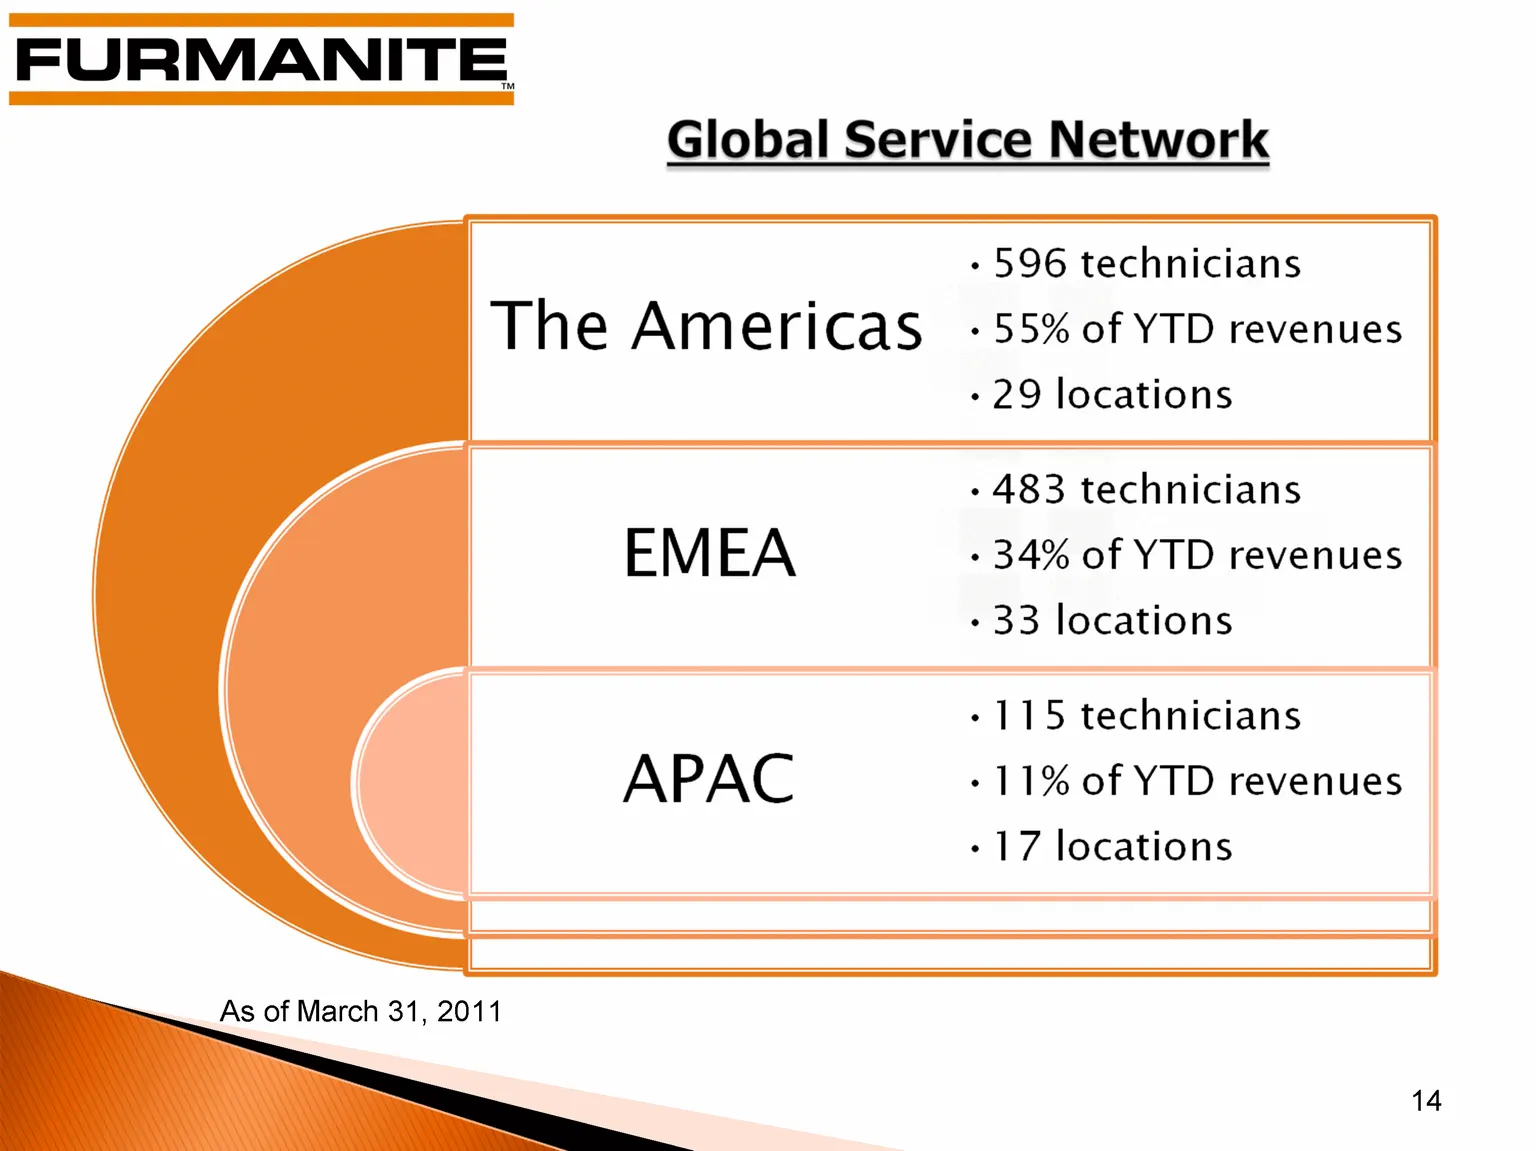
FURMANITE Global Service Network - 596 technicians The Americas -55% of YTD revenues - 29 locations «483 technicians EM EA - 34% of YTD revenues - 33 locations +115 technicians | APAC -11% of YTD revenues | \ - 17 locations | As of March 31, 2011
Slide 15: Business and Geographic Data - On-line Services Revenues
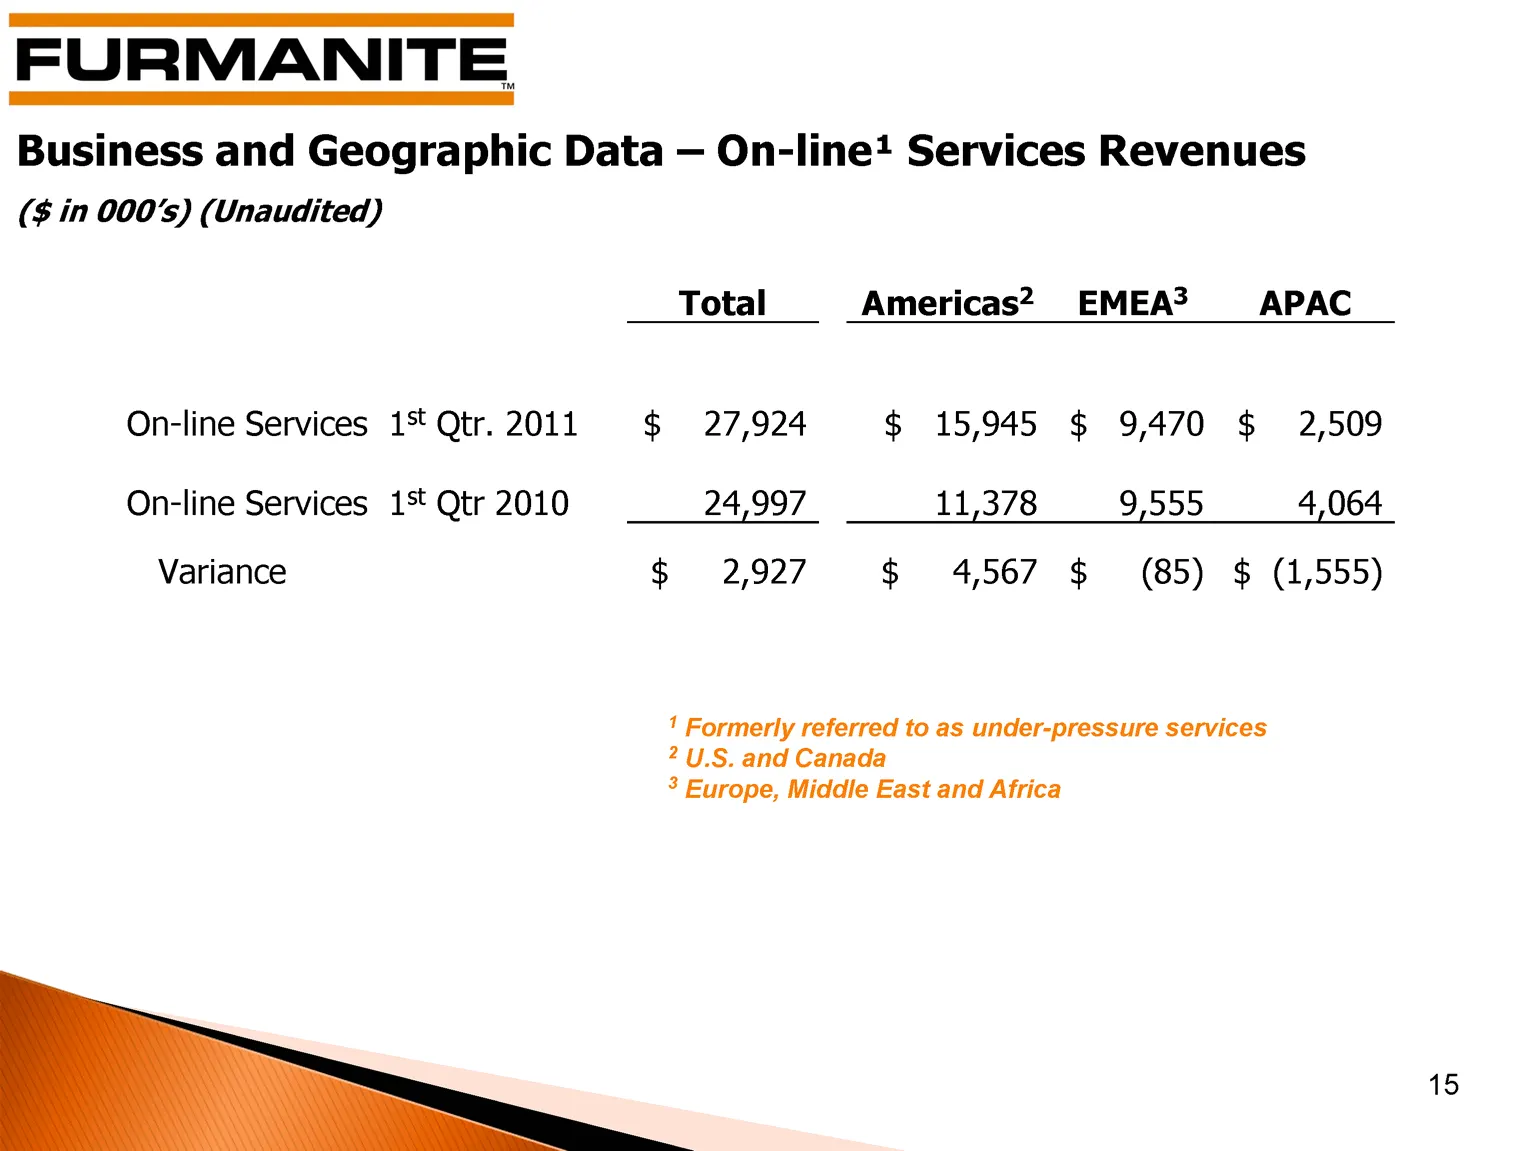
15 Total Americas2 EMEA3 APAC On-line Services 1st Qtr. 2011 $ 27,924 $ 15,945 $ 9,470 $ 2,509 On-line Services 1st Qtr 2010 24,997 11,378 9,555 4,064 Variance $ 2,927 $ 4,567 $ (85) $ (1,555) Business and Geographic Data - On-line1 Services Revenues ($ in 000's) (Unaudited) 1 Formerly referred to a
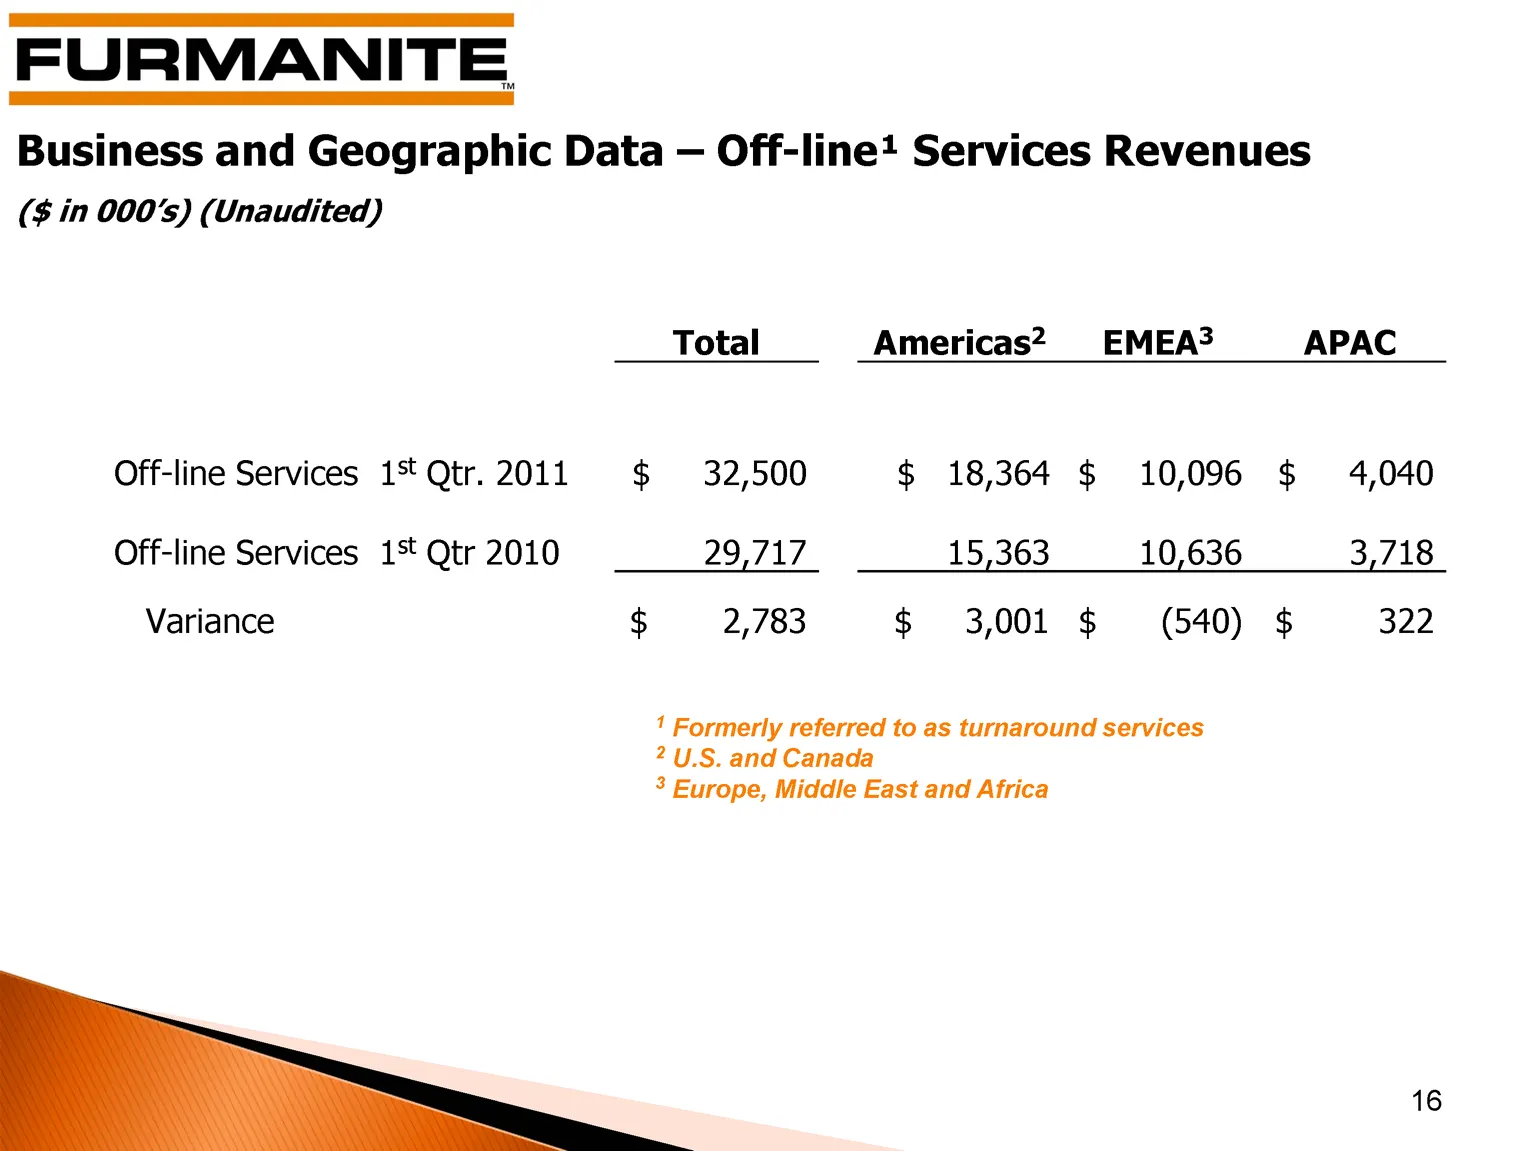
Slide 16: Business and Geographic Data - Off-line Services Revenues
Business and Geographic Data - Off-line1 Services Revenues ($ in 000's) (Unaudited) 16 1 Formerly referred to as turnaround services 2 U.S. and Canada 3 Europe, Middle East and Africa Total Americas2 EMEA3 APAC Off-line Services 1st Qtr. 2011 $ 32,500 $ 18,364 $ 10,096 $ 4,040 Off-line Services 1st

Slide 17: Review of 1Q 2011
Furmanite Corporation Review of 1Q 2011 May 10, 2011 www.furmanite.com 17
Source: SEC EDGAR · 8-K filed May 10, 2011
More decks from Furmanite Corp
 Merger or Acquisition (November 2015)13 slides · Nov 2, 2015
 Q2 2015 Earnings Presentation19 slides · Aug 4, 2015
 Q1 2015 Earnings Presentation16 slides · May 11, 2015
 Proxy Contest (April 2015)40 slides · Apr 2, 2015
 Proxy Contest (April 2015)29 slides · Apr 2, 2015
 Proxy Contest (March 2015)39 slides · Mar 30, 2015