SITE Centers Corp. · NYSE:SITC
SITE Centers — Inland Retail Real Estate Trust — Merger or Acquisition (October 2006)
30 slides from SITE Centers's merger presentation, Oct 23, 2006
Slide 1: Developers Diversified / Inland Retail Real Estate Trust Acquisition Overview
Developers Diversified / Inland Retail Real Estate Trust, Inc. Acquisition Overview October 23, 2006
Slide 2: Safe Harbor Statement
Safe Harbor Statement Developers Diversified considers portions of this information to be "forward-looking" within the meaning of Section 27A of the Securities Act of 1933 and Section 21E of the Securities Exchange Act of 1934. All statements other than statements of historical facts included in thi
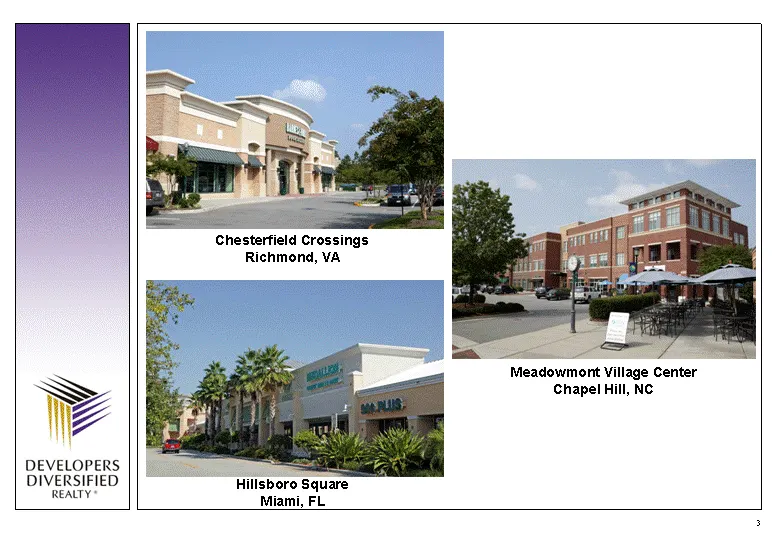
Slide 3: Chesterfield Crossings, Hillsboro Square, Meadowmont Village Center
Chesterfield Crossings Richmond, VA Hillsboro Square Miami, FL Meadowmont Village Center Chapel Hill, NC
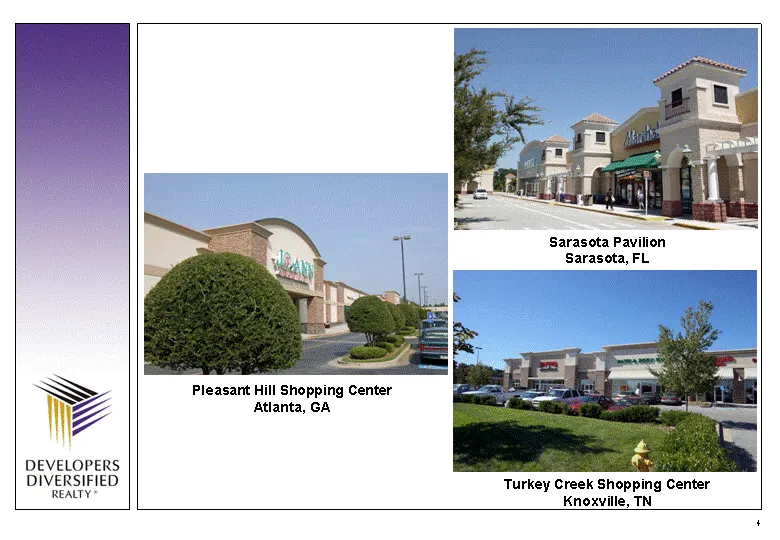
Slide 4: Sarasota Pavilion, Turkey Creek, Pleasant Hill
Sarasota Pavilion Sarasota, FL Turkey Creek Shopping Center Knoxville, TN Pleasant Hill Shopping Center Atlanta, GA
Slide 5: Transaction Overview: Key Transaction Terms
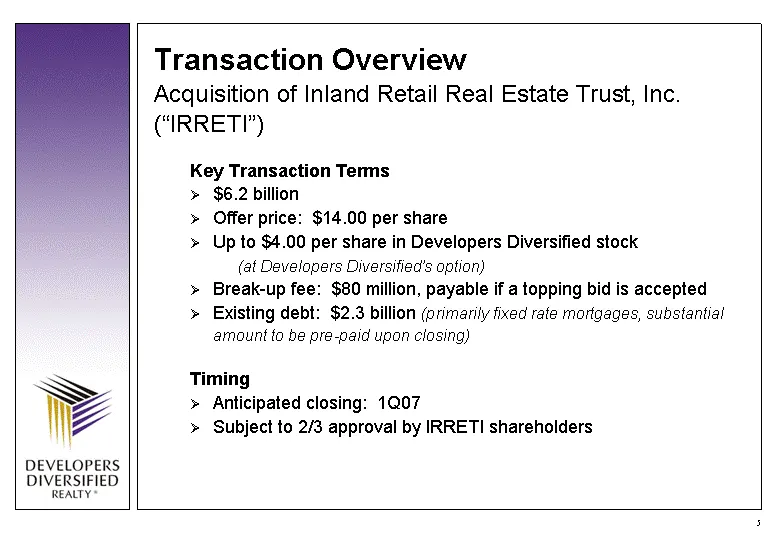
Transaction Overview Acquisition of Inland Retail Real Estate Trust, Inc. ("IRRETI") Key Transaction Terms $6.2 billion Offer price: $14.00 per share Up to $4.00 per share in Developers Diversified stock (at Developers Diversified's option) Break-up fee: $80 million, payable if a topping bid is acce
Slide 6: Acquisition Highlights
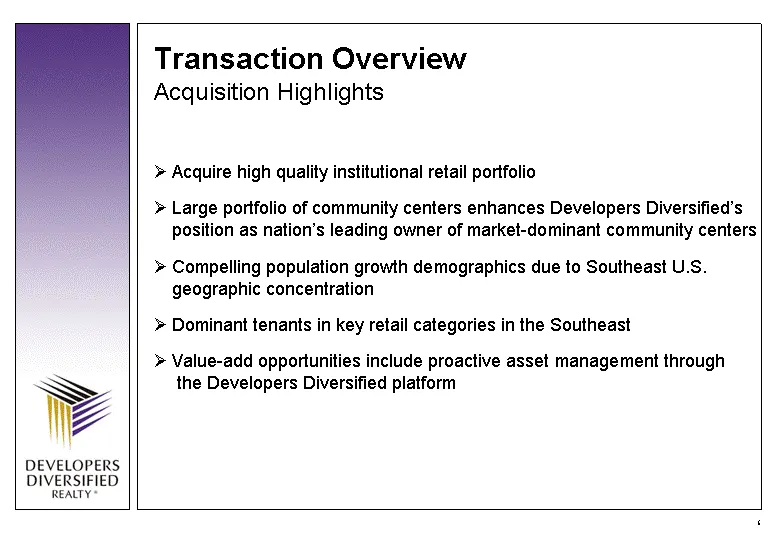
Acquire high quality institutional retail portfolio Large portfolio of community centers enhances Developers Diversified's position as nation's leading owner of market-dominant community centers Compelling population growth demographics due to Southeast U.S. geographic concentration Dominant tenants
Slide 7: Institutional Joint Venture
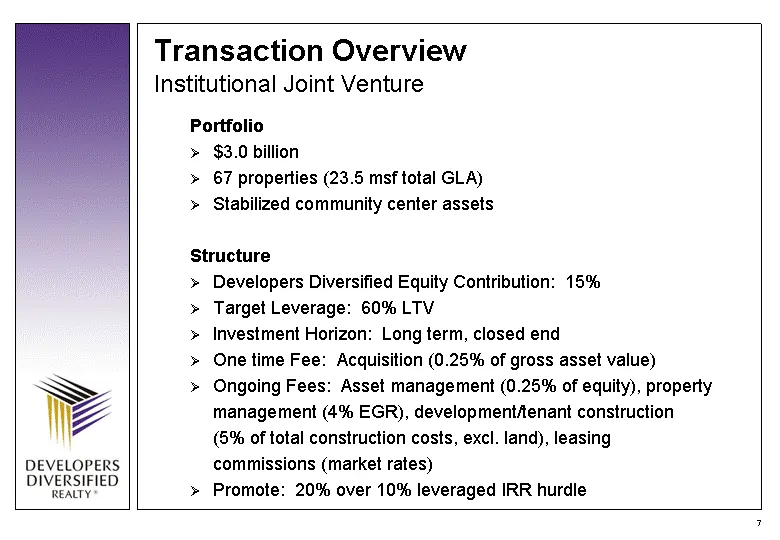
Portfolio $3.0 billion 67 properties (23.5 msf total GLA) Stabilized community center assets Structure Developers Diversified Equity Contribution: 15% Target Leverage: 60% LTV Investment Horizon: Long term, closed end One time Fee: Acquisition (0.25% of gross asset value) Ongoing Fees: Asset managem
Slide 8: Sources and Uses
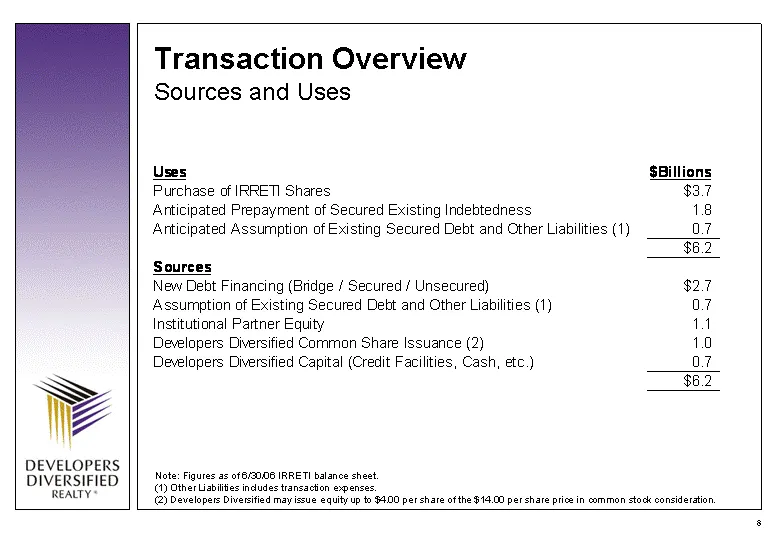
Transaction Overview Sources and Uses Note: Figures as of 6/30/06 IRRETI balance sheet. (1) Other Liabilities includes transaction expenses. (2) Developers Diversified may issue equity up to $4.00 per share of the $14.00 per share price in common stock consideration.
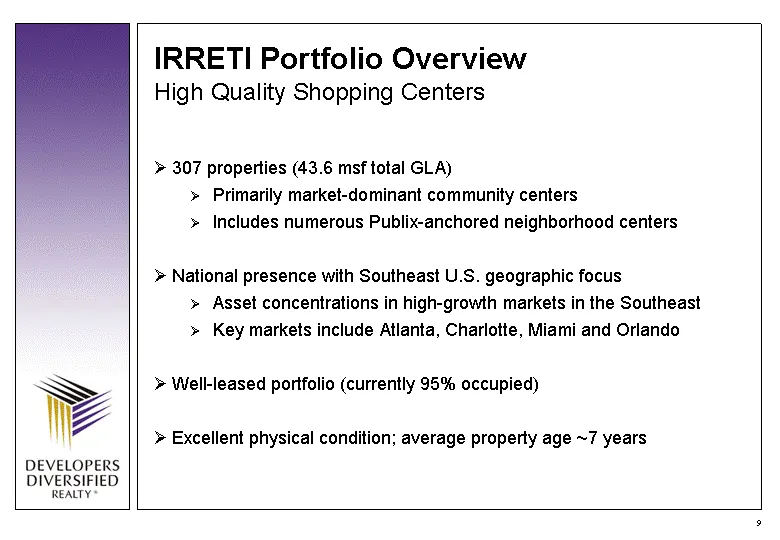
Slide 9: IRRETI Portfolio Overview: High Quality Shopping Centers
307 properties (43.6 msf total GLA) Primarily market-dominant community centers Includes numerous Publix-anchored neighborhood centers National presence with Southeast U.S. geographic focus Asset concentrations in high-growth markets in the Southeast Key markets include Atlanta, Charlotte, Miami and
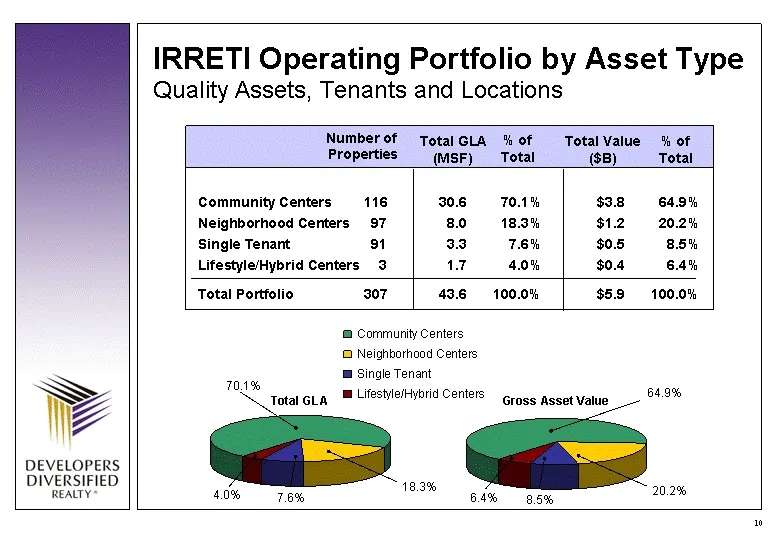
Slide 10: IRRETI Operating Portfolio by Asset Type
IRRETI Operating Portfolio by Asset Type Quality Assets, Tenants and Locations Community Centers 116 30.6 70.1% $3.8 64.9% Neighborhood Centers 97 8.0 18.3% $1.2 20.2% Single Tenant 91 3.3 7.6% $0.5 8.5% Lifestyle/Hybrid Centers 3 1.7 4.0% $0.4 6.4% Total Portfolio 307 43.6 100.0% $5.9 100.0% Total
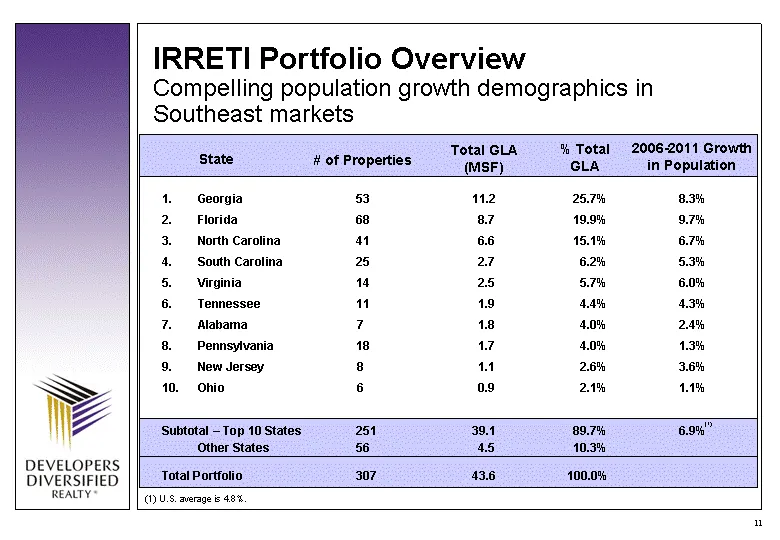
Slide 11: IRRETI Portfolio: Population Growth in Southeast Markets
IRRETI Portfolio Overview Compelling population growth demographics in Southeast markets Georgia 53 11.2 25.7% 8.3% Florida 68 8.7 19.9% 9.7% North Carolina 41 6.6 15.1% 6.7% South Carolina 25 2.7 6.2% 5.3% Virginia 14 2.5 5.7% 6.0% Tennessee 11 1.9 4.4% 4.3% Alabama 7 1.8 4.0% 2.4% Pennsylvania 18
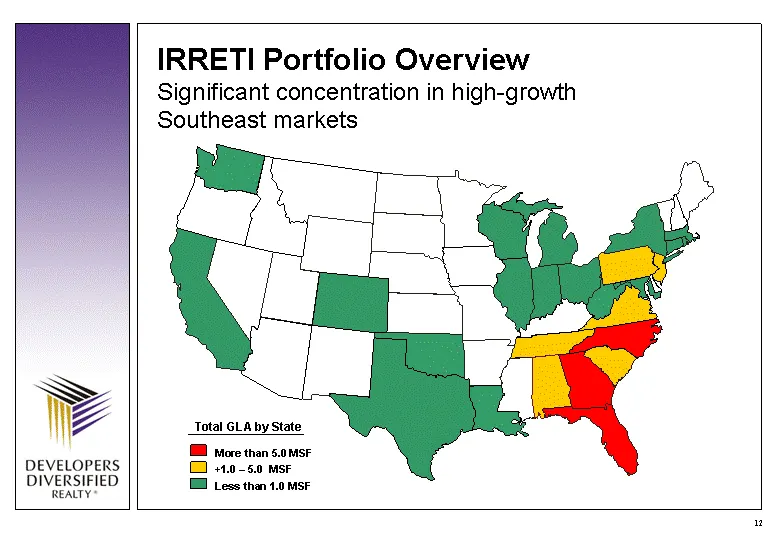
Slide 12: Significant Concentration in High-Growth Southeast Markets
IRRETI Portfolio Overview Significant concentration in high-growth Southeast markets Total GLA by State More than 5.0 MSF +1.0 - 5.0 MSF Less than 1.0 MSF
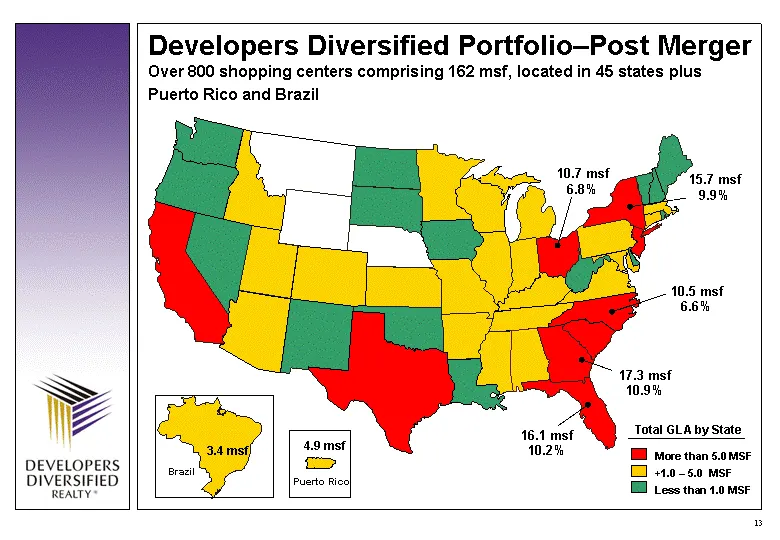
Slide 13: Developers Diversified Portfolio - Post Merger
Developers Diversified Portfolio-Post Merger Over 800 shopping centers comprising 162 msf, located in 45 states plus Puerto Rico and Brazil Puerto Rico 15.7 msf 9.9% 10.7 msf 6.8% 17.3 msf 10.9% 16.1 msf 10.2% 10.5 msf 6.6% 4.9 msf Total GLA by State More than 5.0 MSF +1.0 - 5.0 MSF Less than 1.0 MS
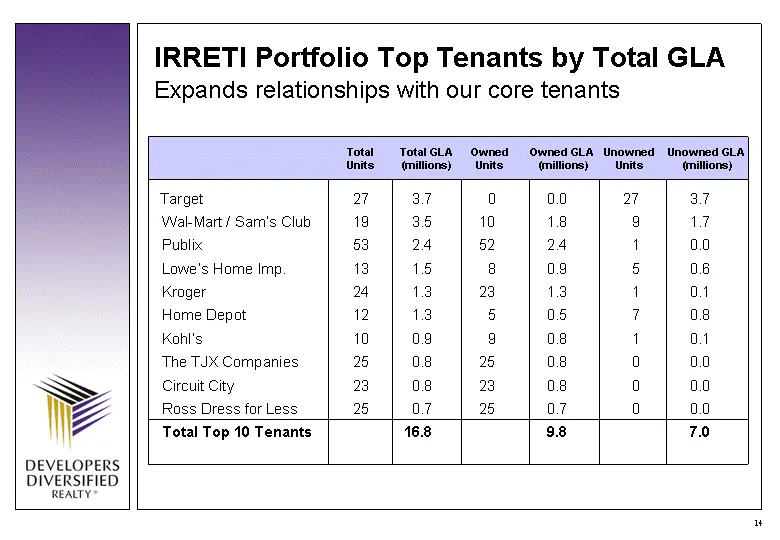
Slide 14: IRRETI Portfolio Top Tenants by Total GLA
IRRETI Portfolio Top Tenants by Total GLA Target 27 3.7 0 0.0 27 3.7 Wal-Mart / Sam's Club 19 3.5 10 1.8 9 1.7 Publix 53 2.4 52 2.4 1 0.0 Lowe's Home Imp. 13 1.5 8 0.9 5 0.6 Kroger 24 1.3 23 1.3 1 0.1 Home Depot 12 1.3 5 0.5 7 0.8 Kohl's 10 0.9 9 0.8 1 0.1 The TJX Companies 25 0.8 25 0.8 0 0.0 Circu
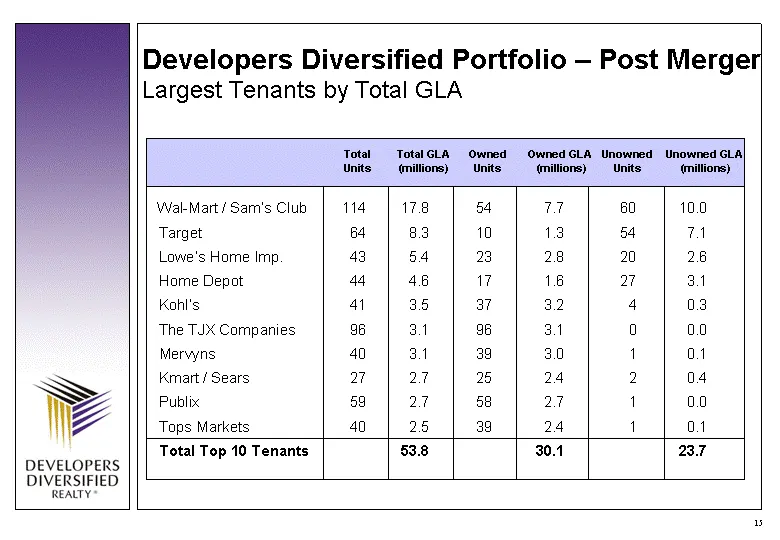
Slide 15: Post Merger Largest Tenants by Total GLA
Wal-Mart / Sam's Club 114 17.8 54 7.7 60 10.0 Target 64 8.3 10 1.3 54 7.1 Lowe's Home Imp. 43 5.4 23 2.8 20 2.6 Home Depot 44 4.6 17 1.6 27 3.1 Kohl's 41 3.5 37 3.2 4 0.3 The TJX Companies 96 3.1 96 3.1 0 0.0 Mervyns 40 3.1 39 3.0 1 0.1 Kmart / Sears 27 2.7 25 2.4 2 0.4 Publix 59 2.7 58 2.7 1 0.0 To
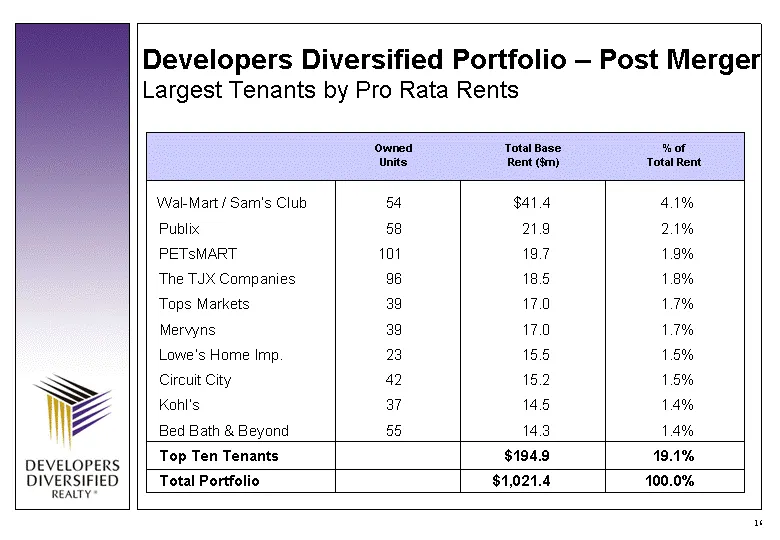
Slide 16: Post Merger Largest Tenants by Pro Rata Rents
Developers Diversified Portfolio - Post Merger Largest Tenants by Pro Rata Rents Wal-Mart / Sam's Club 54 $41.4 4.1% Publix 58 21.9 2.1% PETsMART 101 19.7 1.9% The TJX Companies 96 18.5 1.8% Tops Markets 39 17.0 1.7% Mervyns 39 17.0 1.7% Lowe's Home Imp. 23 15.5 1.5% Circuit City 42 15.2 1.5% Kohl's
Slide 17: IRRETI Portfolio - Lease Expiration Schedule
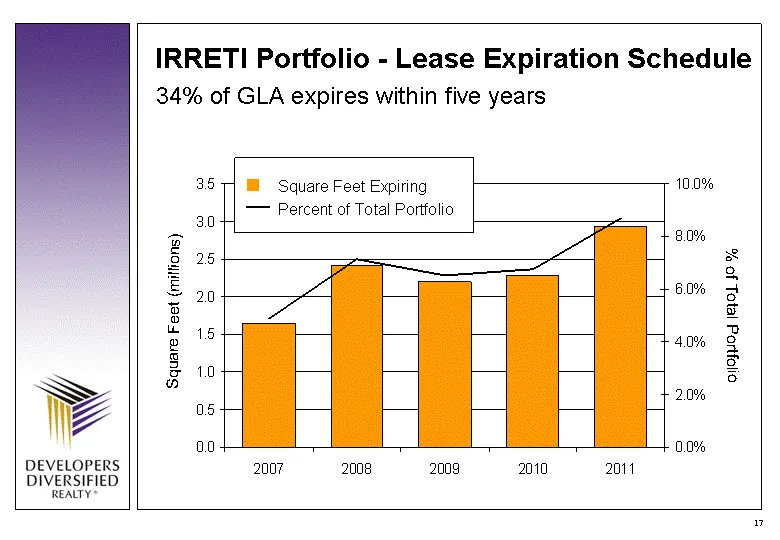
2007 2008 2009 2010 2011 SF Expiring 1.65 2.42 2.2 2.28 2.93 % of Total Portfolio 0.0489 0.0712 0.0652 0.0676 0.0868 North 45.9 46.9 45 43.9 IRRETI Portfolio - Lease Expiration Schedule Square Feet (millions) % of Total Portfolio Square Feet Expiring Percent of Total Portfolio 34% of GLA expires wit
Slide 18: Additional Opportunities to Create Value
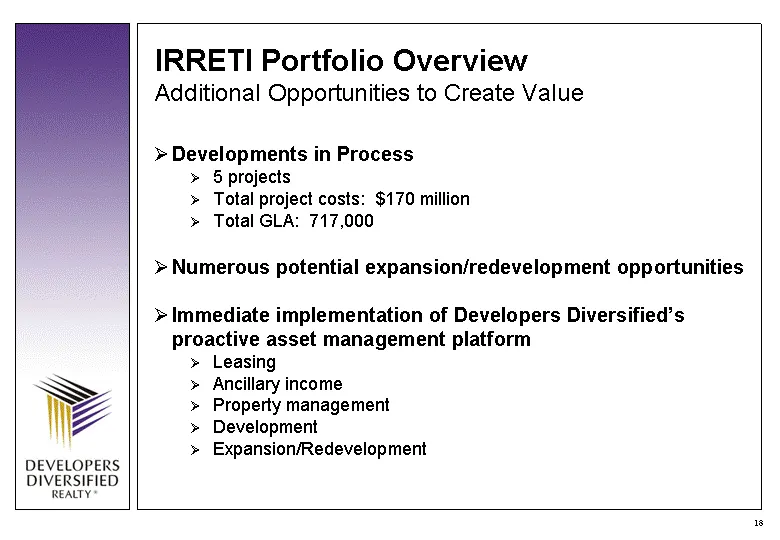
IRRETI Portfolio Overview Additional Opportunities to Create Value Developments in Process 5 projects Total project costs: $170 million Total GLA: 717,000 Numerous potential expansion/redevelopment opportunities Immediate implementation of Developers Diversified's proactive asset management platform
Slide 19: Individual Property Highlights
Individual Property Highlights
Slide 20: Developers Diversified Realty
az DEVELOPERS DIVERSIFIED REALTY
Slide 21: Birkdale Village, Charlotte, NC
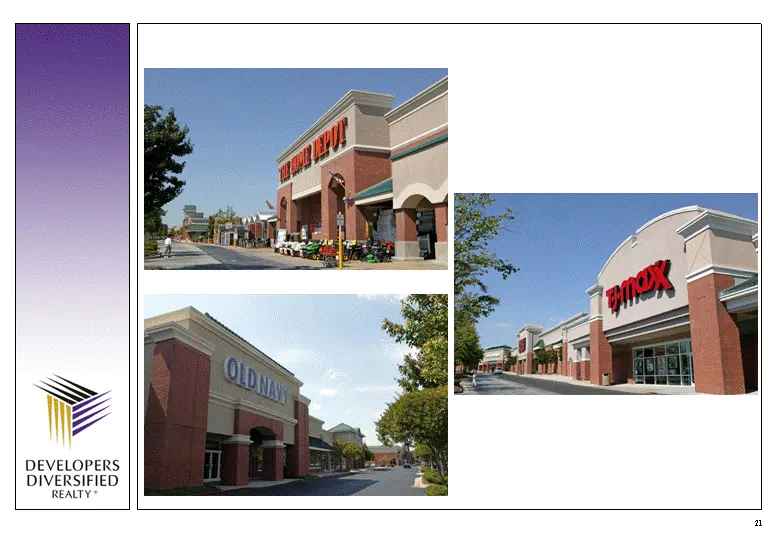
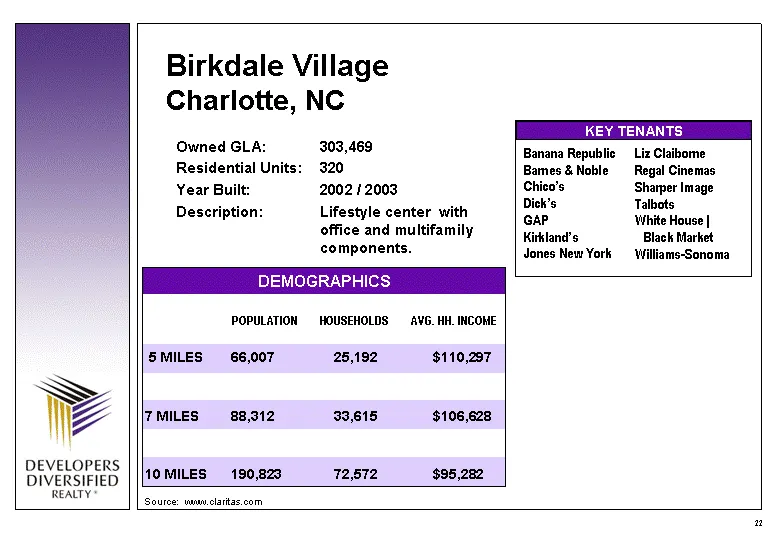
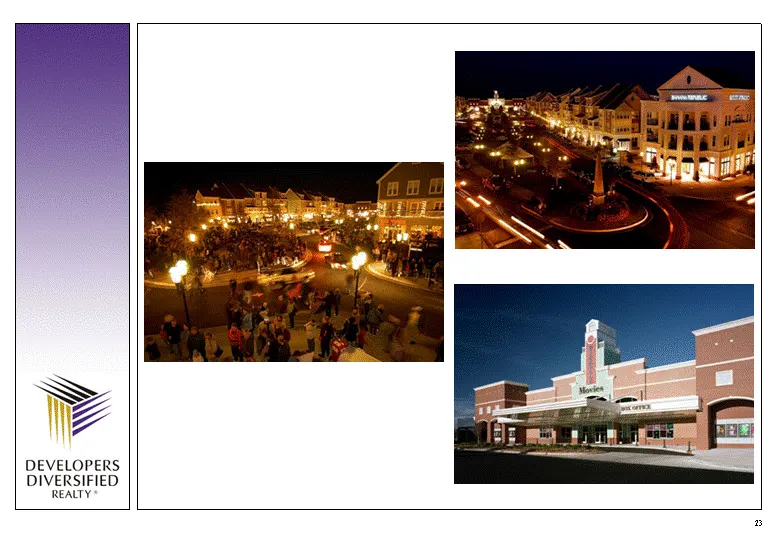
5 MILES 66,007 25,192 $110,297 7 MILES 88,312 33,615 $106,628 10 MILES 190,823 72,572 $95,282 DEMOGRAPHICS POPULATION HOUSEHOLDS AVG. HH. INCOME Owned GLA: 303,469 Residential Units: 320 Year Built: 2002 / 2003 Description: Lifestyle center with office and multifamily components. Birkdale Village Ch
Slide 22: Developers Diversified Realty
DEVELOPERS DIVERSIFIED REALTY
Slide 23: Waterfront Market, Pittsburgh, PA
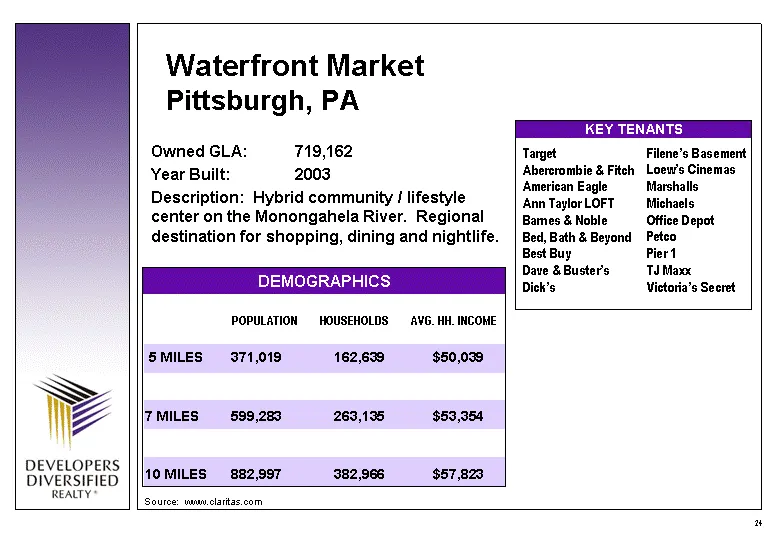
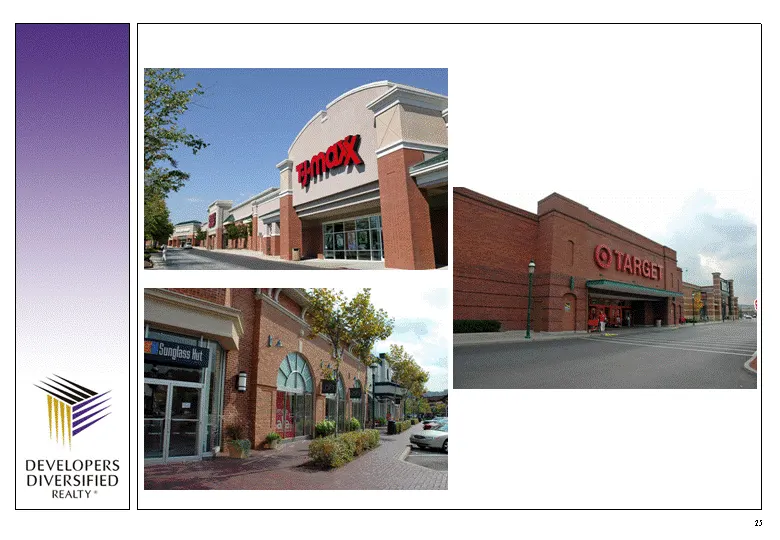
KEY TENANTS 5 MILES 371,019 162,639 $50,039 7 MILES 599,283 263,135 $53,354 10 MILES 882,997 382,966 $57,823 DEMOGRAPHICS POPULATION HOUSEHOLDS AVG. HH. INCOME Owned GLA: 719,162 Year Built: 2003 Description: Hybrid community / lifestyle center on the Monongahela River. Regional destination for shop
Slide 24: Developers Diversified Realty
we DEVELOPERS DIVERSIFIED REALTY
Slide 25: Marketplace at Mill Creek, Atlanta, GA
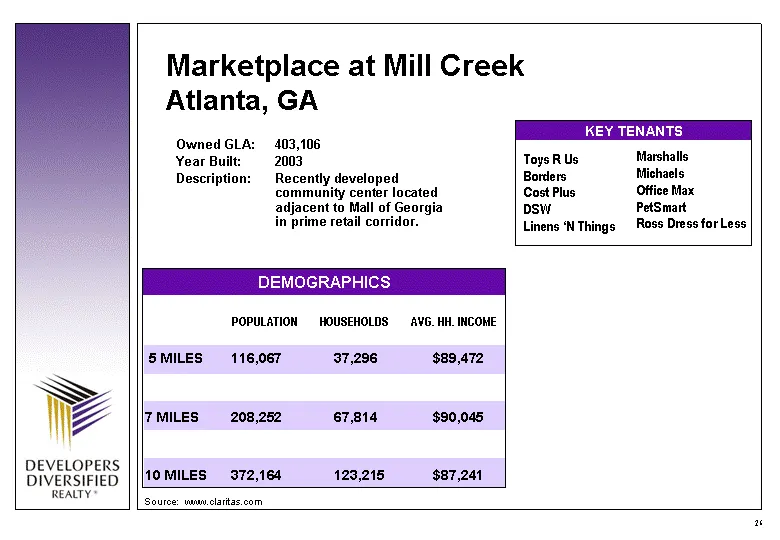
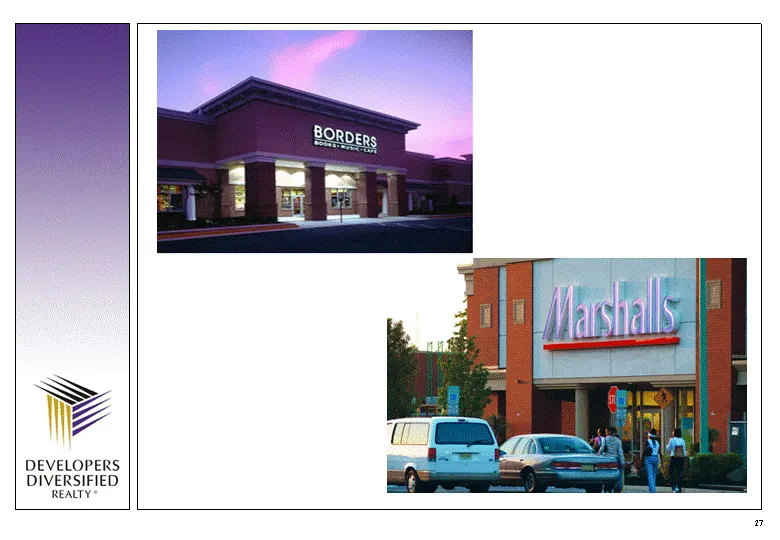
Owned GLA: 403,106 Year Built: 2003 Description: Recently developed community center located adjacent to Mall of Georgia in prime retail corridor. Marketplace at Mill Creek Atlanta, GA KEY TENANTS Toys R Us Borders Cost Plus DSW Linens 'N Things Marshalls Michaels Office Max PetSmart Ross Dress for
Slide 26: Developers Diversified Realty
iz DEVELOPERS DIVERSIFIED REALTY
Slide 27: Sycamore Commons, Charlotte, NC
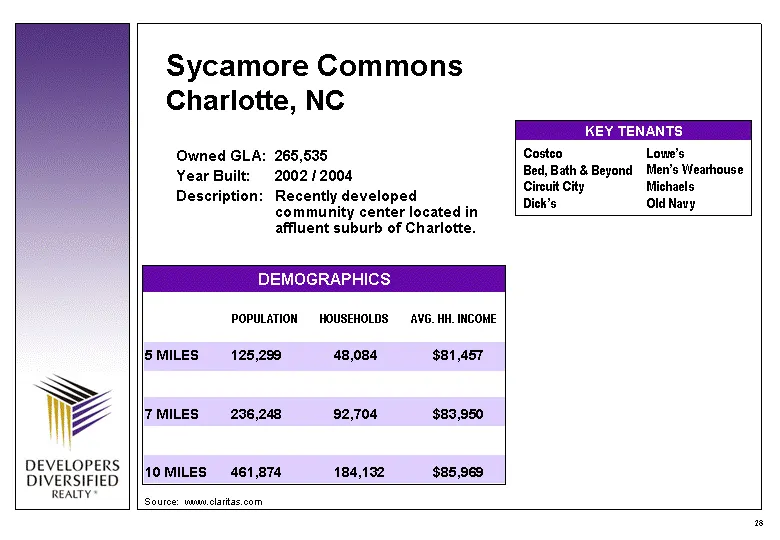
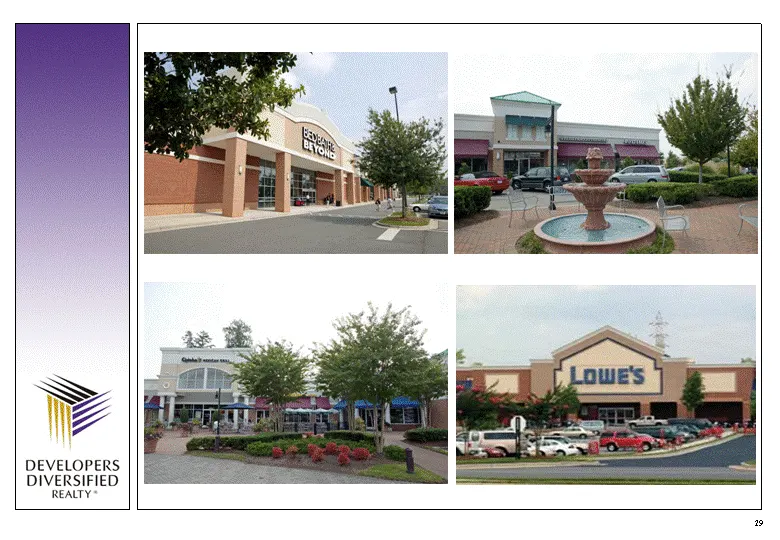
5 MILES 125,299 48,084 $81,457 7 MILES 236,248 92,704 $83,950 10 MILES 461,874 184,132 $85,969 DEMOGRAPHICS POPULATION HOUSEHOLDS AVG. HH. INCOME Owned GLA: 265,535 Year Built: 2002 / 2004 Description: Recently developed community center located in affluent suburb of Charlotte. Sycamore Commons Char
Slide 28: Developers Diversified Realty
we DEVELOPERS DIVERSIFIED REALTY
Slide 29: Additional Information and Where to Find It
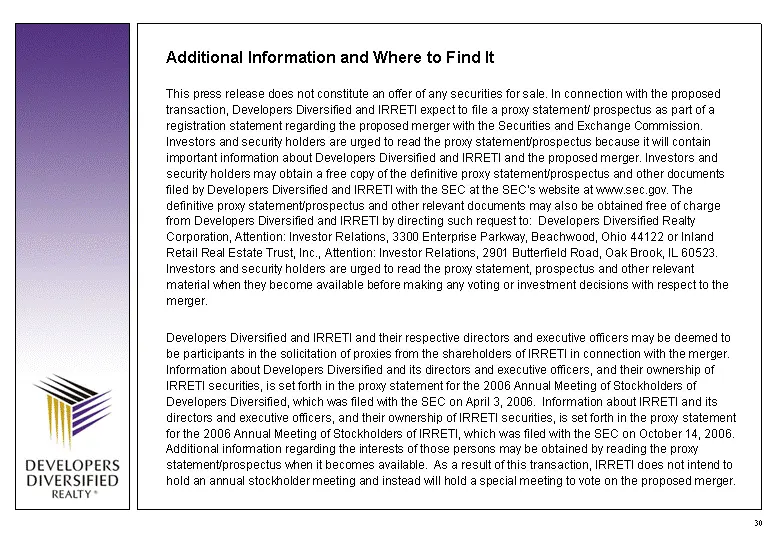
Additional Information and Where to Find It This press release does not constitute an offer of any securities for sale. In connection with the proposed transaction, Developers Diversified and IRRETI expect to file a proxy statement/ prospectus as part of a registration statement regarding the propos

Slide 30: Developers Diversified Realty
DEVELOPERS DIVERSIFIED REALTY
Source: SEC EDGAR · 425 filed Oct 23, 2006
More decks from SITE Centers Corp.
 Merger or Acquisition (September 2024)32 slides · Sep 17, 2024
 Q2 2024 Earnings Presentation39 slides · Jul 30, 2024
 Q1 2024 Earnings Presentation28 slides · Apr 30, 2024
 Citi Global Property CEO Conference 202442 slides · March 2024
 Q4 2023 Earnings Presentation29 slides · Feb 13, 2024
 Merger or Acquisition (November 2023)42 slides · Nov 1, 2023