Western Union Company (the) · NYSE:WU
Western Union Company (the) — The Western Union Company — Q1 2020 Earnings Presentation
29 slides from Western Union Company (the)'s earnings presentation, May 5, 2020

Slide 1: First Quarter 2020 Earnings Webcast and Conference Call
First Quarter 2020 Earnings Webcast and Conference Call May 5, 2020 1

Slide 2: Brendan Metrano, Vice President of Investor Relations
Brendan Metrano Vice President of Investor Relations 2
Slide 3: Safe Harbor
Safe Harbor This presentation contains certain statements that are forward-looking within the meaning of the Private Securities Litigation Reform Act of 1995. These statements are not guarantees of future performance and involve certain risks, uncertainties, and assumptions that are difficult to pre

Slide 4: Hikmet Ersek, Chief Executive Officer
Hikmet Ersek Chief Executive Officer 4
Slide 5: Facing the Global Challenge from a Position of Strength
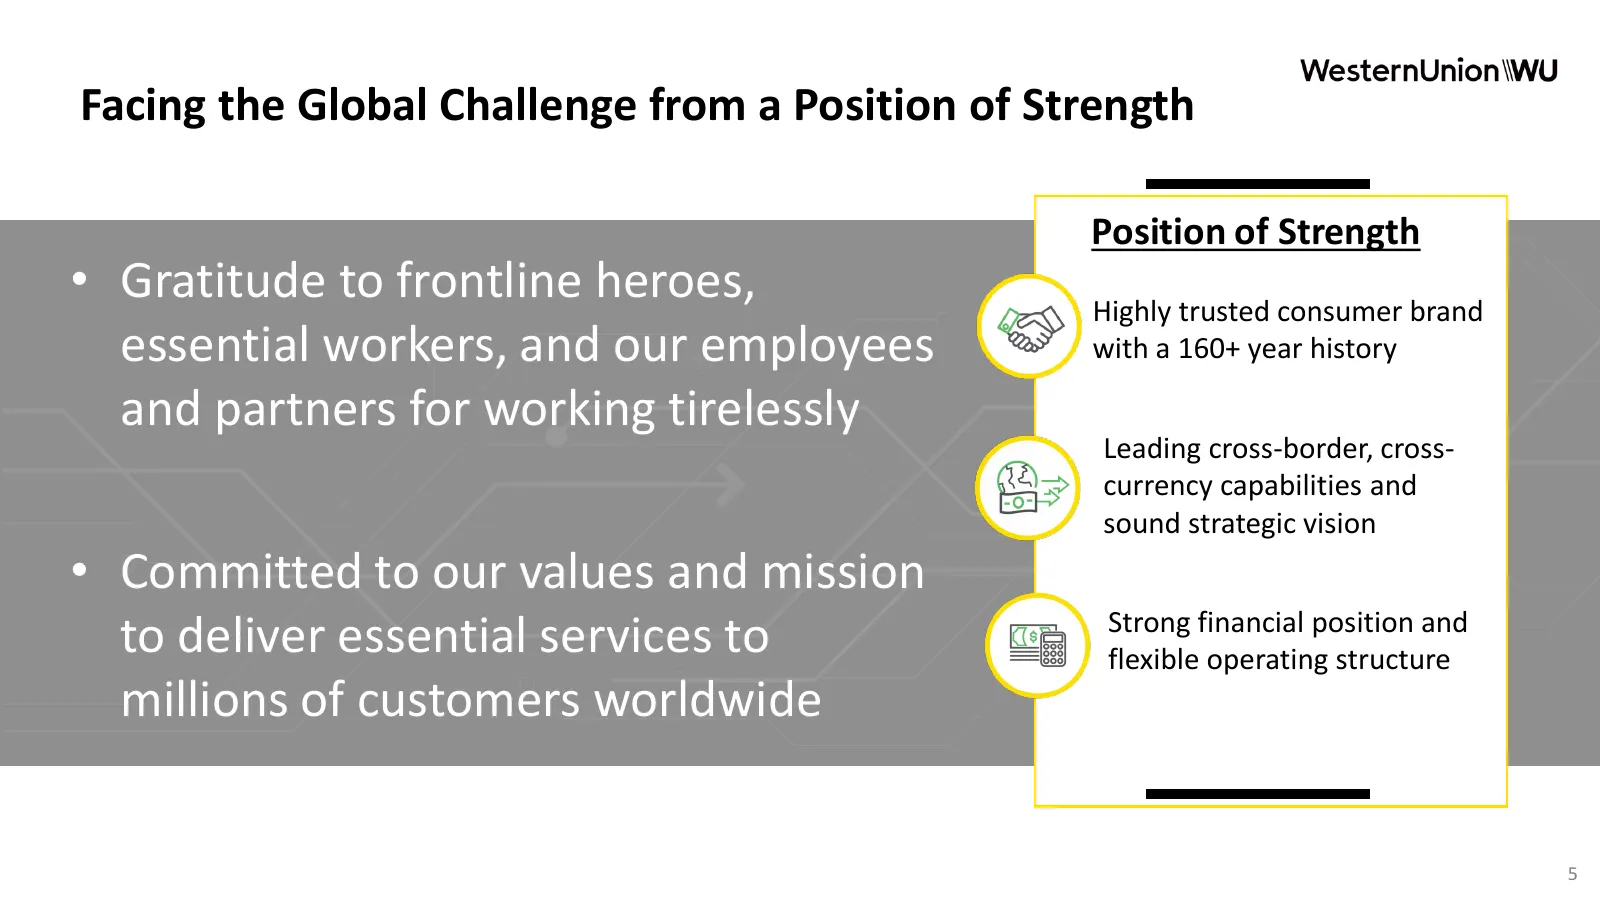
Facing the Global Challenge from a Position of Strength Position of Strength • Gratitude to frontline heroes, Highly trusted consumer brand essential workers, and our employees with a 160+ year history and partners for working tirelessly Leading cross-border, cross- currency capabilities and sound s
Slide 6: Our Response to COVID-19
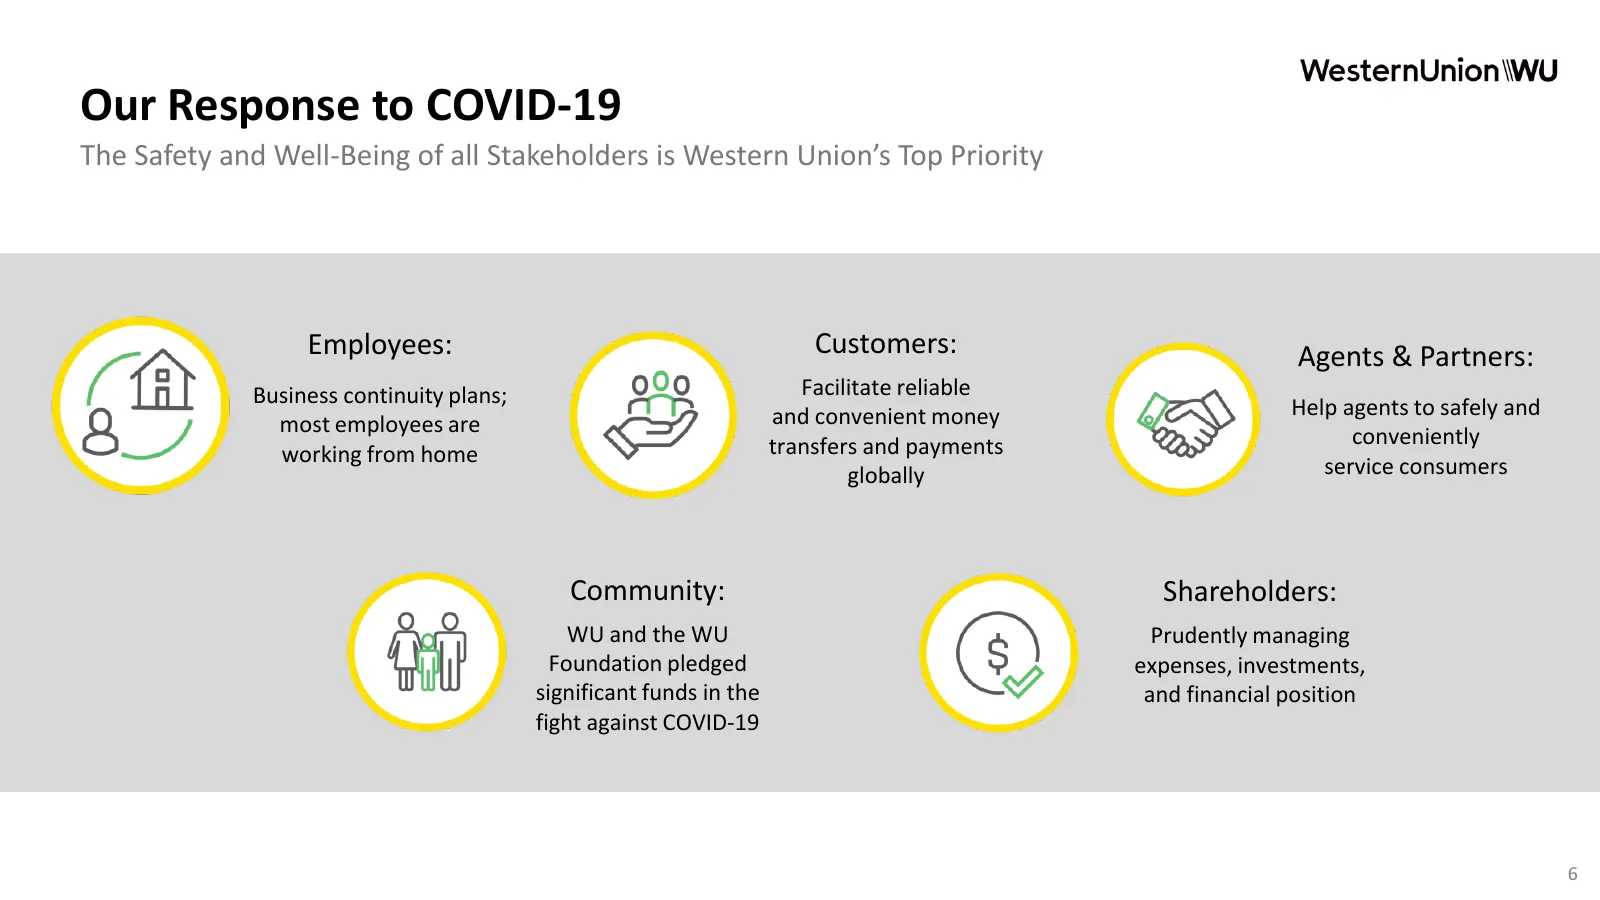
Our Response to COVID-19 The Safety and Well-Being of all Stakeholders is Western Union’s Top Priority Employees: Customers: Agents & Partners: Business continuity plans; Facilitate reliable and convenient money Help agents to safely and most employees are conveniently working from home transfers an
Slide 7: First Quarter Results Snapshot
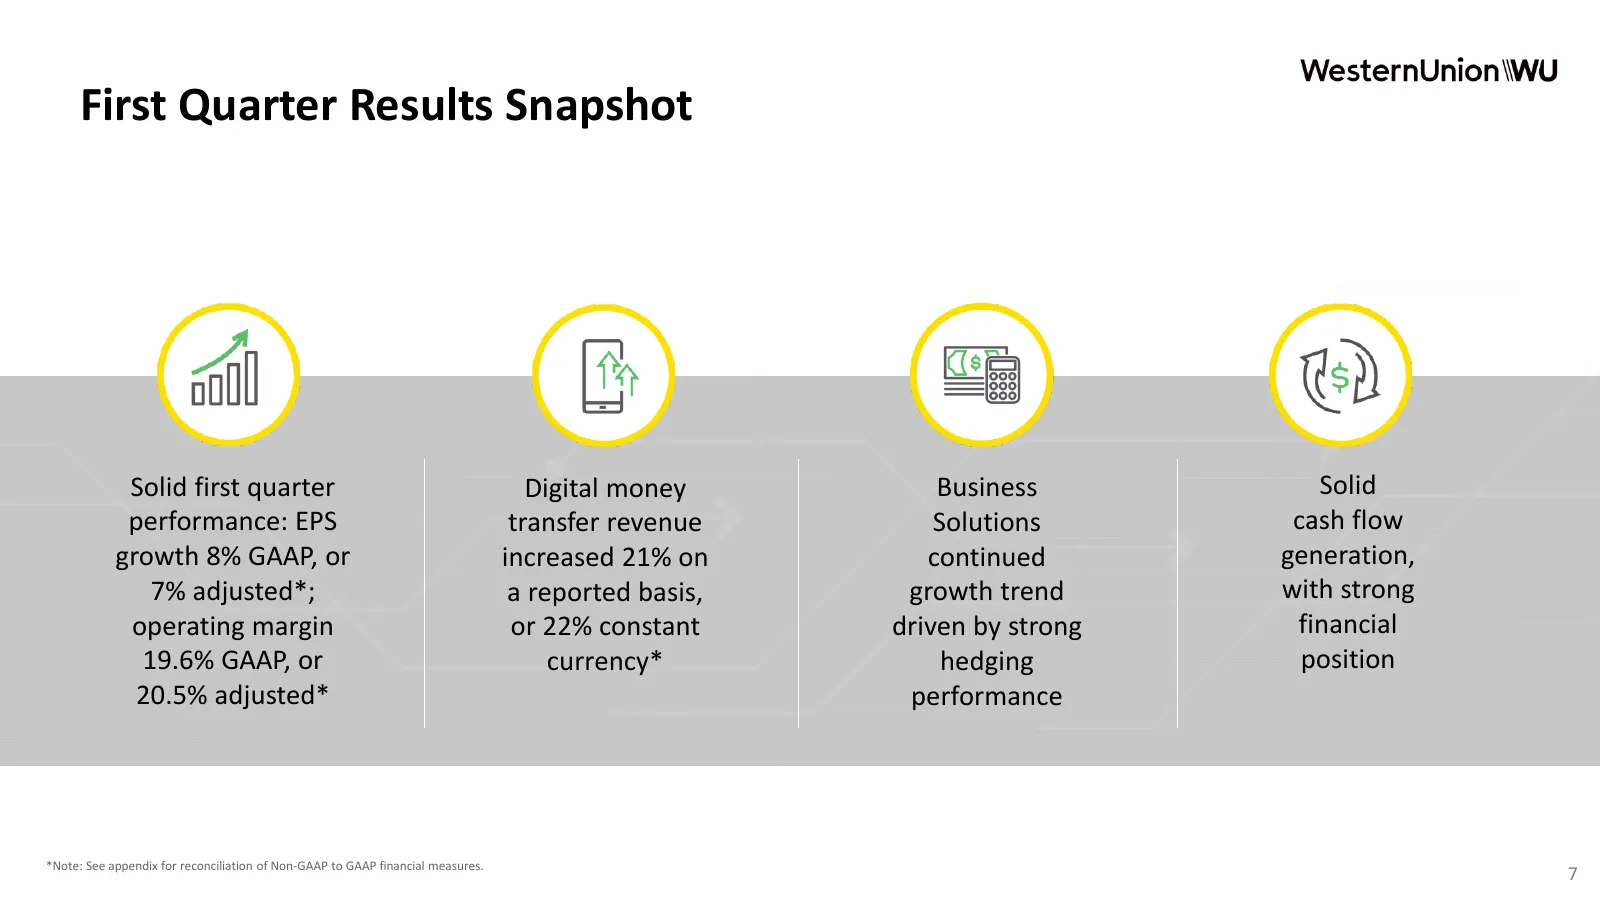
First Quarter Results Snapshot Solid first quarter Digital money Business Solid performance: EPS transfer revenue Solutions cash flow growth 8% GAAP, or increased 21% on continued generation, 7% adjusted*; a reported basis, growth trend with strong operating margin or 22% constant driven by strong f
Slide 8: 2020 Market Update
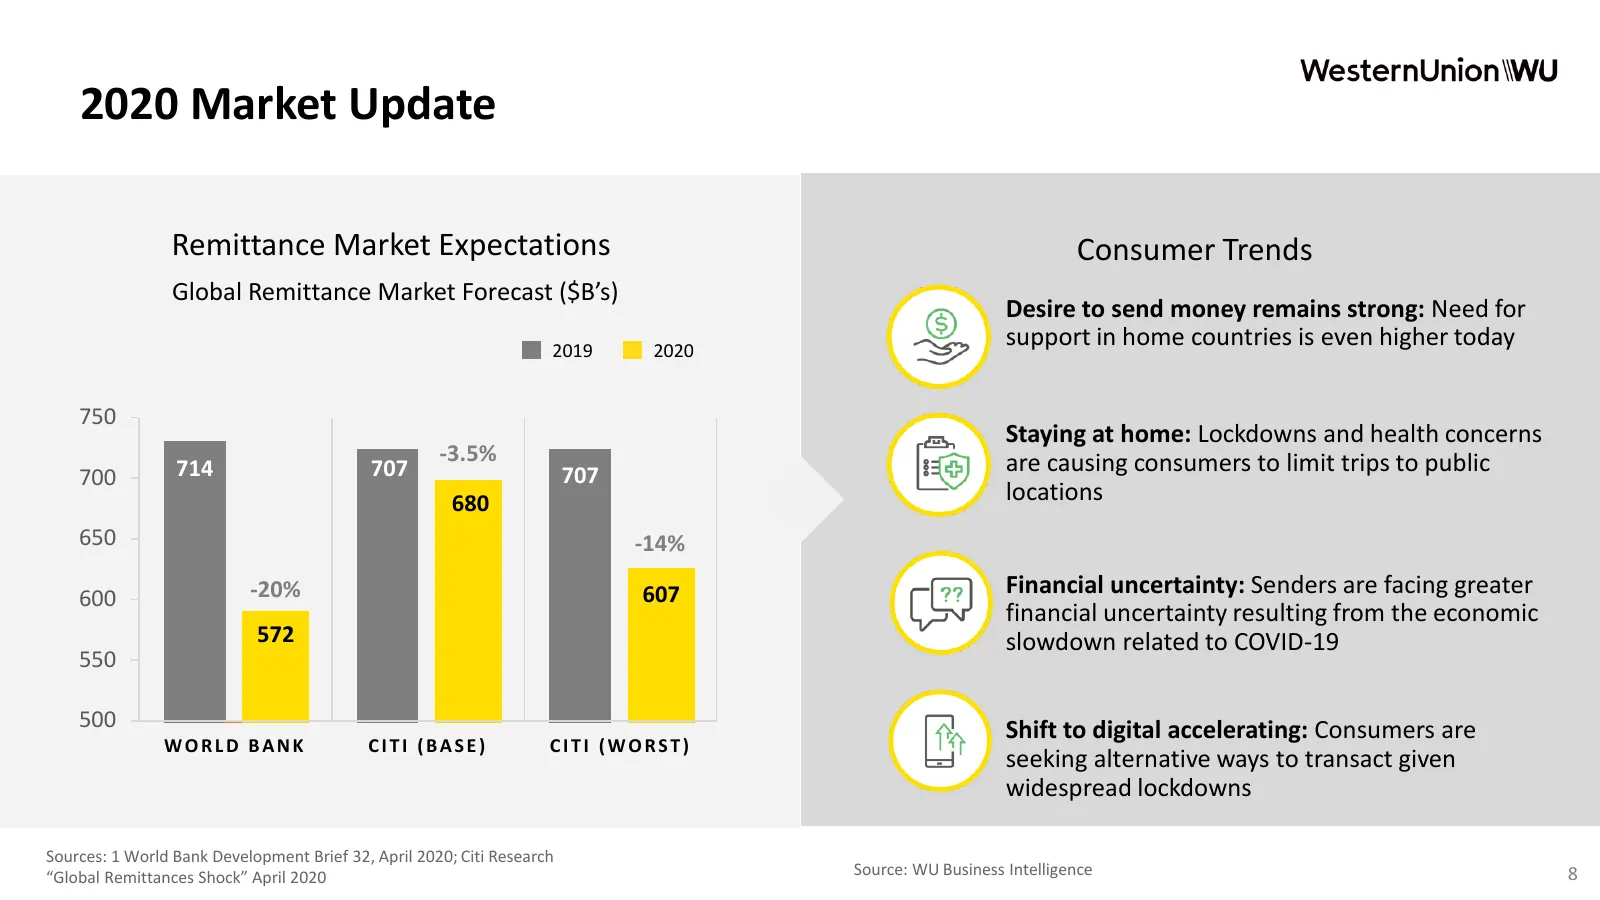
2020 Market Update Remittance Market Expectations Consumer Trends Global Remittance Market Forecast ($B’s) Desire to send money remains strong: Need for 2019 2020 support in home countries is even higher today 750 Staying at home: Lockdowns and health concerns -3.5% are causing consumers to limit tr
Slide 9: Solid Business Fundamentals
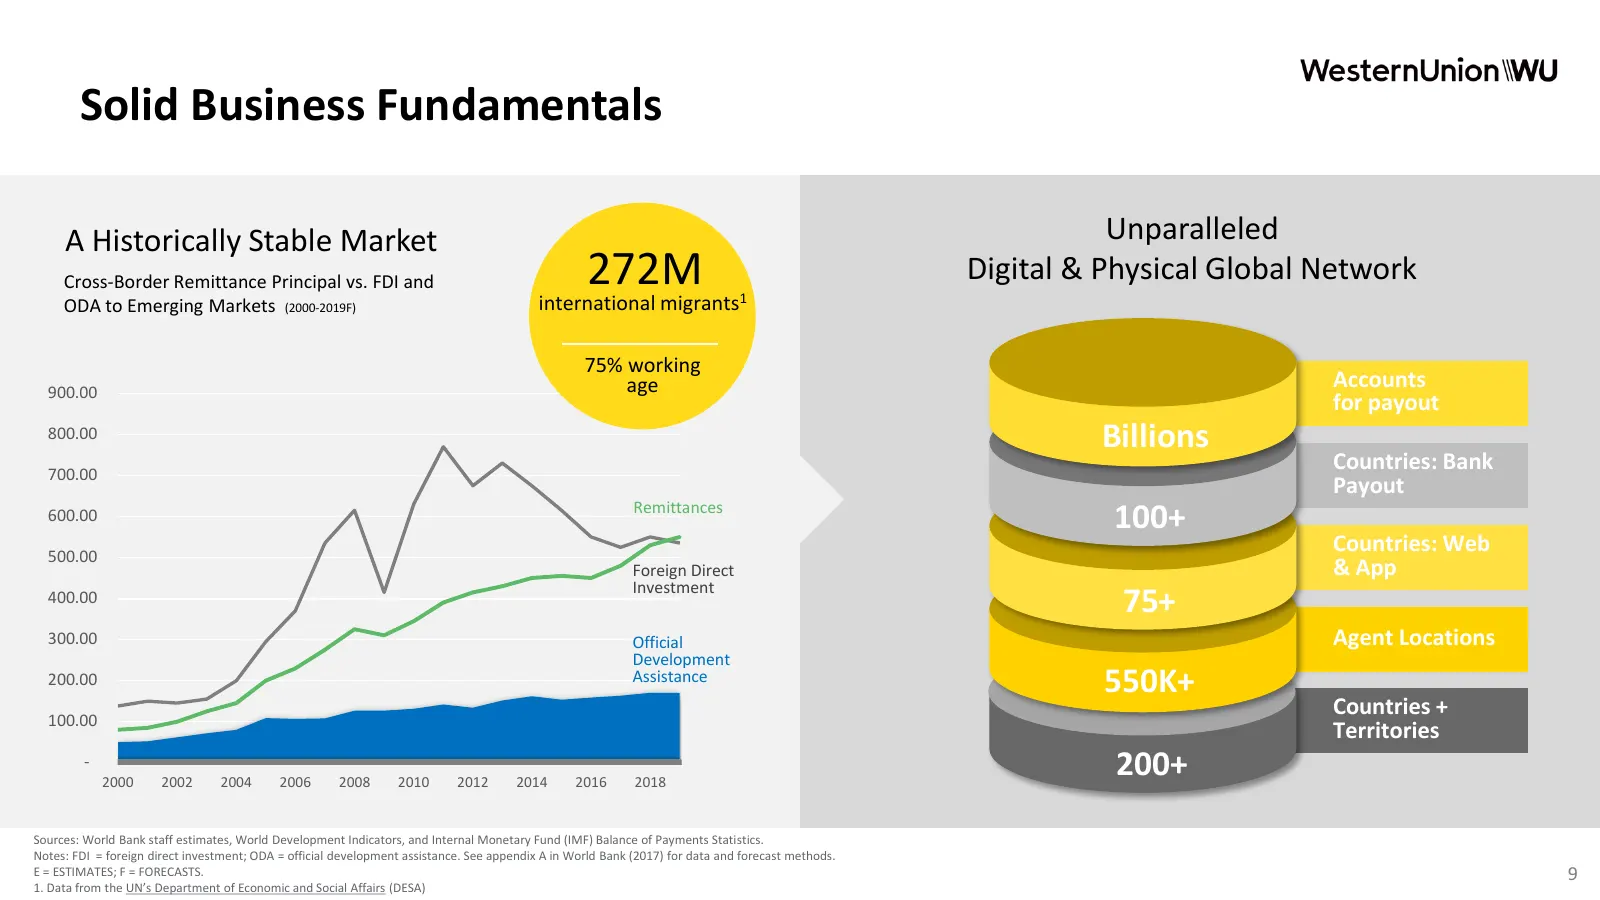
Solid Business Fundamentals A Historically Stable Market Unparalleled Cross-Border Remittance Principal vs. FDI and 272M Digital & Physical Global Network ODA to Emerging Markets (2000-2019F) international migrants1 75% working 900.00 age Accounts for payout 800.00 Billions 700.00 Countries: Bank Pa
Slide 10: Strategy Update
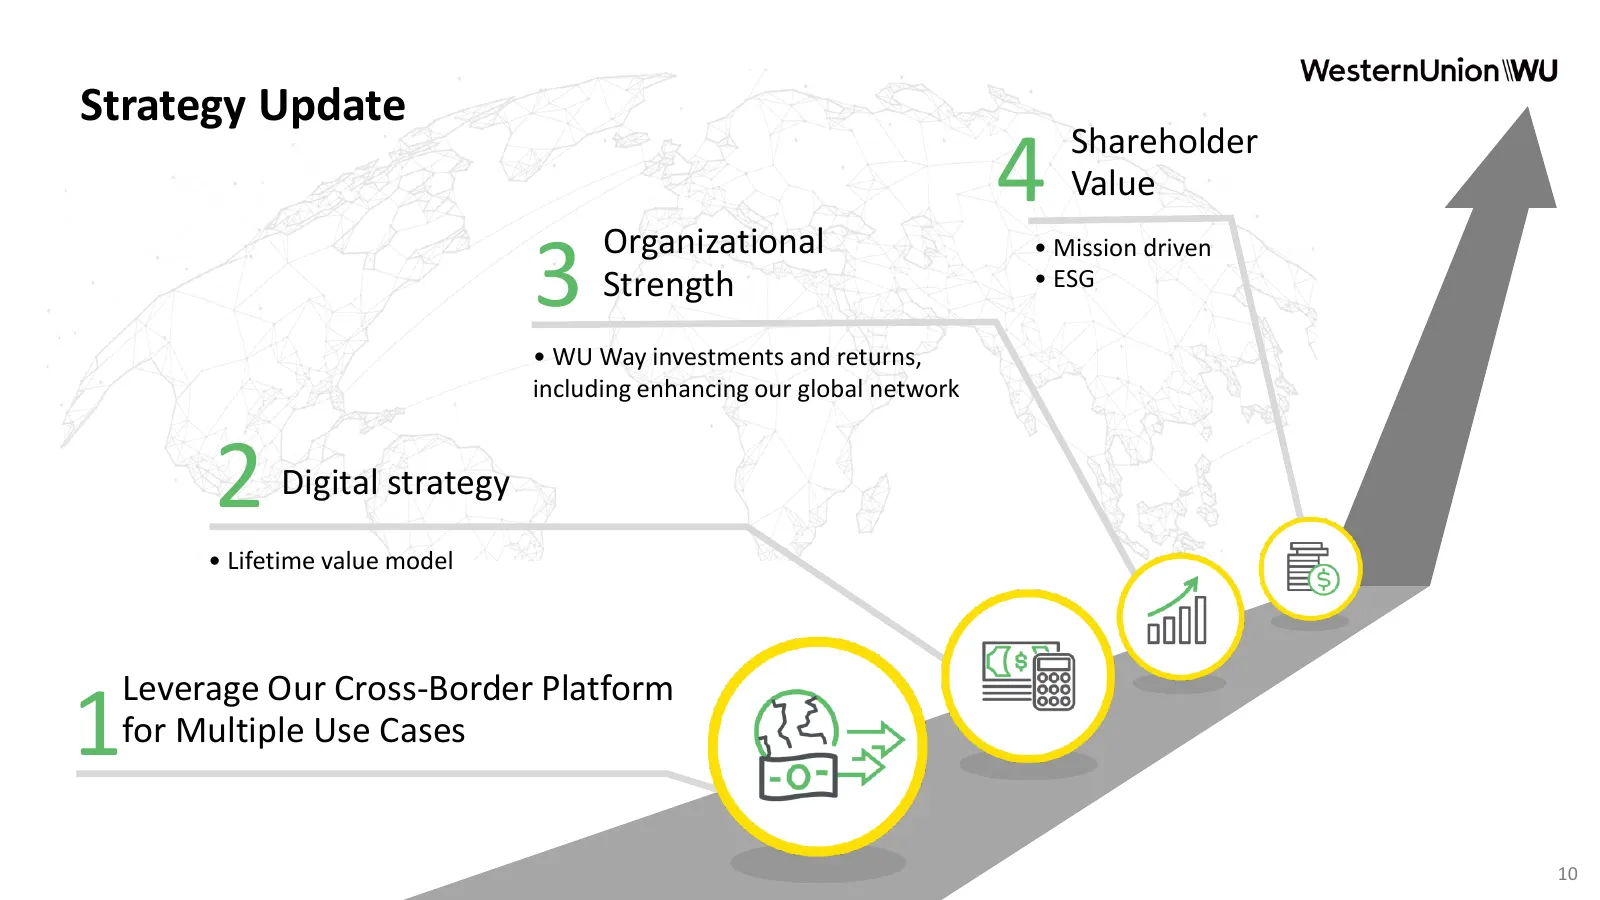
Strategy Update Shareholder 4 Value Organizational 3 Strength • Mission driven • ESG • WU Way investments and returns, including enhancing our global network 2 Digital strategy • Lifetime value model Leverage Our Cross-Border Platform 1for Multiple Use Cases 10

Slide 11: Raj Agrawal, Chief Financial Officer
Raj Agrawal Chief Financial Officer 11
Slide 12: Revenue: Q1 and Early Q2 Trends
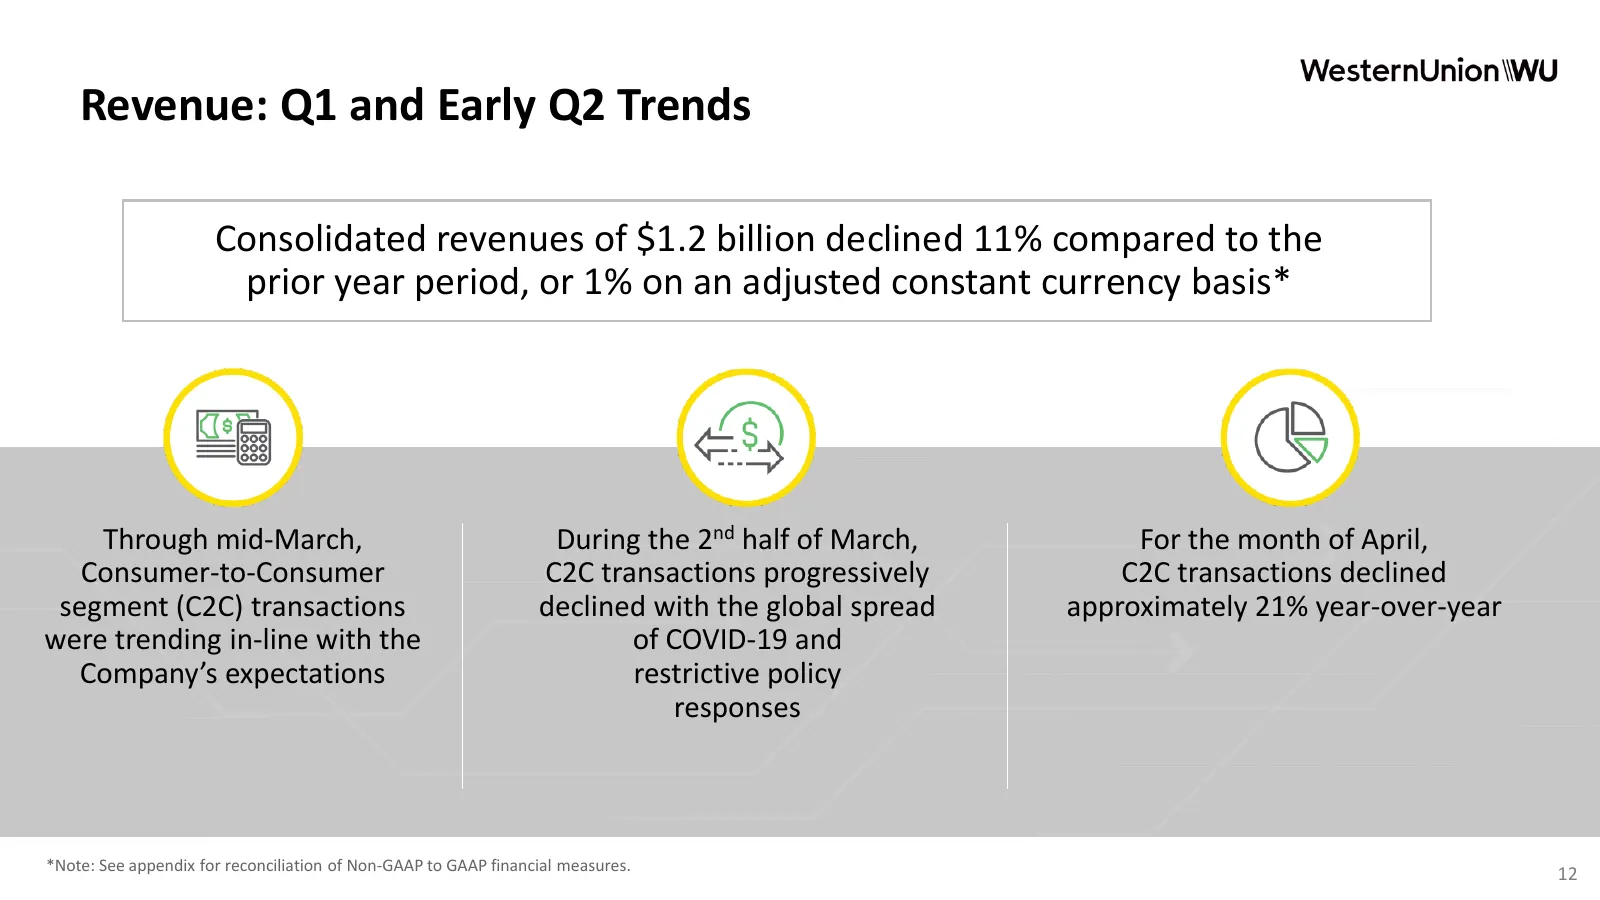
Revenue: Q1 and Early Q2 Trends Consolidated revenues of $1.2 billion declined 11% compared to the prior year period, or 1% on an adjusted constant currency basis* Through mid-March, During the 2nd half of March, For the month of April, Consumer-to-Consumer C2C transactions progressively C2C transac
Slide 13: Consumer-to-Consumer Q1
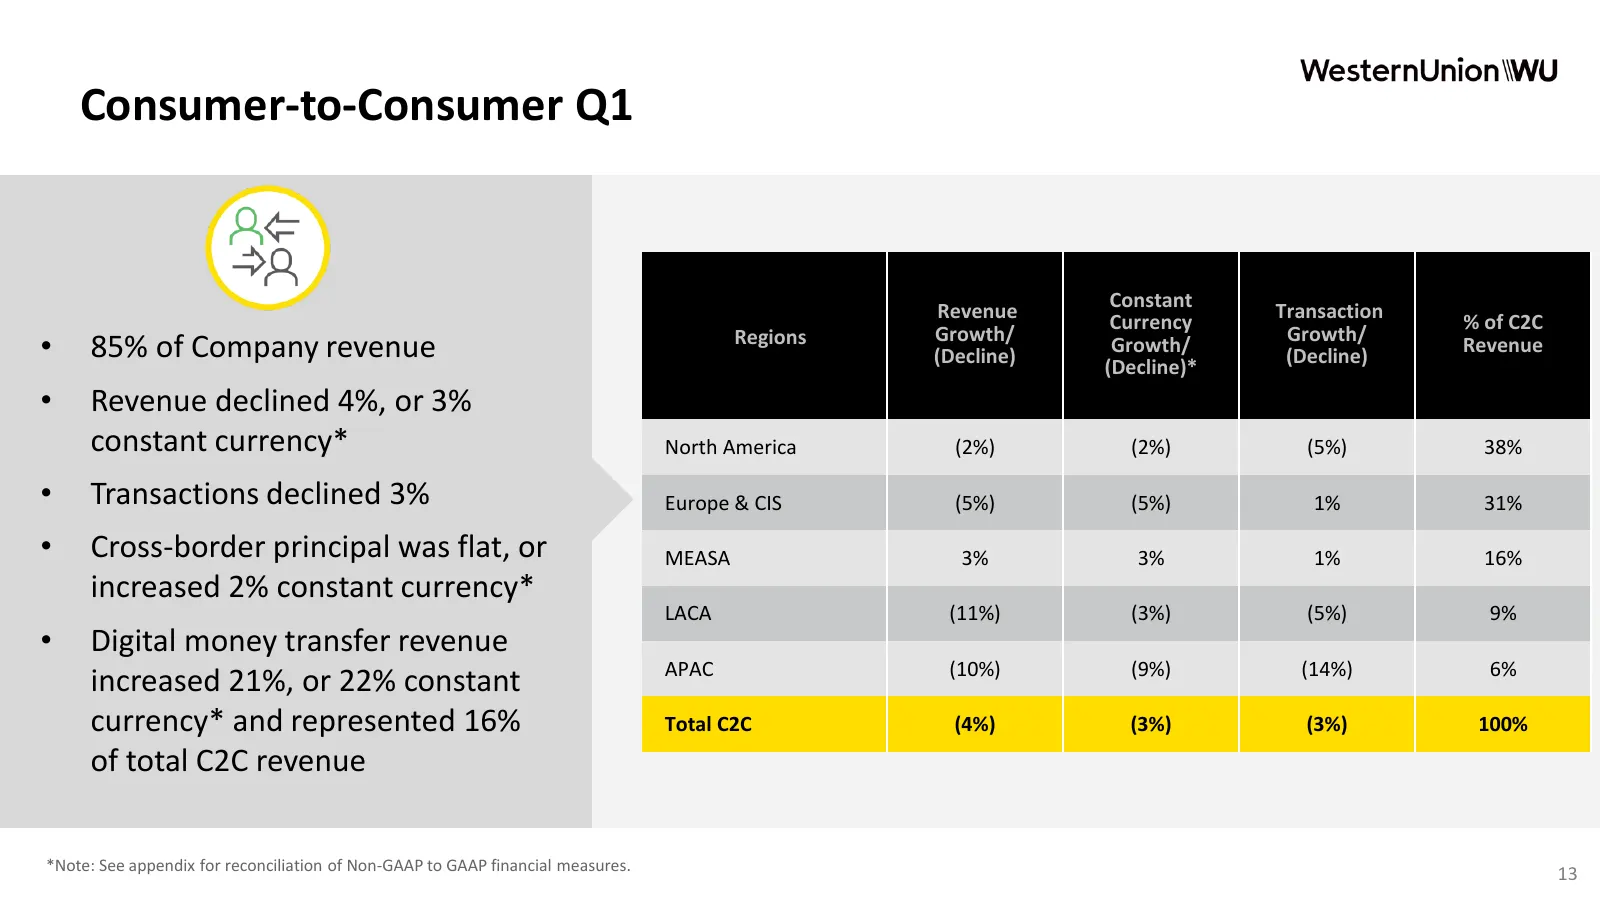
Consumer-to-Consumer Q1 Constant Revenue Currency Transaction Growth/ Growth/ % of C2C Regions • 85% of Company revenue (Decline) Growth/ (Decline)* (Decline) Revenue • Revenue declined 4%, or 3% constant currency* North America (2%) (2%) (5%) 38% • Transactions declined 3% Europe & CIS (5%) (5%) 1%
Slide 14: Business Solutions and Other Q1
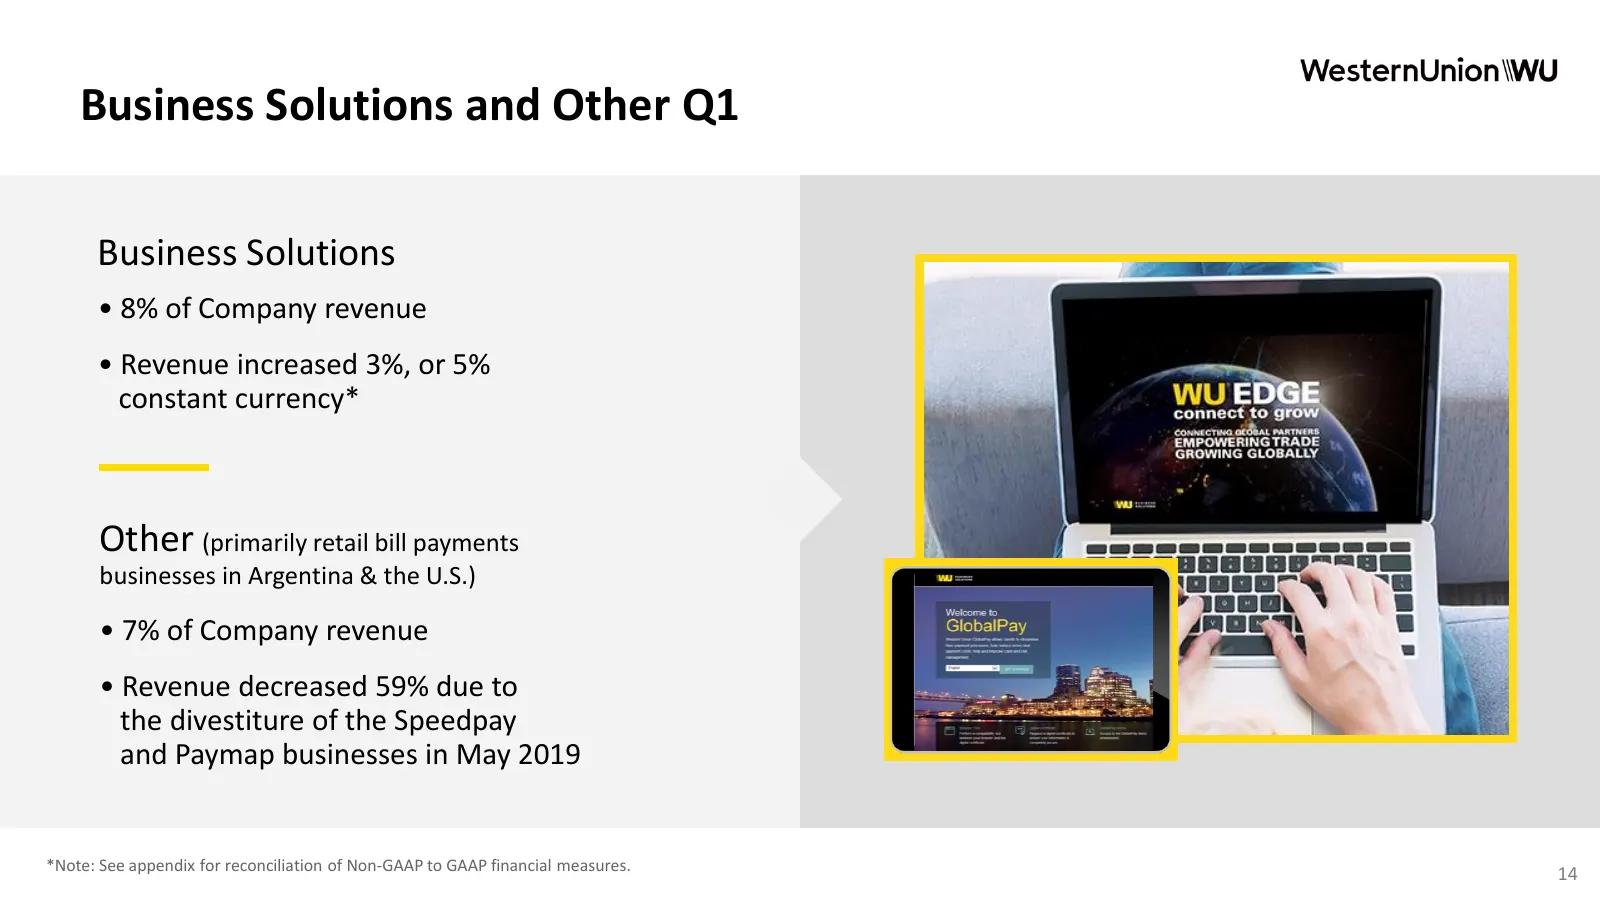
Business Solutions and Other Q1 Business Solutions • 8% of Company revenue • Revenue increased 3%, or 5% constant currency* Other (primarily retail bill payments businesses in Argentina & the U.S.) • 7% of Company revenue • Revenue decreased 59% due to the divestiture of the Speedpay and Paymap busi
Slide 15: Operating Margin Q1
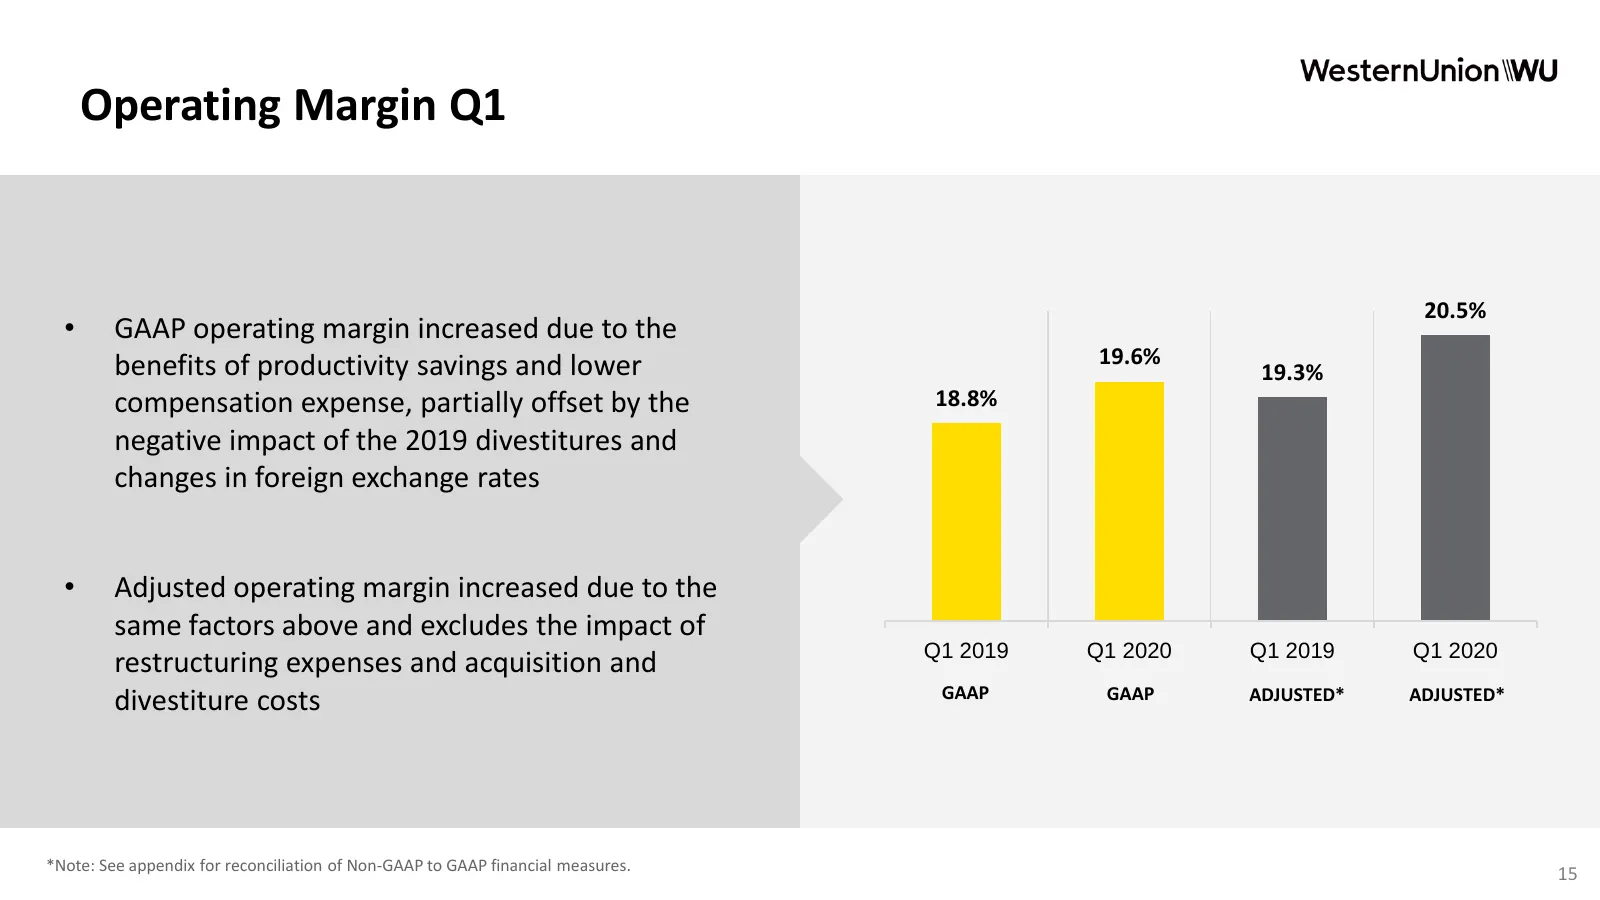
Operating Margin Q1 20.5% • GAAP operating margin increased due to the benefits of productivity savings and lower 19.6% 19.3% compensation expense, partially offset by the 18.8% negative impact of the 2019 divestitures and changes in foreign exchange rates • Adjusted operating margin increased due t
Slide 16: Financial Highlights
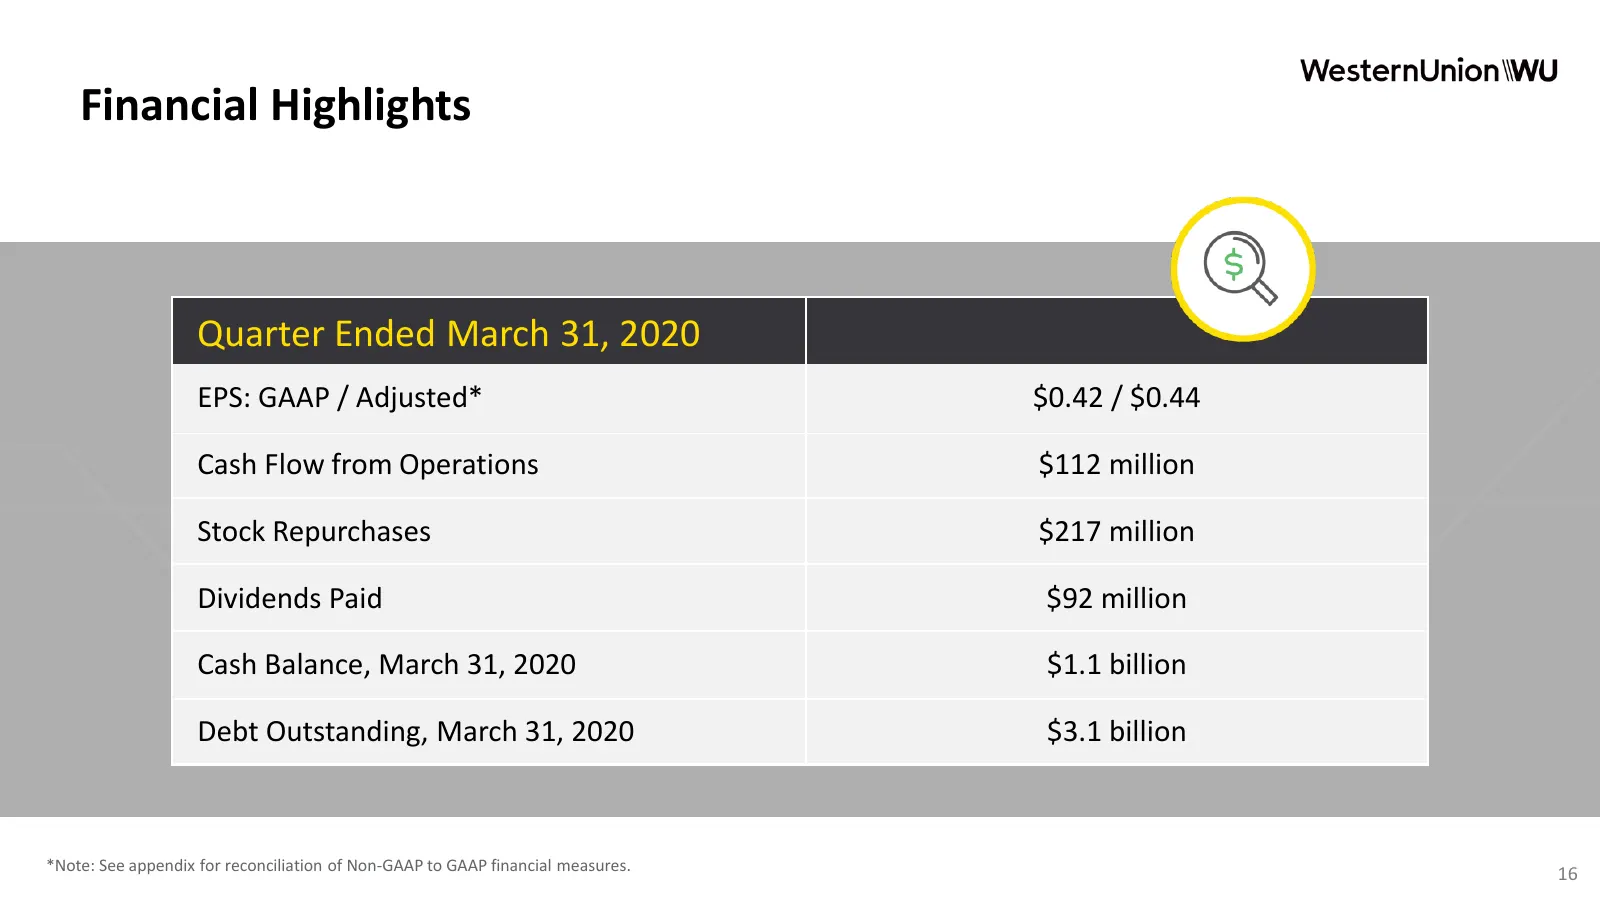
Financial Highlights Quarter Ended March 31, 2020 EPS: GAAP / Adjusted* $0.42 / $0.44 Cash Flow from Operations $112 million Stock Repurchases $217 million Dividends Paid $92 million Cash Balance, March 31, 2020 $1.1 billion Debt Outstanding, March 31, 2020 $3.1 billion *Note: See appendix for recon
Slide 17: 2020 Business Update
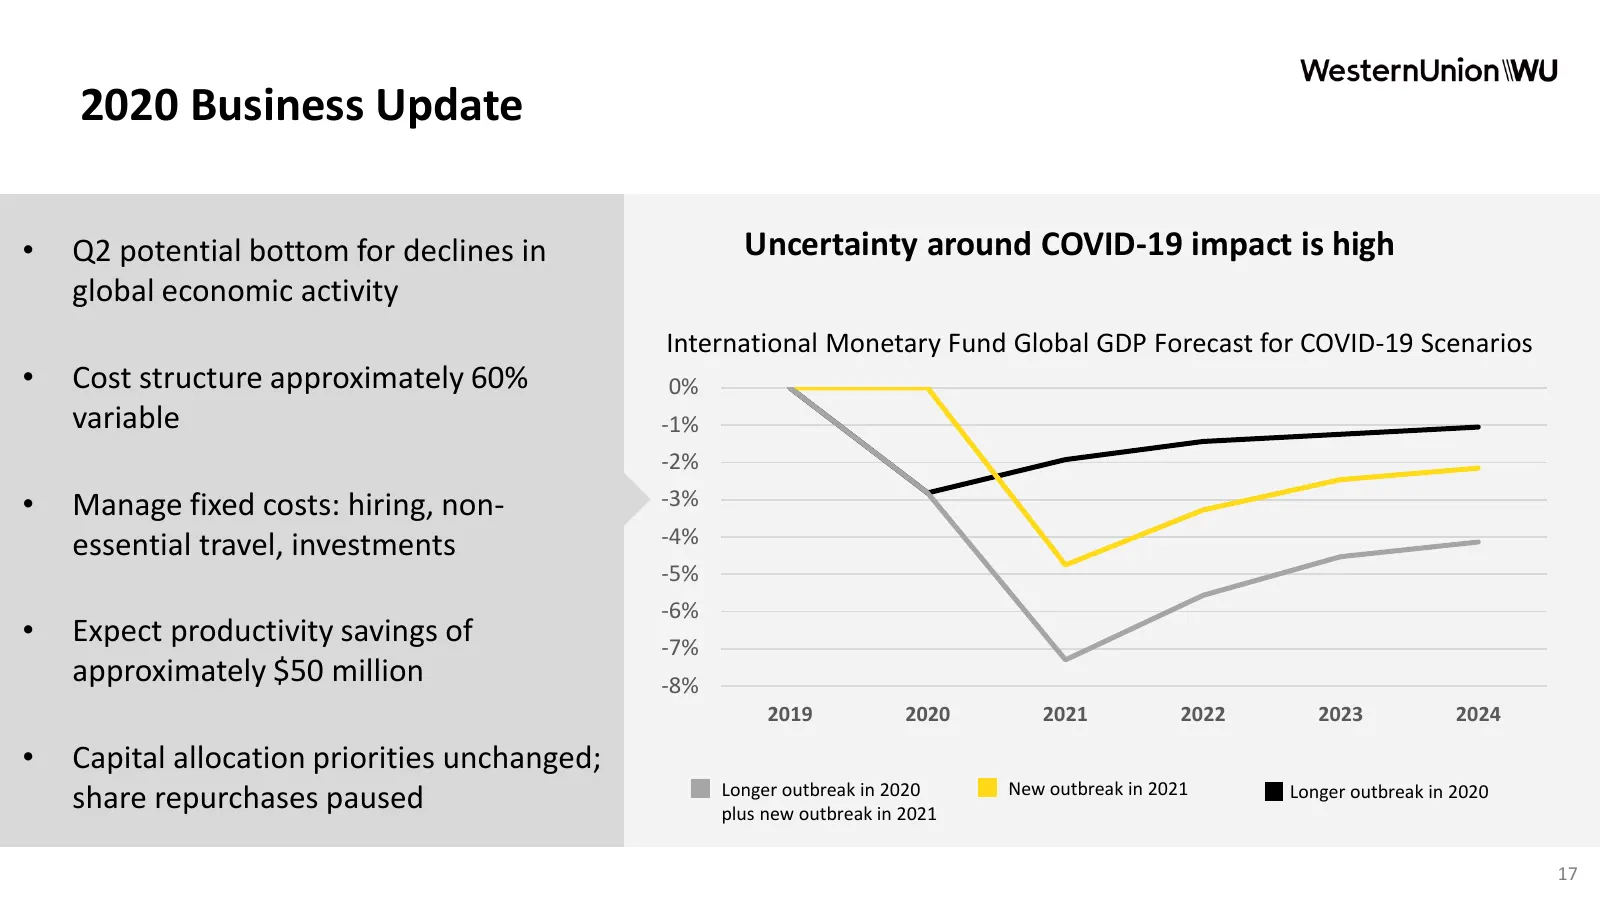
2020 Business Update • Q2 potential bottom for declines in Uncertainty around COVID-19 impact is high global economic activity International Monetary Fund Global GDP Forecast for COVID-19 Scenarios • Cost structure approximately 60% 0% variable -1% -2% • Manage fixed costs: hiring, non- -3% essentia
Slide 18: Western Union is Well Positioned for Future Success
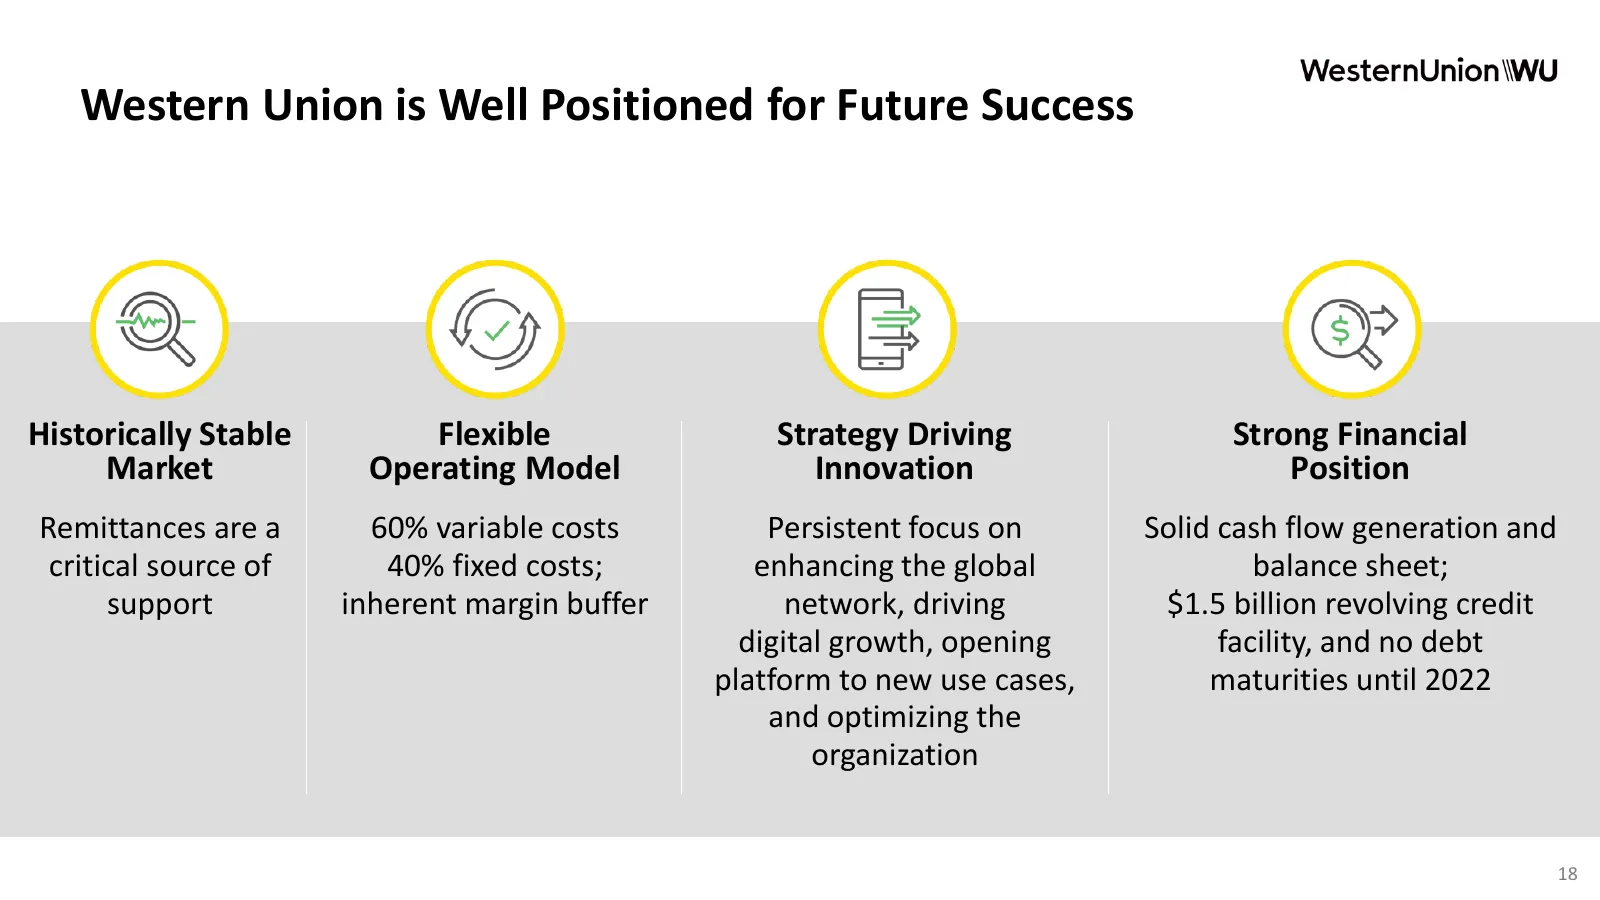
Western Union is Well Positioned for Future Success Historically Stable Flexible Strategy Driving Strong Financial Market Operating Model Innovation Position Remittances are a 60% variable costs Persistent focus on Solid cash flow generation and critical source of 40% fixed costs; enhancing the glob

Slide 19: Questions and Answers
WesternUnion\WU Questions and Answers

Slide 20: Appendix
Appendix 1st Quarter 2020 Earnings Webcast and Conference Call 20
Slide 21: Key Statistics and Reconciliation of Non-GAAP Measures
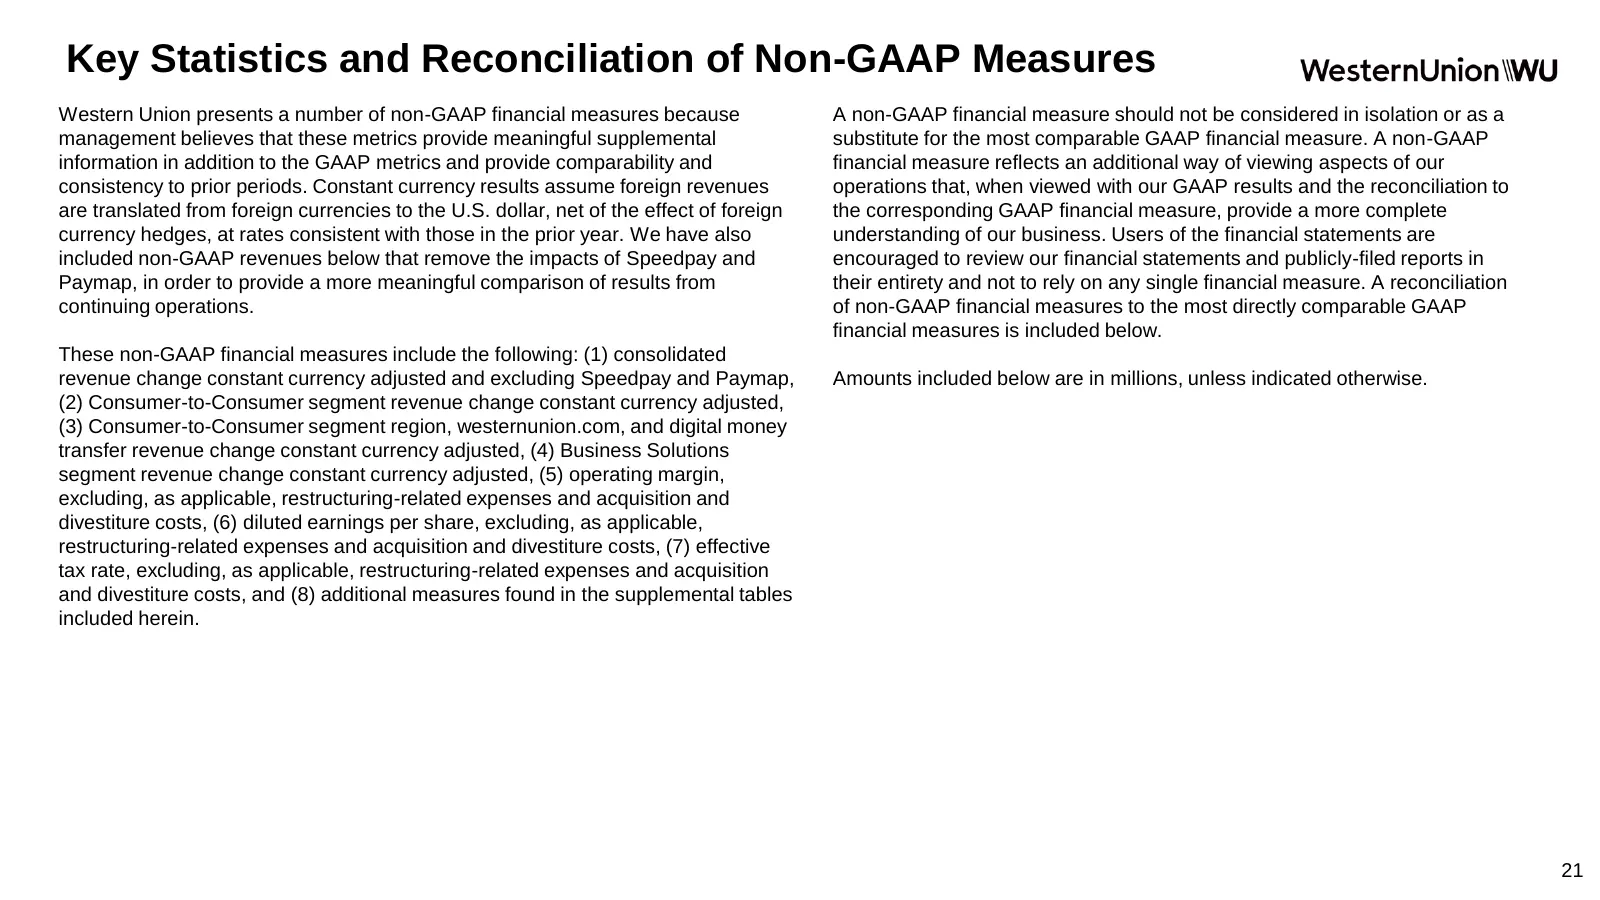
Key Statistics and Reconciliation of Non-GAAP Measures Western Union presents a number of non-GAAP financial measures because A non-GAAP financial measure should not be considered in isolation or as a management believes that these metrics provide meaningful supplemental substitute for the most comp
Slide 22: Key Statistics and Reconciliation of Non-GAAP Measures
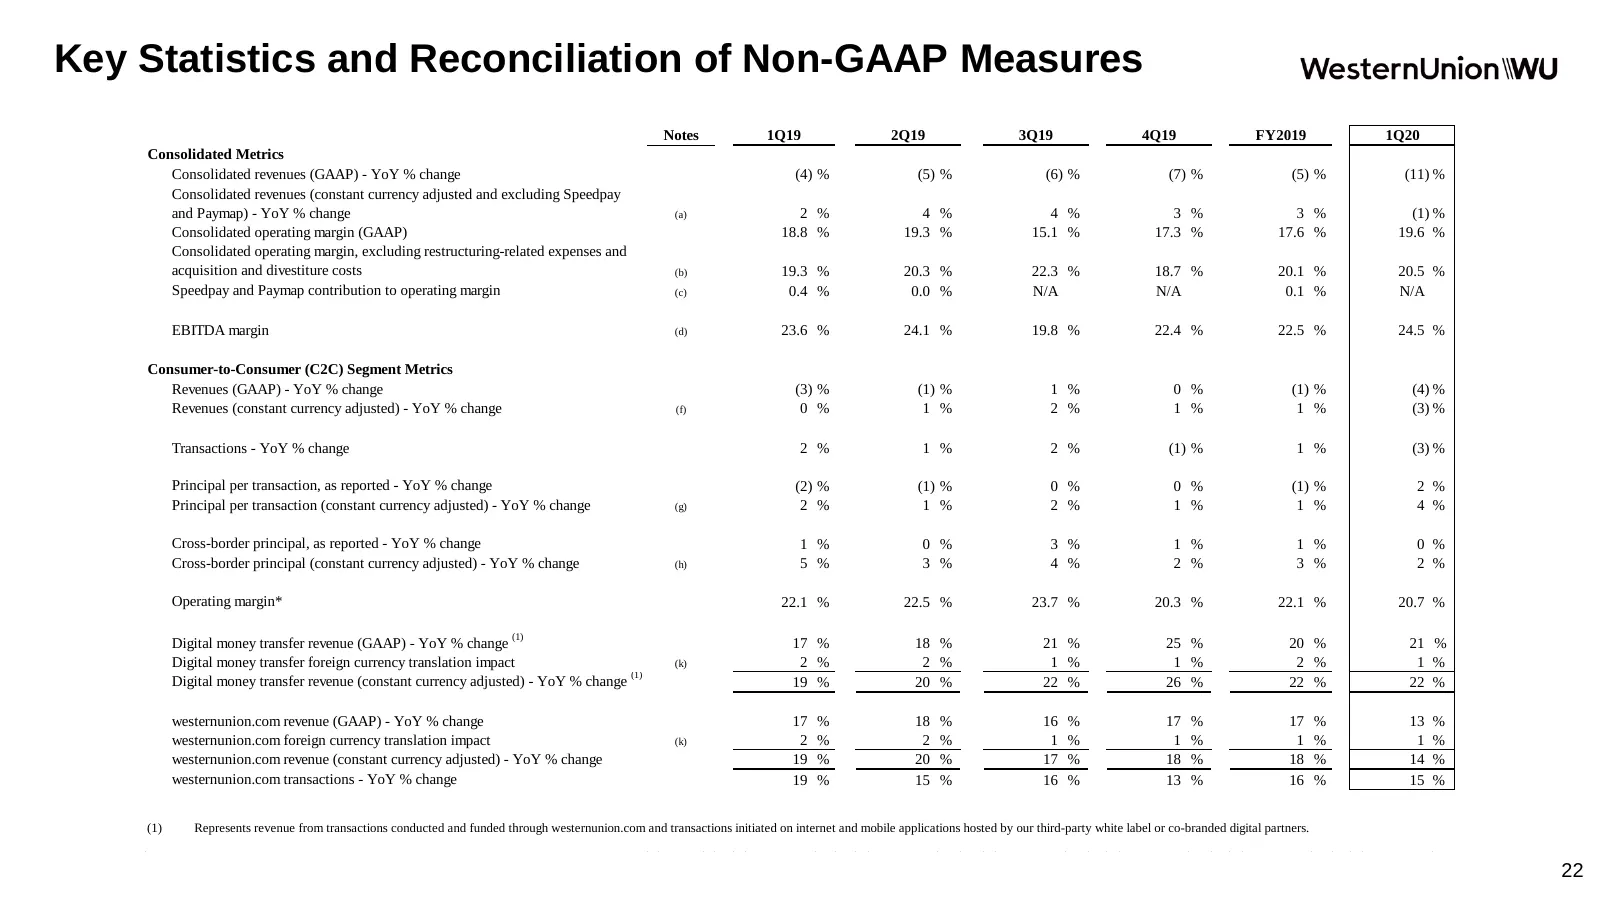
Key Statistics and Reconciliation of Non-GAAP Measures Notes 1Q19 2Q19 3Q19 4Q19 FY2019 1Q20 Consolidated Metrics Consolidated revenues (GAAP) - YoY % change (4) % (5) % (6) % (7) % (5) % (11) % Consolidated revenues (constant currency adjusted and excluding Speedpay and Paymap) - YoY % change (a) 2
Slide 23: Key Statistics and Reconciliation of Non-GAAP Measures
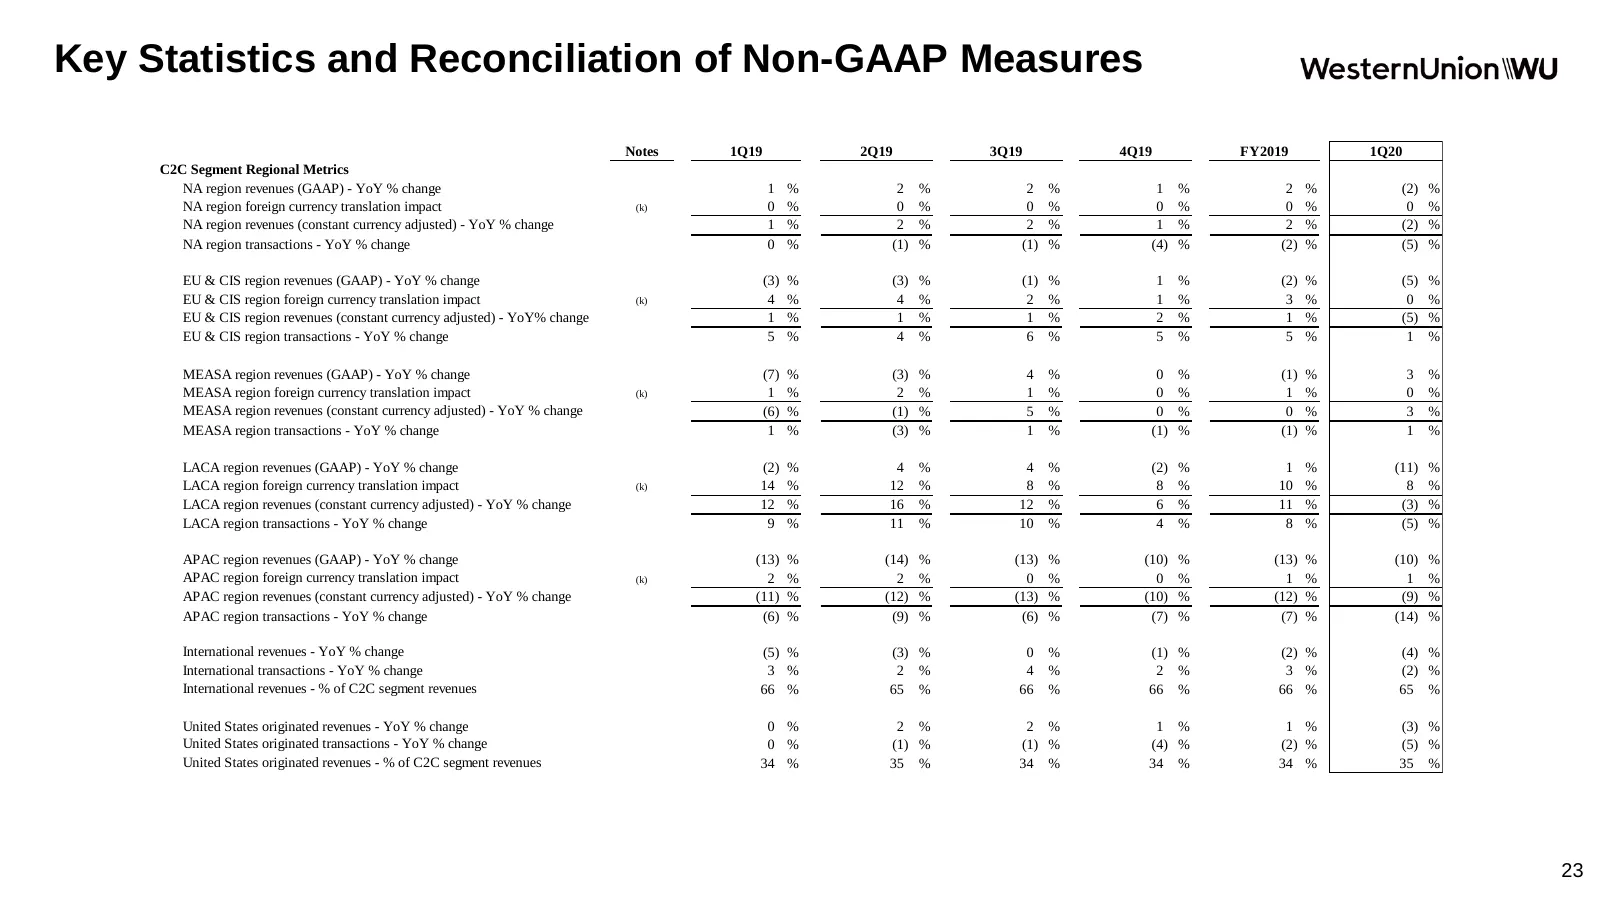
Key Statistics and Reconciliation of Non-GAAP Measures Notes 1Q19 2Q19 3Q19 4Q19 FY2019 1Q20 C2C Segment Regional Metrics NA region revenues (GAAP) - YoY % change 1 % 2 % 2 % 1 % 2 % (2) % NA region foreign currency translation impact (k) 0 % 0 % 0 % 0 % 0 % 0 % NA region revenues (constant currency
Slide 24: Key Statistics and Reconciliation of Non-GAAP Measures
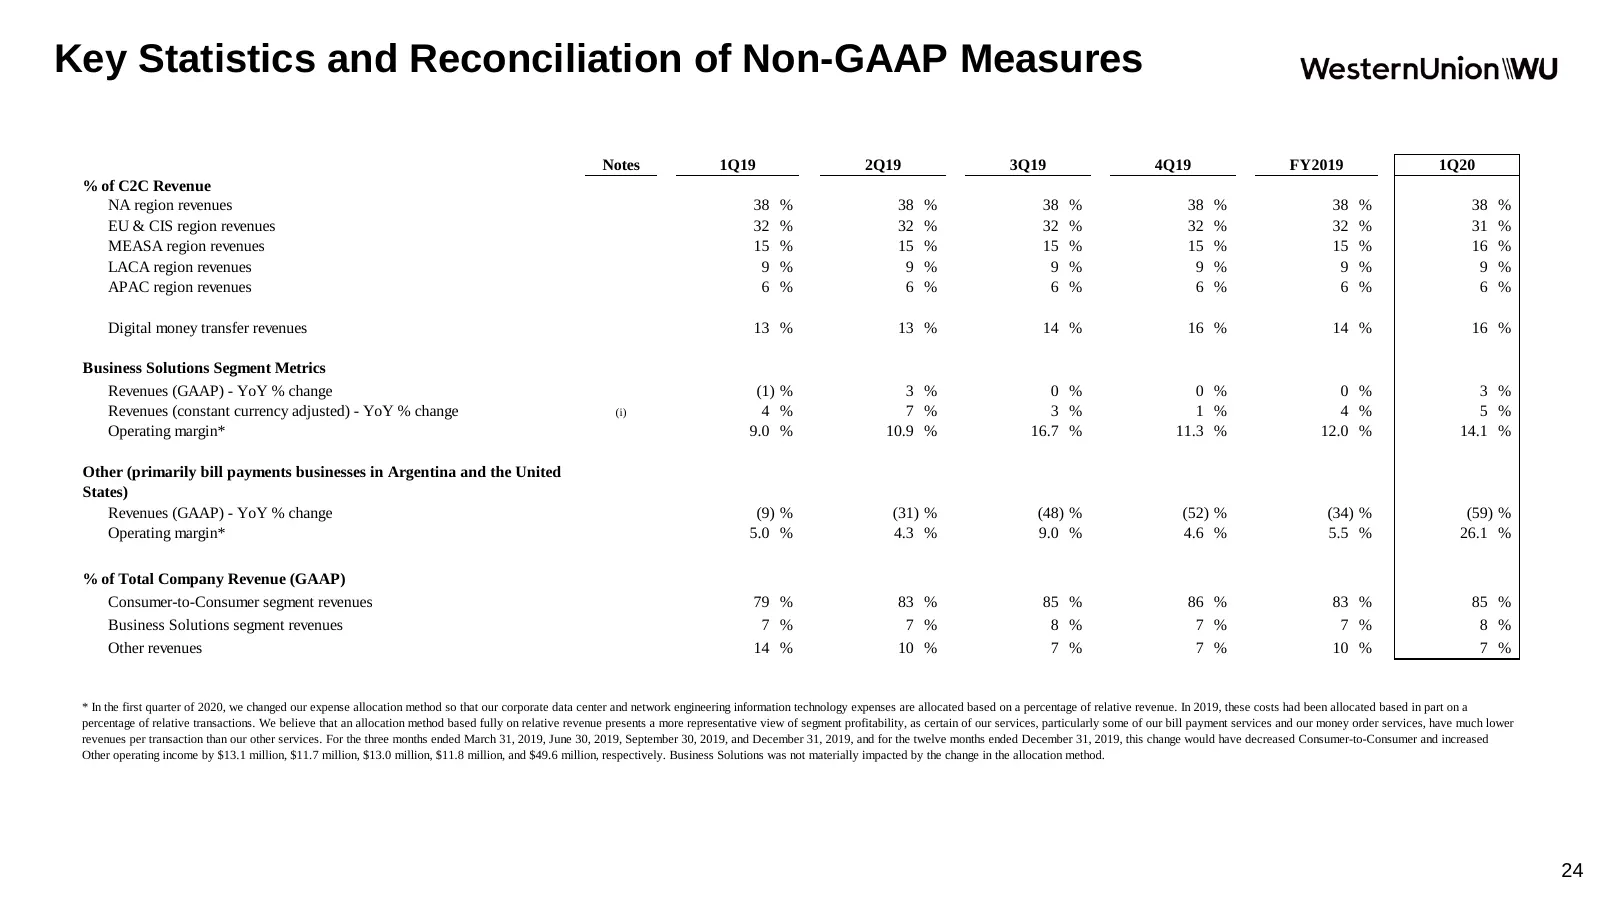
Key Statistics and Reconciliation of Non-GAAP Measures Notes 1Q19 2Q19 3Q19 4Q19 FY2019 1Q20 % of C2C Revenue NA region revenues 38 % 38 % 38 % 38 % 38 % 38 % EU & CIS region revenues 32 % 32 % 32 % 32 % 32 % 31 % MEASA region revenues 15 % 15 % 15 % 15 % 15 % 16 % LACA region revenues 9 % 9 % 9 % 9
Slide 25: Key Statistics and Reconciliation of Non-GAAP Measures
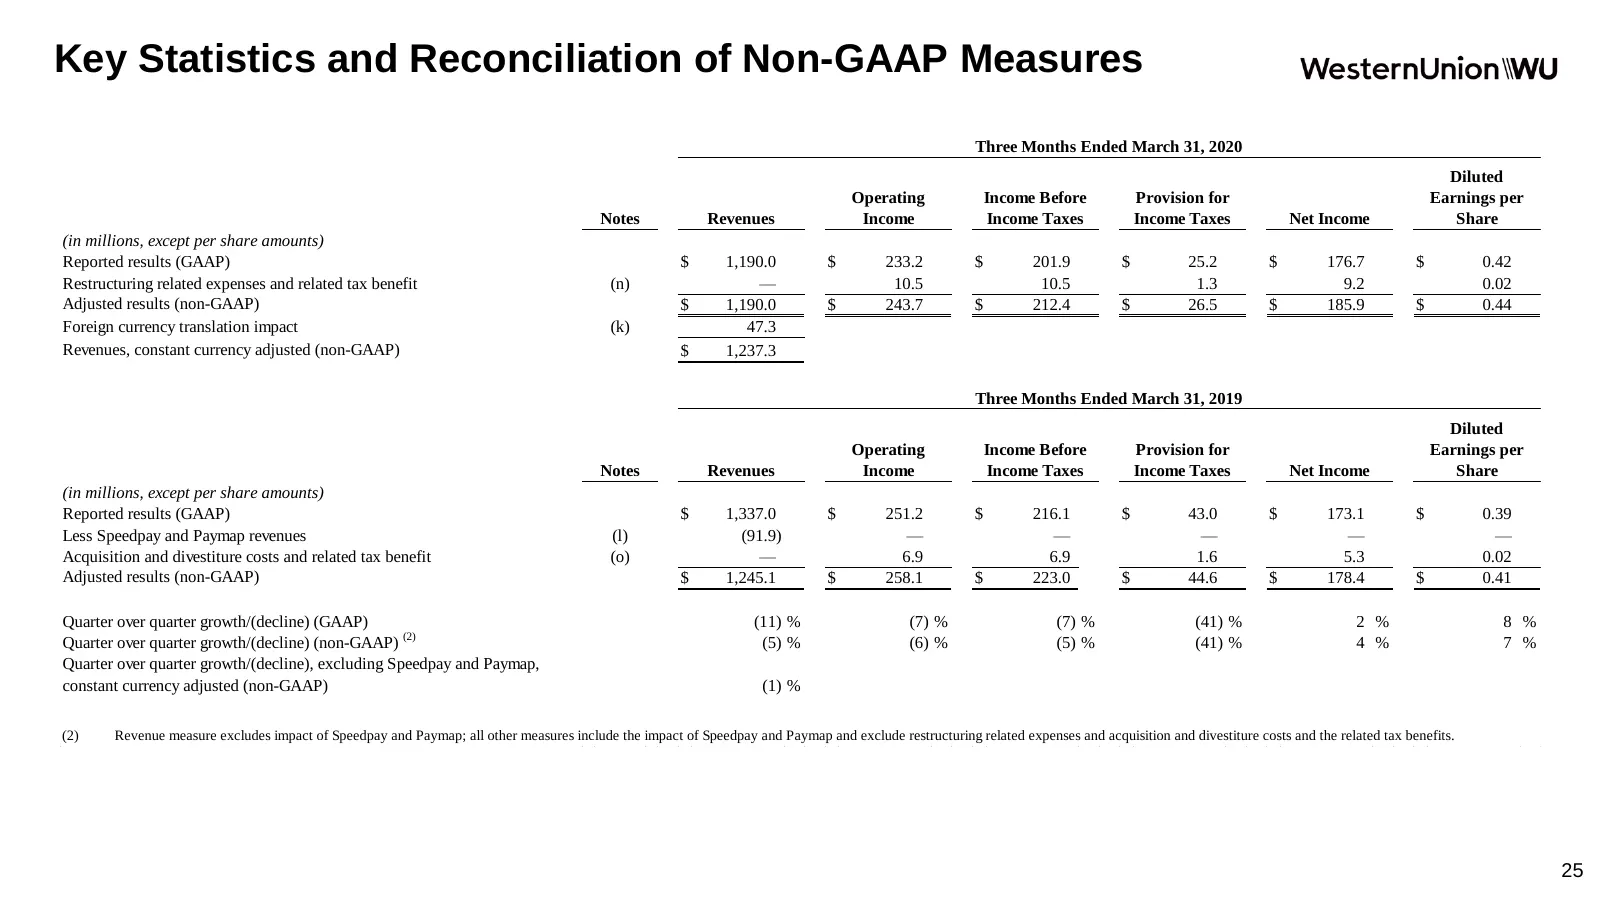
Key Statistics and Reconciliation of Non-GAAP Measures Three Months Ended March 31, 2020 Diluted Operating Income Before Provision for Earnings per Notes Revenues Income Income Taxes Income Taxes Net Income Share (in millions, except per share amounts) Reported results (GAAP) $ 1,190.0 $ 233.2 $ 201
Slide 26: Key Statistics and Reconciliation of Non-GAAP Measures
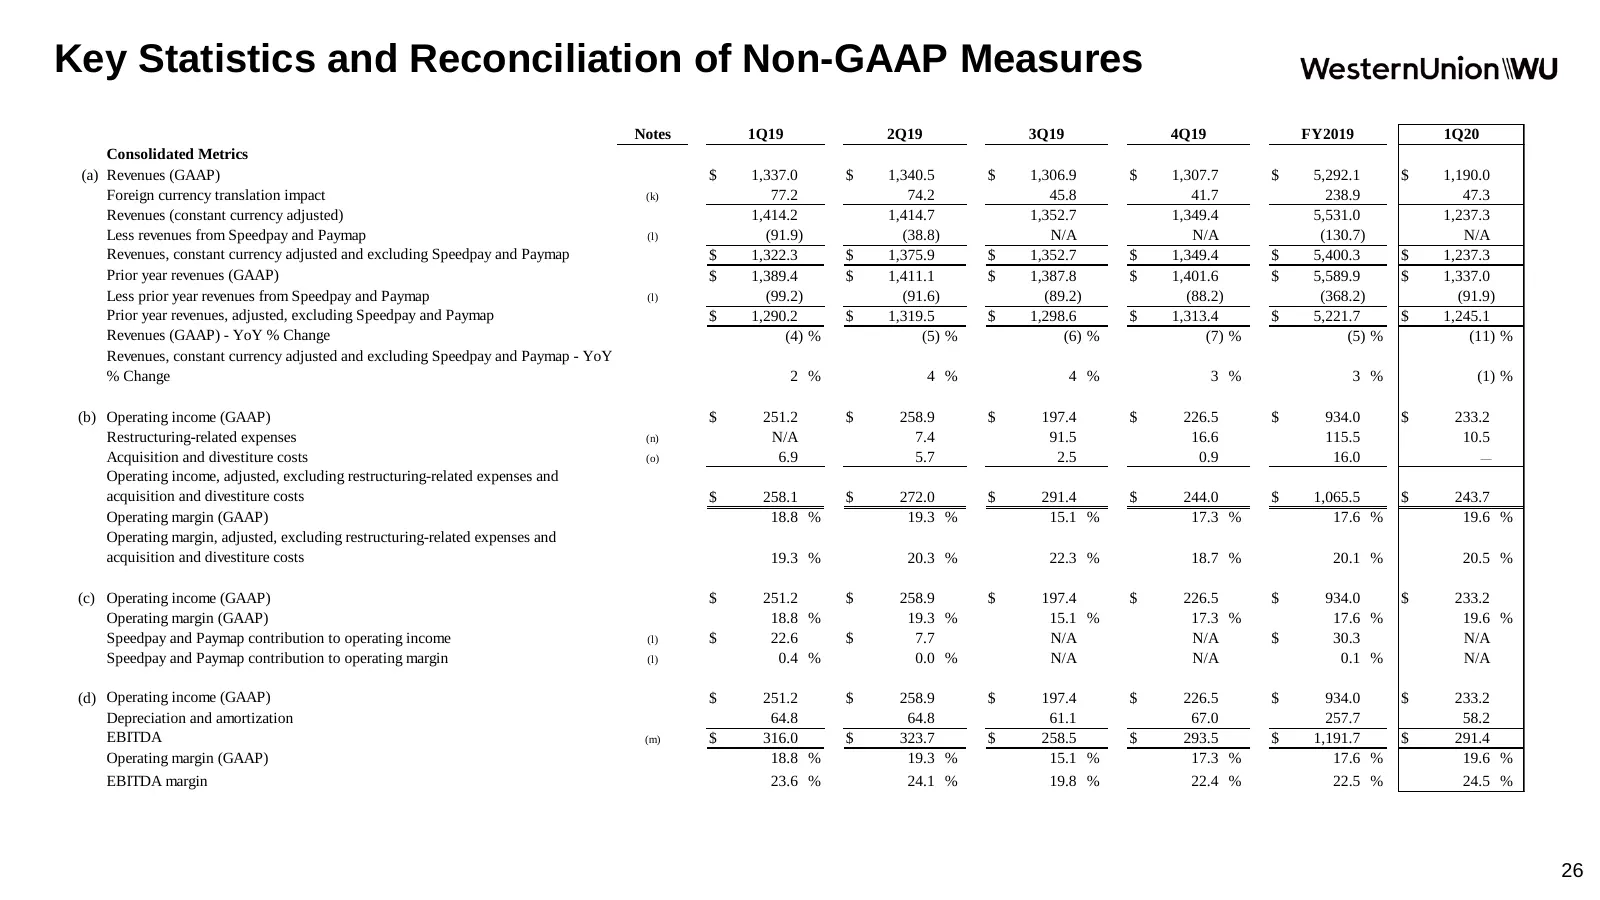
Key Statistics and Reconciliation of Non-GAAP Measures Notes 1Q19 2Q19 3Q19 4Q19 FY2019 1Q20 Consolidated Metrics (a) Revenues (GAAP) $ 1,337.0 $ 1,340.5 $ 1,306.9 $ 1,307.7 $ 5,292.1 $ 1,190.0 Foreign currency translation impact (k) 77.2 74.2 45.8 41.7 238.9 47.3 Revenues (constant currency adjuste
Slide 27: Key Statistics and Reconciliation of Non-GAAP Measures
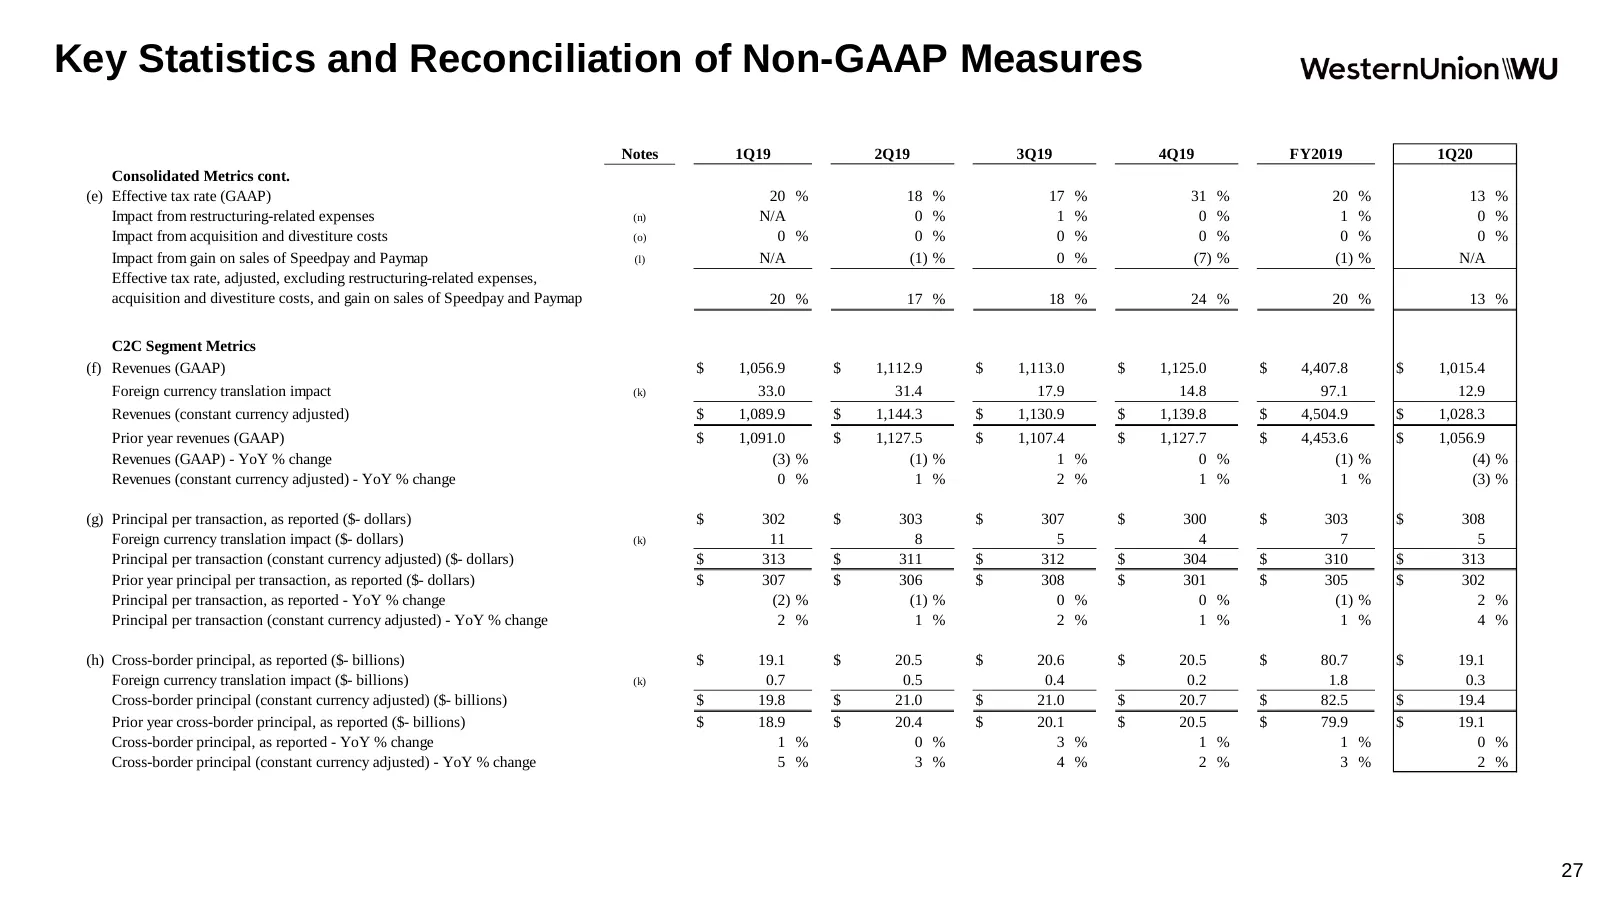
Key Statistics and Reconciliation of Non-GAAP Measures Notes 1Q19 2Q19 3Q19 4Q19 FY2019 1Q20 Consolidated Metrics cont. (e) Effective tax rate (GAAP) 20 % 18 % 17 % 31 % 20 % 13 % Impact from restructuring-related expenses (n) N/A 0 % 1 % 0 % 1 % 0 % Impact from acquisition and divestiture costs (o)
Slide 28: Key Statistics and Reconciliation of Non-GAAP Measures
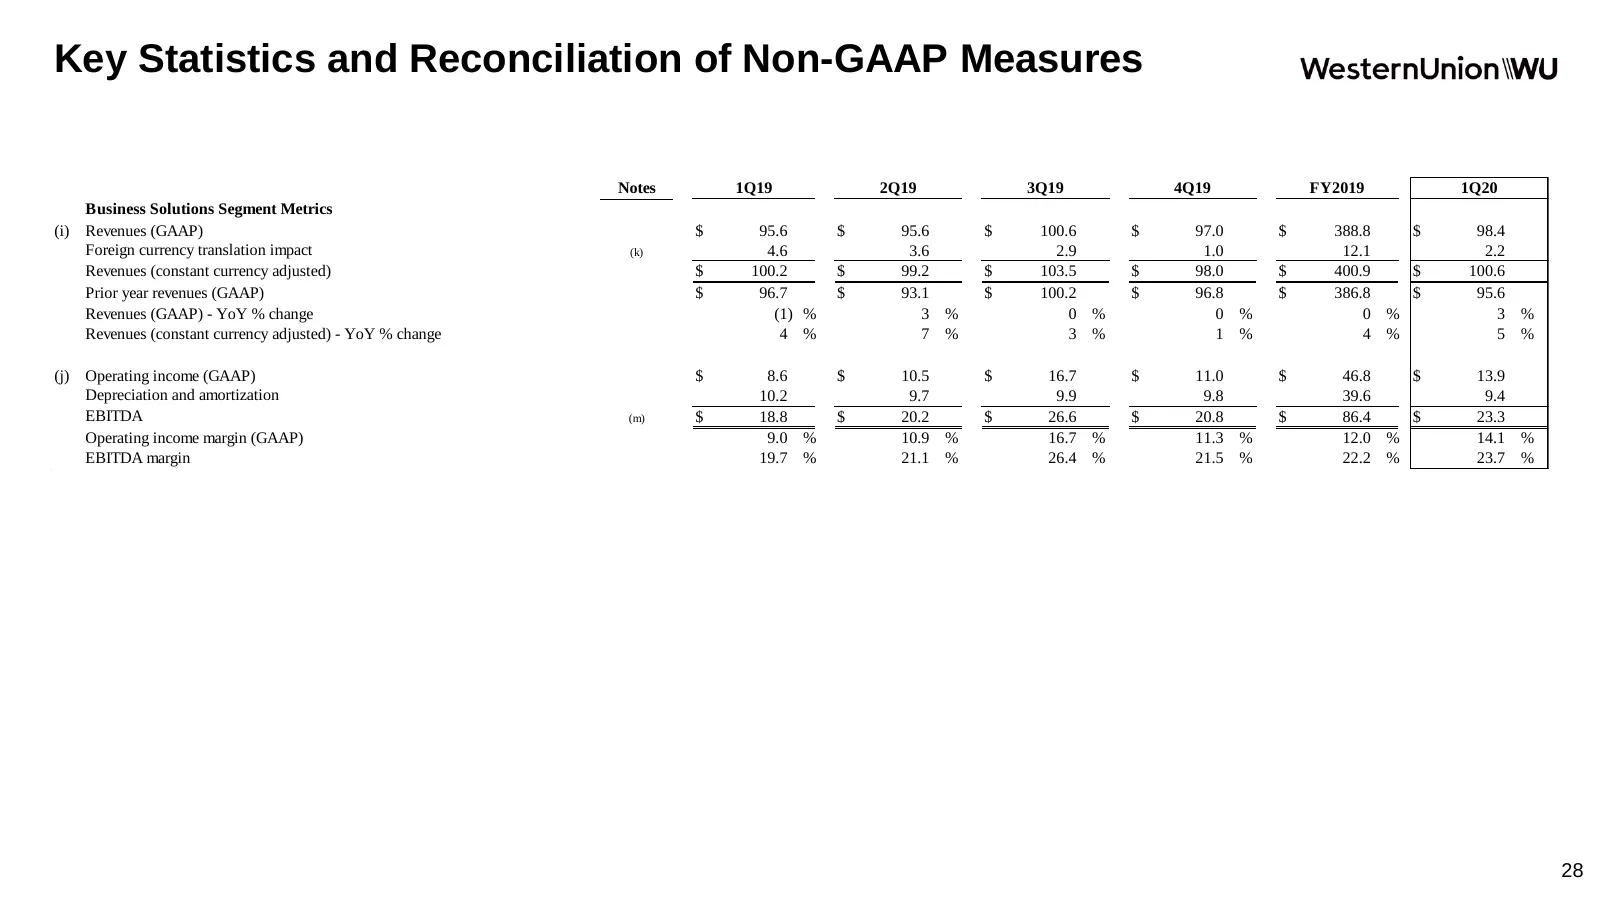
Key Statistics and Reconciliation of Non-GAAP Measures Notes 1Q19 2Q19 3Q19 4Q19 FY2019 1Q20 Business Solutions Segment Metrics (i) Revenues (GAAP) $ 95.6 $ 95.6 $ 100.6 $ 97.0 $ 388.8 $ 98.4 Foreign currency translation impact (k) 4.6 3.6 2.9 1.0 12.1 2.2 Revenues (constant currency adjusted) $ 100
Slide 29: Key Statistics and Reconciliation of Non-GAAP Measures
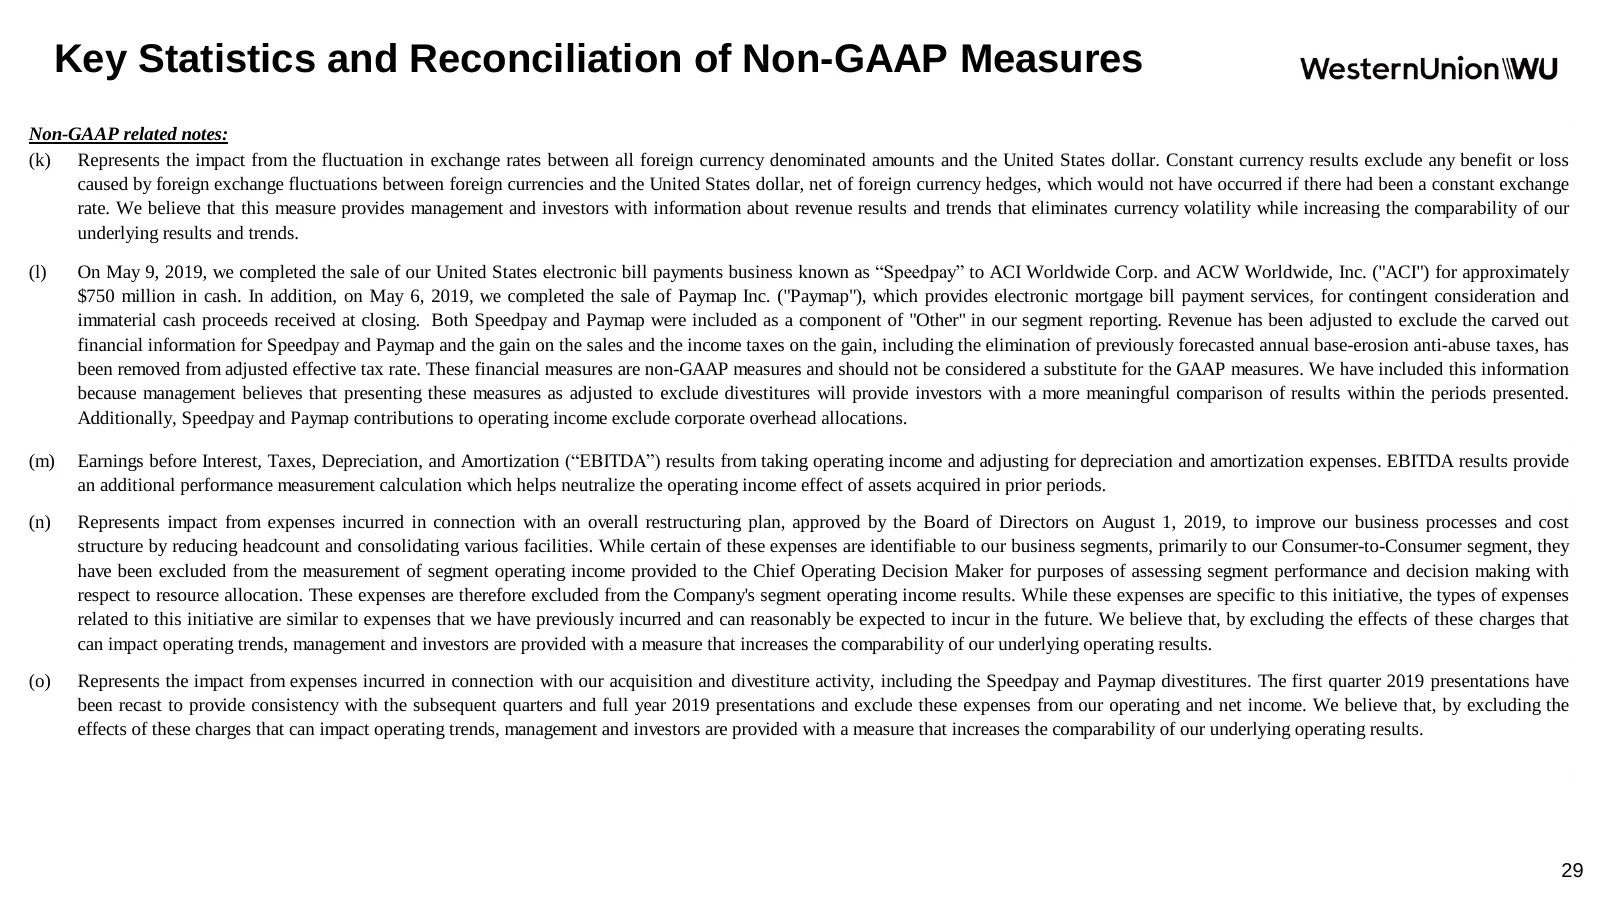
Key Statistics and Reconciliation of Non-GAAP Measures Non-GAAP related notes: (k) Represents the impact from the fluctuation in exchange rates between all foreign currency denominated amounts and the United States dollar. Constant currency results exclude any benefit or loss caused by foreign excha
Source: company website
More decks from Western Union Company (the)
 Q3 2026 Earnings Presentation33 slides · Nov 4, 2026
 Shareholder Meeting (April 2026)20 slides · Apr 28, 2026
 Q1 2026 Earnings Presentation38 slides · Apr 24, 2026
 Q4 2025 Earnings Presentation41 slides · Feb 20, 2026
 Investor Day (November 2025)135 slides · Nov 6, 2025
 Investor Day (November 2025)134 slides · Nov 6, 2025