Science Group PLC · LSE:SAG
Science — FY2022 Earnings Presentation
16 slides from Science's earnings presentation, Mar 21, 2023
Slide 1: 2022 Preliminary Results
2022 Preliminary Results Martyn Ratcliffe Executive Chair – Dan Edwards Group Managing Director – Jon Brett Group Finance Director To be read in conjunction with the audited preliminary results announcement released on 21 March 2023 In addition to IFRS measures, alternative performance measures are
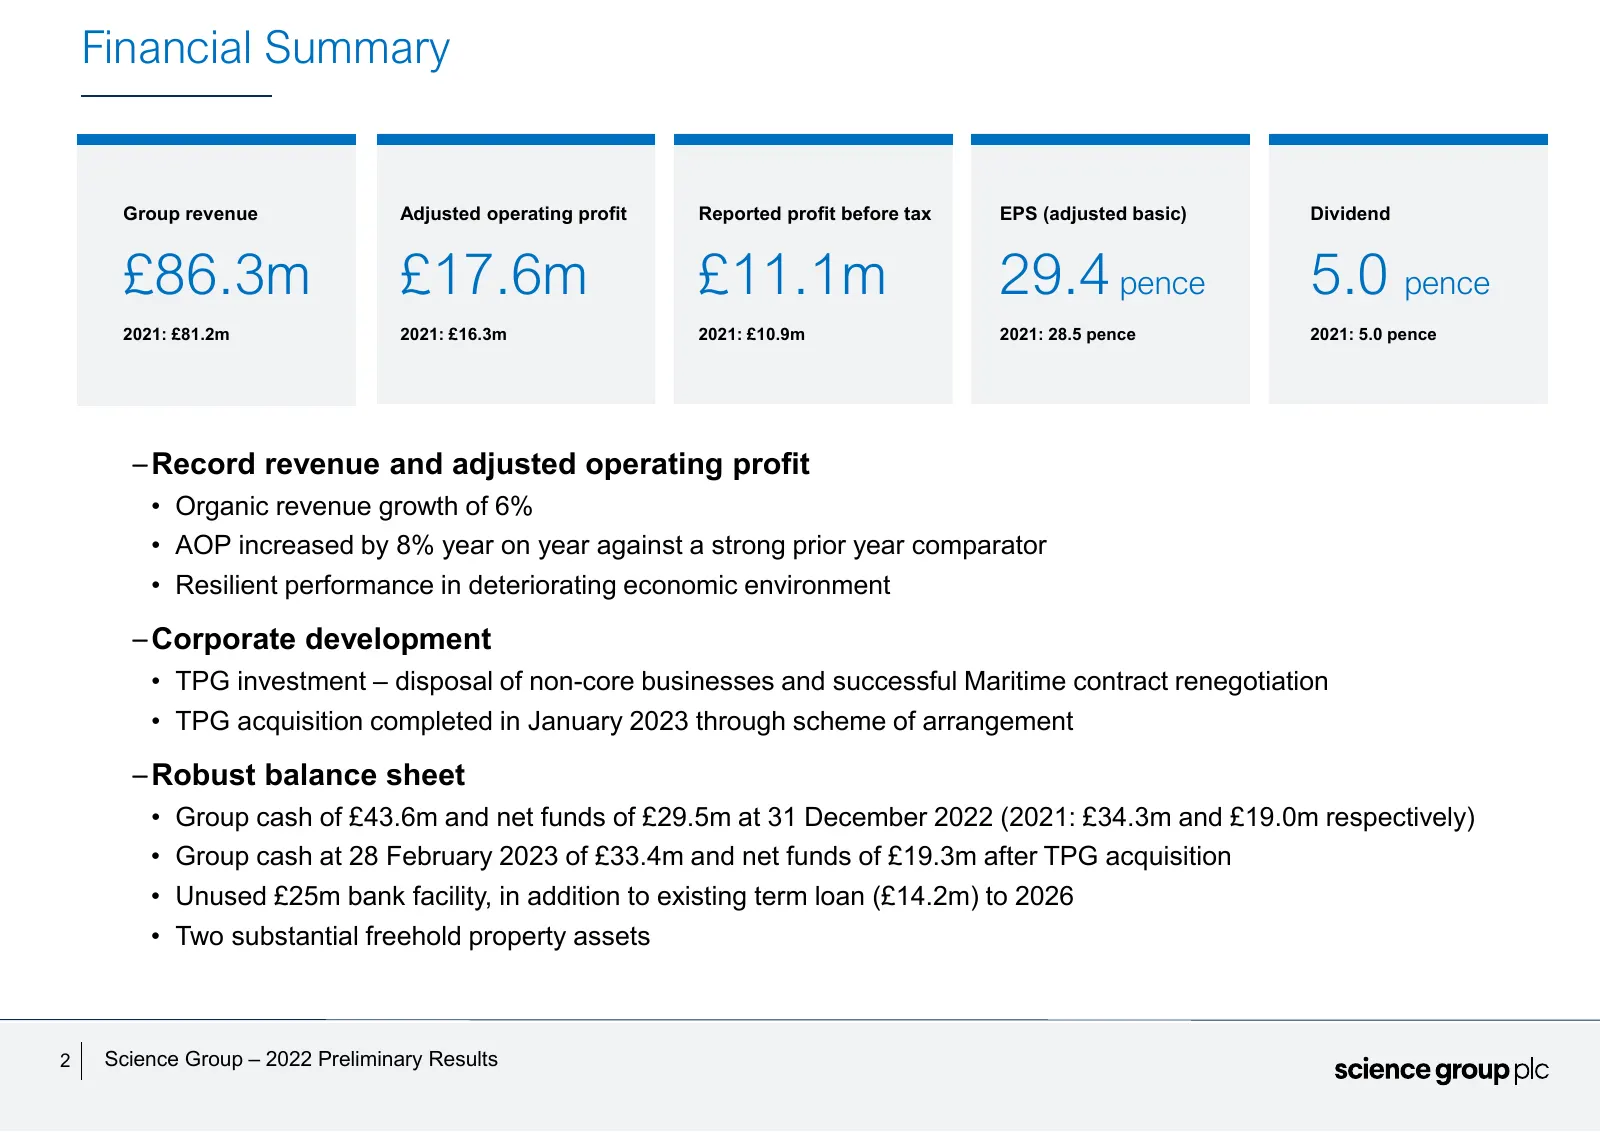
Slide 2: Financial Summary
Financial Summary Group revenue Adjusted operating profit Reported profit before tax EPS (adjusted basic) Dividend £86.3m £17.6m £11.1m 29.4 pence 5.0 pence 2021: £81.2m 2021: £16.3m 2021: £10.9m 2021: 28.5 pence 2021: 5.0 pence – Record revenue and adjusted operating profit • Organic revenue growth
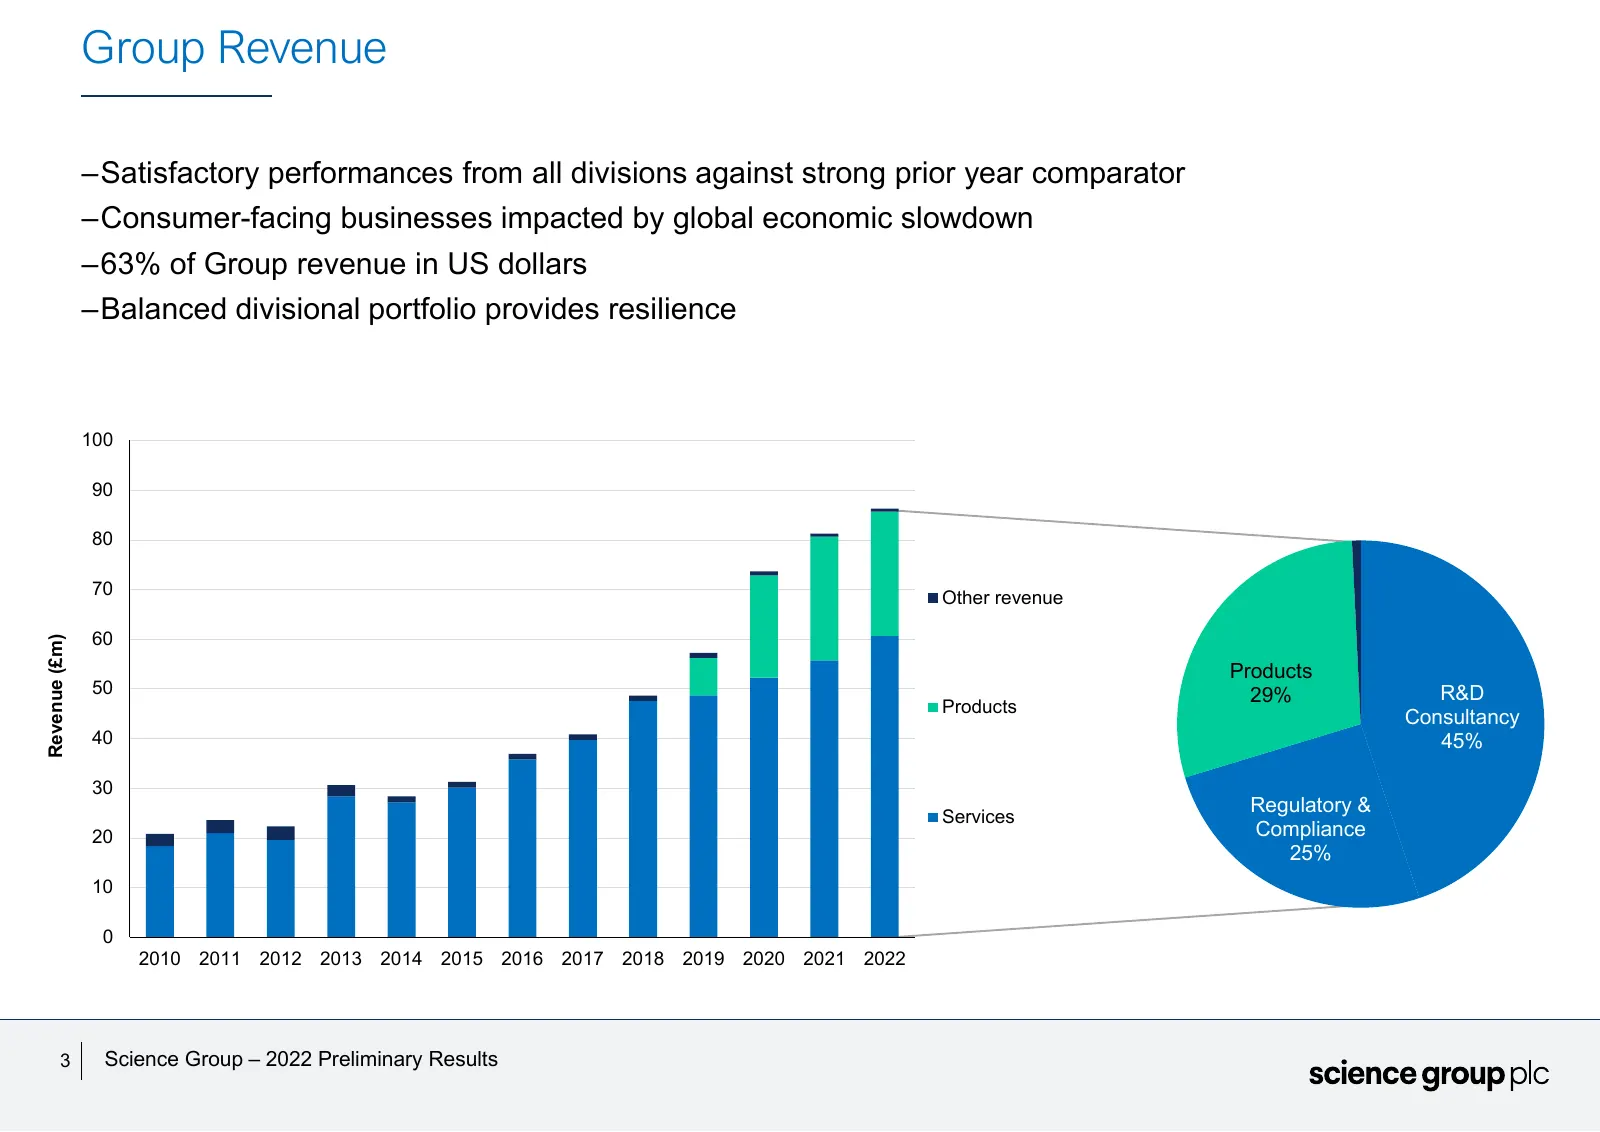
Slide 3: Group Revenue
Group Revenue –Satisfactory performances from all divisions against strong prior year comparator –Consumer-facing businesses impacted by global economic slowdown –63% of Group revenue in US dollars –Balanced divisional portfolio provides resilience 100 90 80 70 Other revenue 60 Revenue (£m) Products
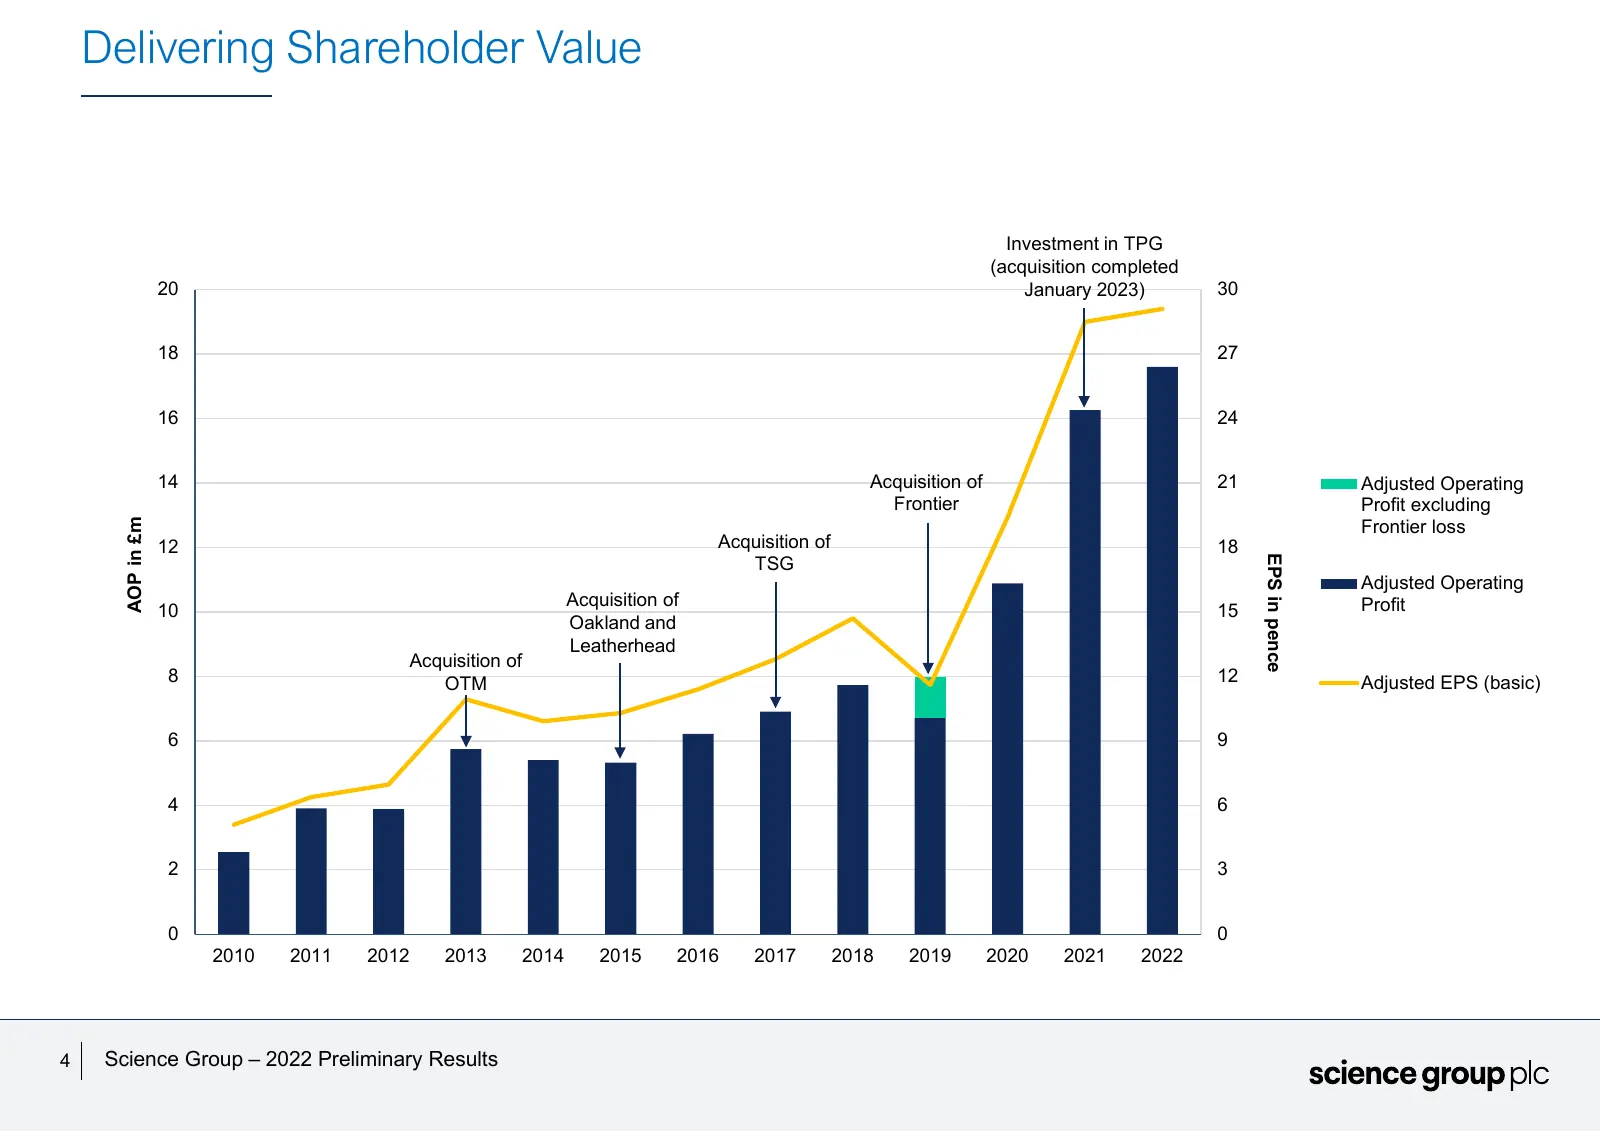
Slide 4: Delivering Shareholder Value
Delivering Shareholder Value Investment in TPG (acquisition completed 20 January 2023) 30 18 27 16 24 14 Acquisition of 21 Adjusted Operating Frontier Profit excluding Frontier loss AOP in £m 12 Acquisition of 18 TSG EPS in pence Adjusted Operating Acquisition of Profit 10 15 Oakland and Leatherhead
Slide 5: Cash Bridge
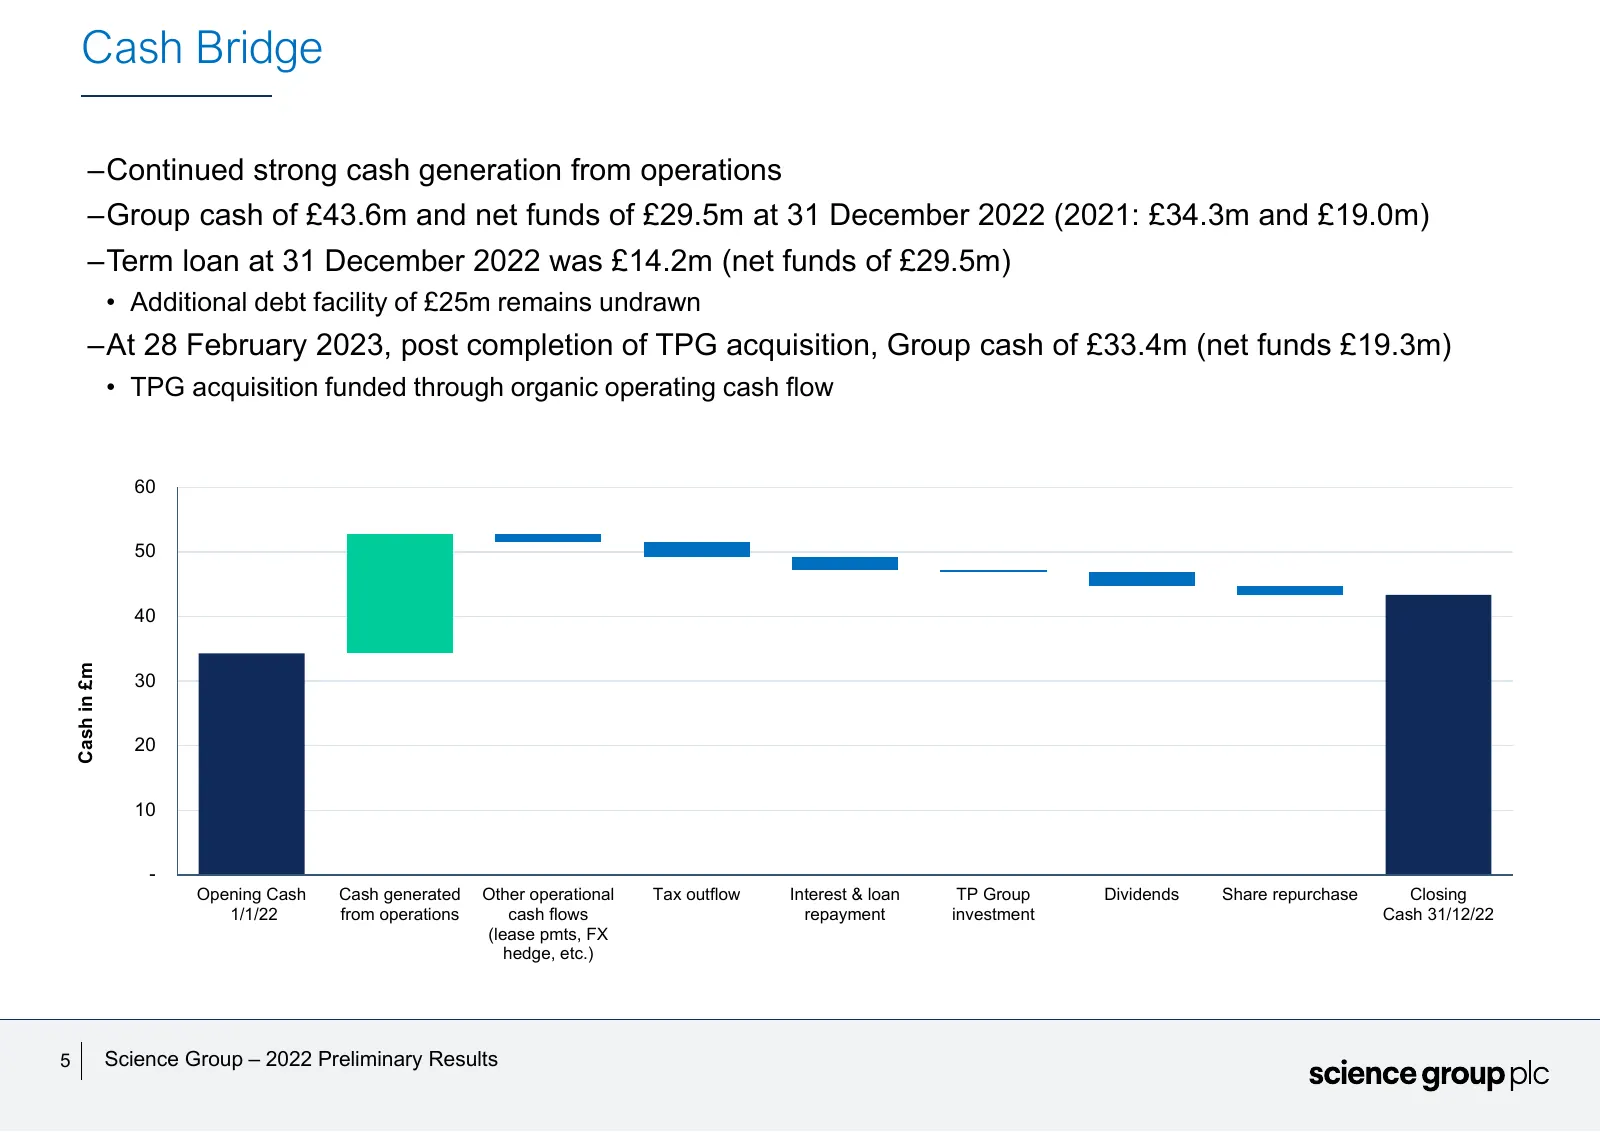
Cash Bridge –Continued strong cash generation from operations –Group cash of £43.6m and net funds of £29.5m at 31 December 2022 (2021: £34.3m and £19.0m) –Term loan at 31 December 2022 was £14.2m (net funds of £29.5m) • Additional debt facility of £25m remains undrawn –At 28 February 2023, post comp
Slide 6: Enlarged Group Overview
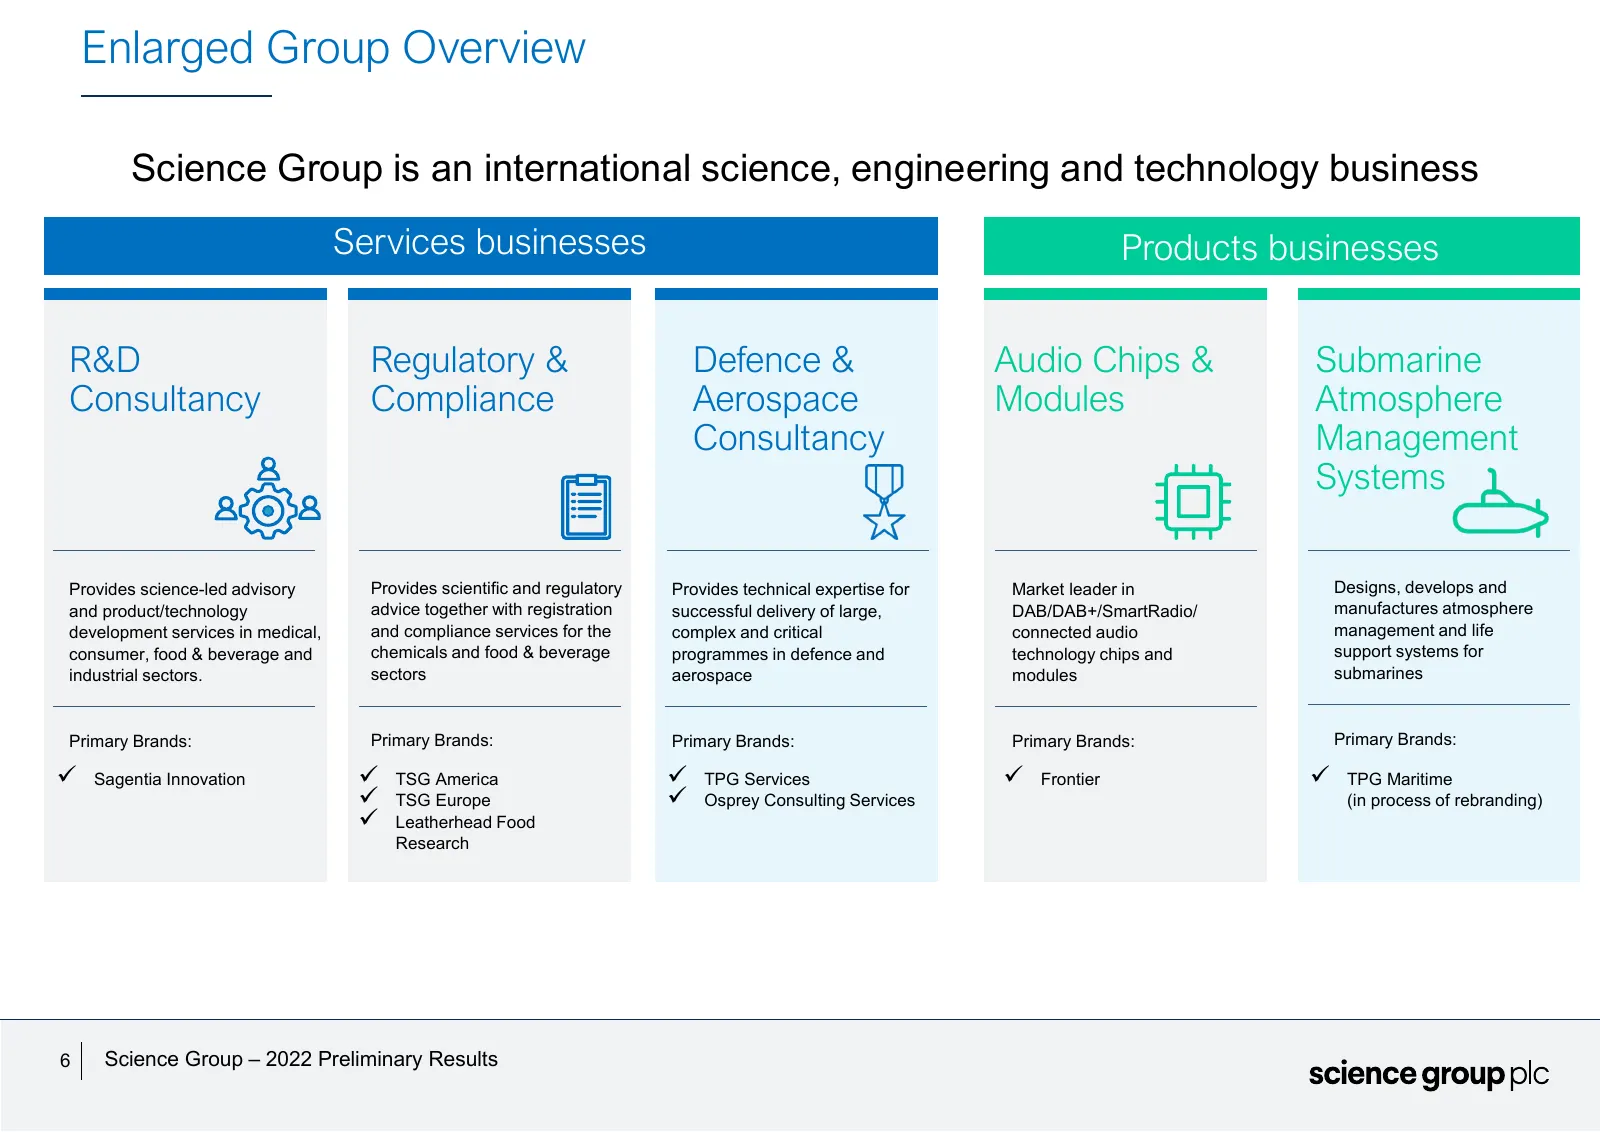
Enlarged Group Overview Science Group is an international science, engineering and technology business Services businesses Services businesses Products R&D Regulatory & Defence & Audio Chips & Submarine Consultancy Compliance Aerospace Modules Atmosphere Consultancy Management Systems Provides scien
Slide 7: Services
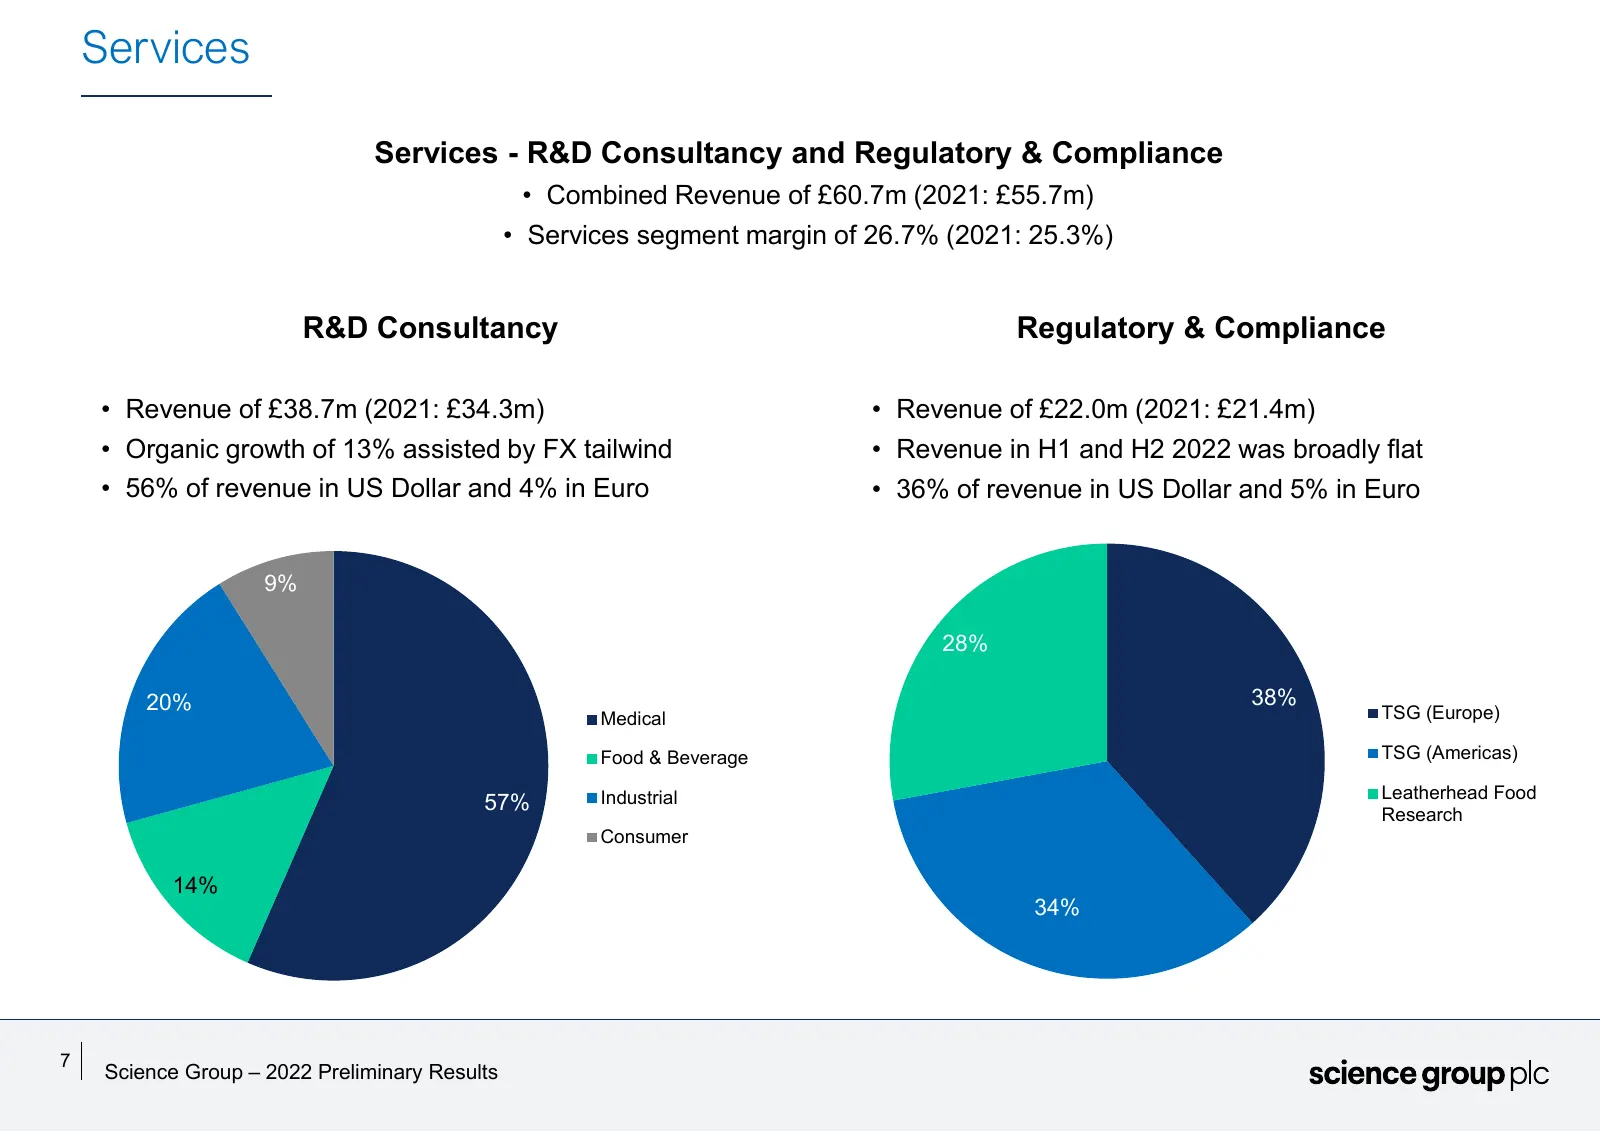
Services Services - R&D Consultancy and Regulatory & Compliance • Combined Revenue of £60.7m (2021: £55.7m) • Services segment margin of 26.7% (2021: 25.3%) R&D Consultancy Regulatory & Compliance • Revenue of £38.7m (2021: £34.3m) • Revenue of £22.0m (2021: £21.4m) • Organic growth of 13% assisted
Slide 8: Frontier Smart Technologies
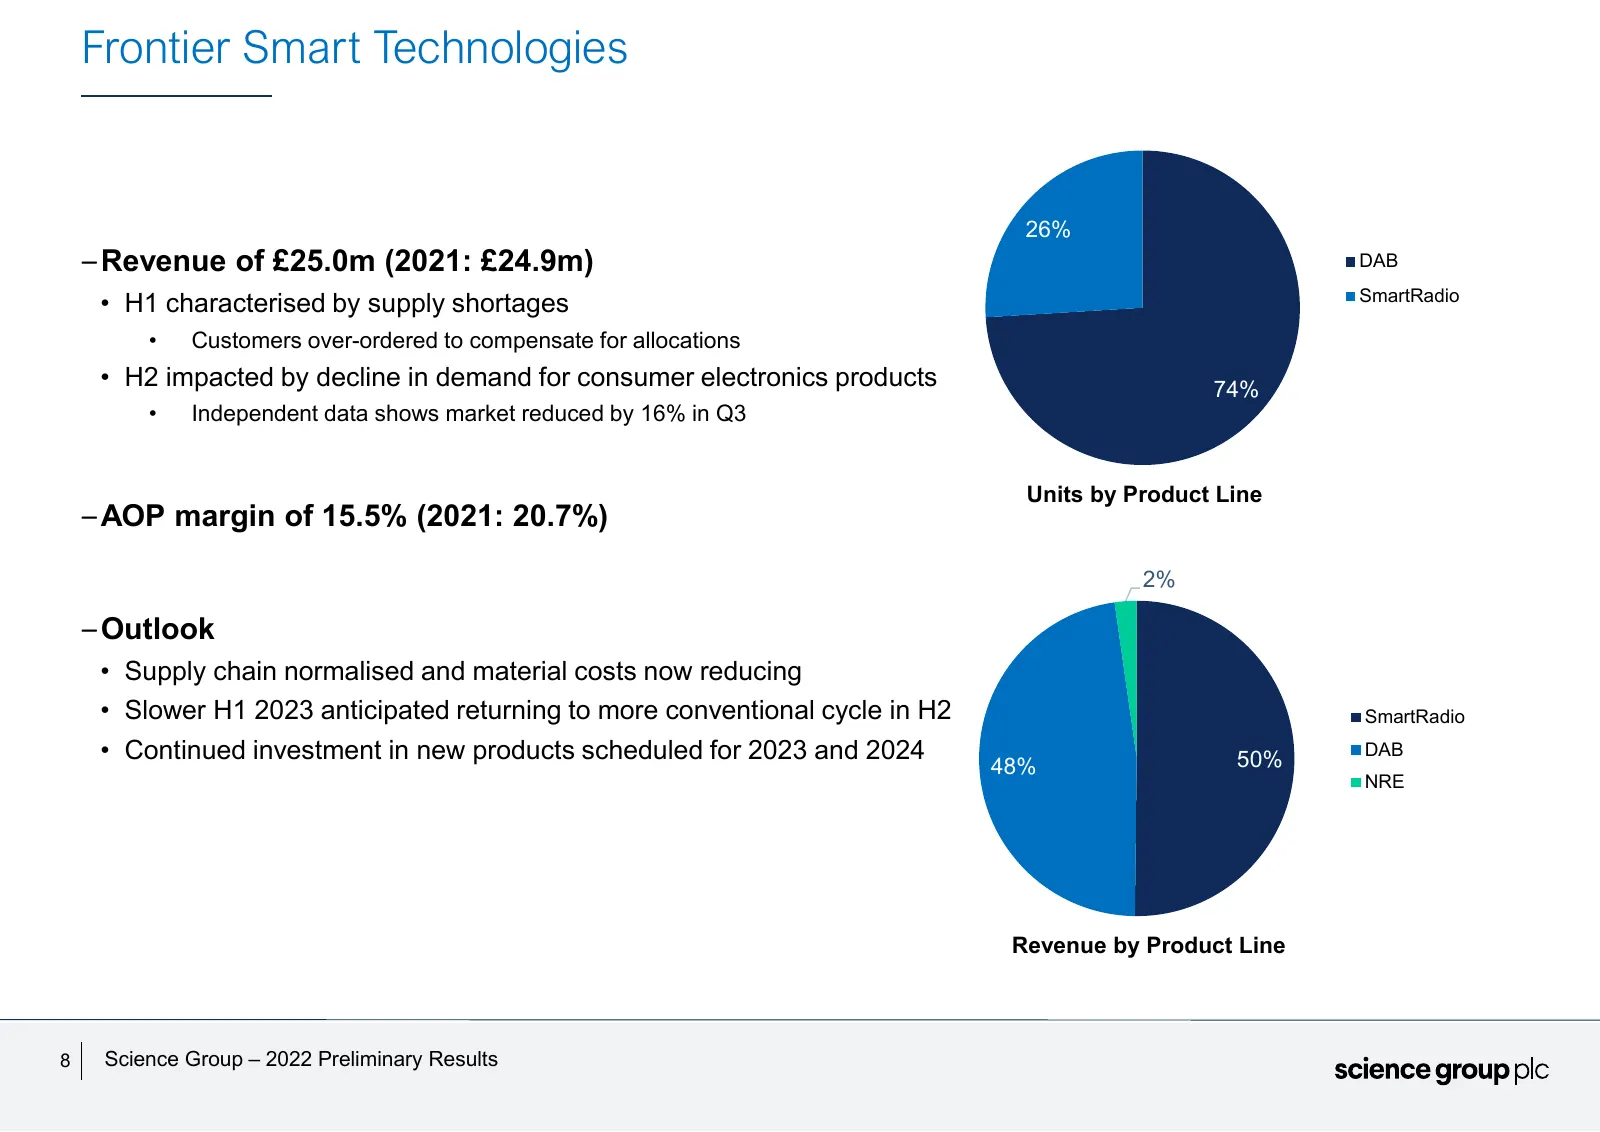
Frontier Smart Technologies 26% – Revenue of £25.0m (2021: £24.9m) DAB SmartRadio • H1 characterised by supply shortages • Customers over-ordered to compensate for allocations • H2 impacted by decline in demand for consumer electronics products 74% • Independent data shows market reduced by 16% in Q
Slide 9: TP Group
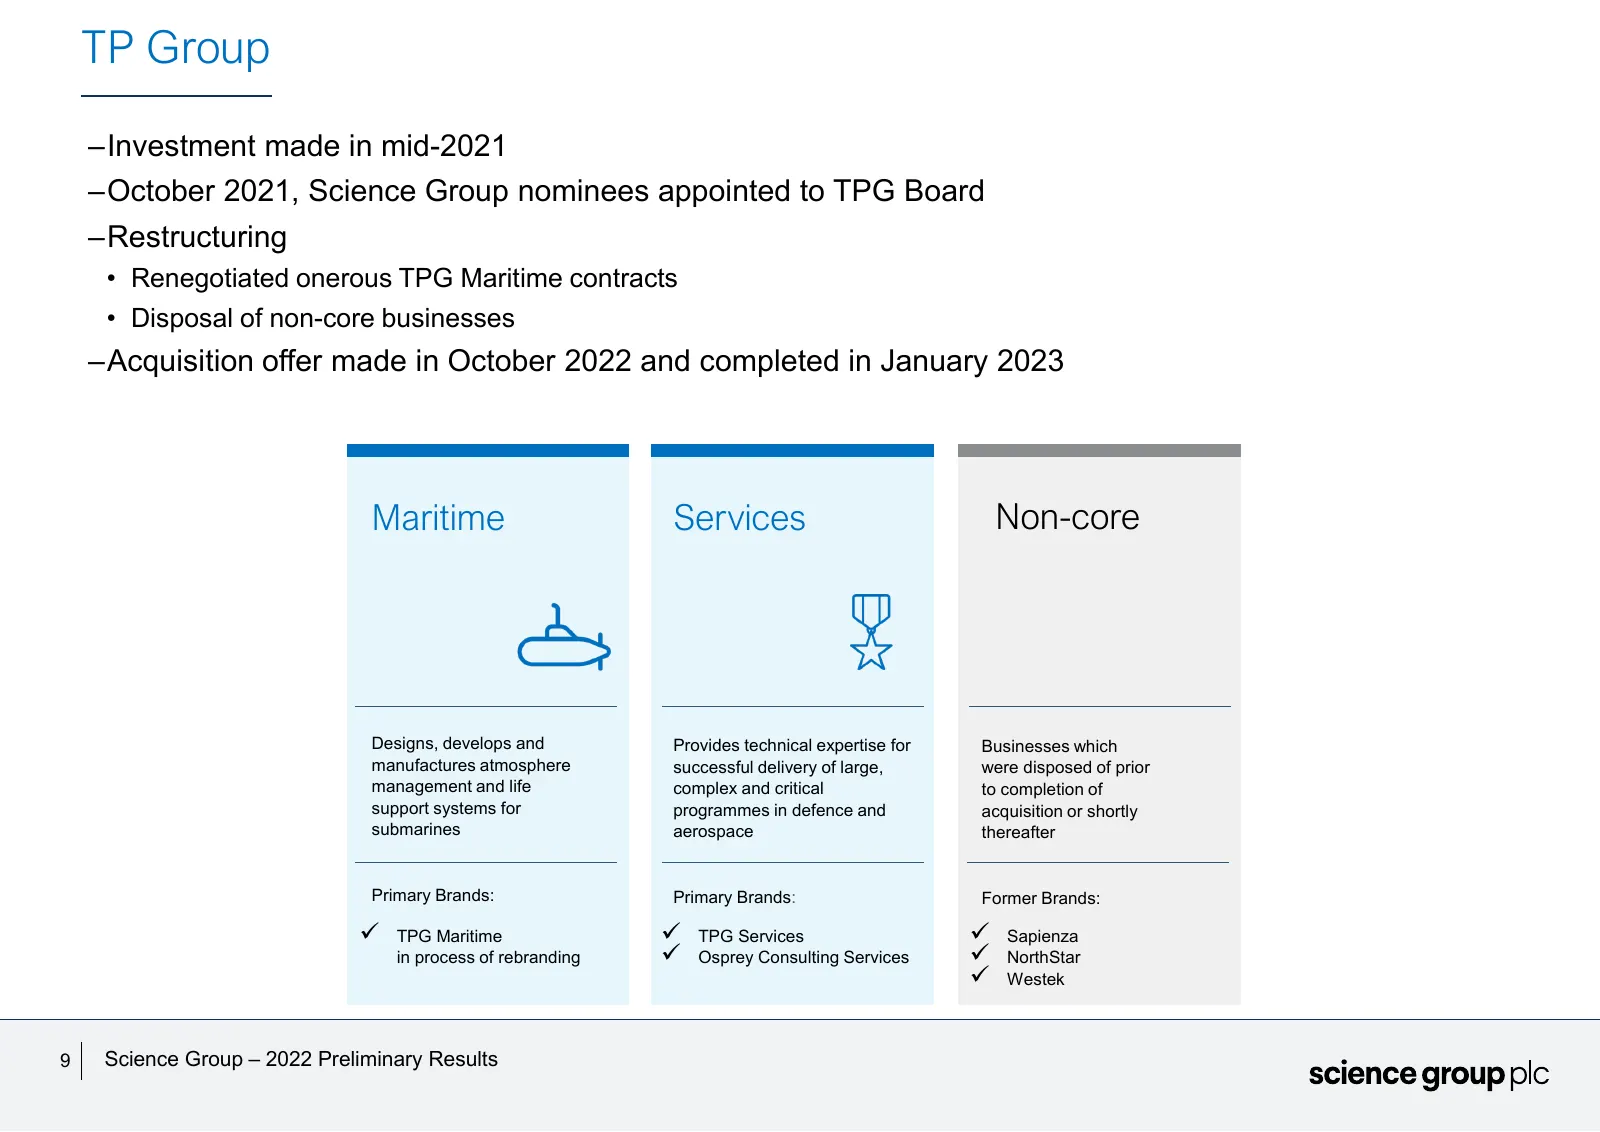
TP Group –Investment made in mid-2021 –October 2021, Science Group nominees appointed to TPG Board –Restructuring • Renegotiated onerous TPG Maritime contracts • Disposal of non-core businesses –Acquisition offer made in October 2022 and completed in January 2023 Maritime Services Non-core Designs,
Slide 10: ESG
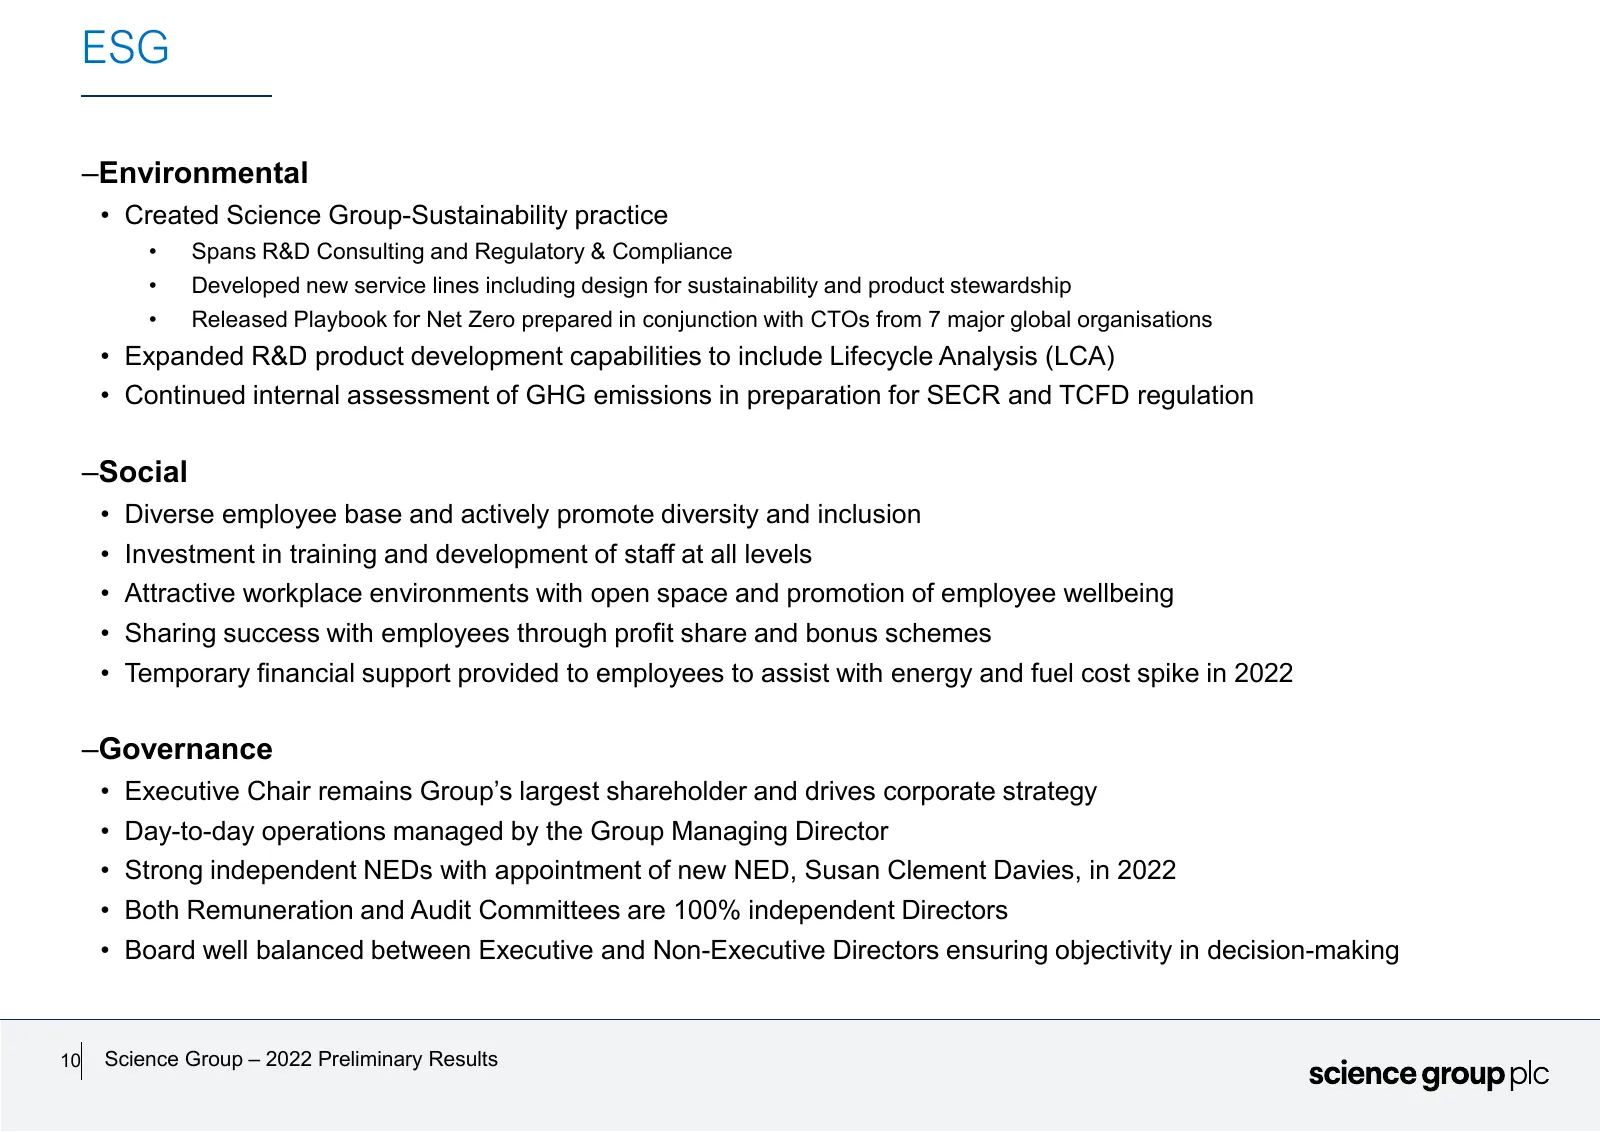
ESG –Environmental • Created Science Group-Sustainability practice • Spans R&D Consulting and Regulatory & Compliance • Developed new service lines including design for sustainability and product stewardship • Released Playbook for Net Zero prepared in conjunction with CTOs from 7 major global organ
Slide 11: Corporation Tax
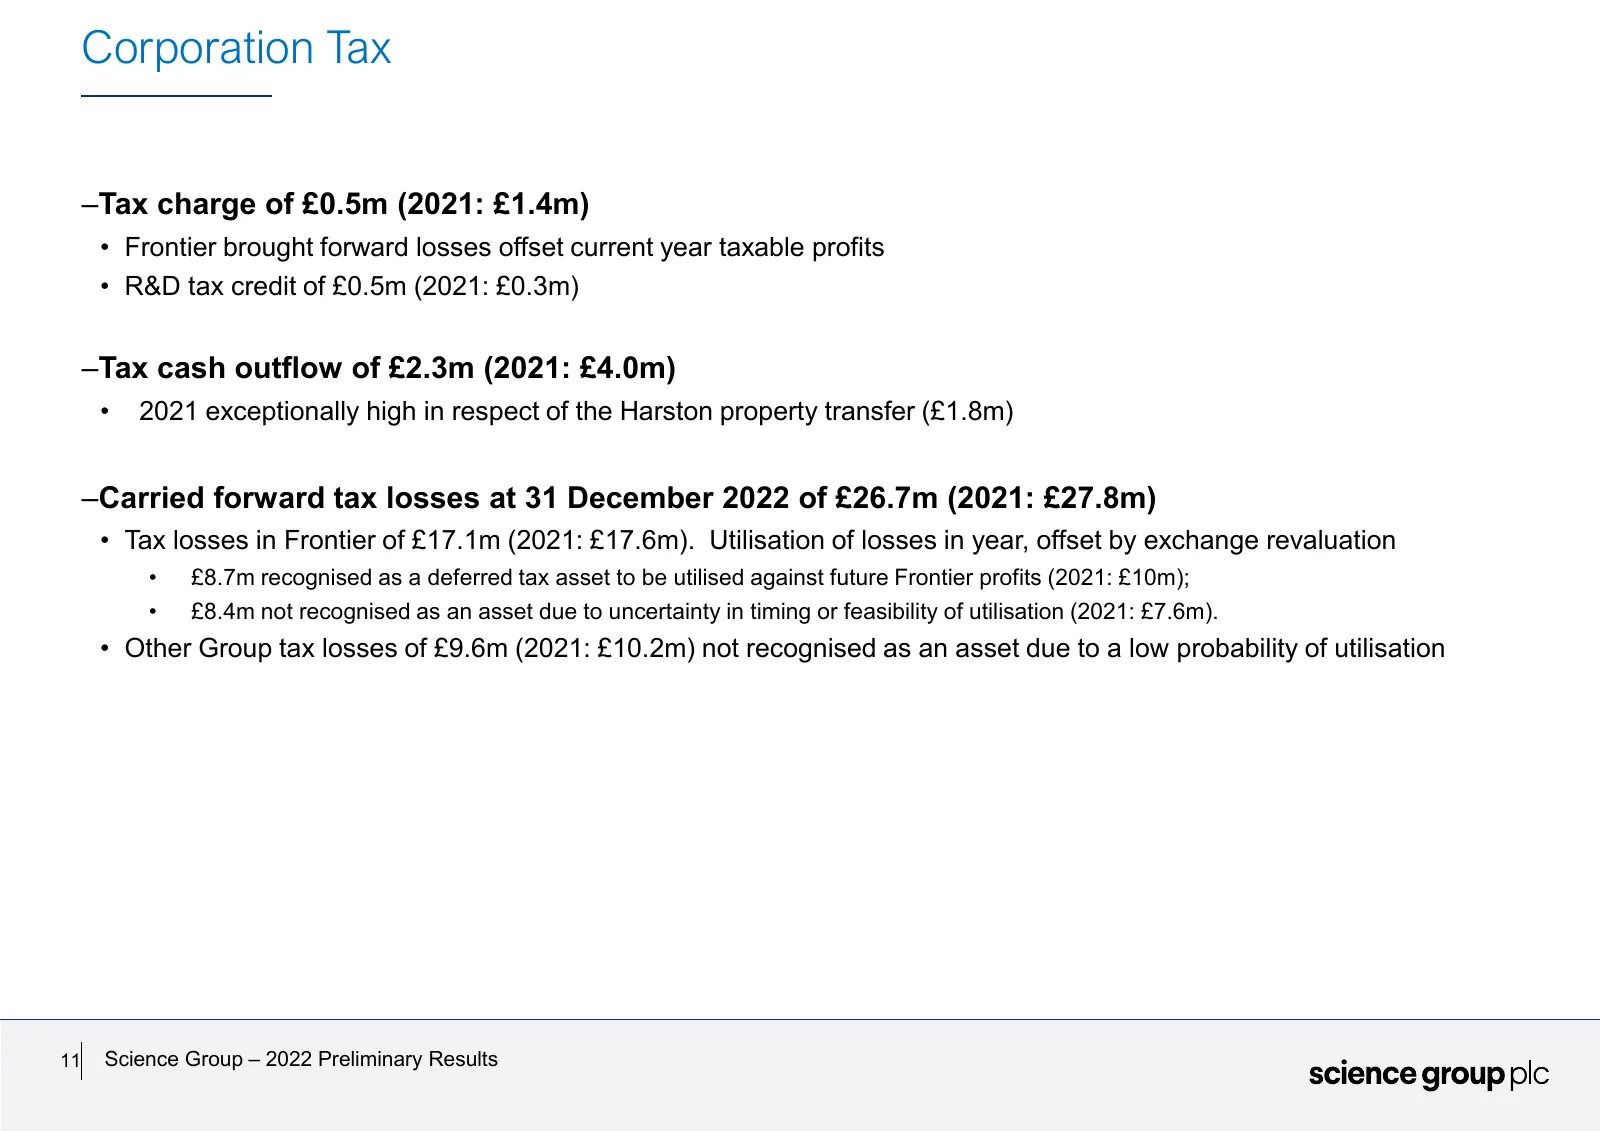
Corporation Tax –Tax charge of £0.5m (2021: £1.4m) • Frontier brought forward losses offset current year taxable profits • R&D tax credit of £0.5m (2021: £0.3m) –Tax cash outflow of £2.3m (2021: £4.0m) • 2021 exceptionally high in respect of the Harston property transfer (£1.8m) –Carried forward tax
Slide 12: Appendix: Annual Review of Capital Sources & Allocation
Appendix Annual Review of Capital Sources & Allocation 12 Science Group – 2022 Preliminary Results
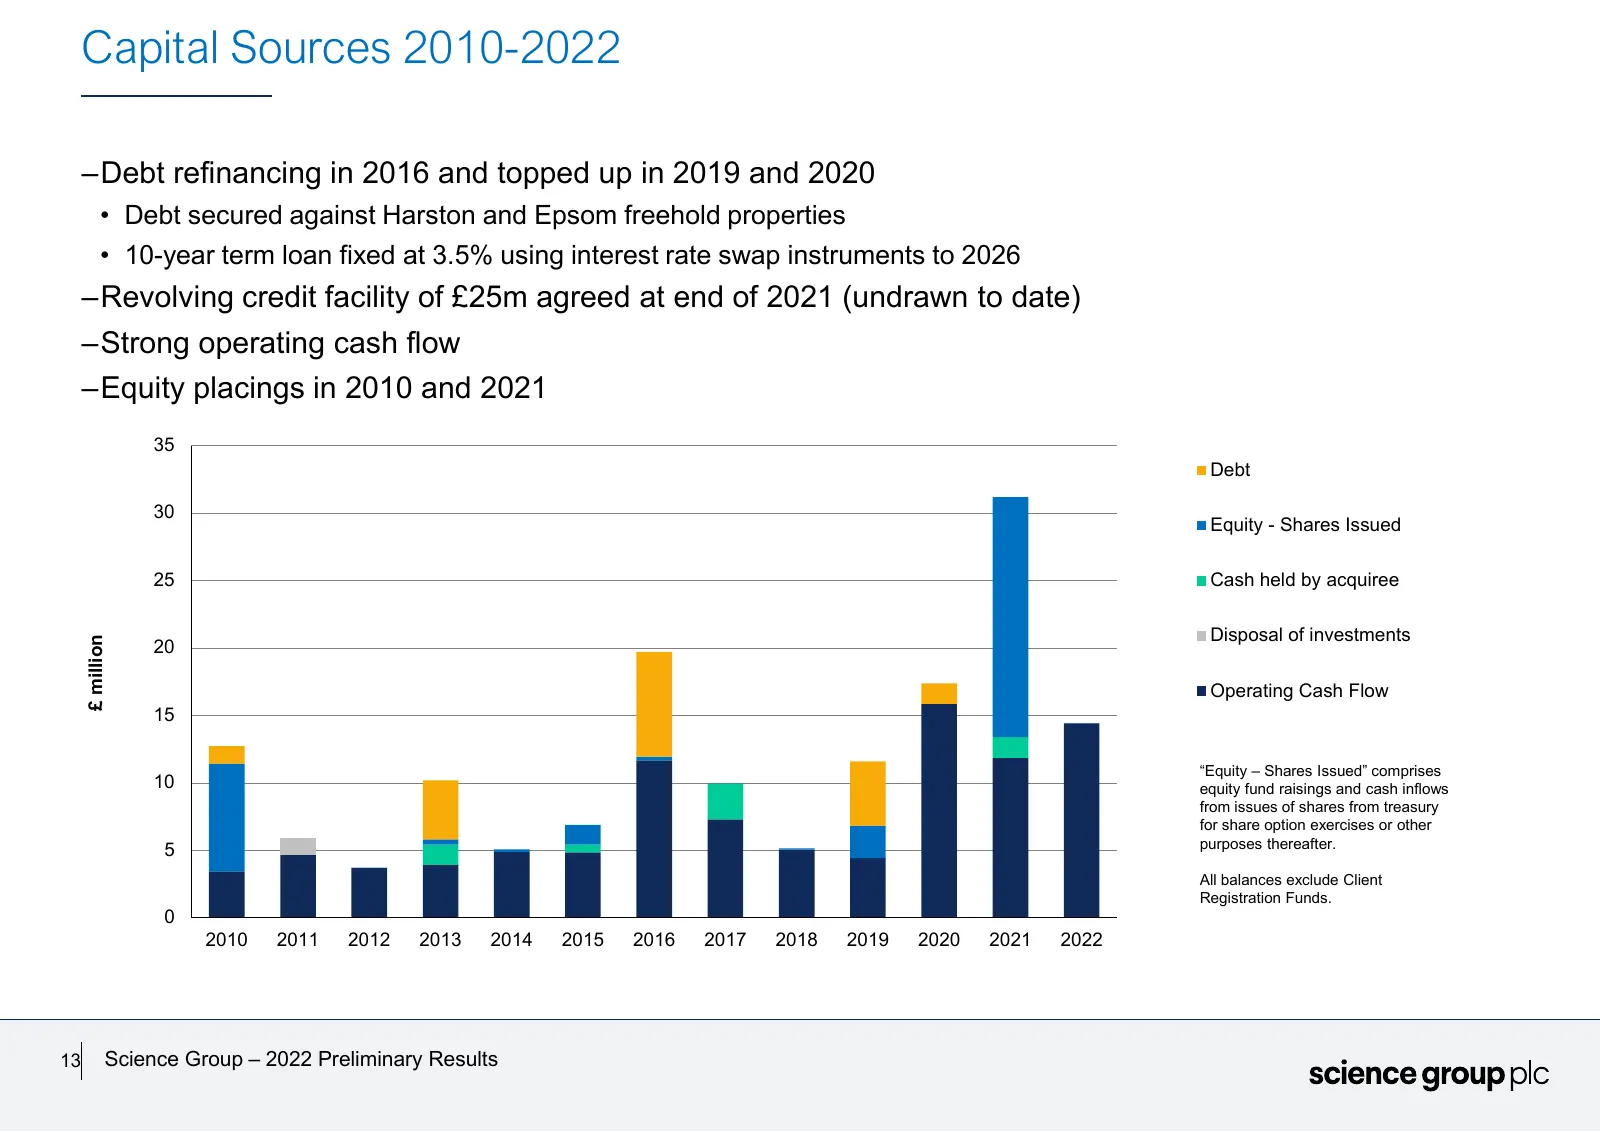
Slide 13: Capital Sources 2010-2022
Capital Sources 2010-2022 –Debt refinancing in 2016 and topped up in 2019 and 2020 • Debt secured against Harston and Epsom freehold properties • 10-year term loan fixed at 3.5% using interest rate swap instruments to 2026 –Revolving credit facility of £25m agreed at end of 2021 (undrawn to date) –S
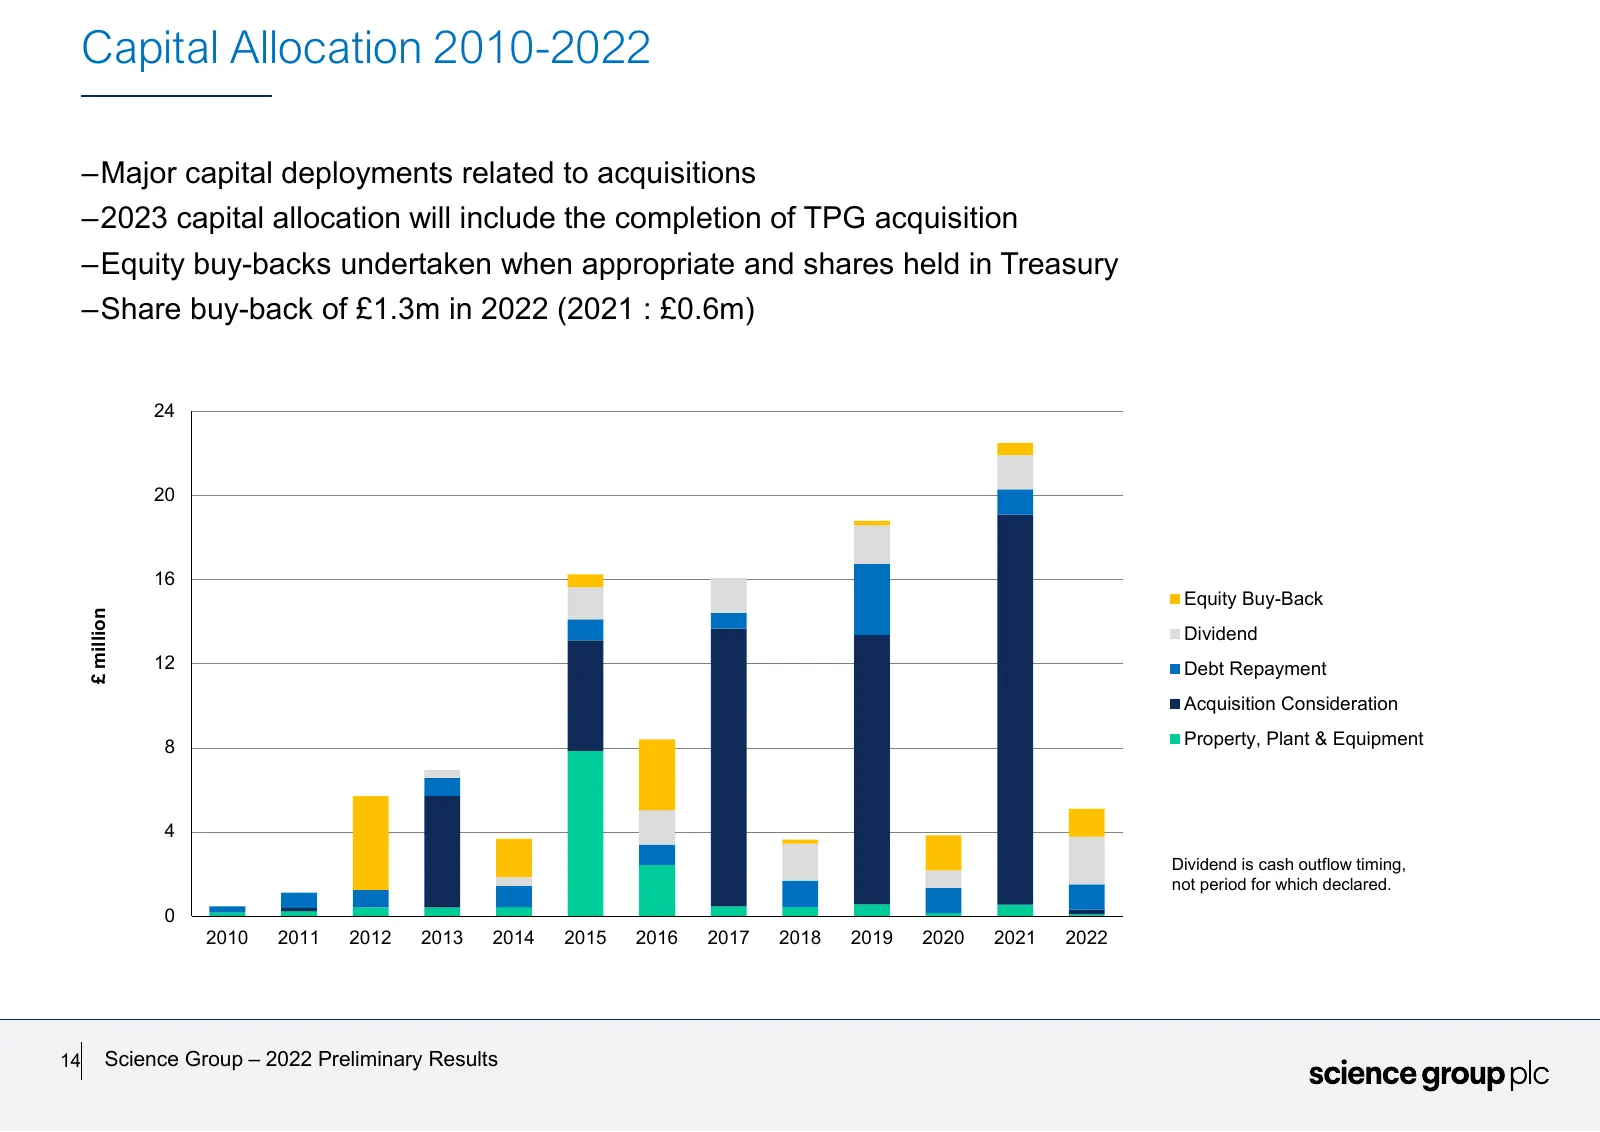
Slide 14: Capital Allocation 2010-2022
Capital Allocation 2010-2022 –Major capital deployments related to acquisitions –2023 capital allocation will include the completion of TPG acquisition –Equity buy-backs undertaken when appropriate and shares held in Treasury –Share buy-back of £1.3m in 2022 (2021 : £0.6m) 24 20 16 Equity Buy-Back £
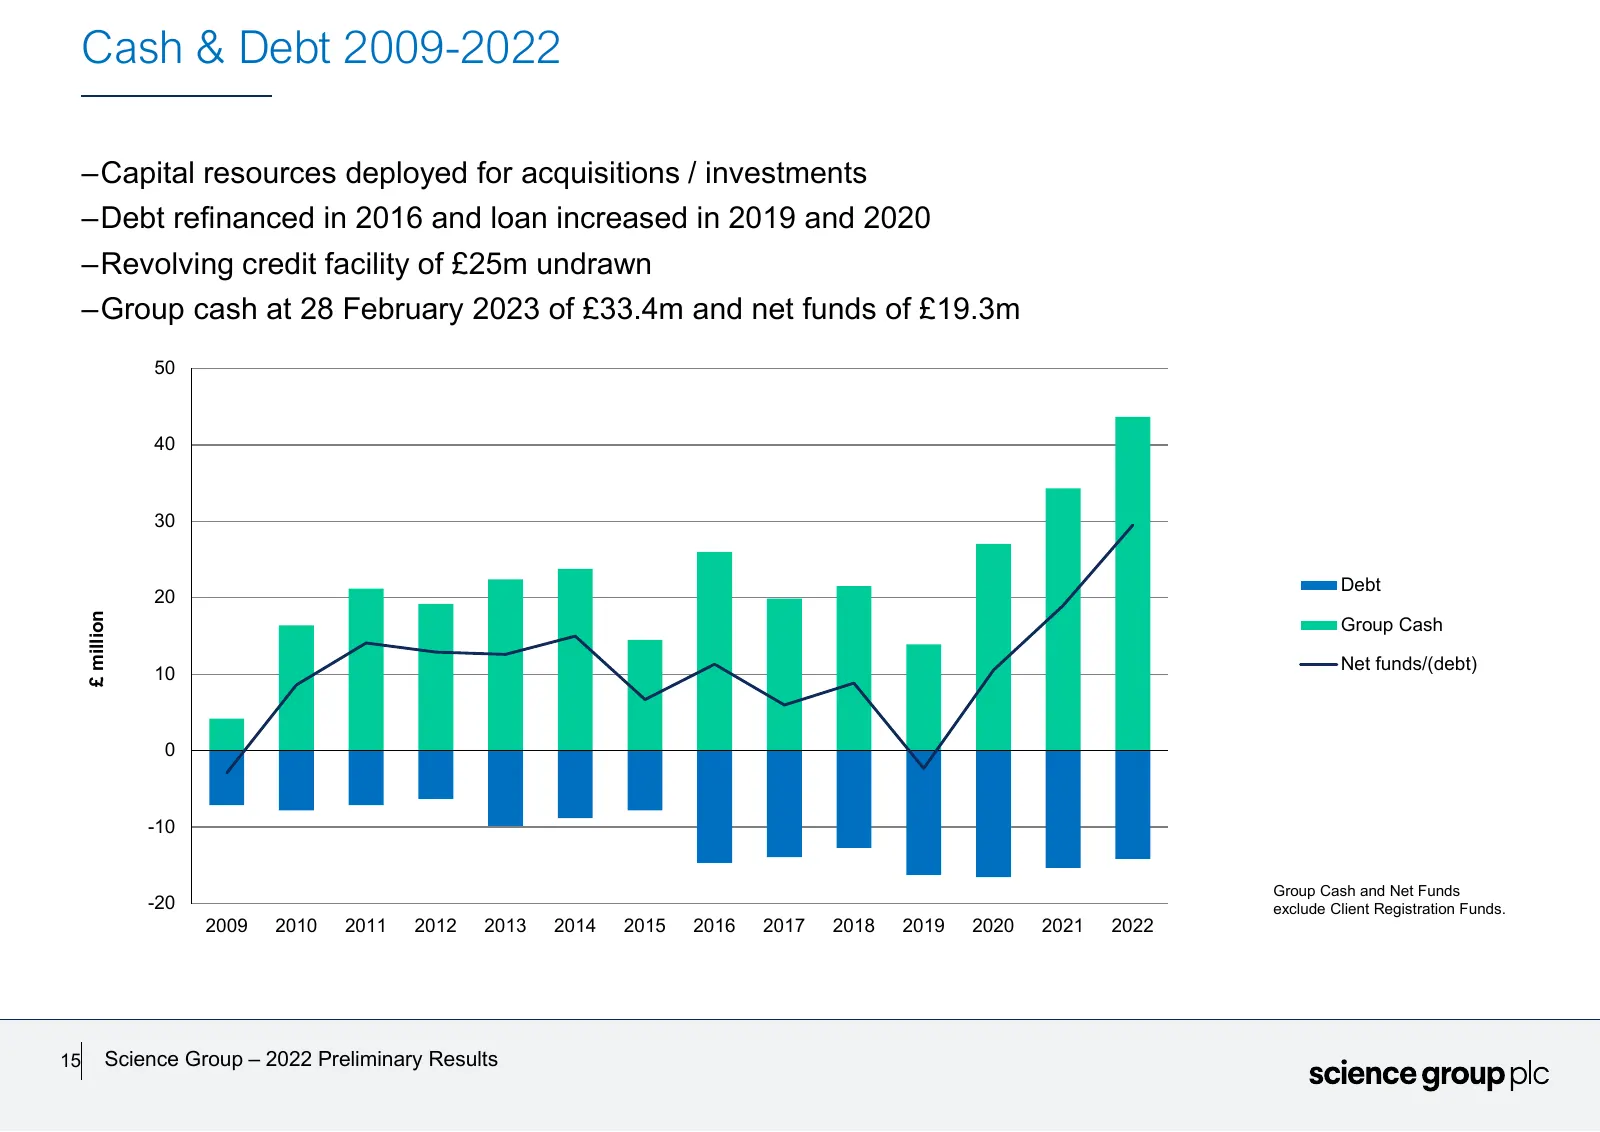
Slide 15: Cash & Debt 2009-2022
Cash & Debt 2009-2022 –Capital resources deployed for acquisitions / investments –Debt refinanced in 2016 and loan increased in 2019 and 2020 –Revolving credit facility of £25m undrawn –Group cash at 28 February 2023 of £33.4m and net funds of £19.3m 50 40 30 Debt 20 £ million Group Cash Net funds/(
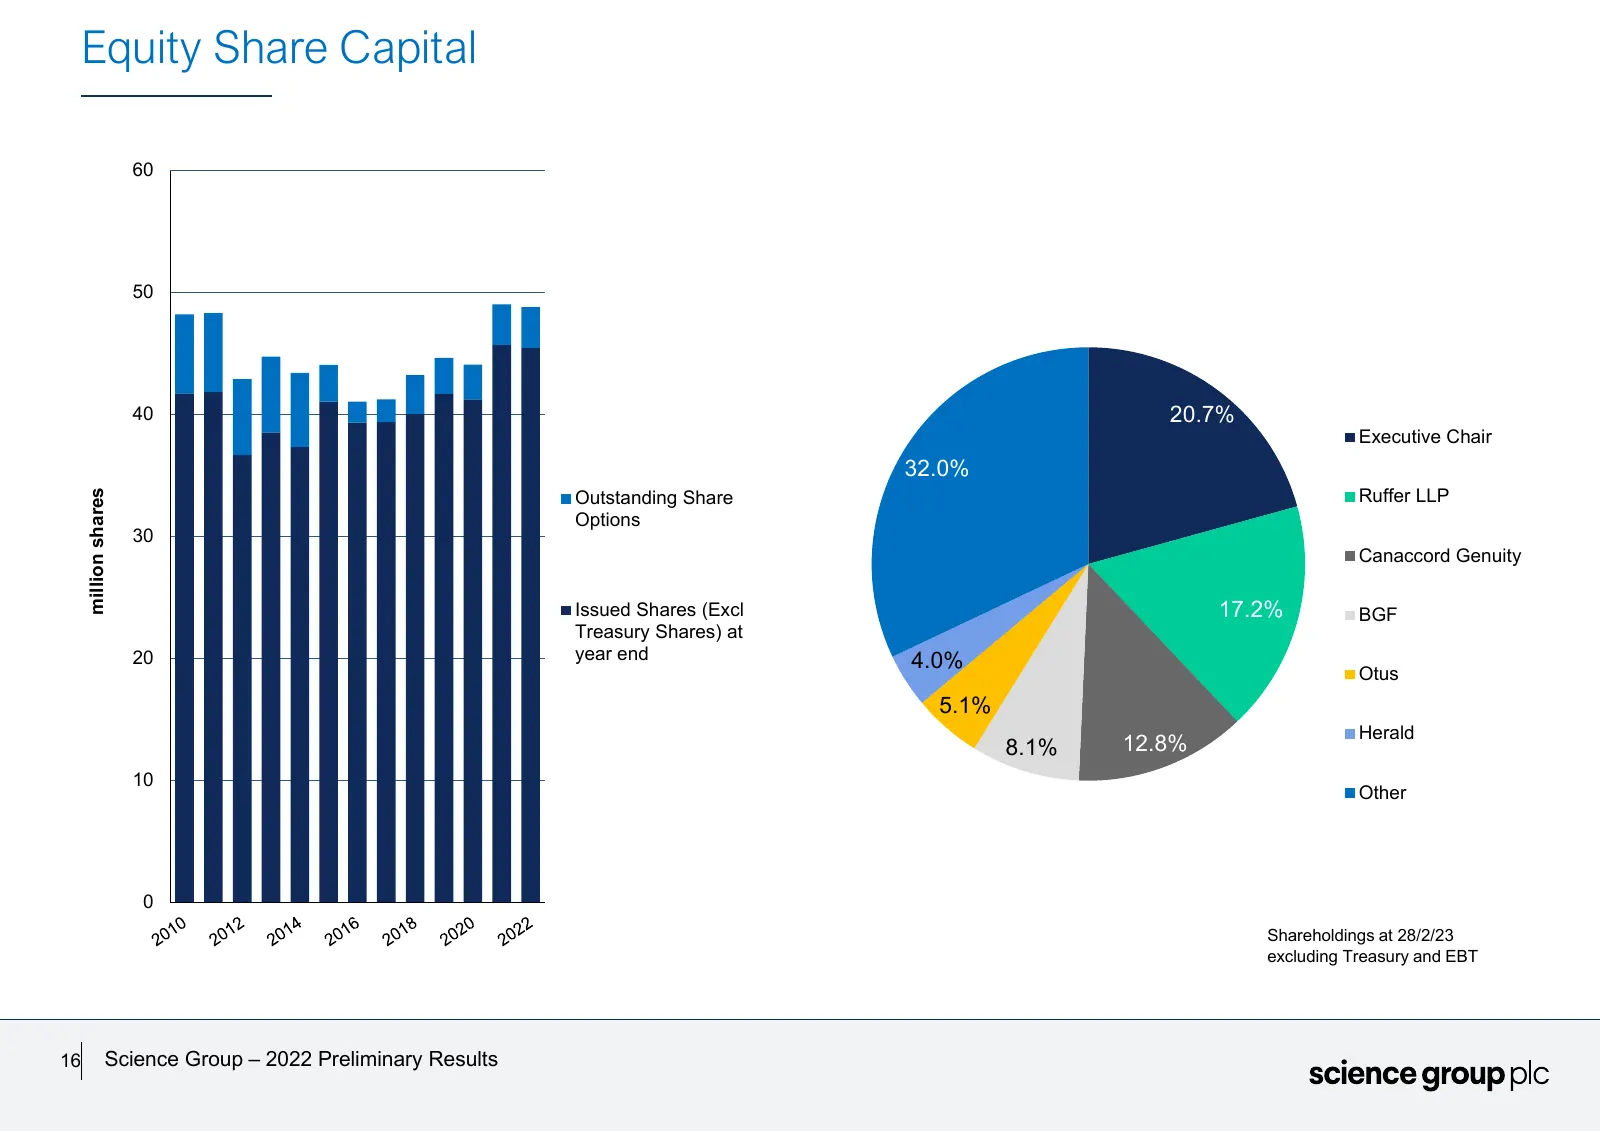
Slide 16: Equity Share Capital
Equity Share Capital 60 50 40 20.7% Executive Chair 32.0% Outstanding Share Ruffer LLP million shares Options 30 Canaccord Genuity Issued Shares (Excl 17.2% BGF Treasury Shares) at 20 year end 4.0% Otus 5.1% Herald 8.1% 12.8% 10 Other 0 Shareholdings at 28/2/23 excluding Treasury and EBT 16 Science
Source: Internet Archive copy of sciencegroup.com
More decks from Science Group PLC
 FY2025 Earnings Presentation18 slides · Mar 17, 2026
 Leatherhead Food Research — Technical Presentation (March 2026)37 slides · Mar 4, 2026
 H1 2025 Earnings Presentation12 slides · Jul 28, 2025
 FY2024 Earnings Presentation16 slides · Mar 24, 2025
 H1 2024 Earnings Presentation10 slides · Jul 23, 2024
 FY2023 Earnings Presentation19 slides · Mar 21, 2024