Science Group PLC · LSE:SAG
Science — H1 2024 Earnings Presentation
10 slides from Science's earnings presentation, Jul 23, 2024
Slide 1: 2024 Interim Results
2024 Interim Results Martyn Ratcliffe Dan Edwards Jon Brett Executive Chair Group Managing Director Group Finance Director To be read in conjunction with the Interim Results announcement released on 23 July 2024 .
Slide 2: Financial Summary
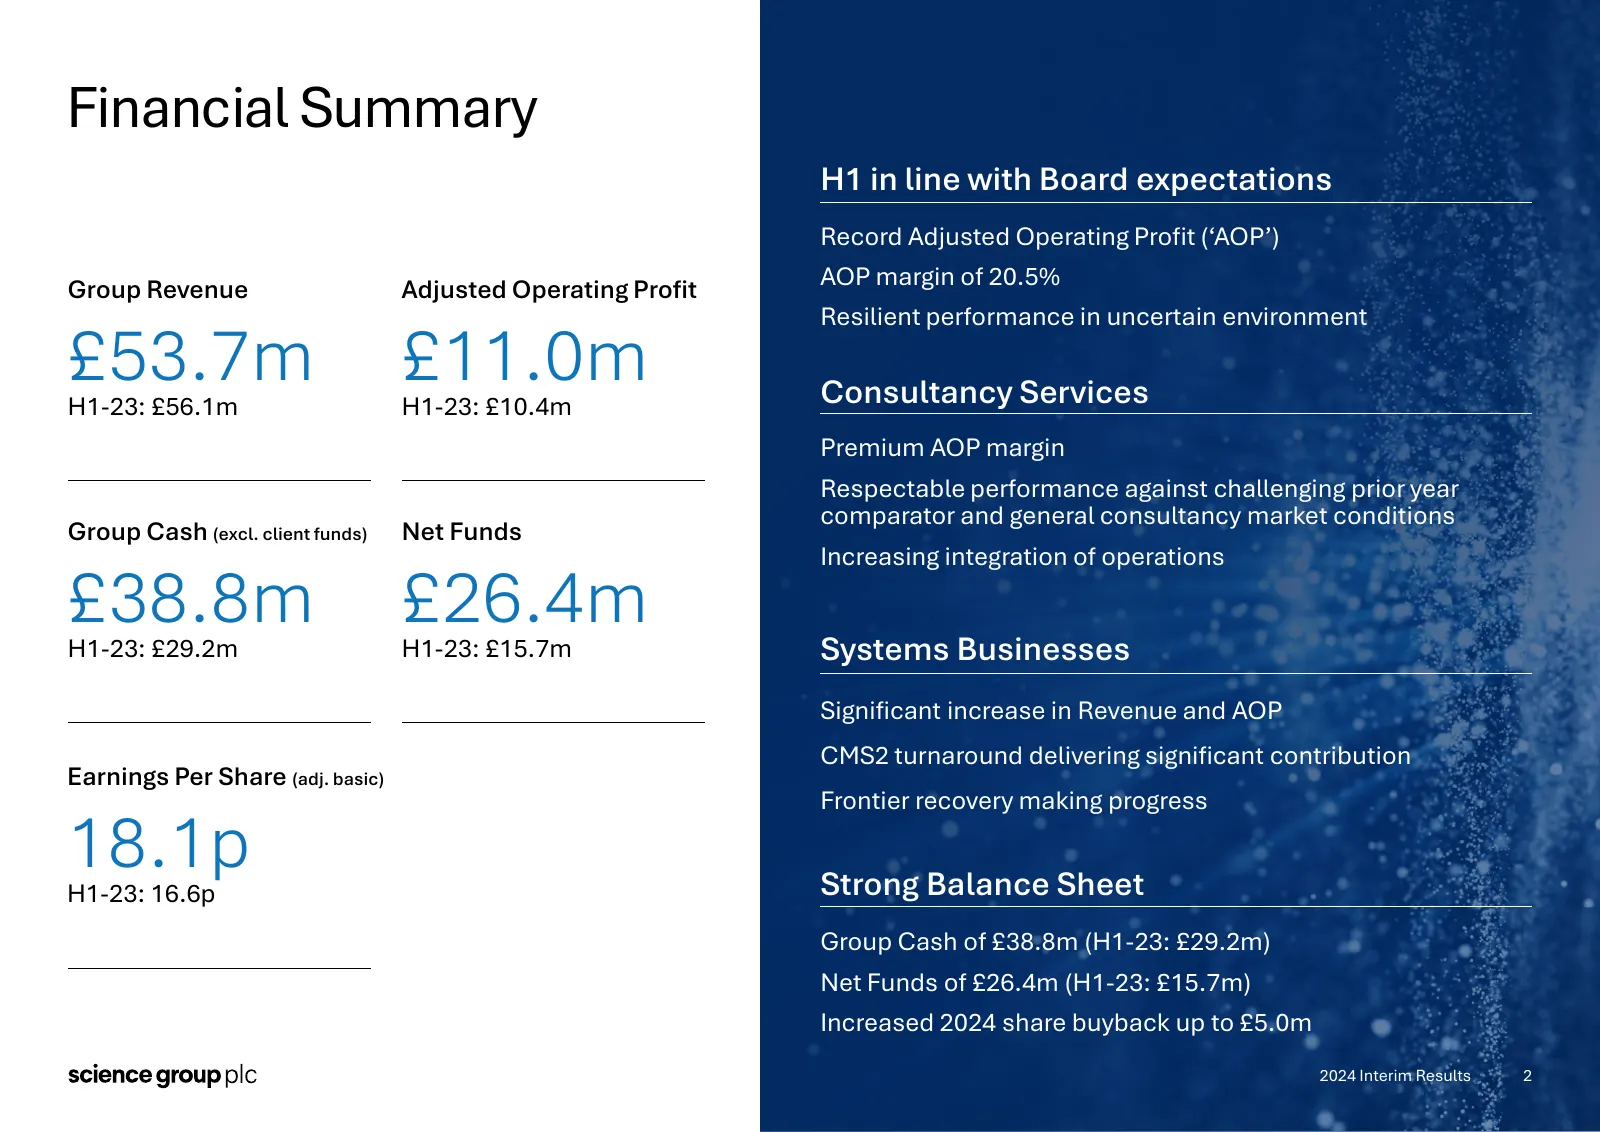
Financial Summary H1 in line with Board expectations Record Adjusted Operating Profit (‘AOP’) Group Revenue Adjusted Operating Profit AOP margin of 20.5% Resilient performance in uncertain environment £53.7m H1-23: £56.1m £11.0m H1-23: £10.4m Consultancy Services Premium AOP margin Respectable perfo
Slide 3: Group Performance Summary
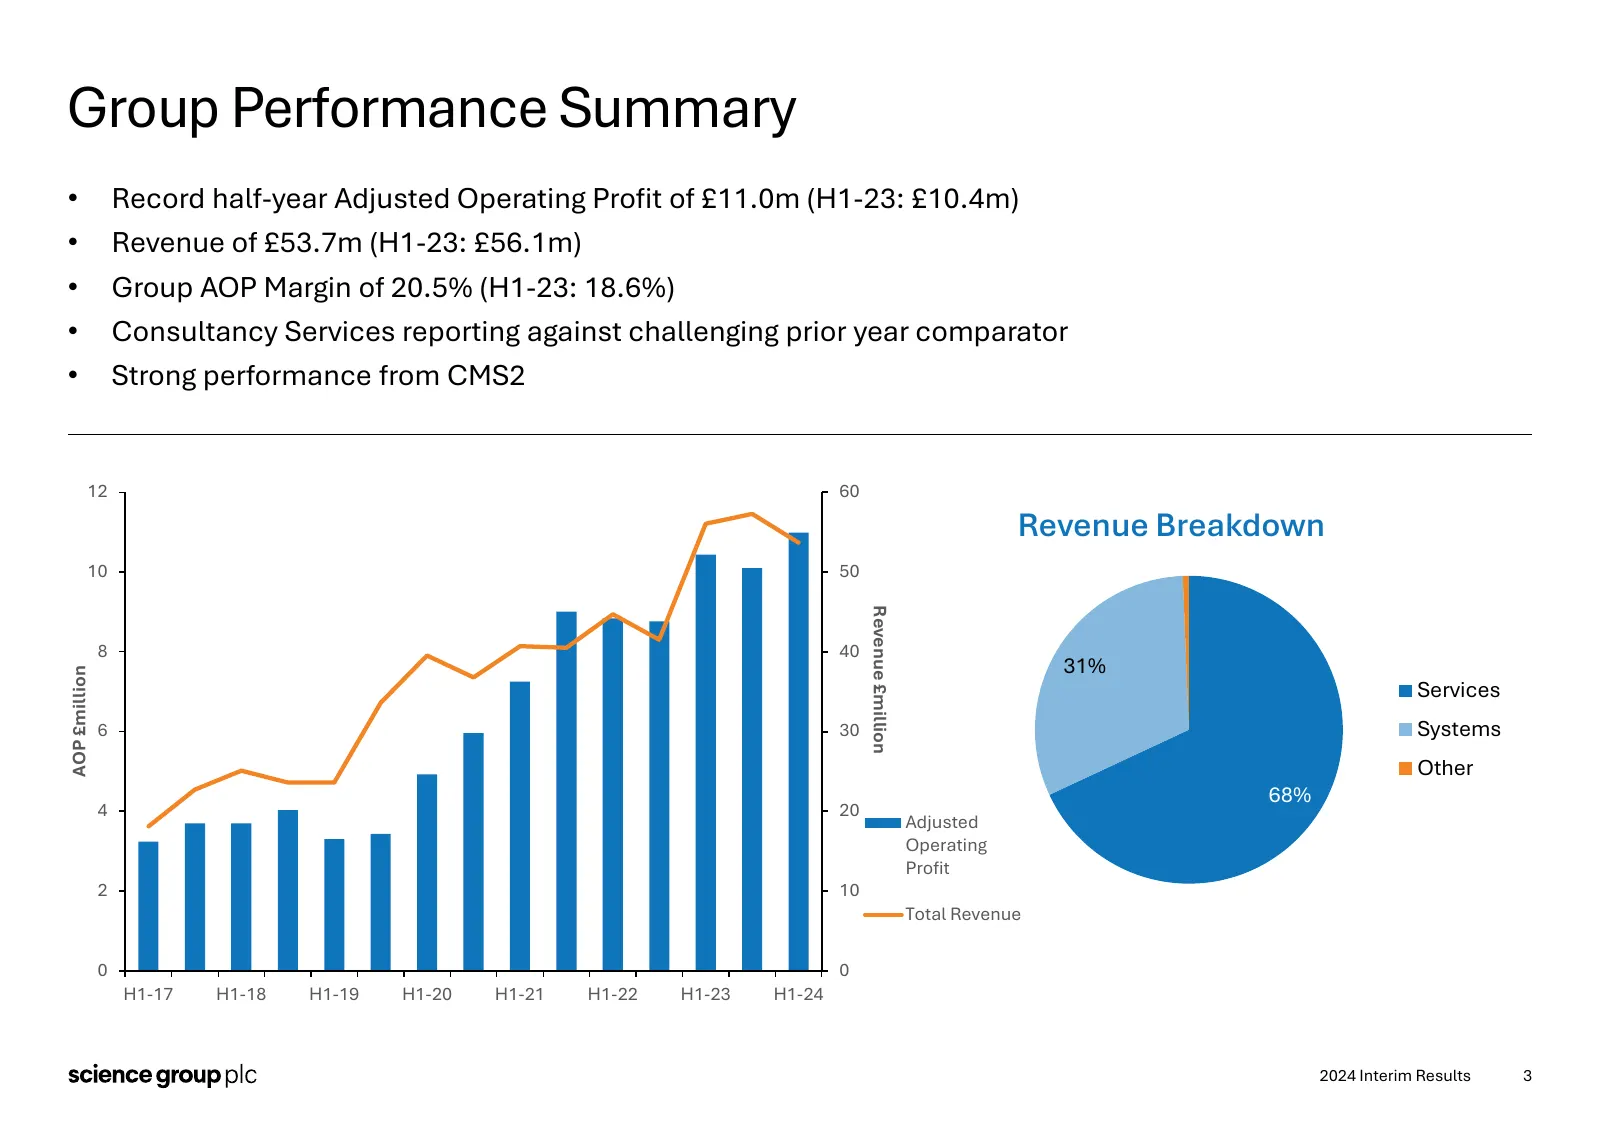
Group Performance Summary • Record half-year Adjusted Operating Profit of £11.0m (H1-23: £10.4m) • Revenue of £53.7m (H1-23: £56.1m) • Group AOP Margin of 20.5% (H1-23: 18.6%) • Consultancy Services reporting against challenging prior year comparator • Strong performance from CMS2 12 60 Revenue Brea
Slide 4: Group Balance Sheet and Cash Flow
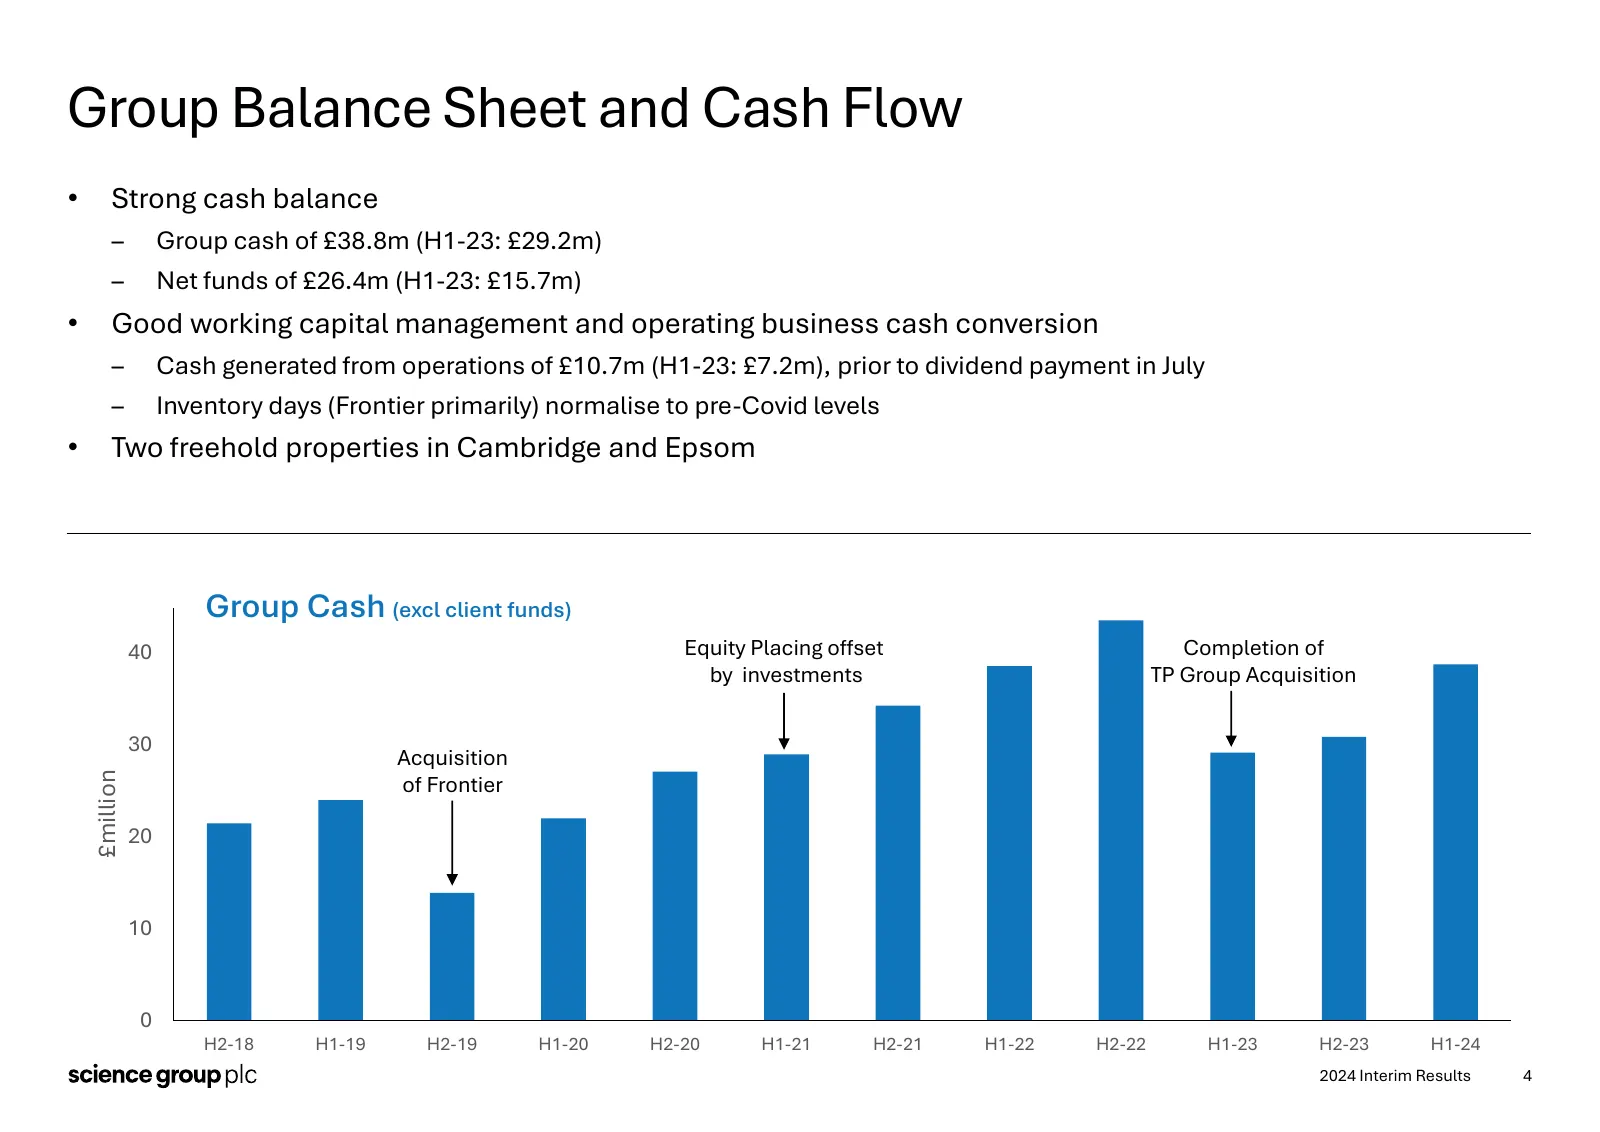
Group Balance Sheet and Cash Flow • Strong cash balance – Group cash of £38.8m (H1-23: £29.2m) – Net funds of £26.4m (H1-23: £15.7m) • Good working capital management and operating business cash conversion – Cash generated from operations of £10.7m (H1-23: £7.2m), prior to dividend payment in July –
Slide 5: Consultancy Services Division - Financial
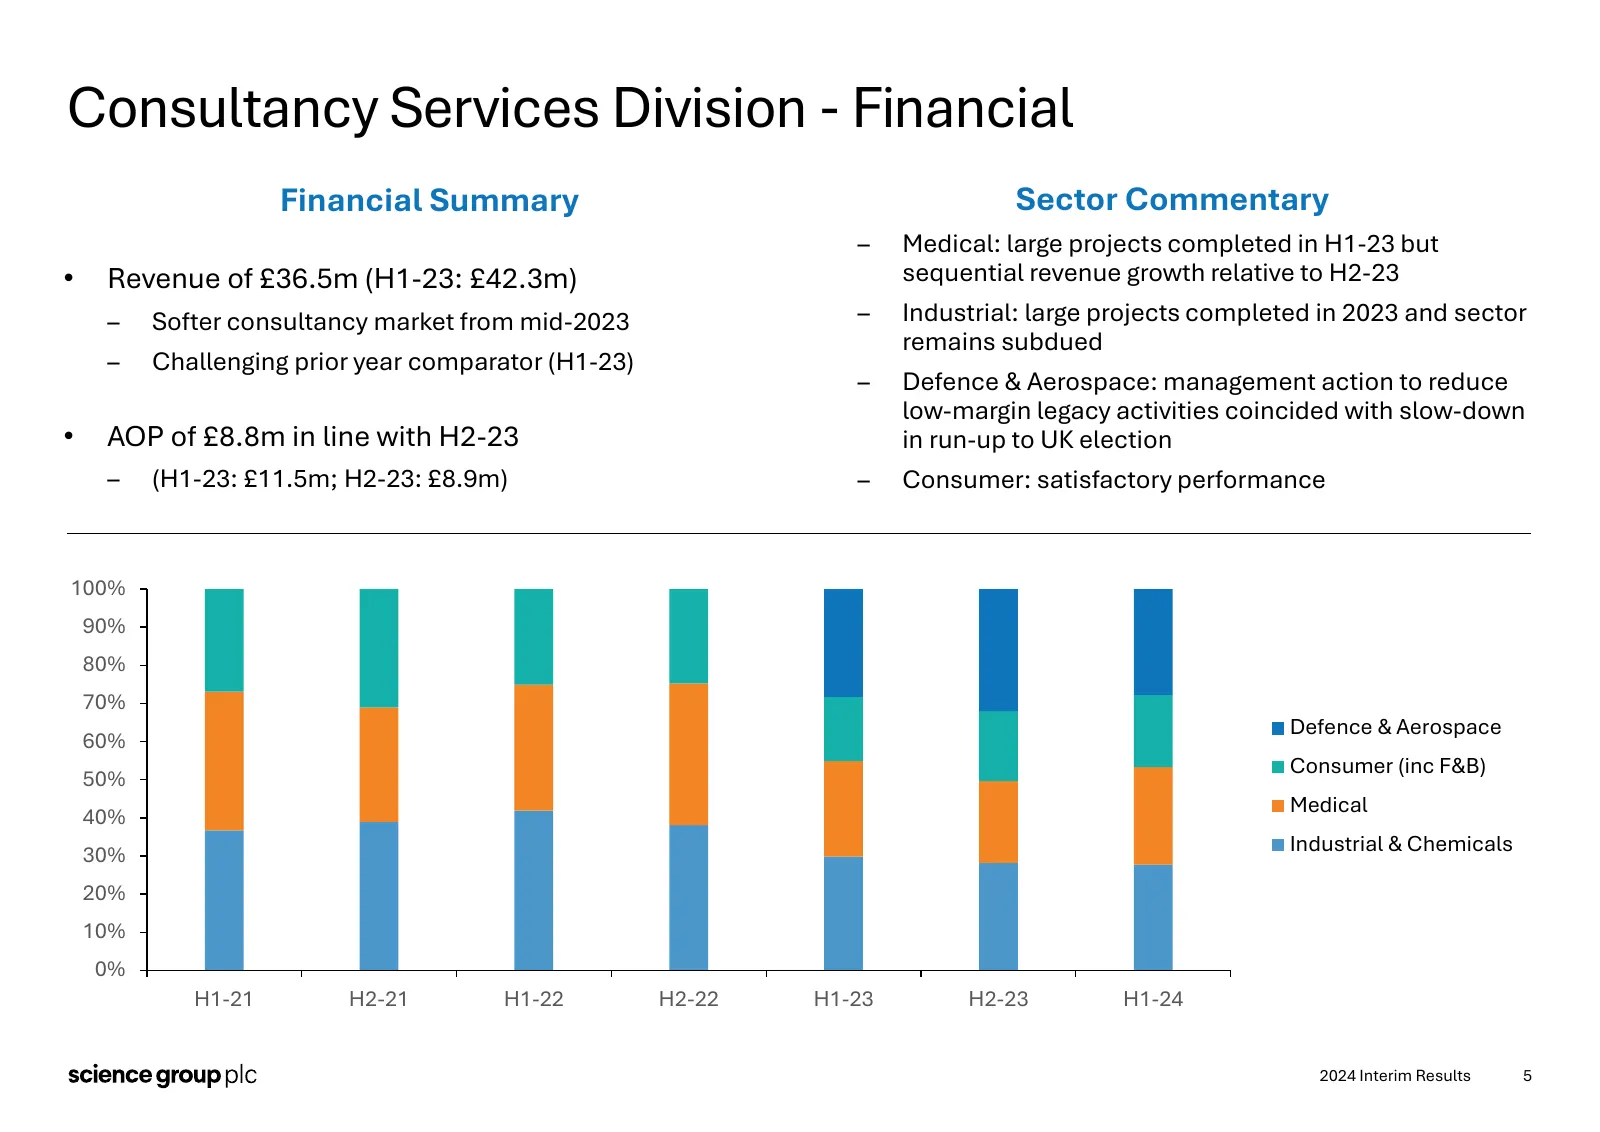
Consultancy Services Division - Financial Financial Summary Sector Commentary – Medical: large projects completed in H1-23 but • Revenue of £36.5m (H1-23: £42.3m) sequential revenue growth relative to H2-23 – Softer consultancy market from mid-2023 – Industrial: large projects completed in 2023 and
Slide 6: Consultancy Services Division - Operations
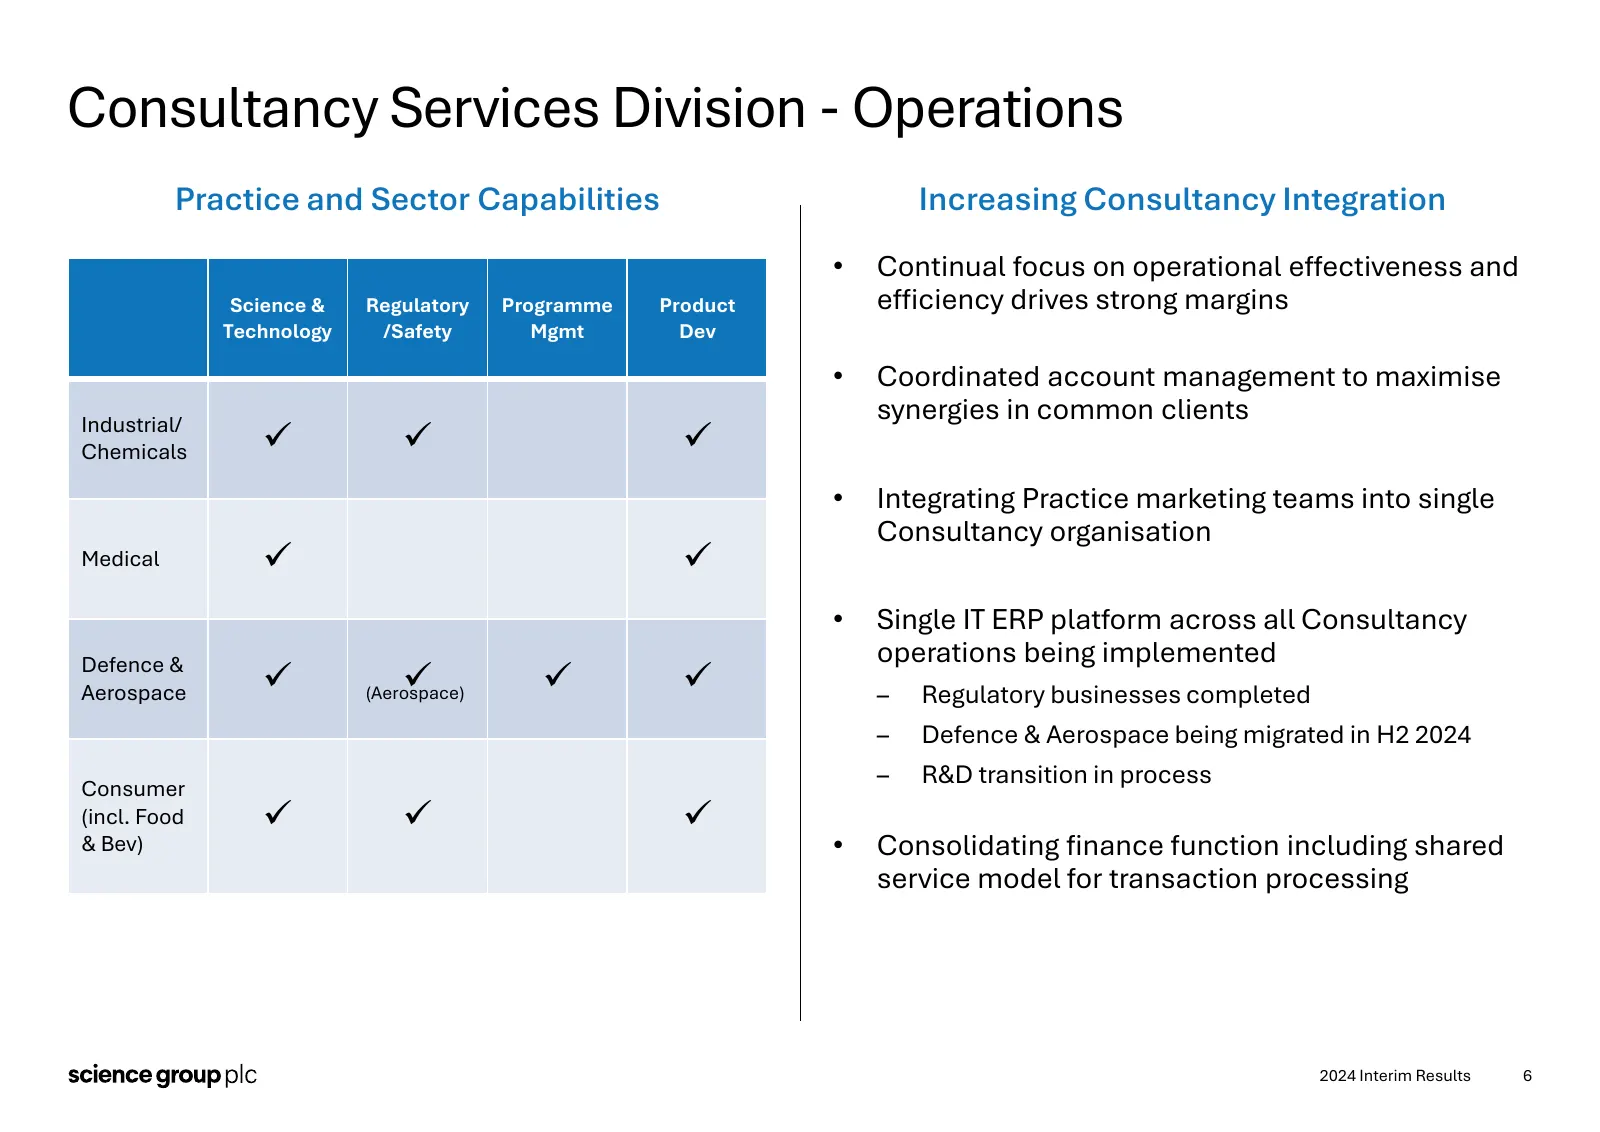
Consultancy Services Division - Operations Practice and Sector Capabilities Increasing Consultancy Integration • Continual focus on operational effectiveness and Science & Regulatory Programme Product efficiency drives strong margins Technology /Safety Mgmt Dev • Coordinated account management to ma
Slide 7: CMS2 - Financial
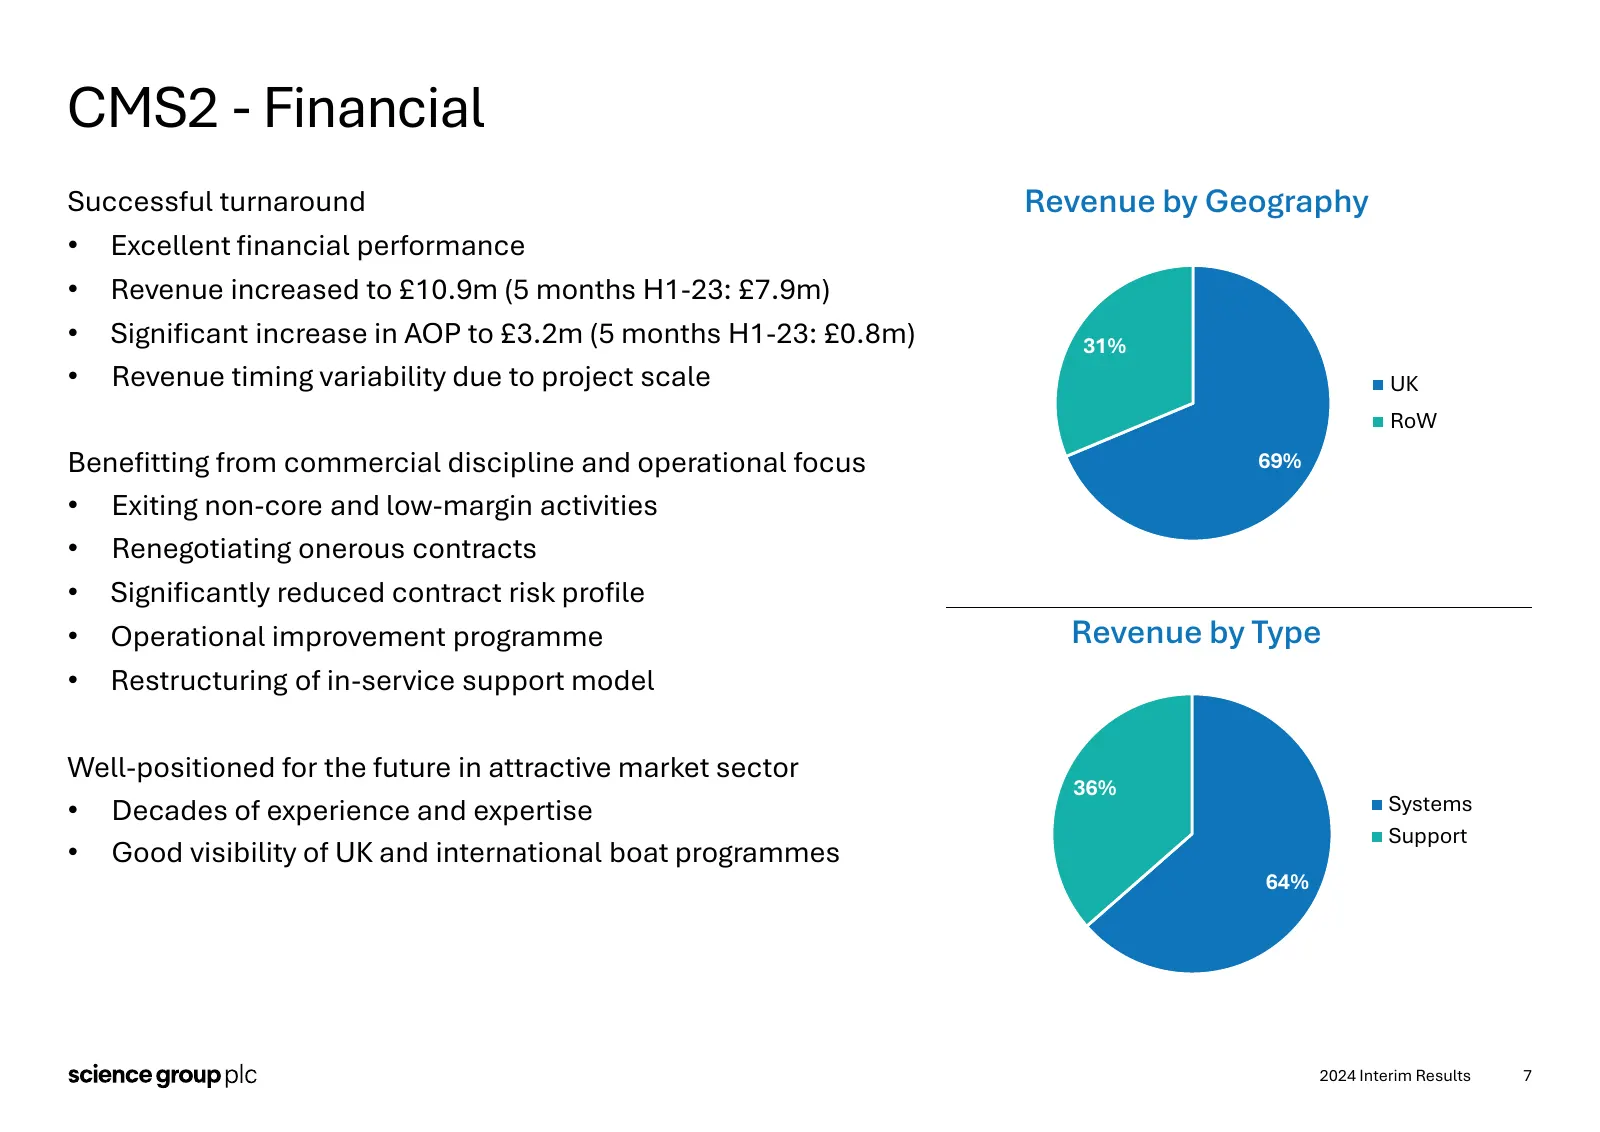
CMS2 - Financial Successful turnaround Revenue by Geography • Excellent financial performance • Revenue increased to £10.9m (5 months H1-23: £7.9m) • Significant increase in AOP to £3.2m (5 months H1-23: £0.8m) 31% • Revenue timing variability due to project scale UK RoW Benefitting from commercial
Slide 8: CMS2 – Market Opportunity
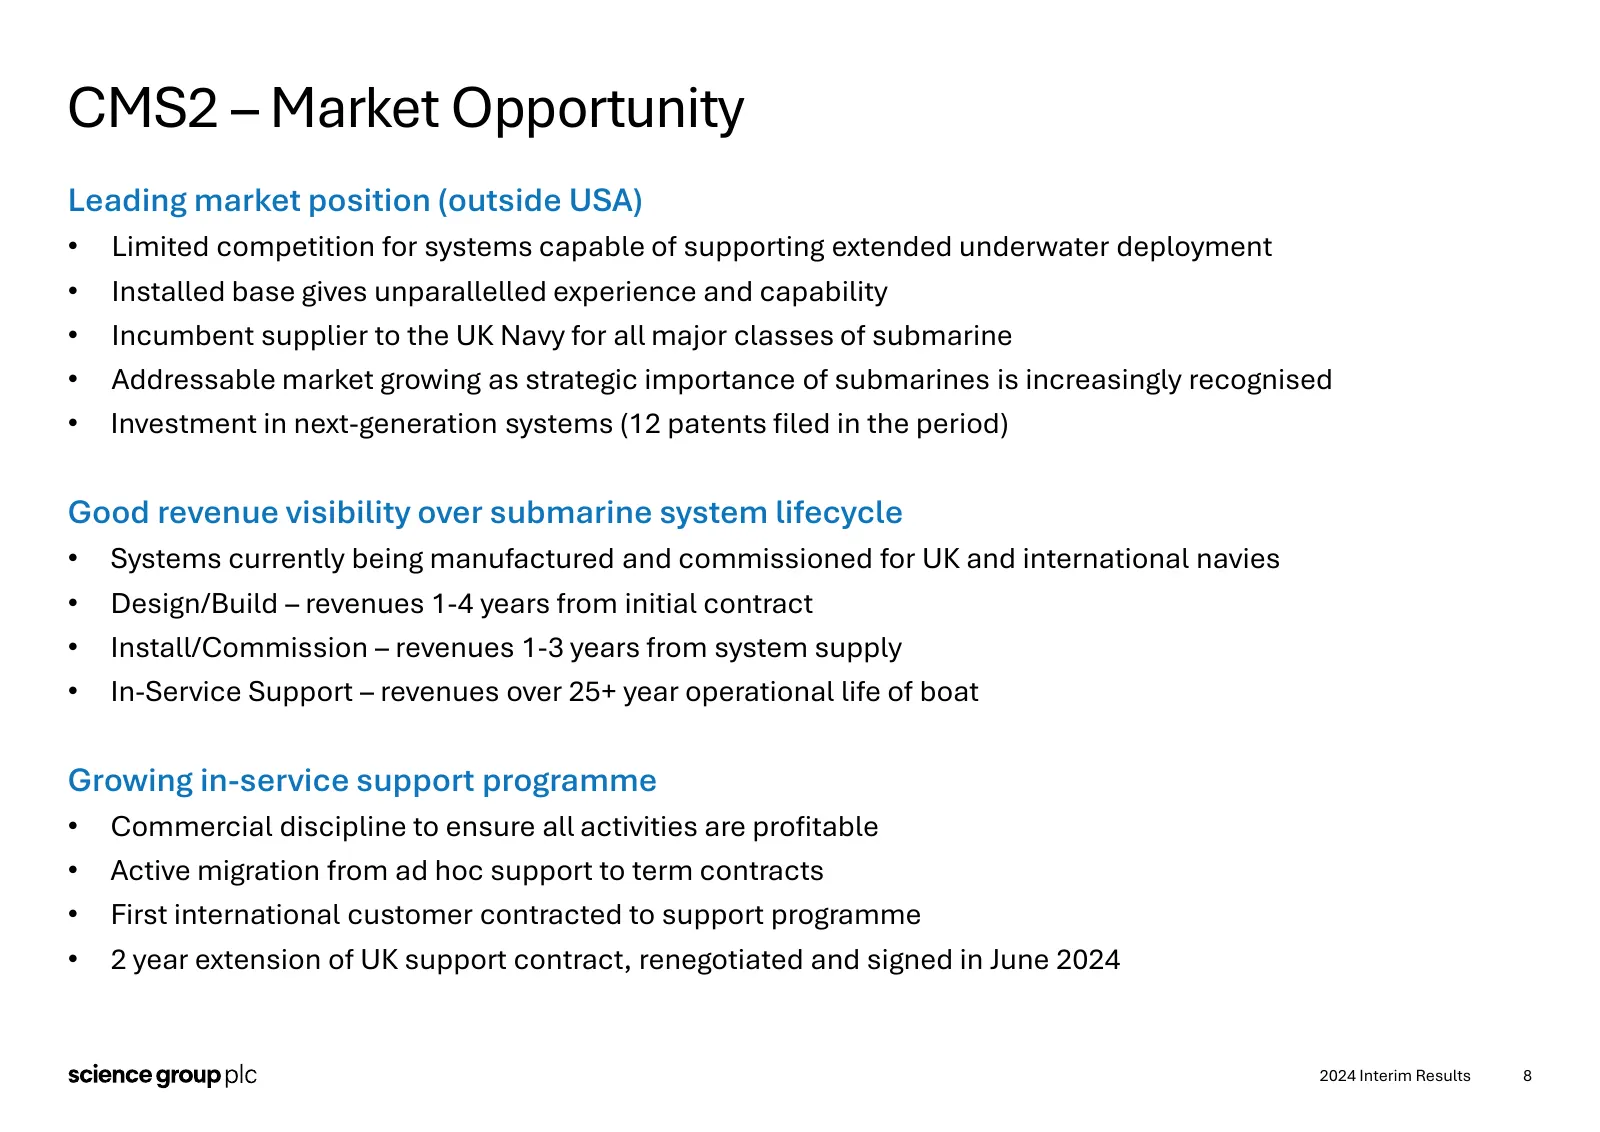
CMS2 – Market Opportunity Leading market position (outside USA) • Limited competition for systems capable of supporting extended underwater deployment • Installed base gives unparallelled experience and capability • Incumbent supplier to the UK Navy for all major classes of submarine • Addressable m
Slide 9: Frontier
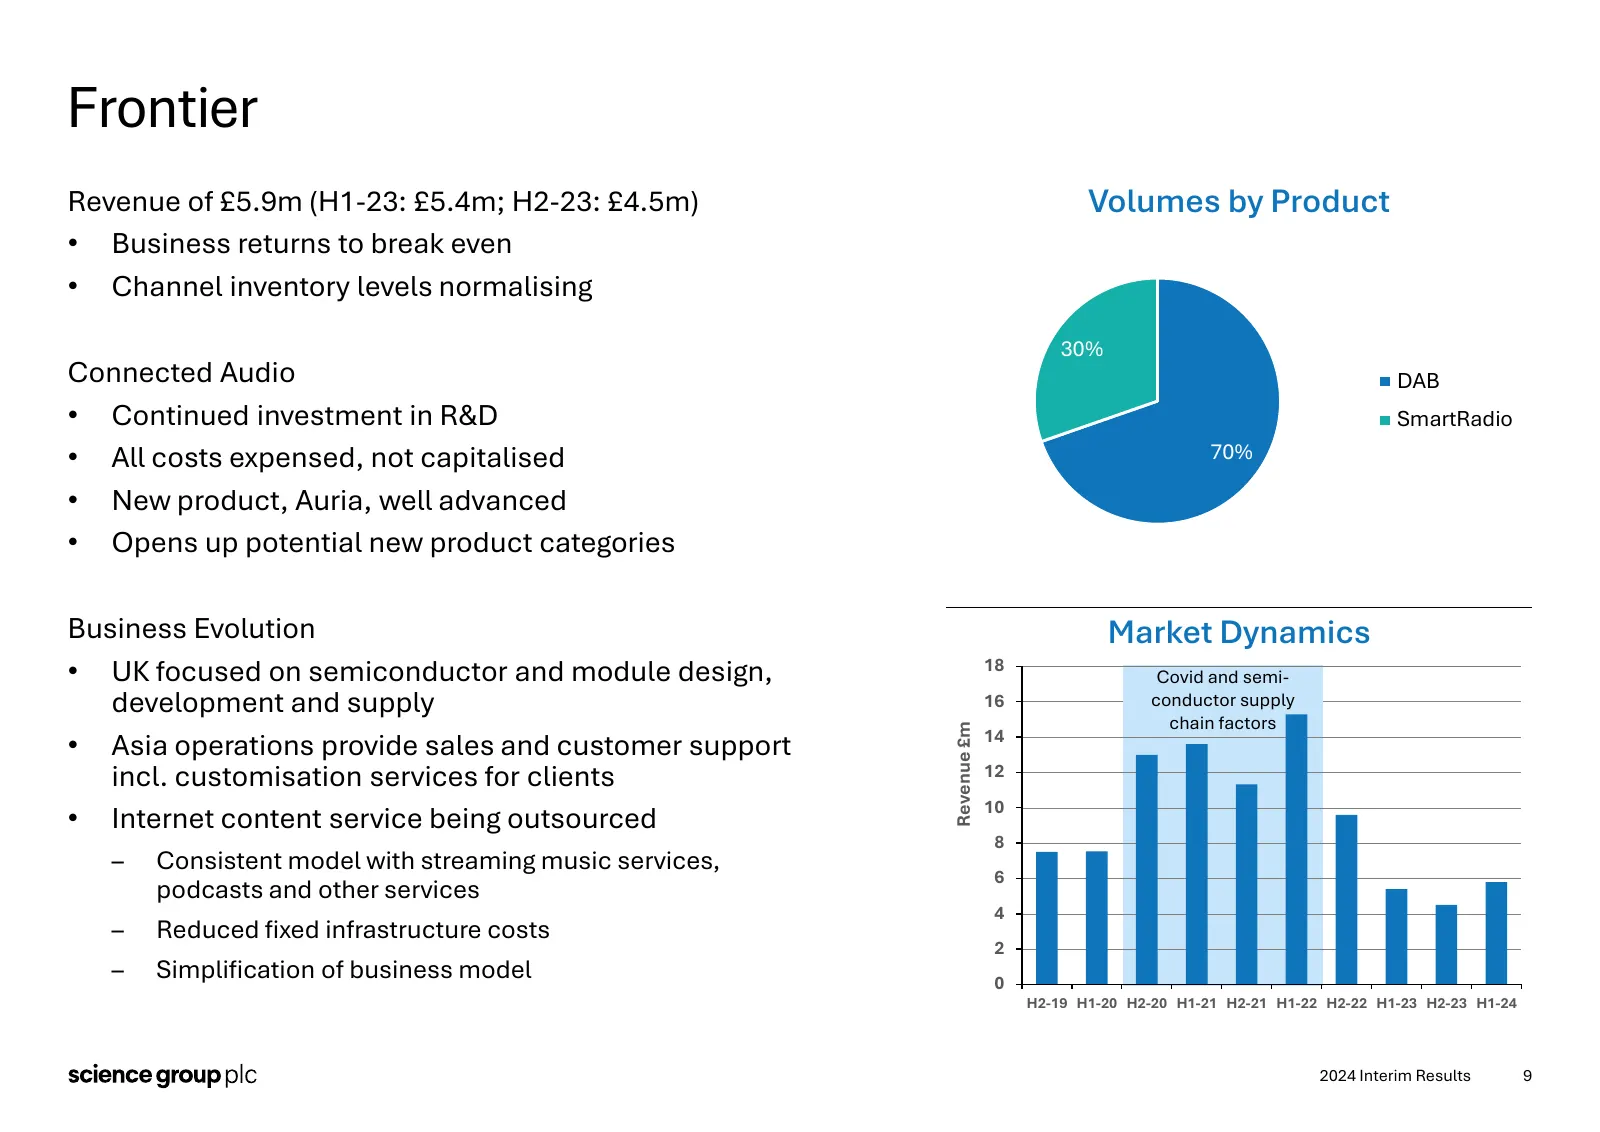
Frontier Revenue of £5.9m (H1-23: £5.4m; H2-23: £4.5m) Volumes by Product • Business returns to break even • Channel inventory levels normalising 30% Connected Audio DAB • Continued investment in R&D SmartRadio • All costs expensed, not capitalised 70% • New product, Auria, well advanced • Opens up
Slide 10: Disclaimer Statement
Disclaimer Statement This document contains forward-looking statements. These have been made by the Board in good faith based on the information available to them and it is believed that the expectations reflected in these statements are reasonable. However, due to the inherent uncertainties, includ
Source: Internet Archive copy of sciencegroup.com
More decks from Science Group PLC
 FY2025 Earnings Presentation18 slides · Mar 17, 2026
 Leatherhead Food Research — Technical Presentation (March 2026)37 slides · Mar 4, 2026
 H1 2025 Earnings Presentation12 slides · Jul 28, 2025
 FY2024 Earnings Presentation16 slides · Mar 24, 2025
 FY2023 Earnings Presentation19 slides · Mar 21, 2024
 H1 2023 Earnings Presentation11 slides · Jul 24, 2023