Railamerica — Q2 2006 Earnings Presentation
15 slides from Railamerica's earnings presentation, Jul 27, 2006
Slide 1: RailAmerica, Inc. Second Quarter 2006 Financial Results
RailAmerica, Inc. Second Quarter 2006 Financial Results July 27, 2006
Slide 2: Forward-Looking Statements and Forecasts
Forward-Looking Statements and Forecasts This presentation contains forward-looking statements, forecasts, and information regarding future events and the future performance of RailAmerica, Inc. ("RailAmerica" or the "Company") that involve risks and uncertainties that could cause actual results and
Slide 3: Charles Swinburn, Chief Executive Officer
Charles Swinburn Chief Executive Officer
Slide 4: Second Quarter Results
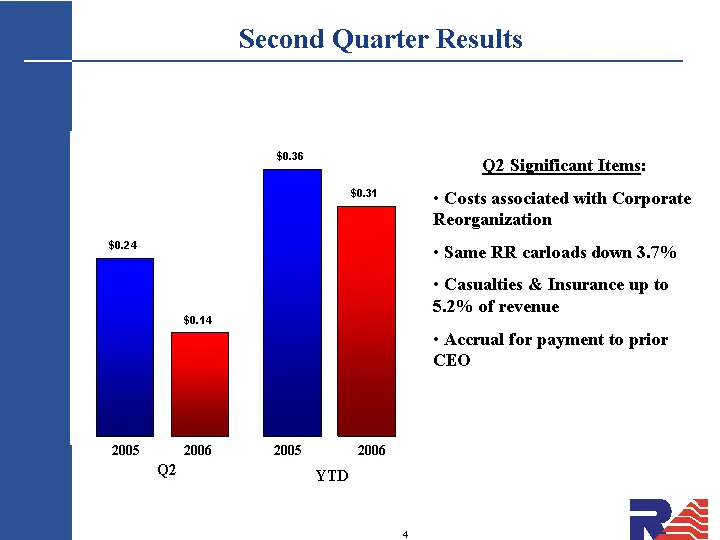
Second Quarter Results Q2 YTD 2005 0.24 0.36 Q2 YTD 2006 2006 2005 2005 Q2 Significant Items: Costs associated with Corporate Reorganization Same RR carloads down 3.7% Casualties & Insurance up to 5.2% of revenue Accrual for payment to prior CEO
Slide 5: Recent Developments
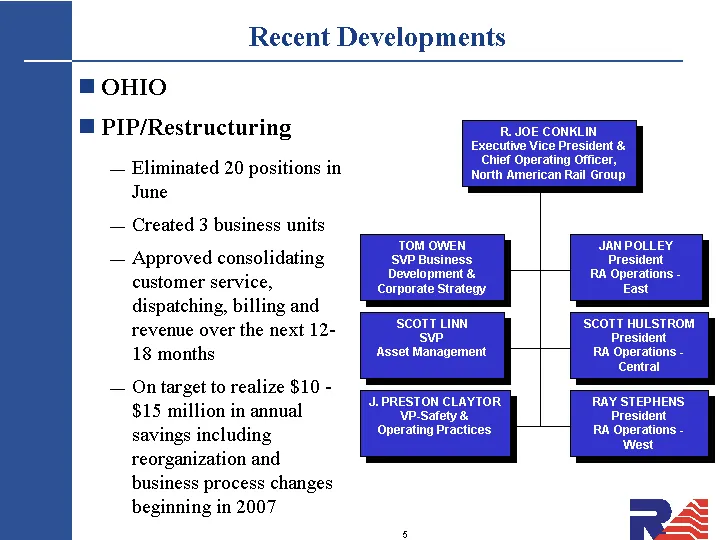
Recent Developments OHIO PIP/Restructuring Eliminated 20 positions in June Created 3 business units Approved consolidating customer service, dispatching, billing and revenue over the next 12- 18 months On target to realize $10 - $15 million in annual savings including reorganization and business pro
Slide 6: Safety Statistics
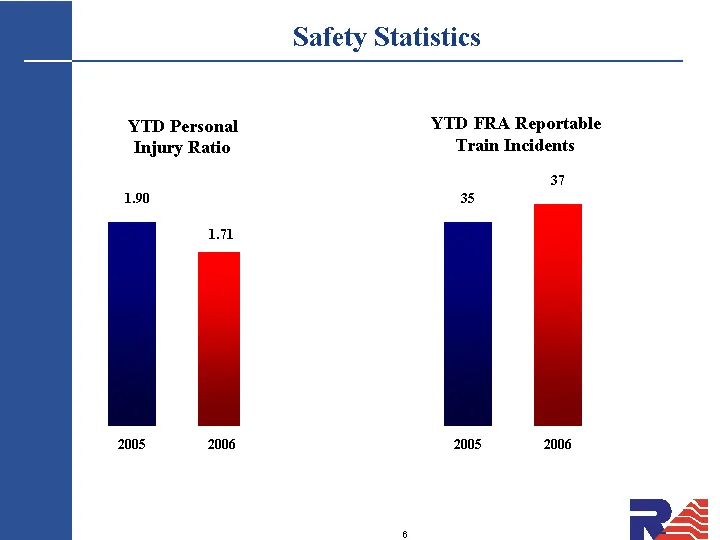
Safety Statistics YTD FRA Reportable Train Incidents 2006 35 37 YTD Personal Injury Ratio 2005 2006 1.90 1.71 2005
Slide 7: Michael Howe, Executive Vice President and Chief Financial Officer
Michael Howe Executive Vice President and Chief Financial Officer
Slide 8: Income Statement
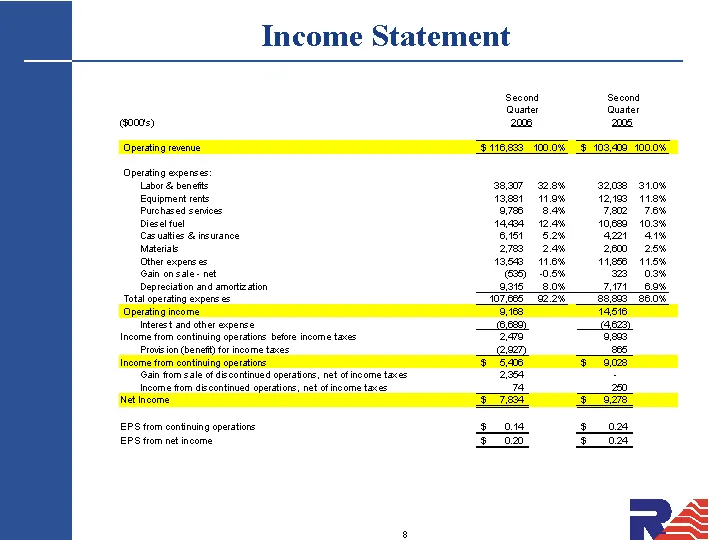
Income Statement Second Second Quarter Quarter ($000's) 2006 2005 Operating revenue $ 116,833 100.0% $ 103,409 100.0% Operating expenses: Labor & benefits 38,307 32.8% 32,038 31.0% Equipment rents 13,881 11.9% 12,193 11.8% Purchased services 9,786 8.4% 7,802 7.6% Diesel fuel 14,434 12.4% 10,689 10.3
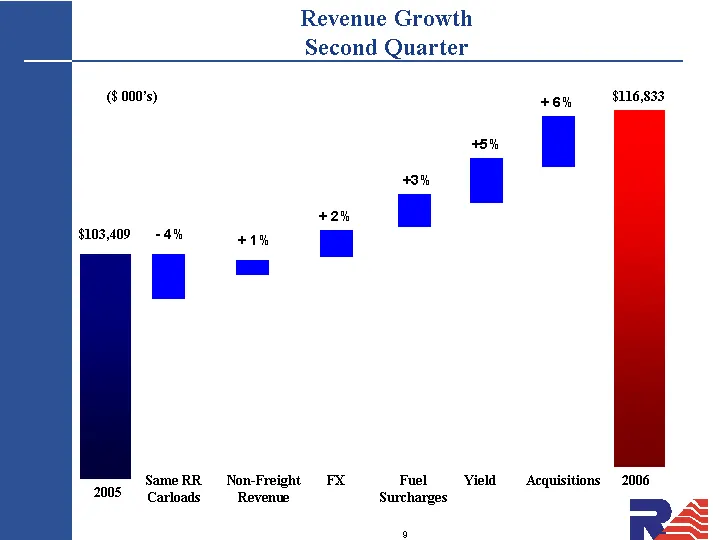
Slide 9: Revenue Growth Second Quarter
Revenue Growth Second Quarter - - 4% + 2% +5% + 6% +3% ($ 000's) + 1% 2005 Same RR Carloads Non-Freight Revenue FX Fuel Surcharges 2006 Yield Acquisitions $103,409 $116,833
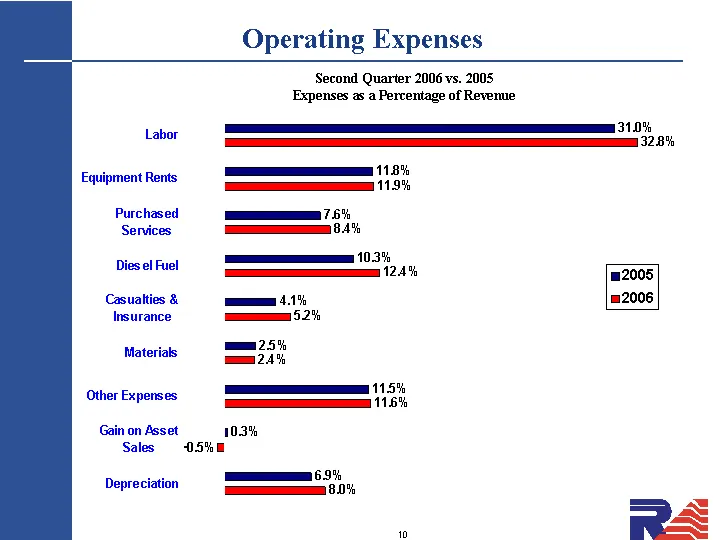
Slide 10: Operating Expenses
Operating Expenses Depreciation Gain on Asset Sales Other Expenses Materials Casualties & Insurance Diesel Fuel Purchased Services Equipment Rents Labor 2006 0.08 -0.005 0.116 0.024 0.052 0.124 0.084 0.119 0.328 2005 0.069 0.003 0.115 0.025 0.041 0.103 0.076 0.118 0.31 Second Quarter 2006 vs. 2005 E
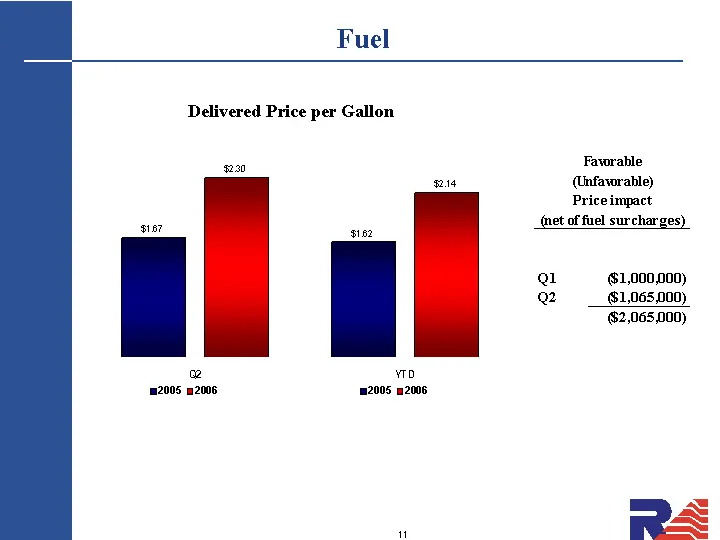
Slide 11: Fuel
Fuel Q2 2005 1.67 2006 2.3 YTD 2005 1.62 2006 2.14 Delivered Price per Gallon
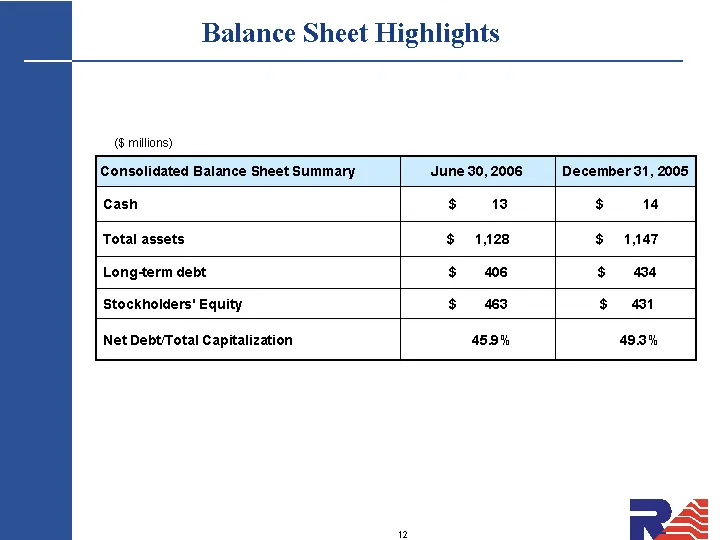
Slide 12: Balance Sheet Highlights
Balance Sheet Highlights ($ millions) Consolidated Balance Sheet Summary June 30, 2006 December 31, 2005 Cash $ 13 $ 14 Total assets $ 1,128 $ 1,147 Long-term debt $ 406 $ 434 Stockholders' Equity $ 463 $ 431 Net Debt/Total Capitalization 45.9% 49.3%
Slide 13: 2006 Guidance
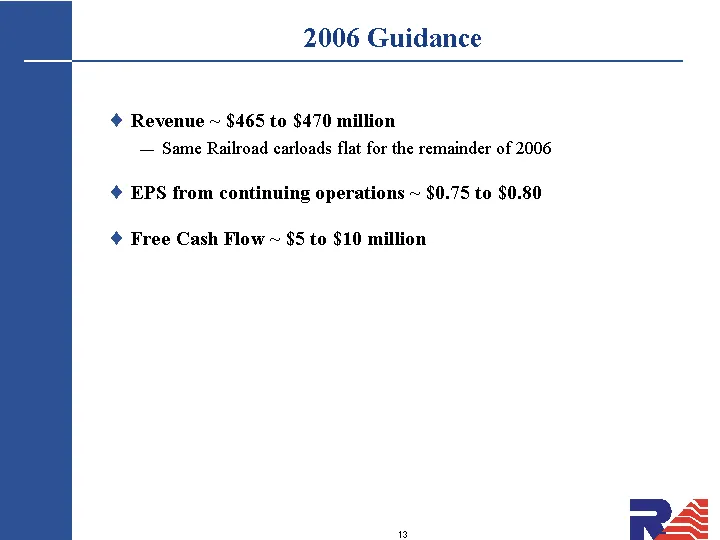
2006 Guidance Revenue ~ $465 to $470 million Same Railroad carloads flat for the remainder of 2006 EPS from continuing operations ~ $0.75 to $0.80 Free Cash Flow ~ $5 to $10 million
Slide 14: Charles Swinburn, Chief Executive Officer
Charles Swinburn Chief Executive Officer
Slide 15: Closing Comments
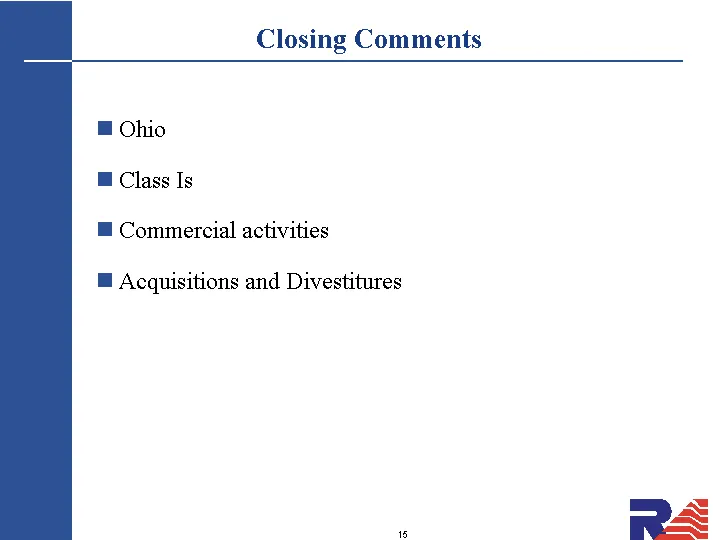
Closing Comments Ohio Class Is Commercial activities Acquisitions and Divestitures
Source: SEC EDGAR · 8-K filed Jul 27, 2006
More decks from Railamerica Inc
 Q2 2012 Earnings Presentation25 slides · Jul 25, 2012
 Q1 2012 Earnings Presentation29 slides · Apr 26, 2012
 Q4 2011 Earnings Presentation33 slides · Feb 9, 2012
 Q3 2011 Earnings Presentation28 slides · Oct 26, 2011
 Q2 2011 Earnings Presentation27 slides · Jul 28, 2011
 Q1 2011 Earnings Presentation28 slides · Apr 28, 2011