Enghouse Systems Limited · TSX:ENGH
Enghouse Systems — Q1 2017 Earnings Presentation
24 slides from Enghouse Systems's earnings presentation, Jul 16, 2017
Slide 1: Corporate Overview Q1 FY17
Corporate Overview QUFY 17
Slide 2: Forward-Looking Statements Disclaimer
Enghouse Systems Forward-Looking Statements Disclaimer Certain statements made in this presentation and the related materials may contain forward-looking statements, which are not historical facts, but are based on certain assumptions and reflect Enghouse’s current expectations. These forward-lookin
Slide 3: Strategy
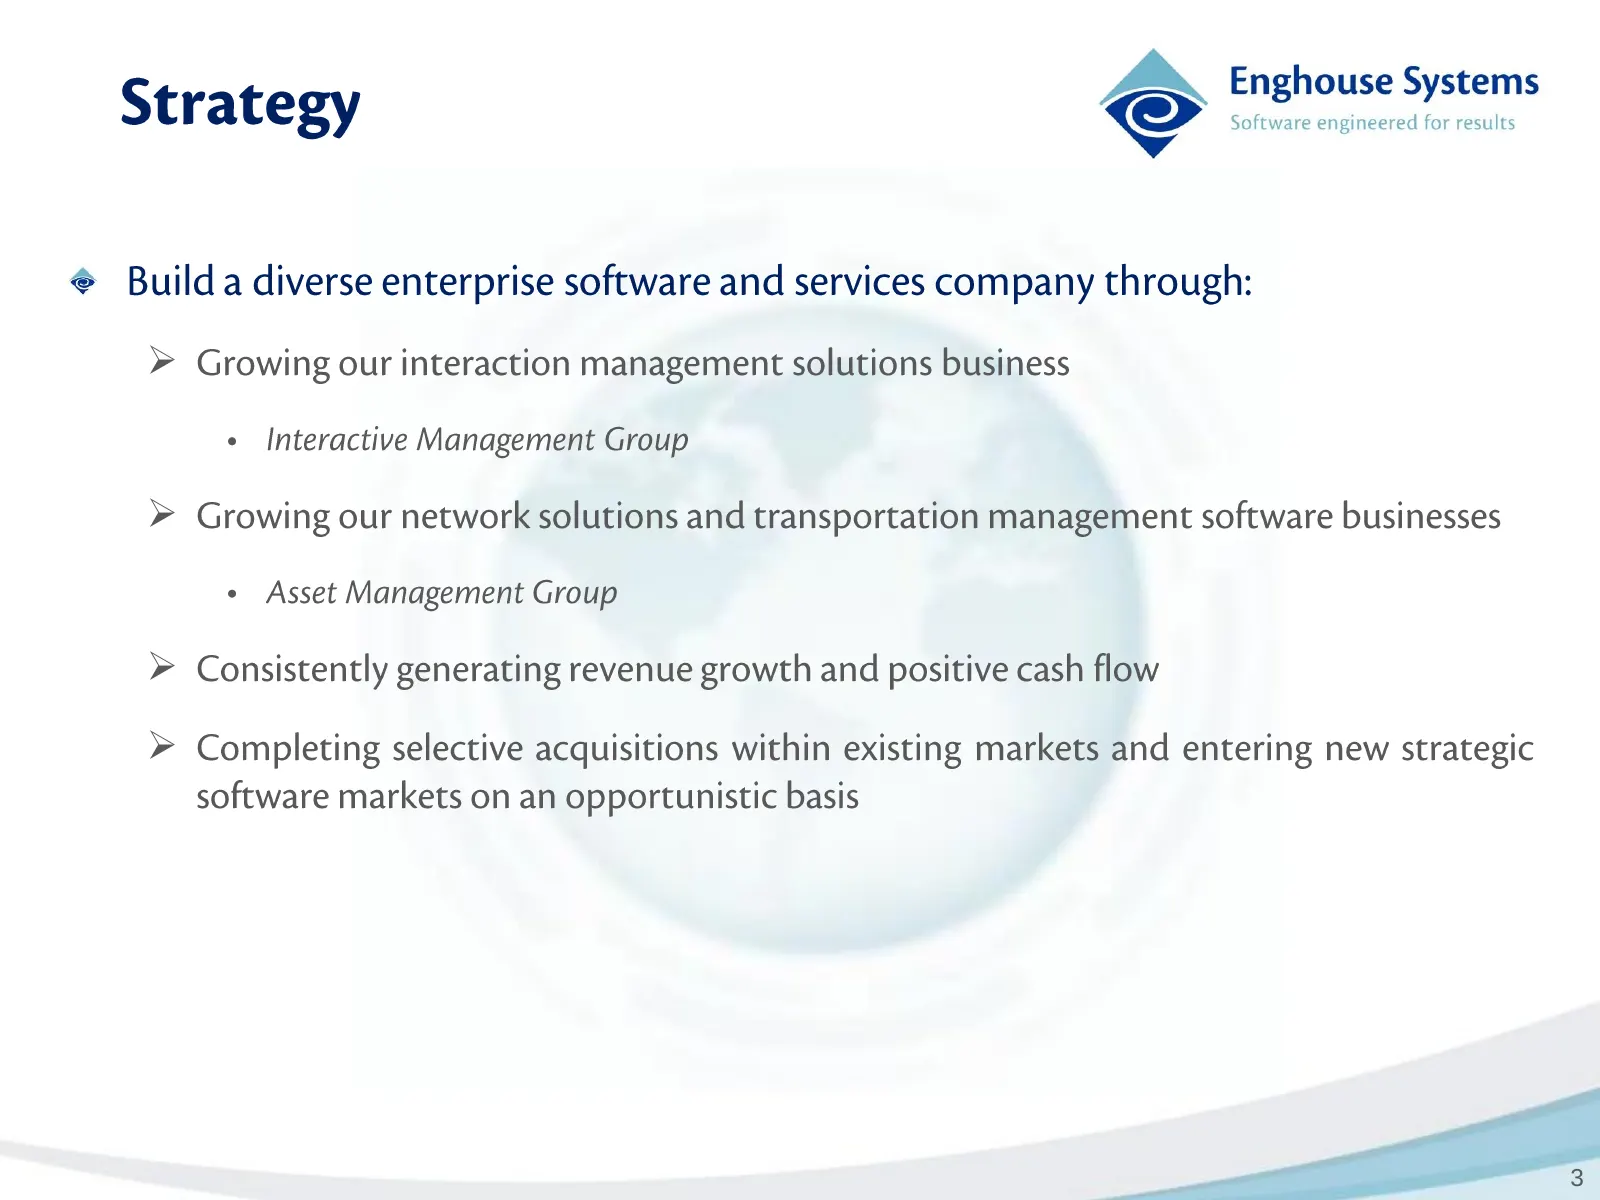
Enghouse Systems Strategy © Software engineered for results @ Builda diverse enterprise software and services company through: > Growing our interaction management solutions business * Interactive Management Group > Growing our network solutions and transportation management software businesses ° As
Slide 4: Snapshot
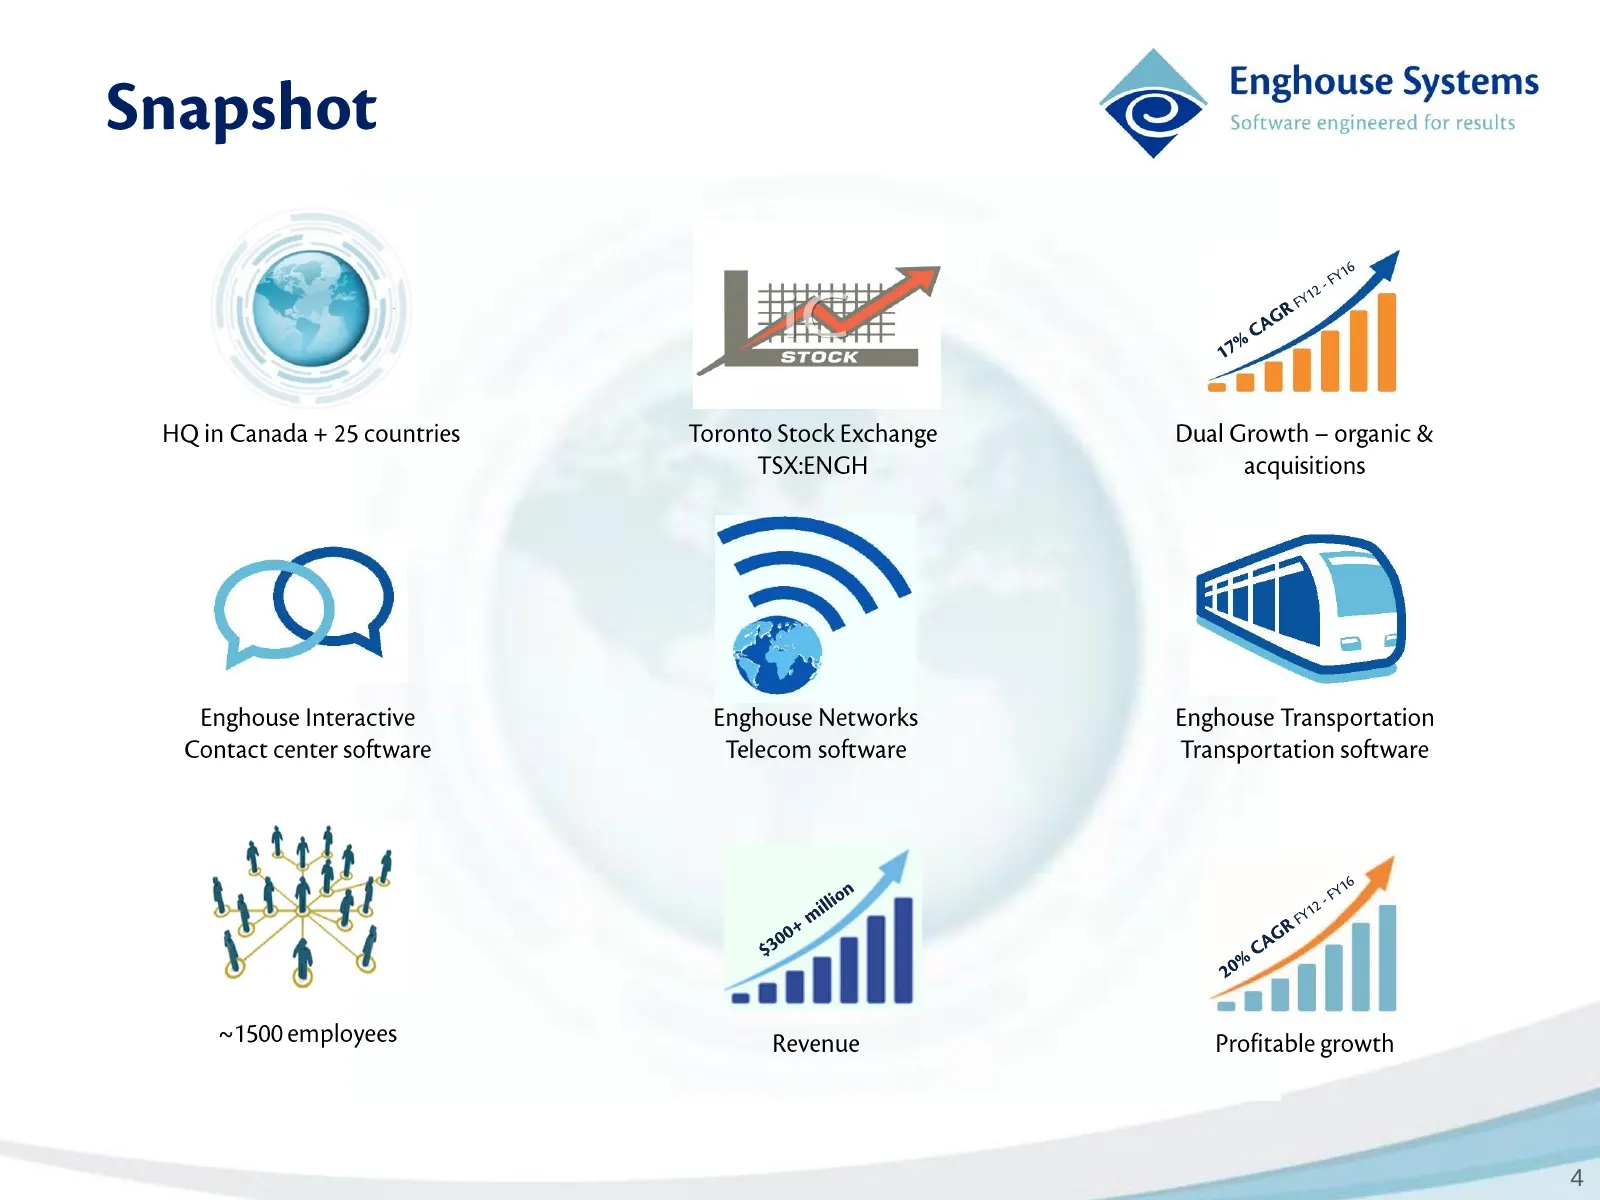
Snapshot HQ in Canada + 25 countries Enghouse Interactive Contact center software ~1500 employees ke Toronto Stock Exchange TSX:ENGH = Enghouse Networks Telecom software Revenue Enghouse Systems © Software engineered for results Dual Growth - organic & acquisitions Enghouse Transportation Transporta
Slide 5: Interactive - Sector Dynamics
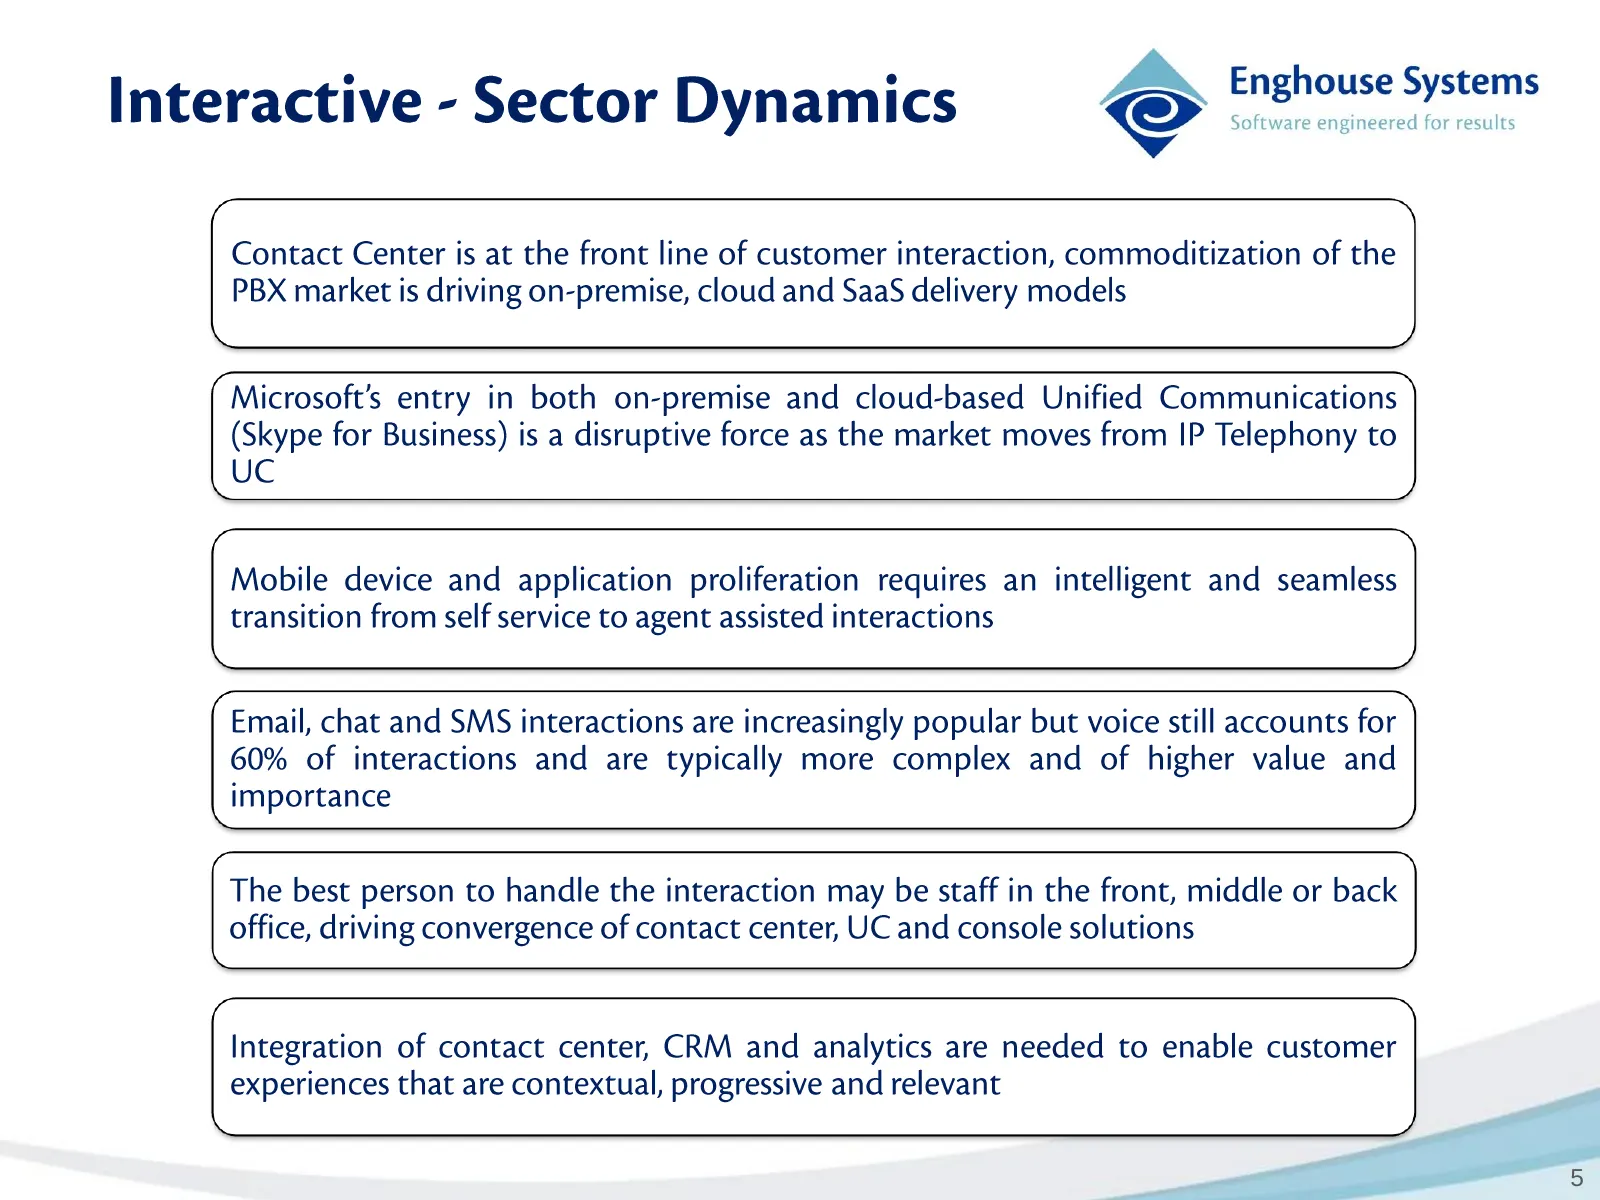
Interactive - Sector Dynamics © ee (— >) Contact Center is at the front line of customer interaction, commoditization of the PBX market is driving on-premise, cloud and SaaS delivery models X / ( Microsoft’s entry in both on-premise and cloud-based Unified Communications (Skype for Business) is a di
Slide 6: Interactive Portfolio
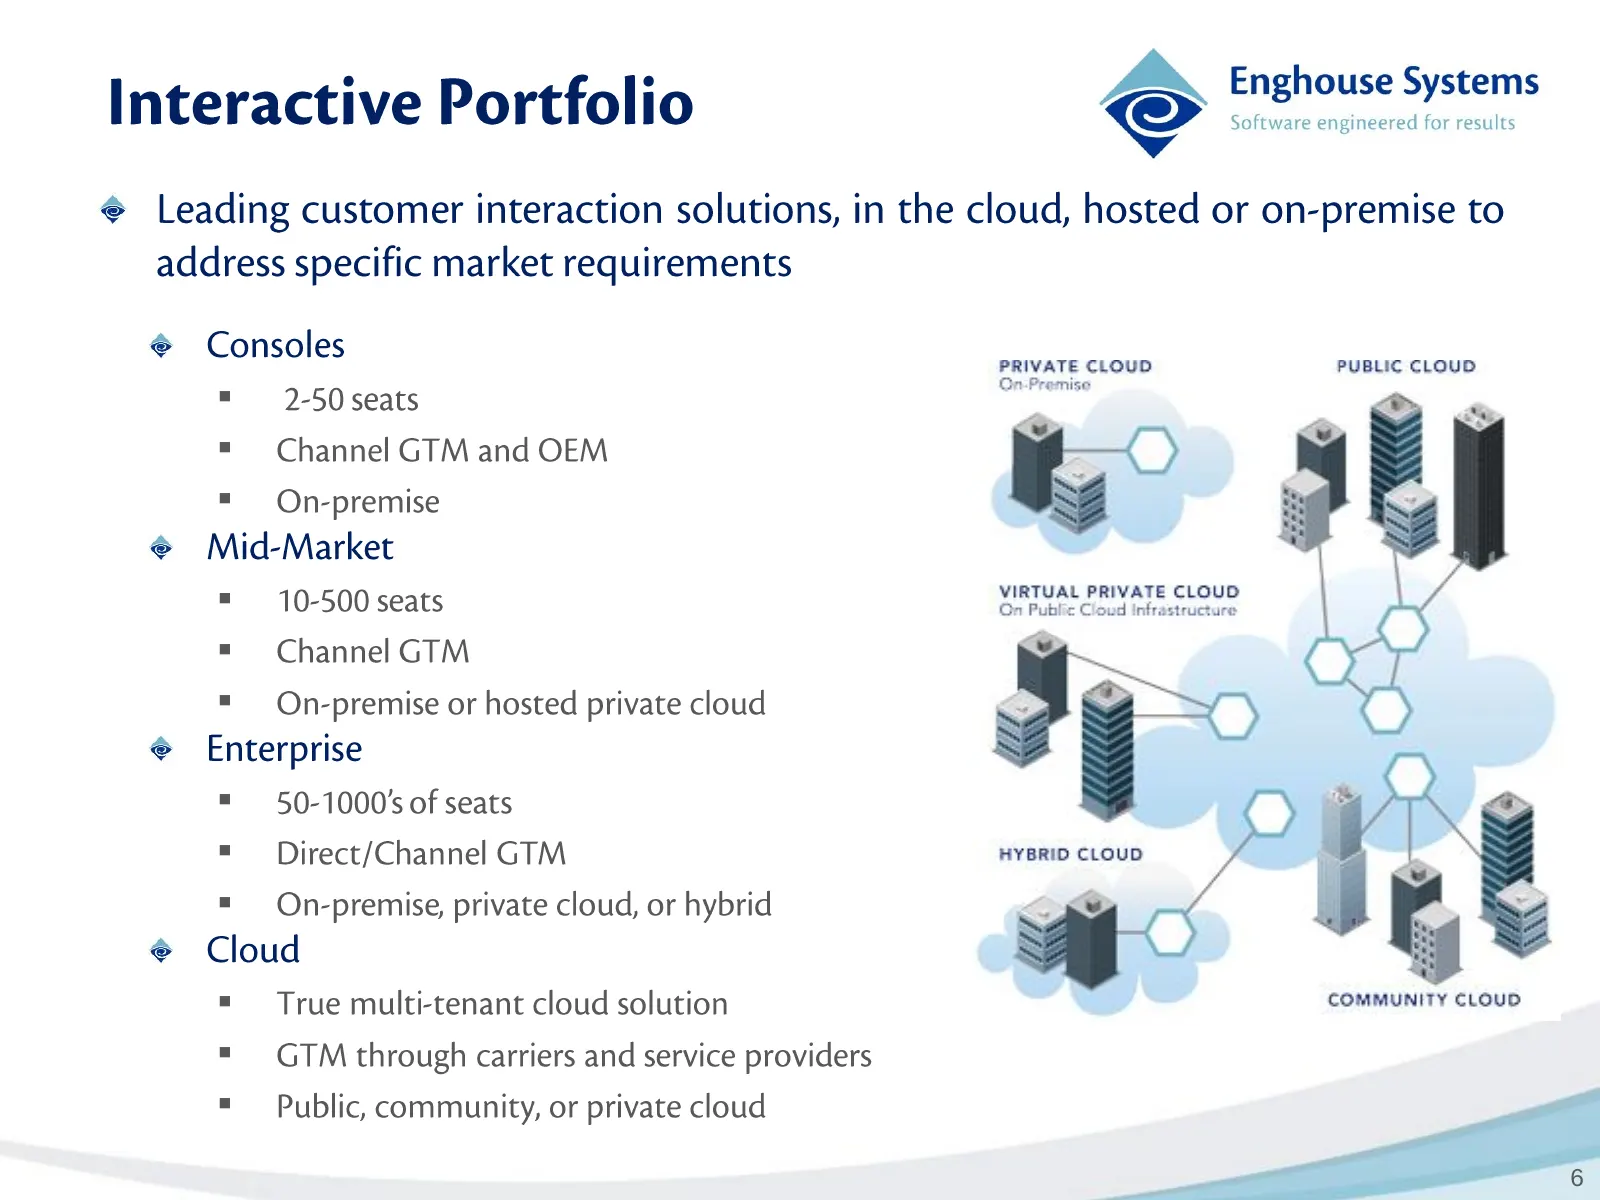
Enghouse Systems Interactive Portfolio © eowempand nena @ Leading customer interaction solutions, in the cloud, hosted or on-premise to address specific market requirements . Consoles PRIVATE CLOUD PUBLIC CLOUD = 2-50 seats pens: =~ Channel GTM and OEM | ie = On-premise . @ Mid-Market = 10-500 seats
Slide 7: Interactive Portfolio
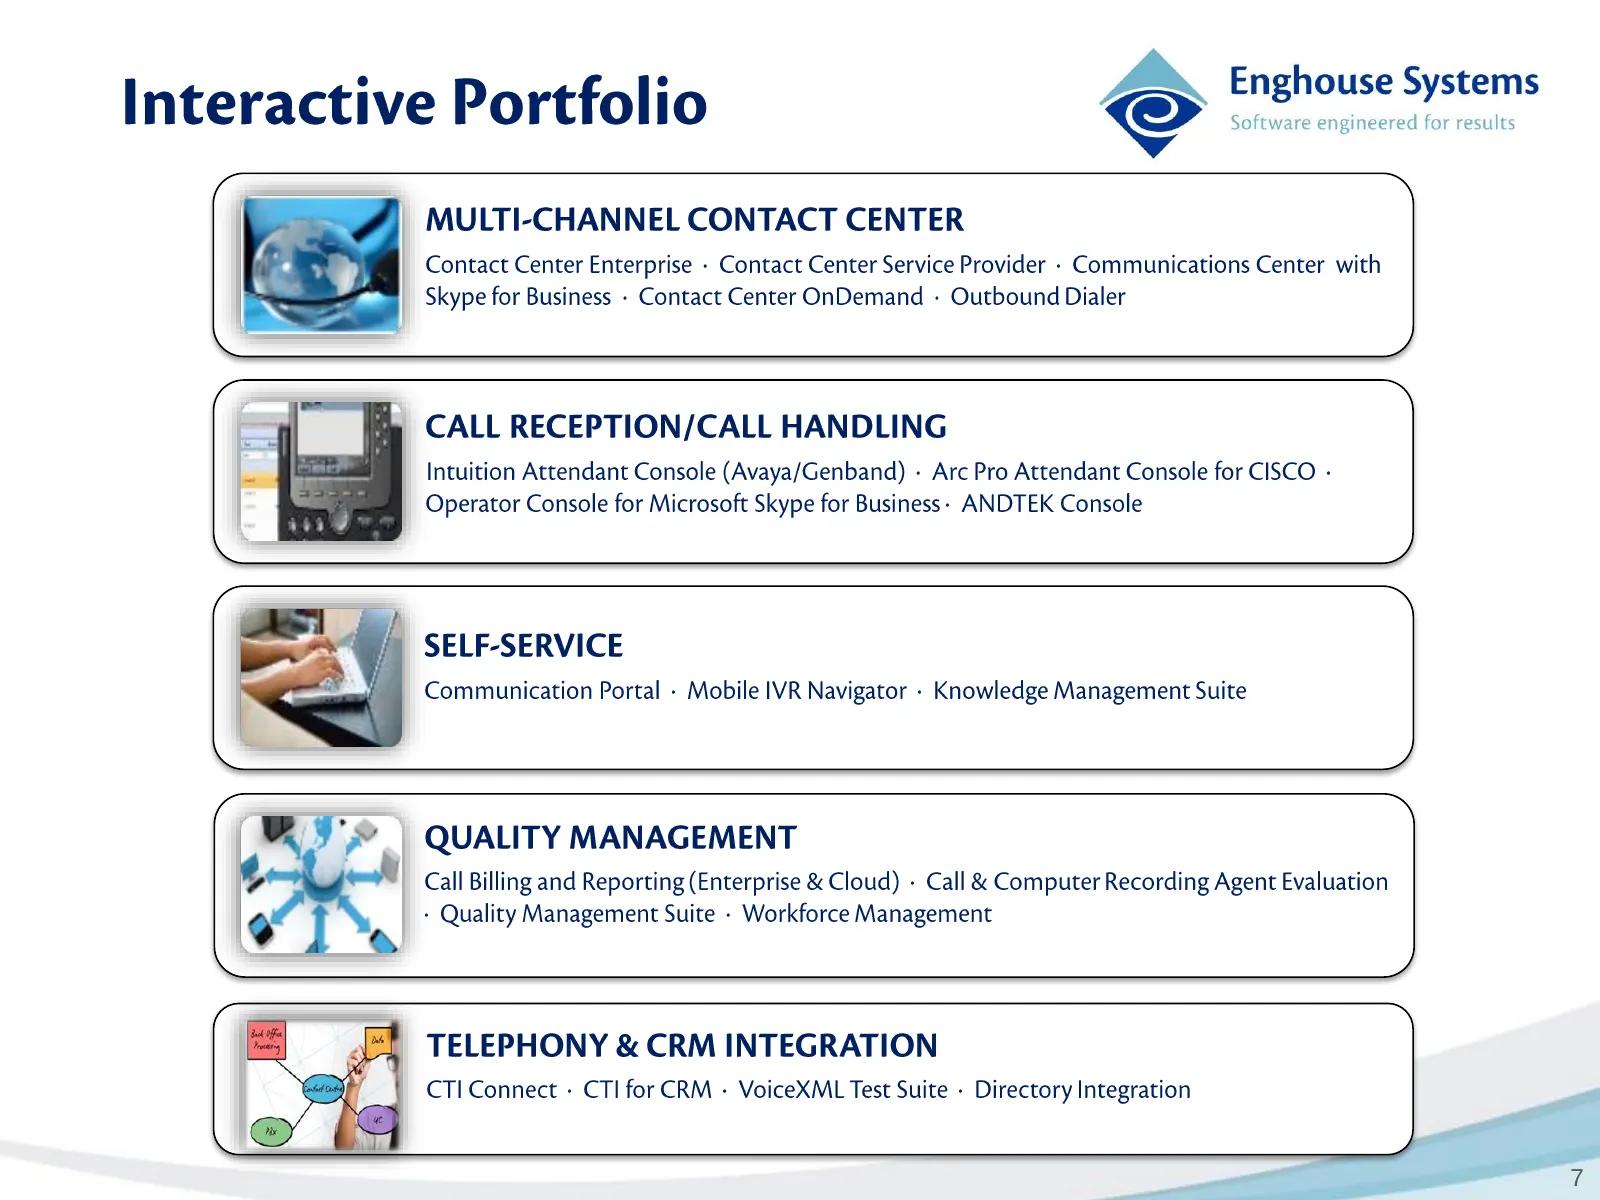
Enghouse Systems Interactive Portfolio BD ssn ore ~ MULTI-CHANNEL CONTACT CENTER Contact Center Enterprise - Contact Center Service Provider - Communications Center with Skype for Business - Contact Center OnDemand - Outbound Dialer J ~\ CALL RECEPTION/CALL HANDLING Intuition Attendant Console (Avay
Slide 8: Networks - Sector Dynamics
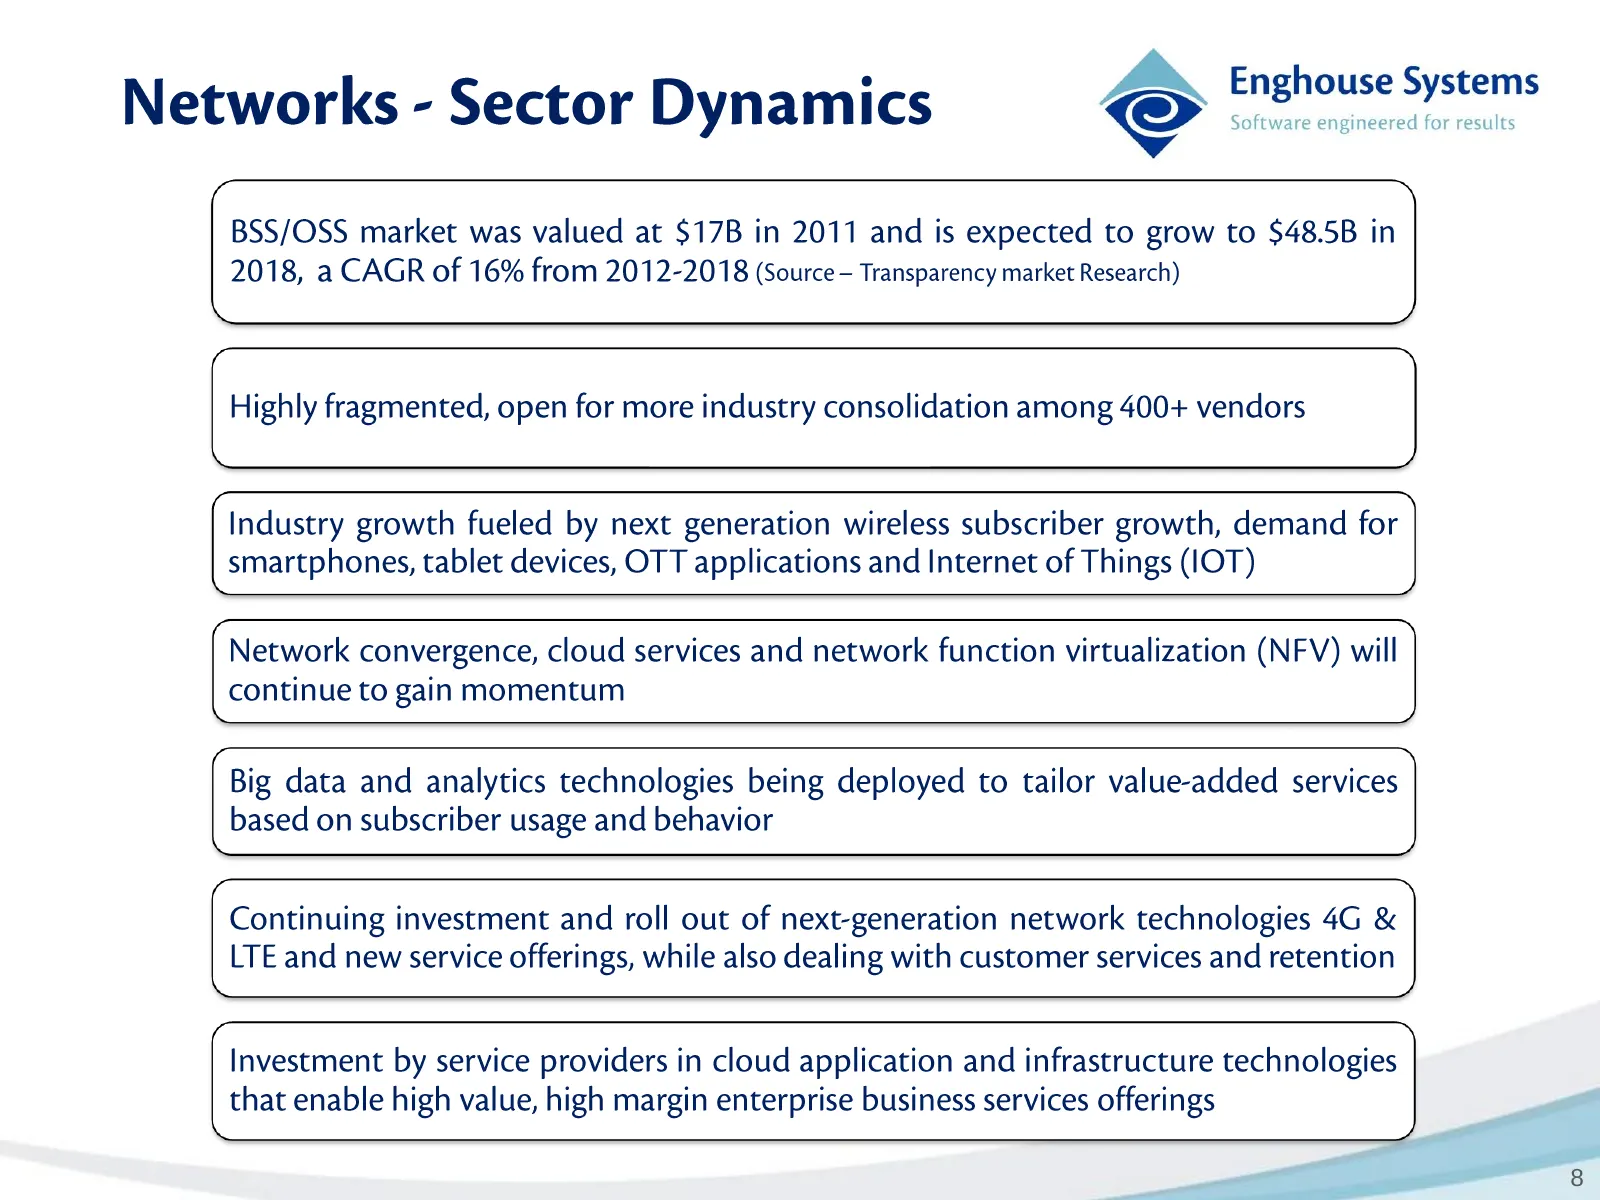
Networks - Sector Dynamics © pi iheoitn abe (— >) BSS/OSS market was valued at $17B in 2011 and is expected to grow to $48.5B in 2018, a CAGR of 16% from 2012-2018 (Source — Transparency market Research) \ / ‘a ~) Highly fragmented, open for more industry consolidation among 400+ vendors / Industry
Slide 9: Networks Portfolio
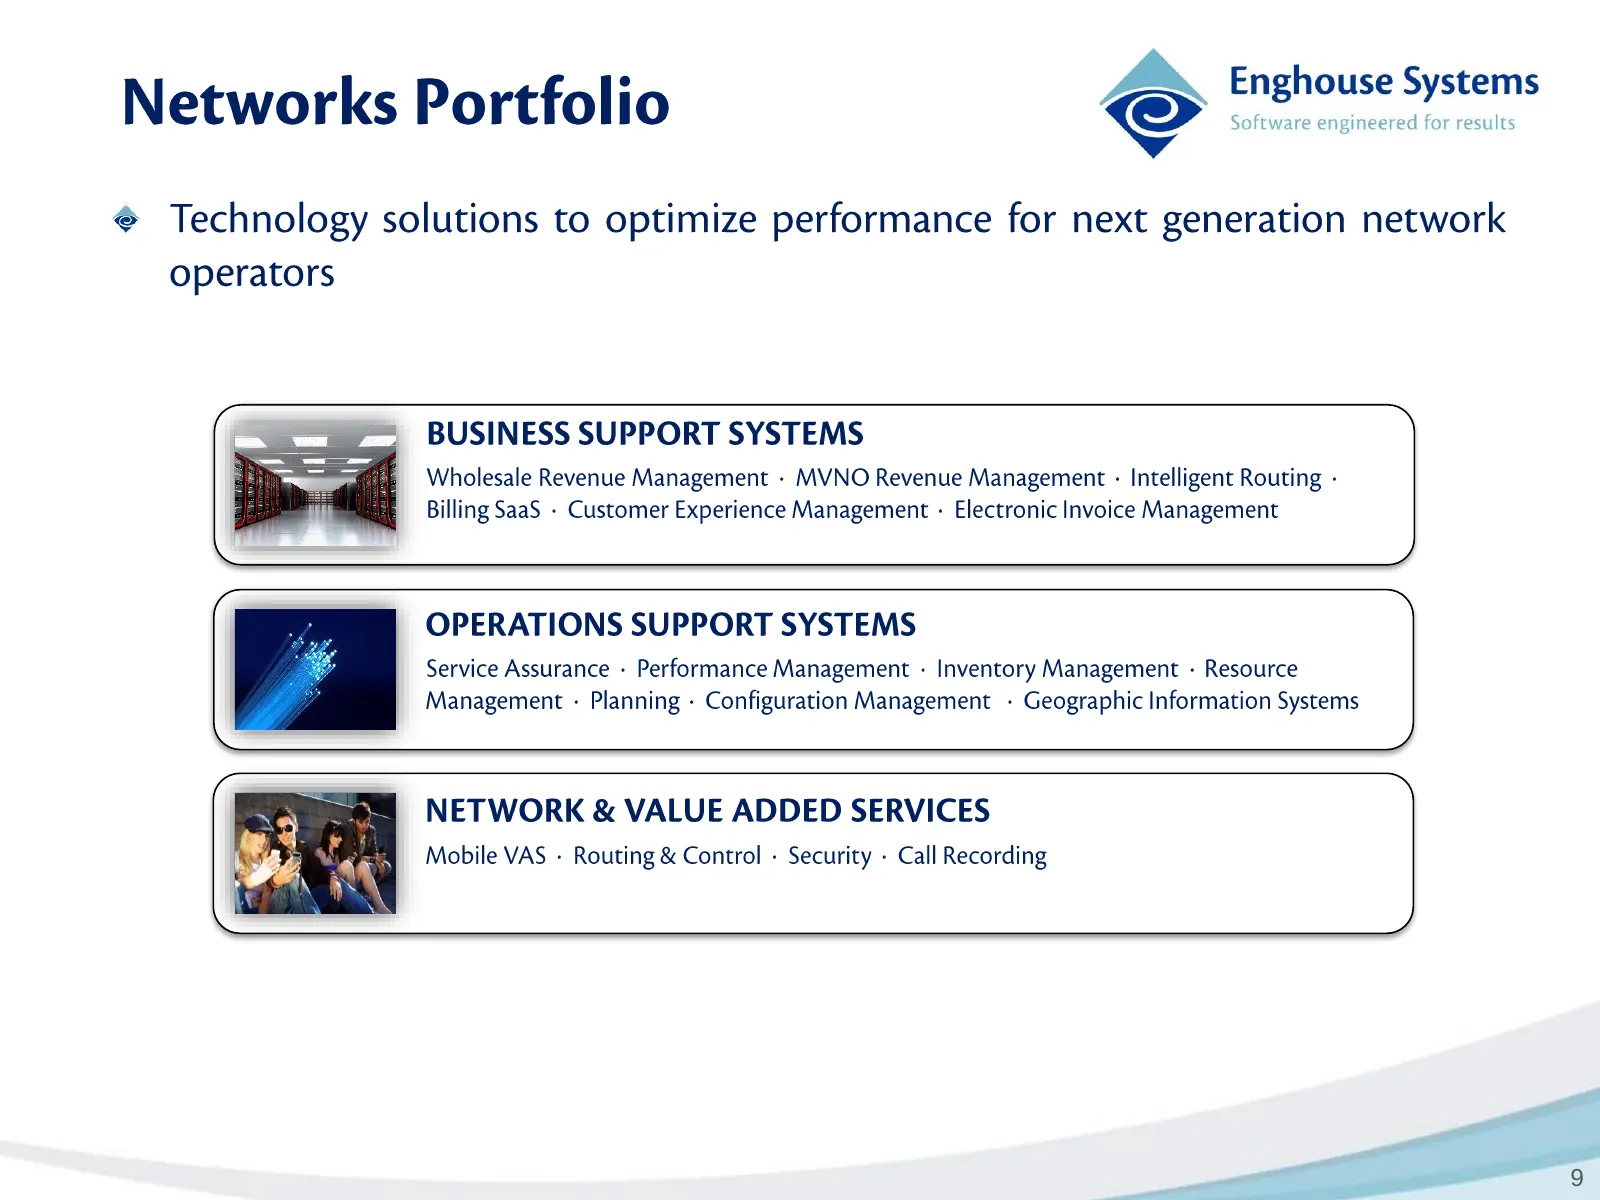
Enghouse Systems . rN Networks Portfolio SP scorer esr @ Technology solutions to optimize performance for next generation network operators ( : BUSINESS SUPPORT SYSTEMS ) Wholesale Revenue Management - MVNO Revenue Management - Intelligent Routing - Billing SaaS - Customer Experience Management - El
Slide 10: Transportation - Sector Dynamics
Software engineered for results Transportation - Sector Dynamics cos Enghause Systernis (— > Fragmented and competitive market. New technologies driving growth in systems and tangible cost benefits / savings \ / (— Evolving tablet and smart phone technologies replacing traditional Mobile Data Termin
Slide 11: Transportation Portfolio
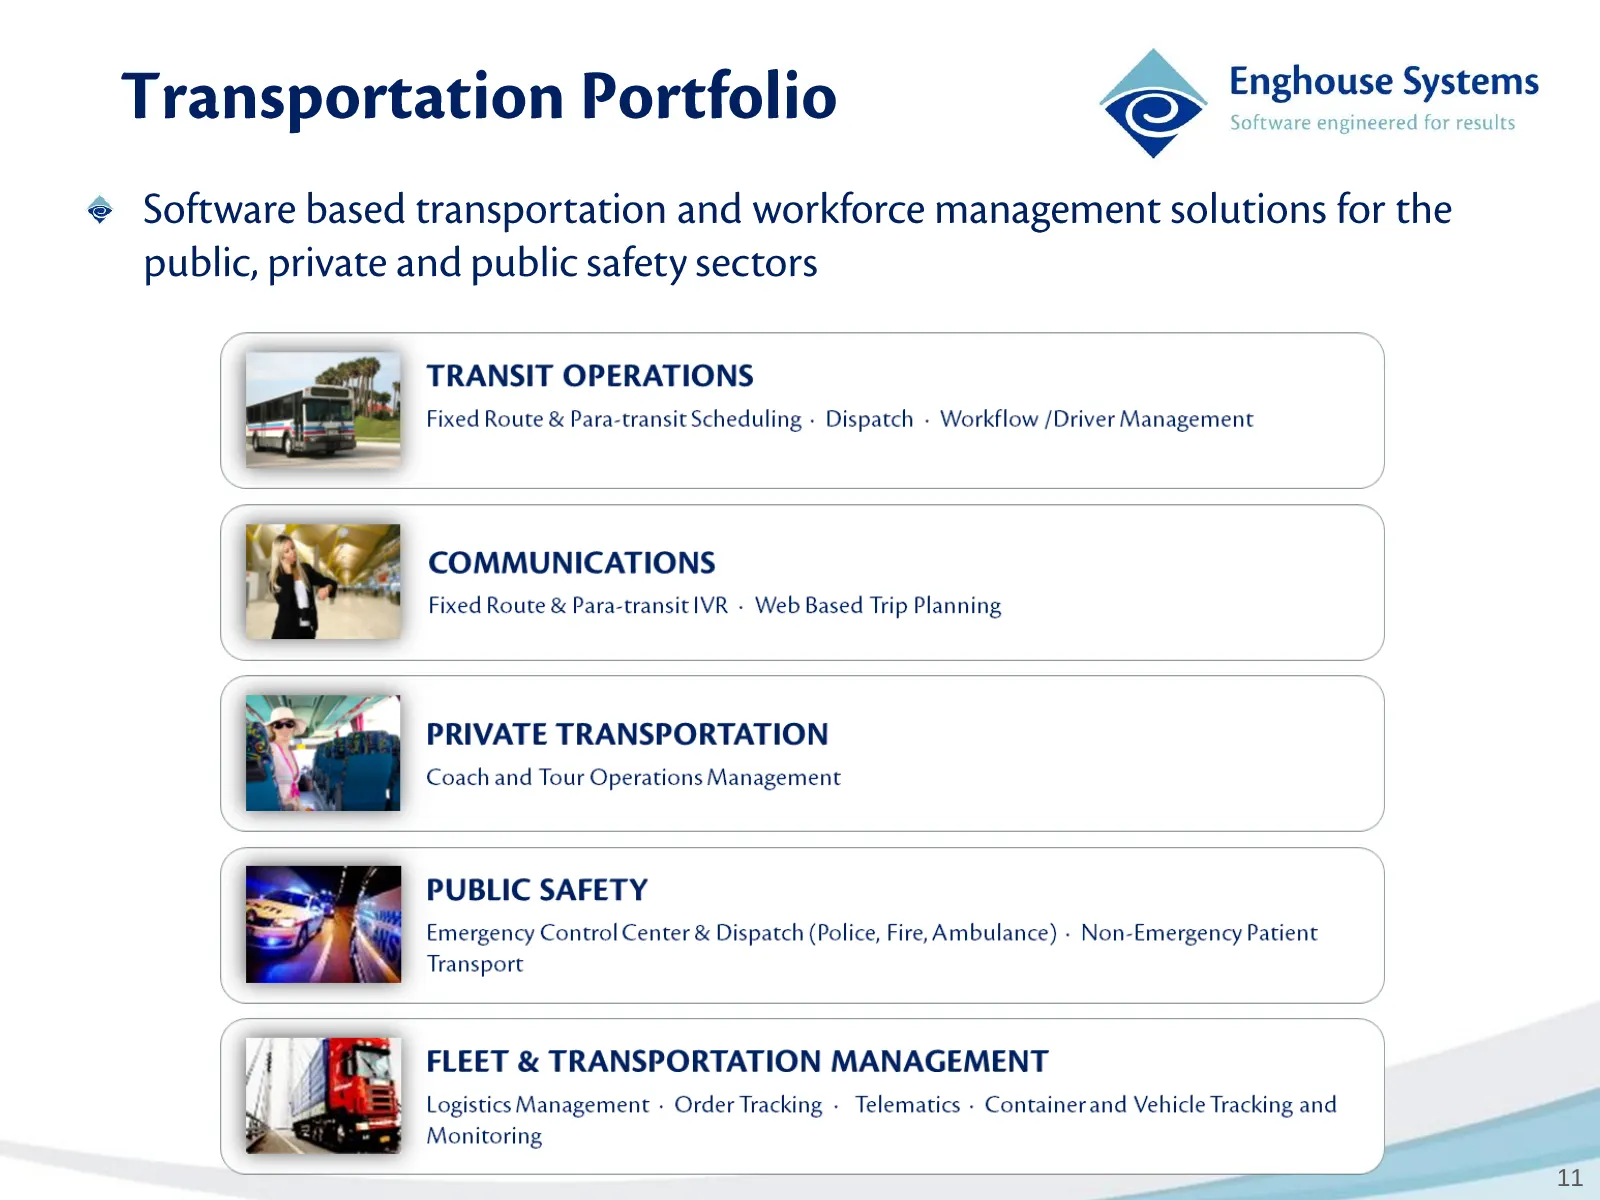
Enghouse Systems Software engineered for results Transportation Portfolio cos @ Software based transportation and workforce management solutions for the public, private and public safety sectors TRANSIT OPERATIONS Fixed Route & Para-transit Scheduling - Dispatch - Workflow /Driver Management Fixed R
Slide 12: Annual Results
Enghouse Systems © Software engineered for results ANNUAL RESULTS
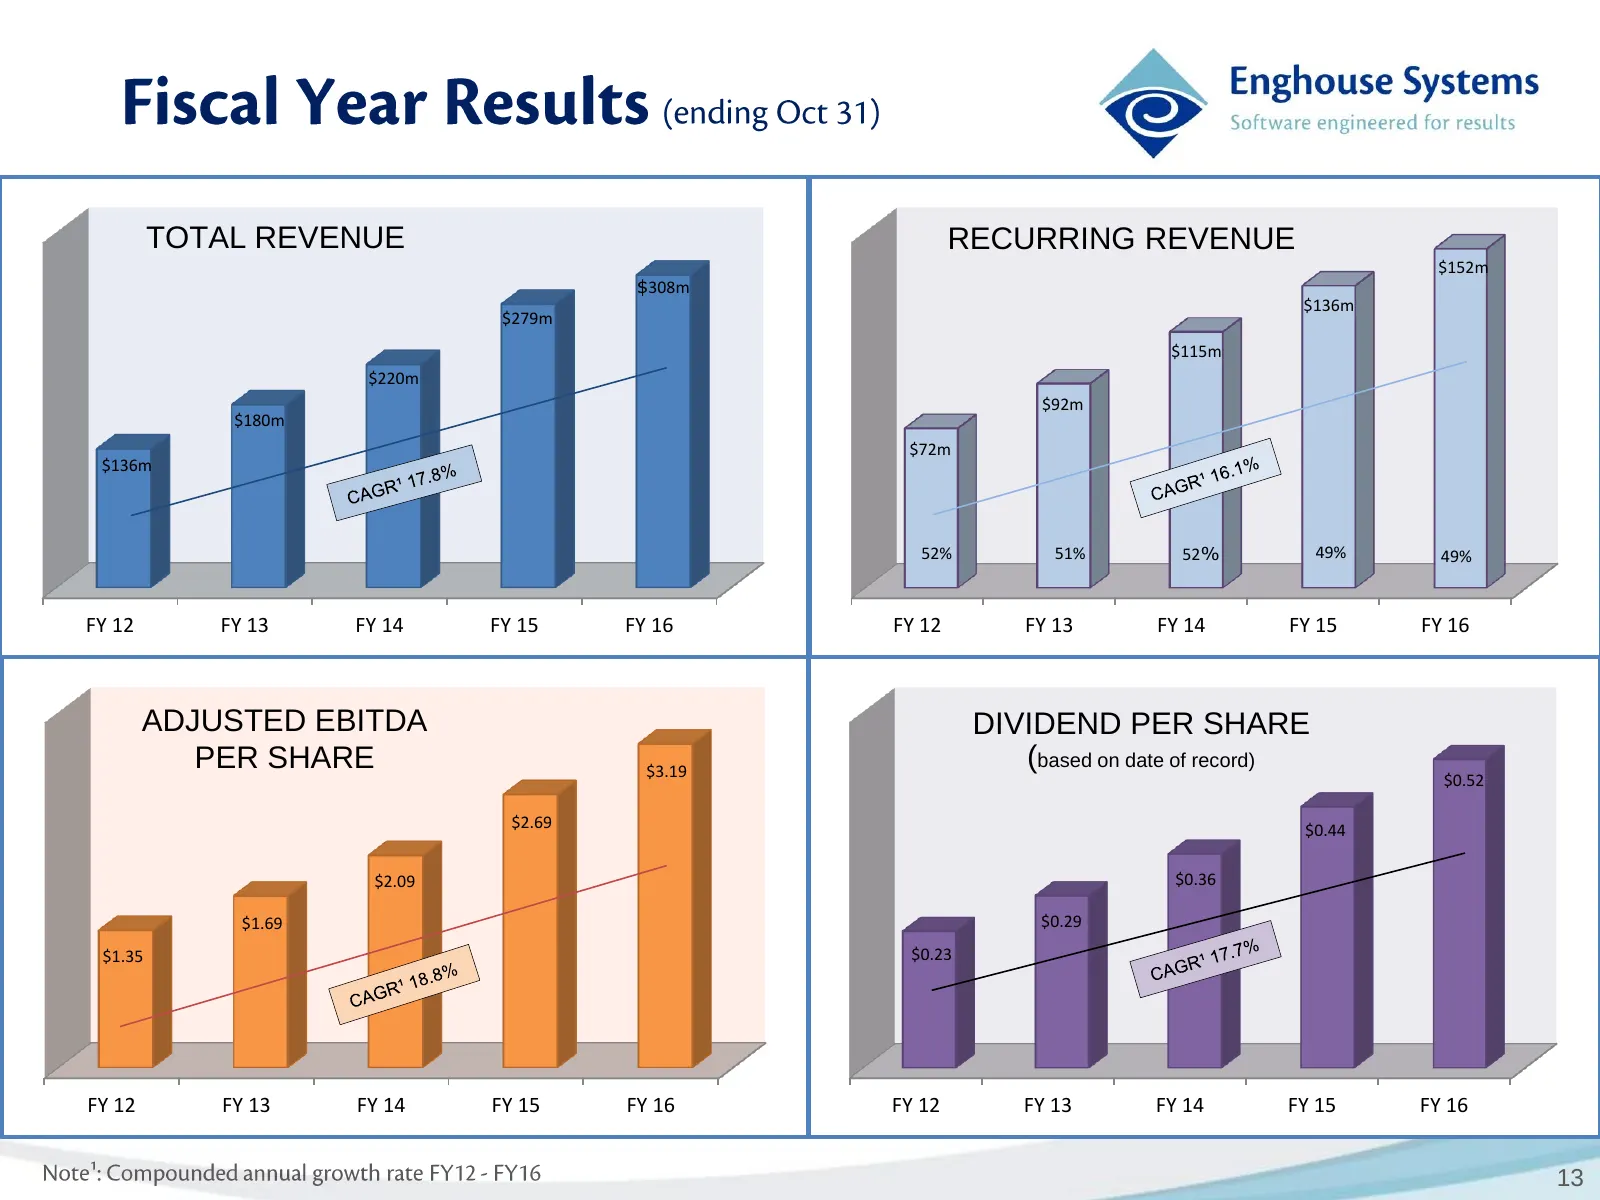
Slide 13: Revenue, Recurring Revenue, Adjusted EBITDA, Dividend per Share
TOTAL REVENUE RECURRING REVENUE $152m $308m $136m $279m $115m $220m $92m $180m $72m $136m 52% 51% 52% 49% 49% FY 12 FY 13 FY 14 FY 15 FY 16 FY 12 FY 13 FY 14 FY 15 FY 16 ADJUSTED EBITDA DIVIDEND PER SHARE PER SHARE $3.19 (based on date of record) $0.52 $2.69 $0.44 $2.09 $0.36 $1.69 $0.29 $1.35 $0.23
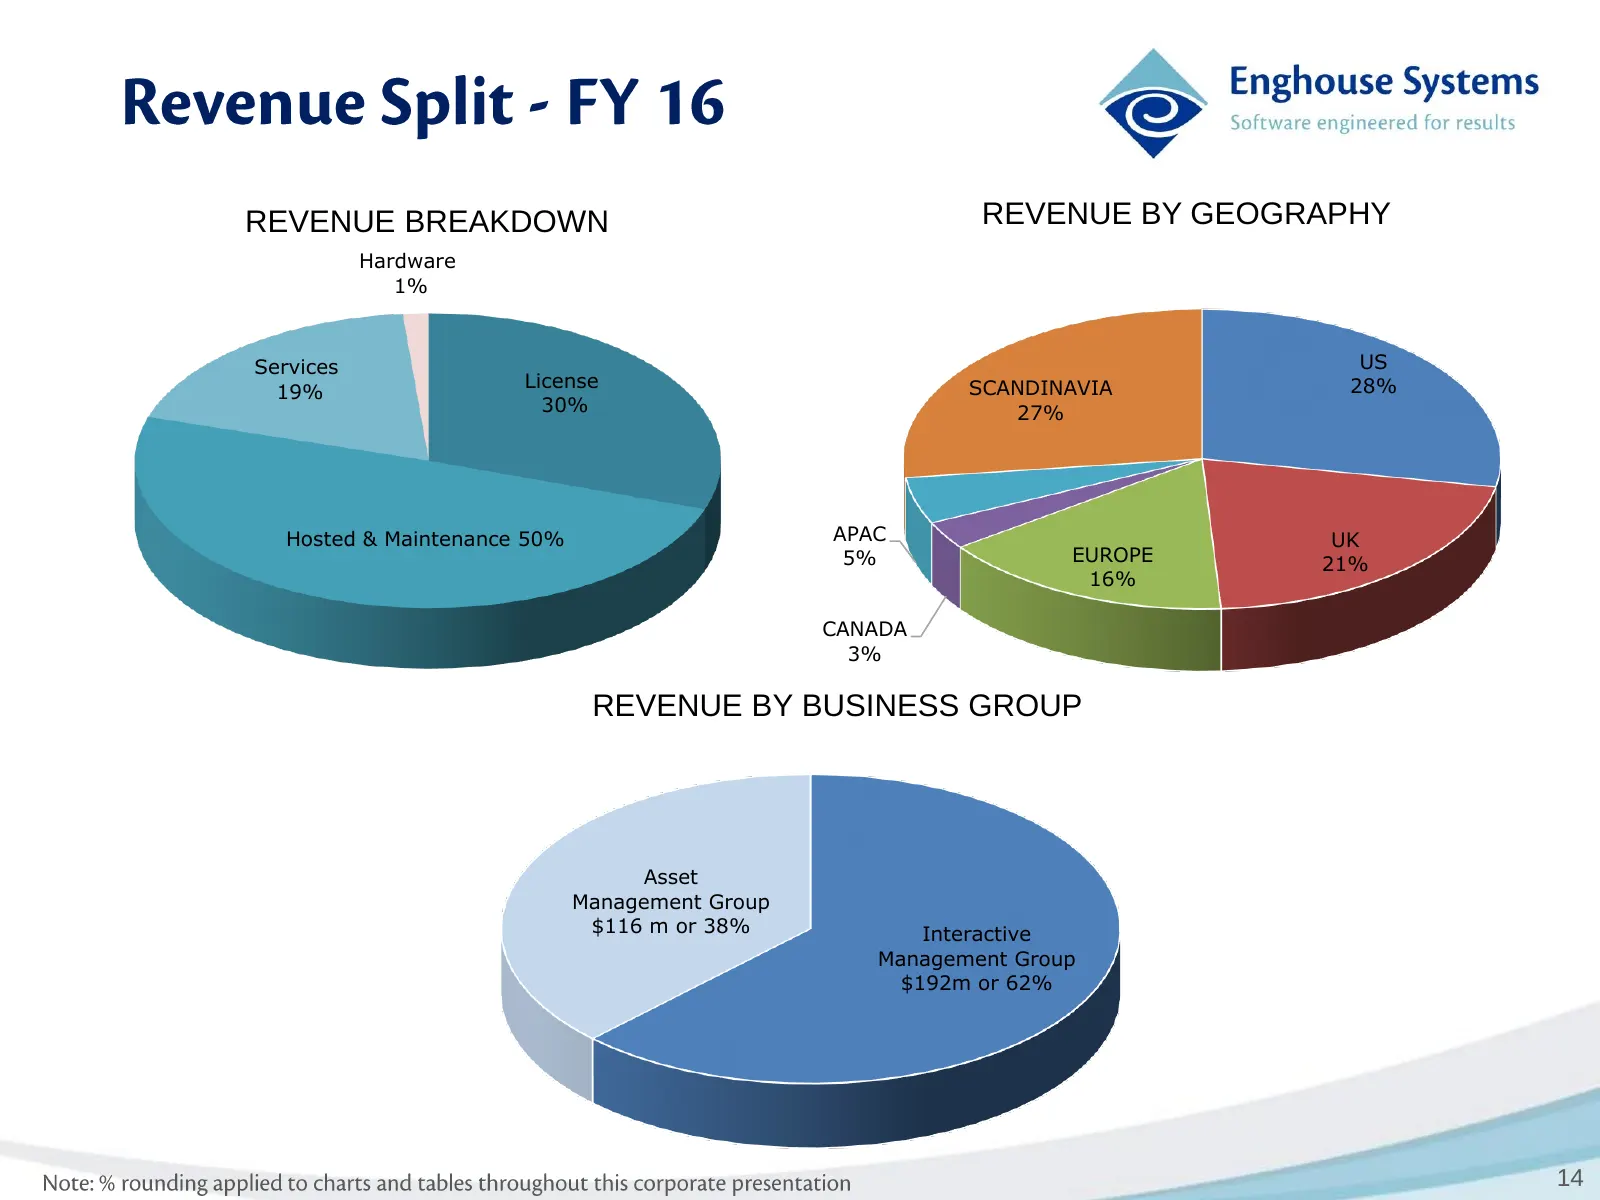
Slide 14: Revenue by Geography, Breakdown and Business Group
REVENUE BREAKDOWN REVENUE BY GEOGRAPHY Hardware 1% Services US License SCANDINAVIA 28% 19% 30% 27% Hosted & Maintenance 50% APAC UK 5% EUROPE 21% 16% CANADA 3% REVENUE BY BUSINESS GROUP Asset Management Group $116 m or 38% Interactive Management Group $192m or 62% 14
Slide 15: FY Results
Enghouse Systems © Software engineered for results FY 16 RESULTS
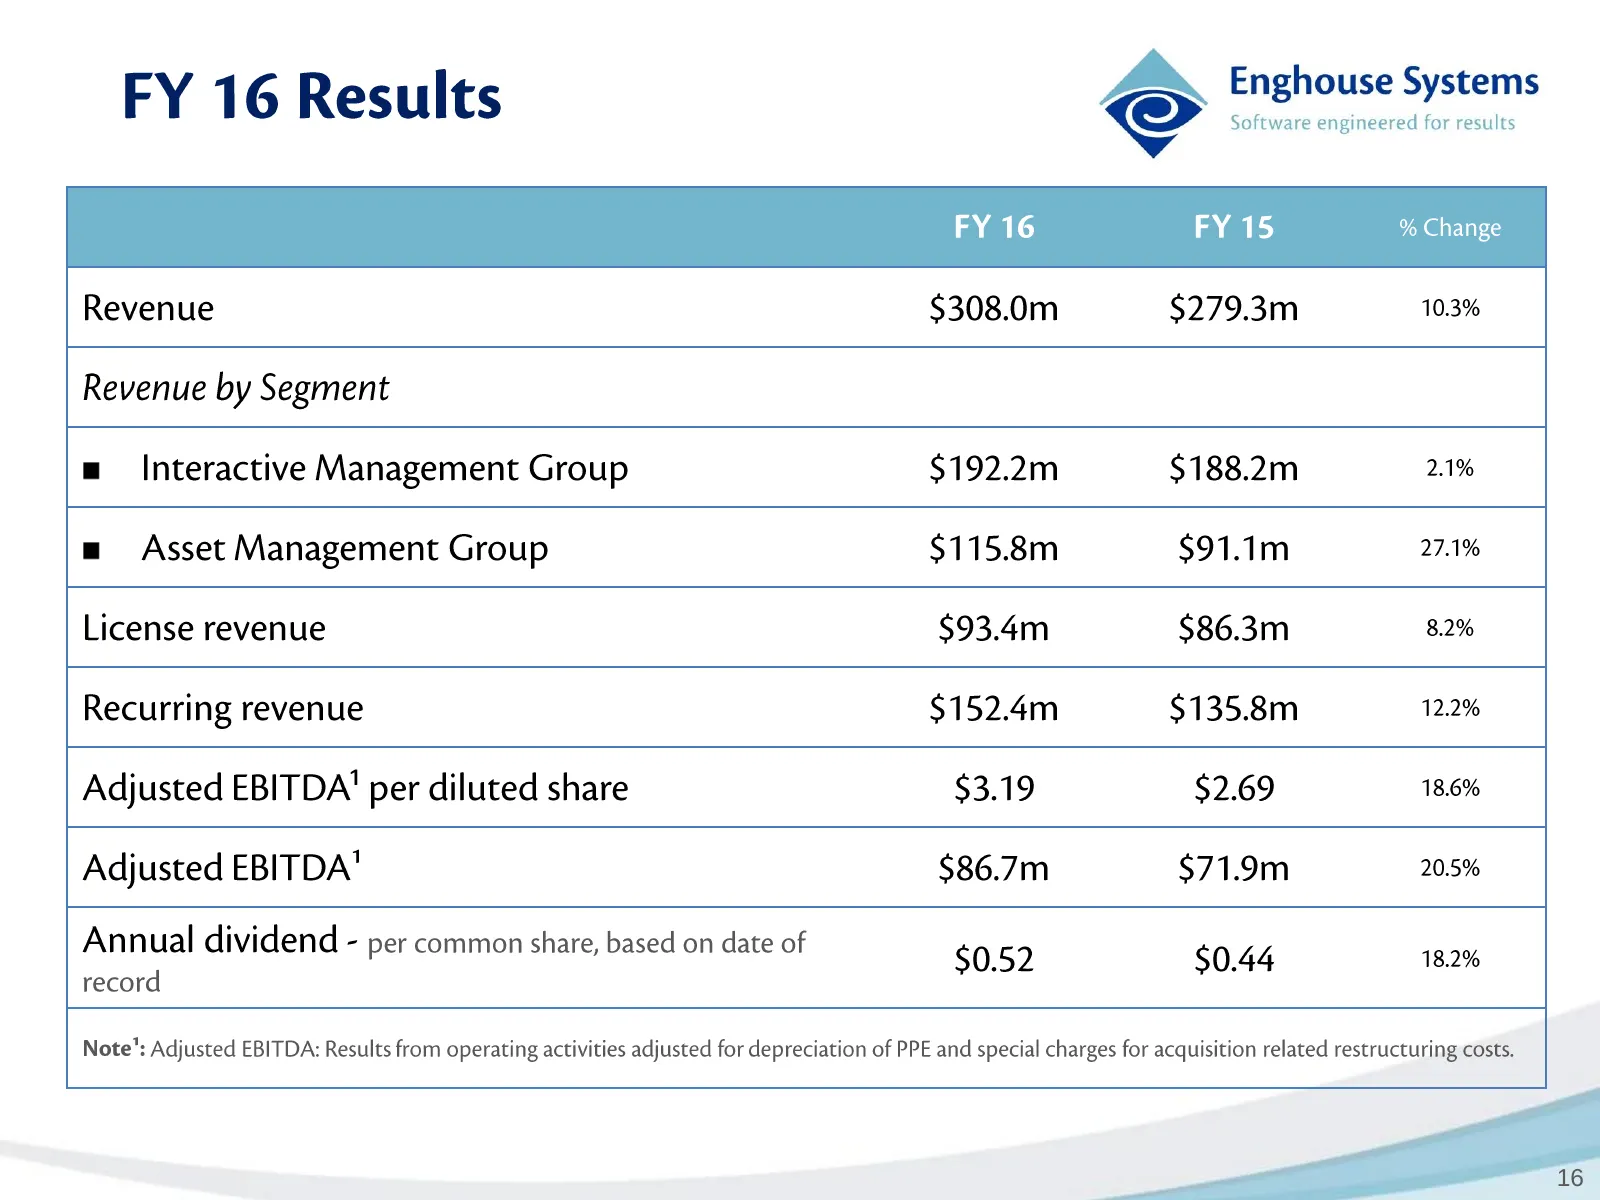
Slide 16: FY Results
Software engineered for results y oN Enghouse Systems FY 16 Results © FY 16 FY 15 % Change Revenue $308.0m $279.3m 10.3% Revenue by Segment m_ Interactive Management Group $192.2m $188.2m 2.1% m Asset Management Group $115.8m $91.1m 27.1% License revenue $93.4m $86.3m 8.2% Recurring revenue $152.4m
Slide 17: FY Results: Cash, Dividends and Acquisitions
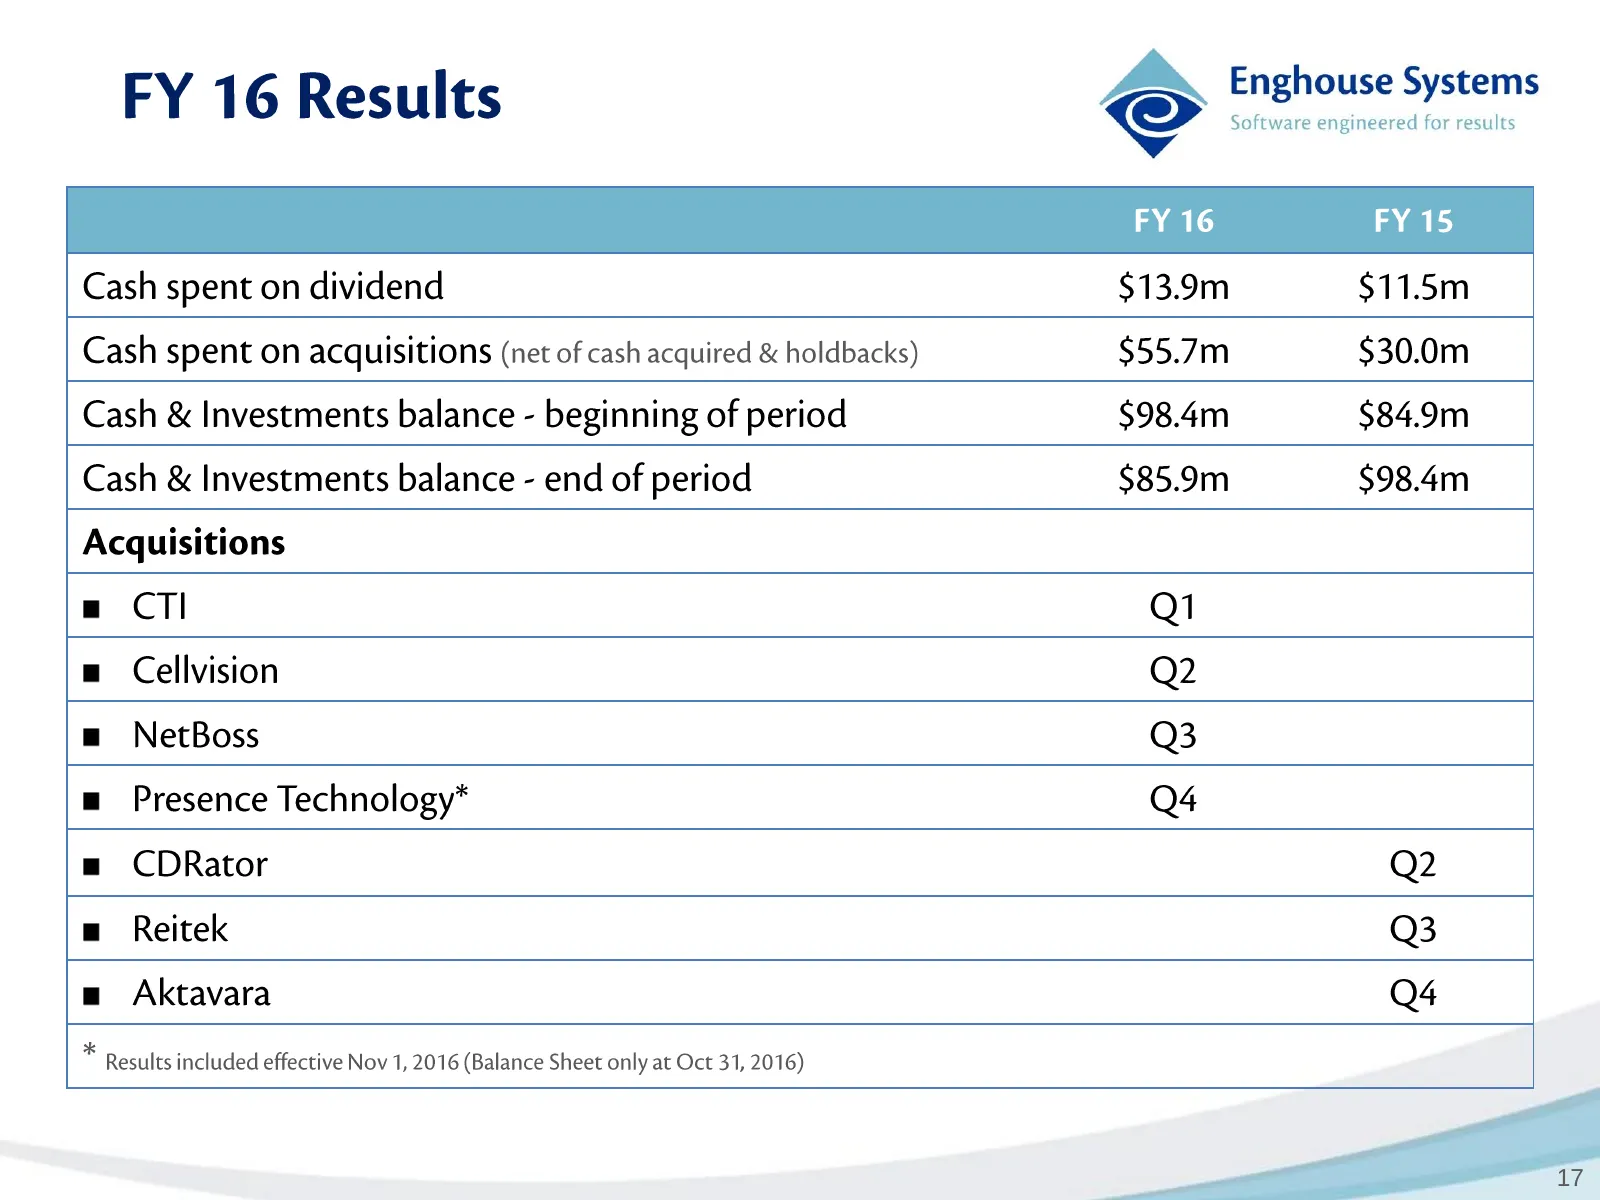
Software engineered for results FY 16 FY 15 y oN Enghouse Systems FY 16 Results © Cash spent on dividend $13.9m $11.5m Cash spent on acquisitions (net of cash acquired & holdbacks) $55.7m $30.0m Cash & Investments balance - beginning of period $98.4m $84.9m Cash & Investments balance - end of period
Slide 18: Q1 FY17
Enghouse Systems © Software engineered for results QIUFY 17
Slide 19: Q1 FY17 Results
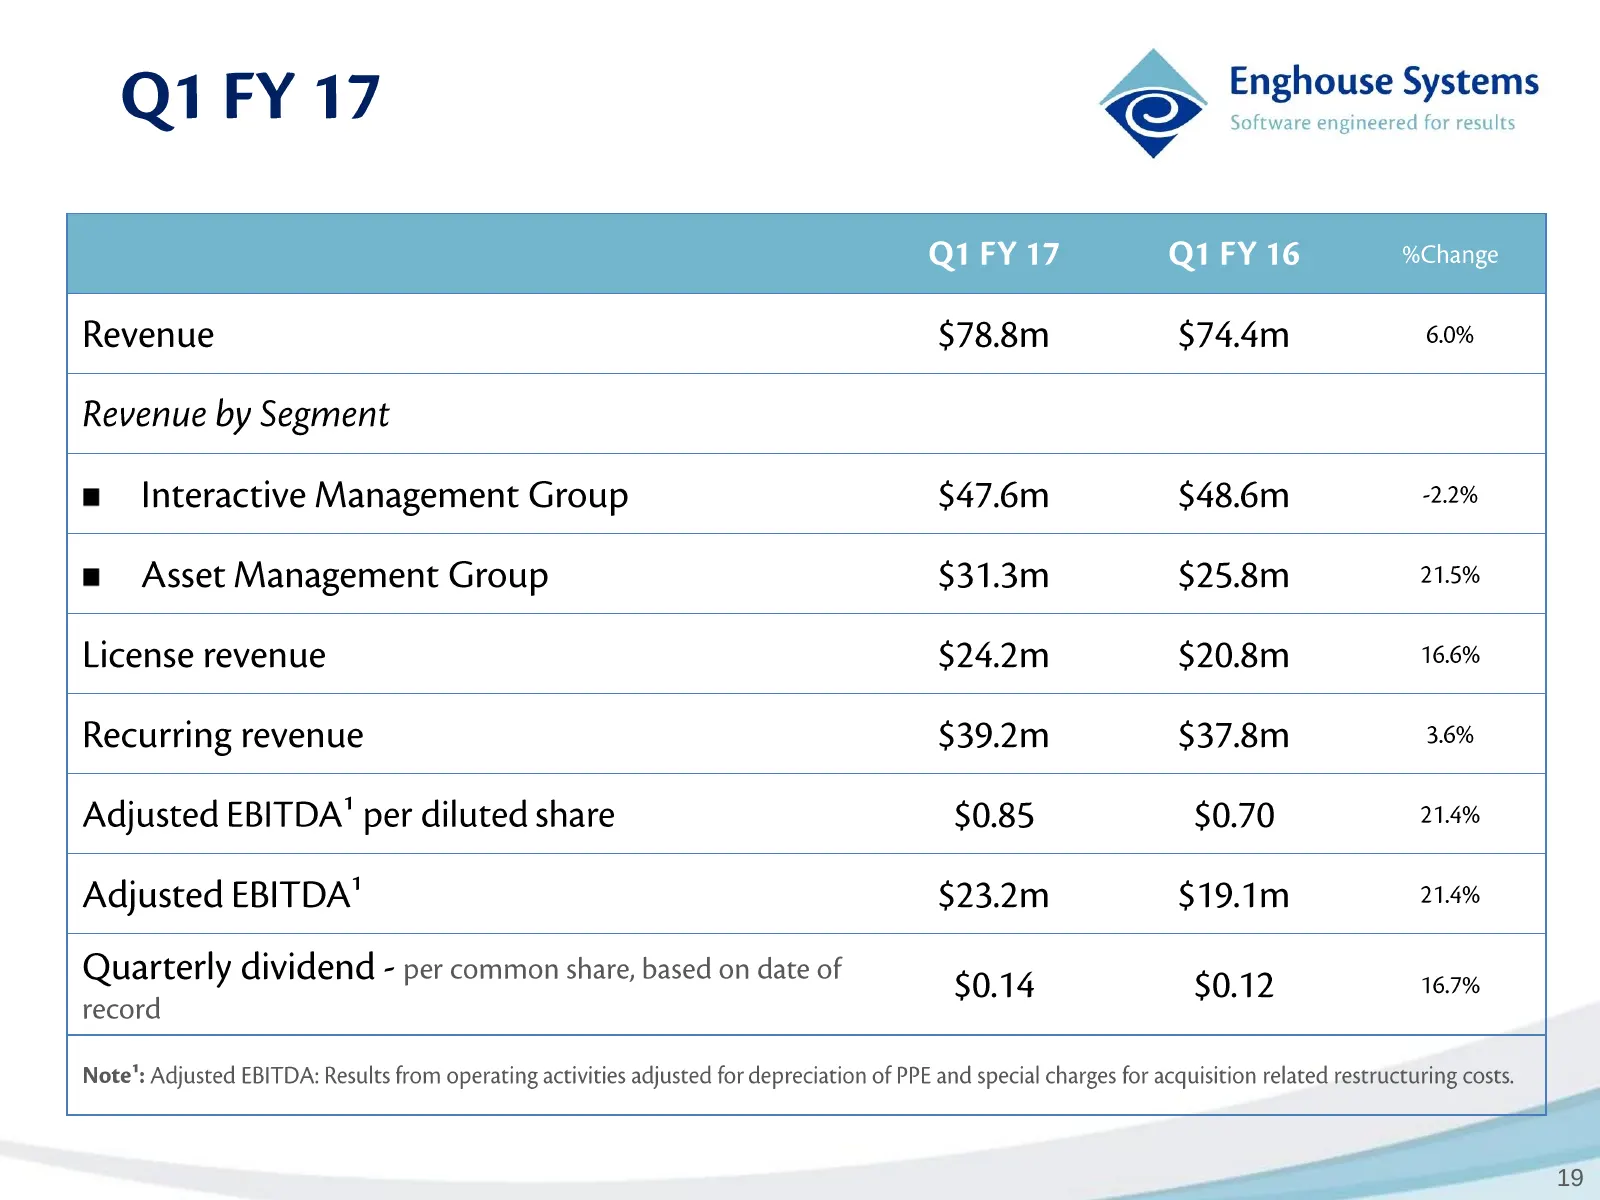
Software engineered for results y oN Enghouse Systems Q1 FY 17 © QUFY 17 QI FY 16 %Change Revenue $78.8m $74.4m 6.0% Revenue by Segment m Interactive Management Group $47.6m $48.6m 2.2% m Asset Management Group $31.3m $25.8m 21.5% License revenue $24.2m $20.8m 16.6% Recurring revenue $39.2m $37.8m 3
Slide 20: Q1 FY17 Cash, Dividends and Acquisitions
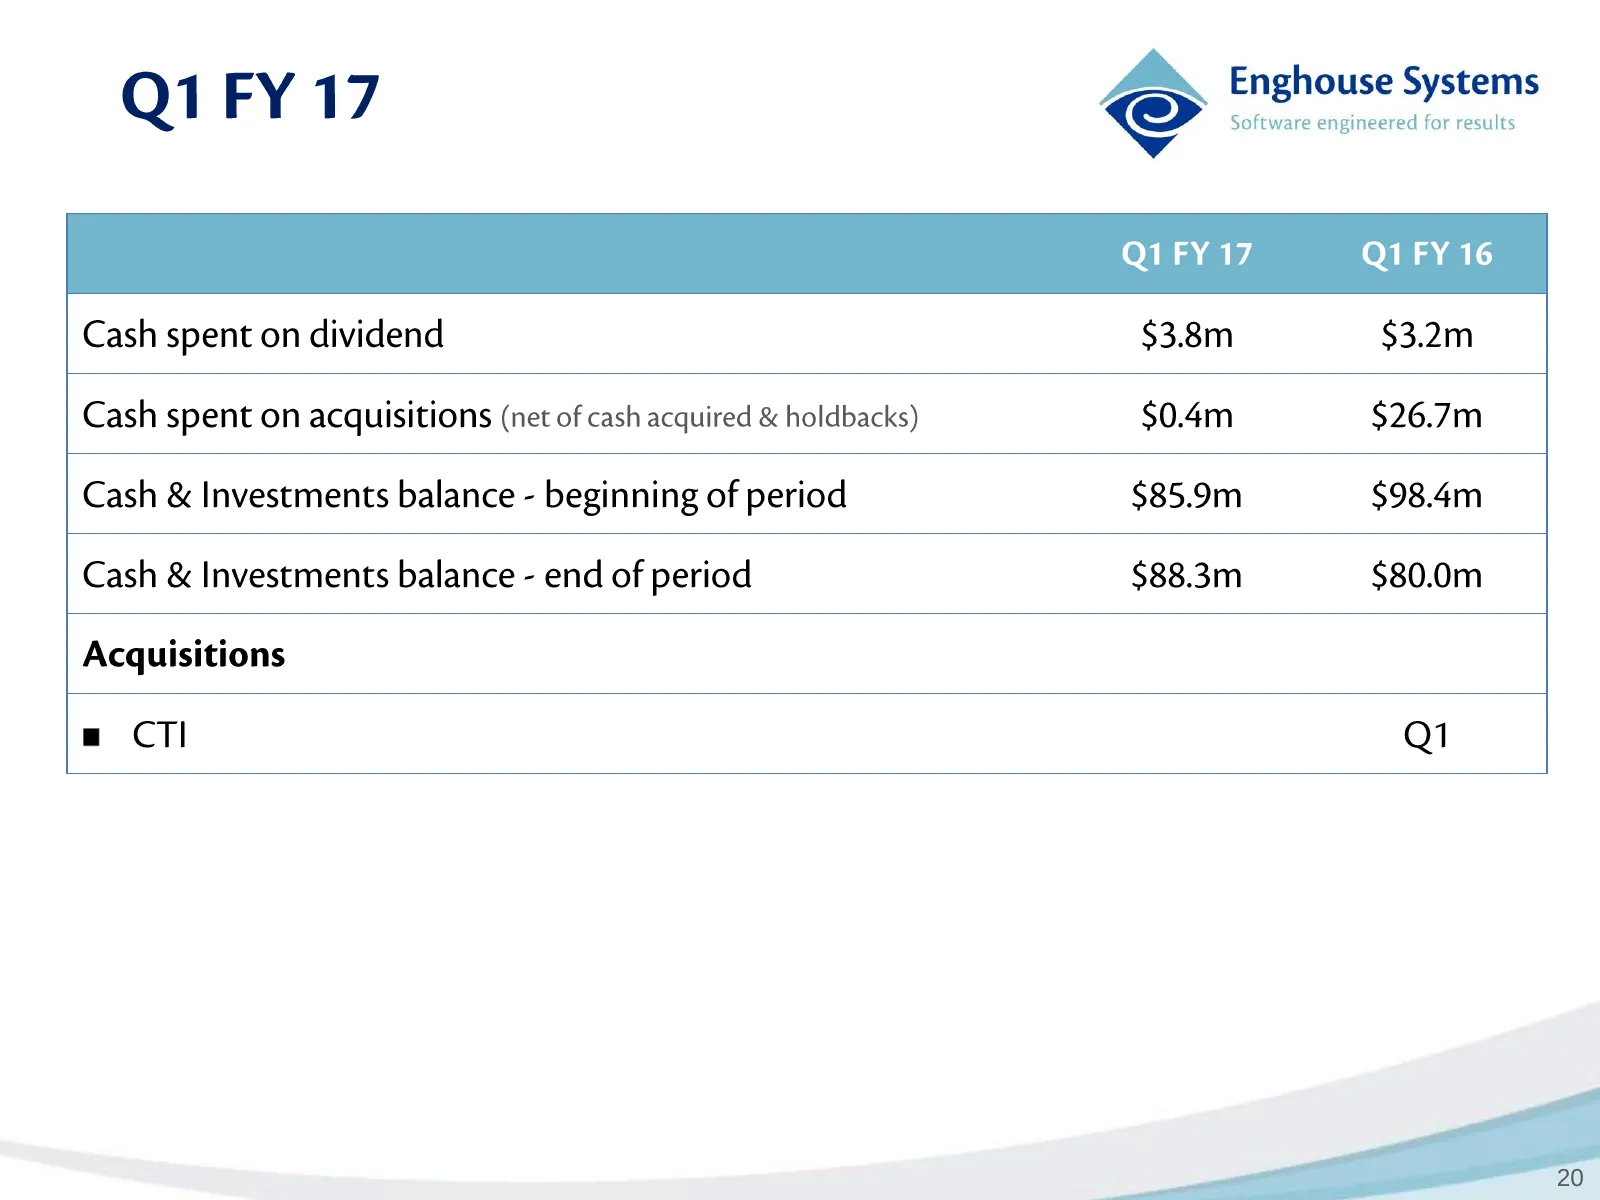
Software engineered for results QUFY 17 QIFY 16 y oN Enghouse Systems Q1 FY 17 © Cash spent on dividend $3.8m $3.2m Cash spent on acquisitions (net of cash acquired & holdbacks) $0.4m $26.7m Cash & Investments balance - beginning of period $85.9m $98.4m Cash & Investments balance - end of period $88
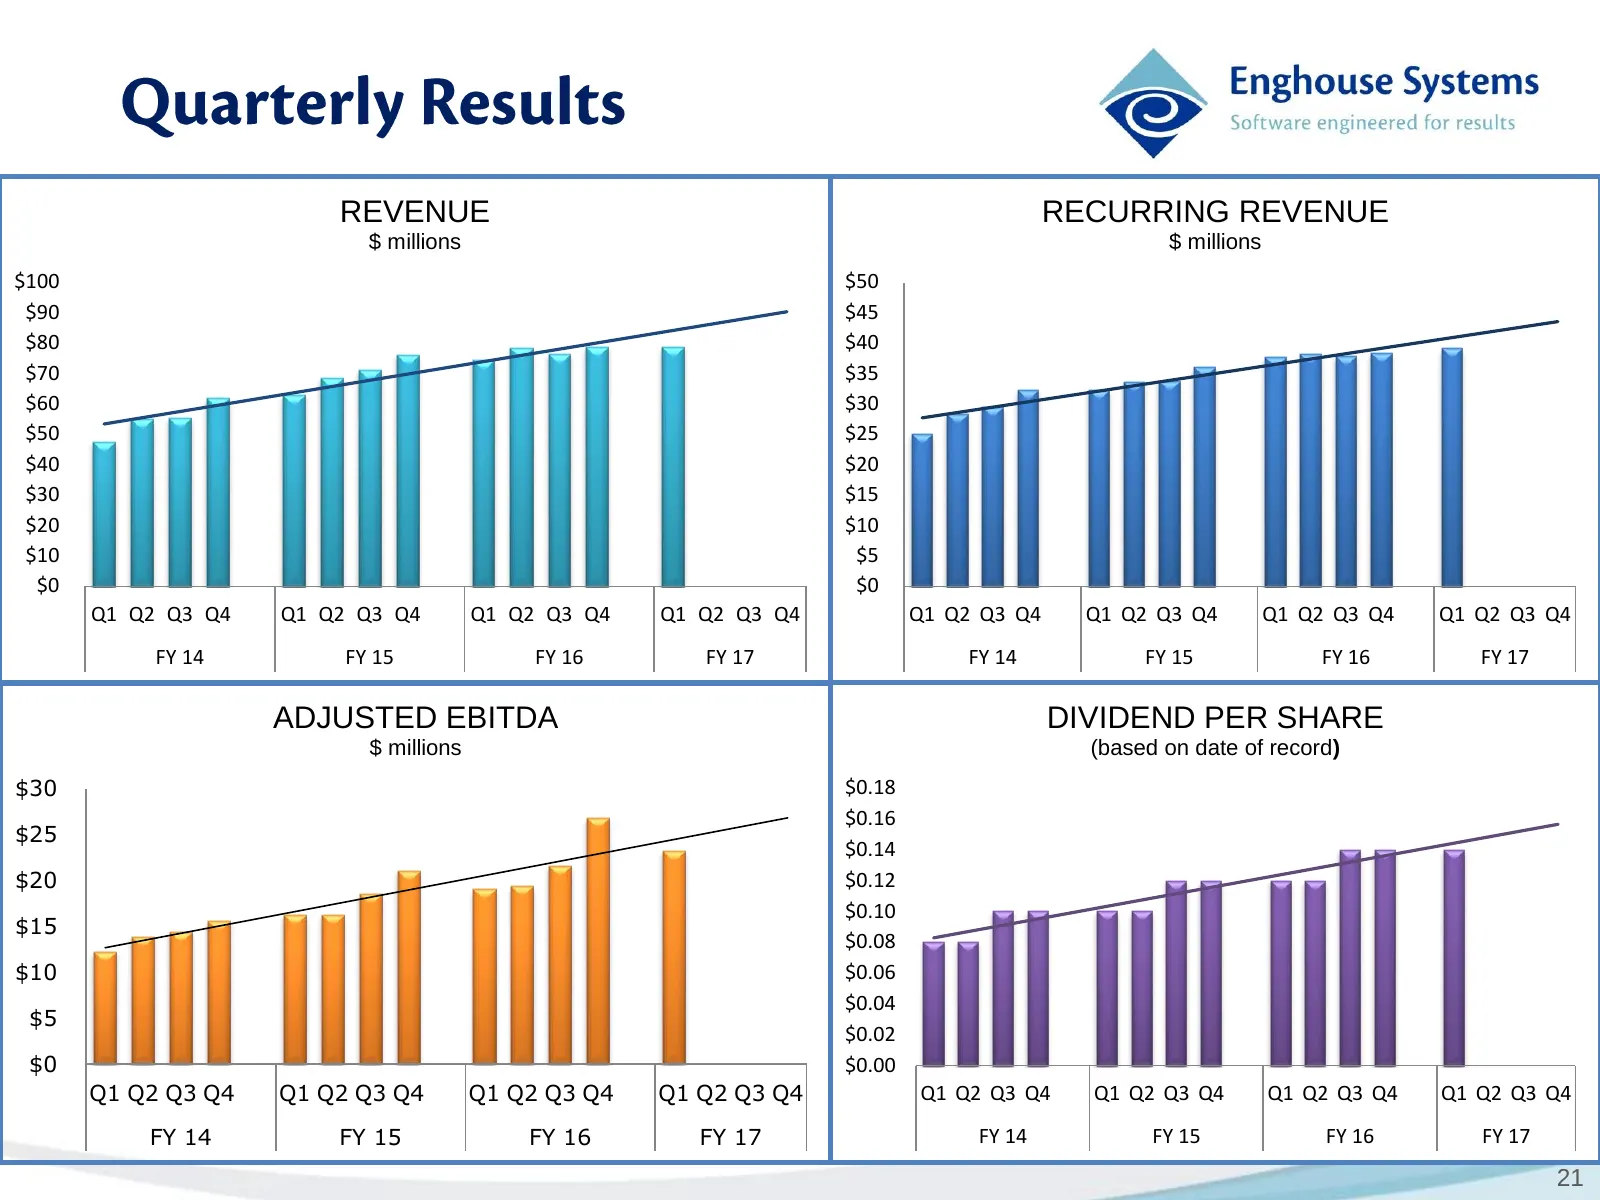
Slide 21: Quarterly Revenue, Recurring Revenue, Adjusted EBITDA, Dividend
REVENUE RECURRING REVENUE $ millions $ millions $100 $50 $90 $45 $80 $40 $70 $35 $60 $30 $50 $25 $40 $20 $30 $15 $20 $10 $10 $5 $0 $0 Q1 Q2 Q3 Q4 Q1 Q2 Q3 Q4 Q1 Q2 Q3 Q4 Q1 Q2 Q3 Q4 Q1 Q2 Q3 Q4 Q1 Q2 Q3 Q4 Q1 Q2 Q3 Q4 Q1 Q2 Q3 Q4 FY 14 FY 15 FY 16 FY 17 FY 14 FY 15 FY 16 FY 17 ADJUSTED EBITDA DIVIDE
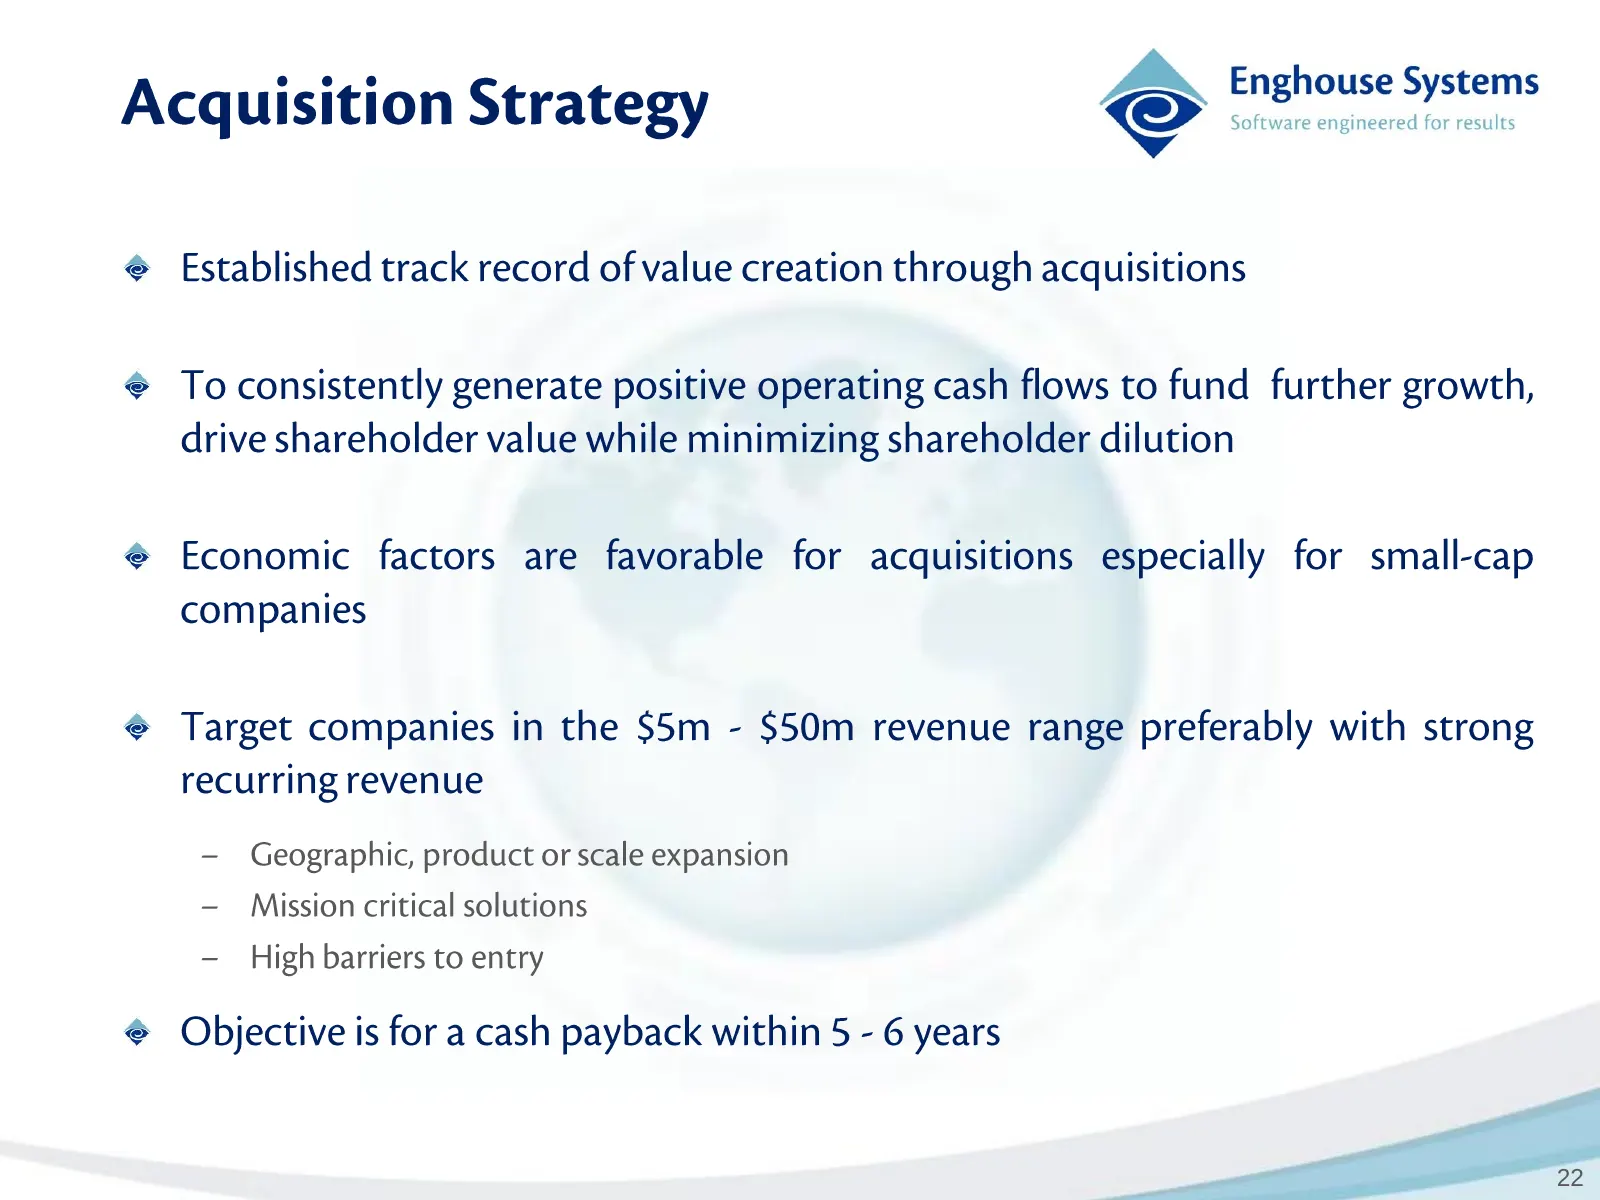
Slide 22: Acquisition Strategy
Enghouse Systems Acquisition Strategy cos nm @ Established track record of value creation through acquisitions @ To consistently generate positive operating cash flows to fund further growth, drive shareholder value while minimizing shareholder dilution @ Economic factors are favorable for acquisiti
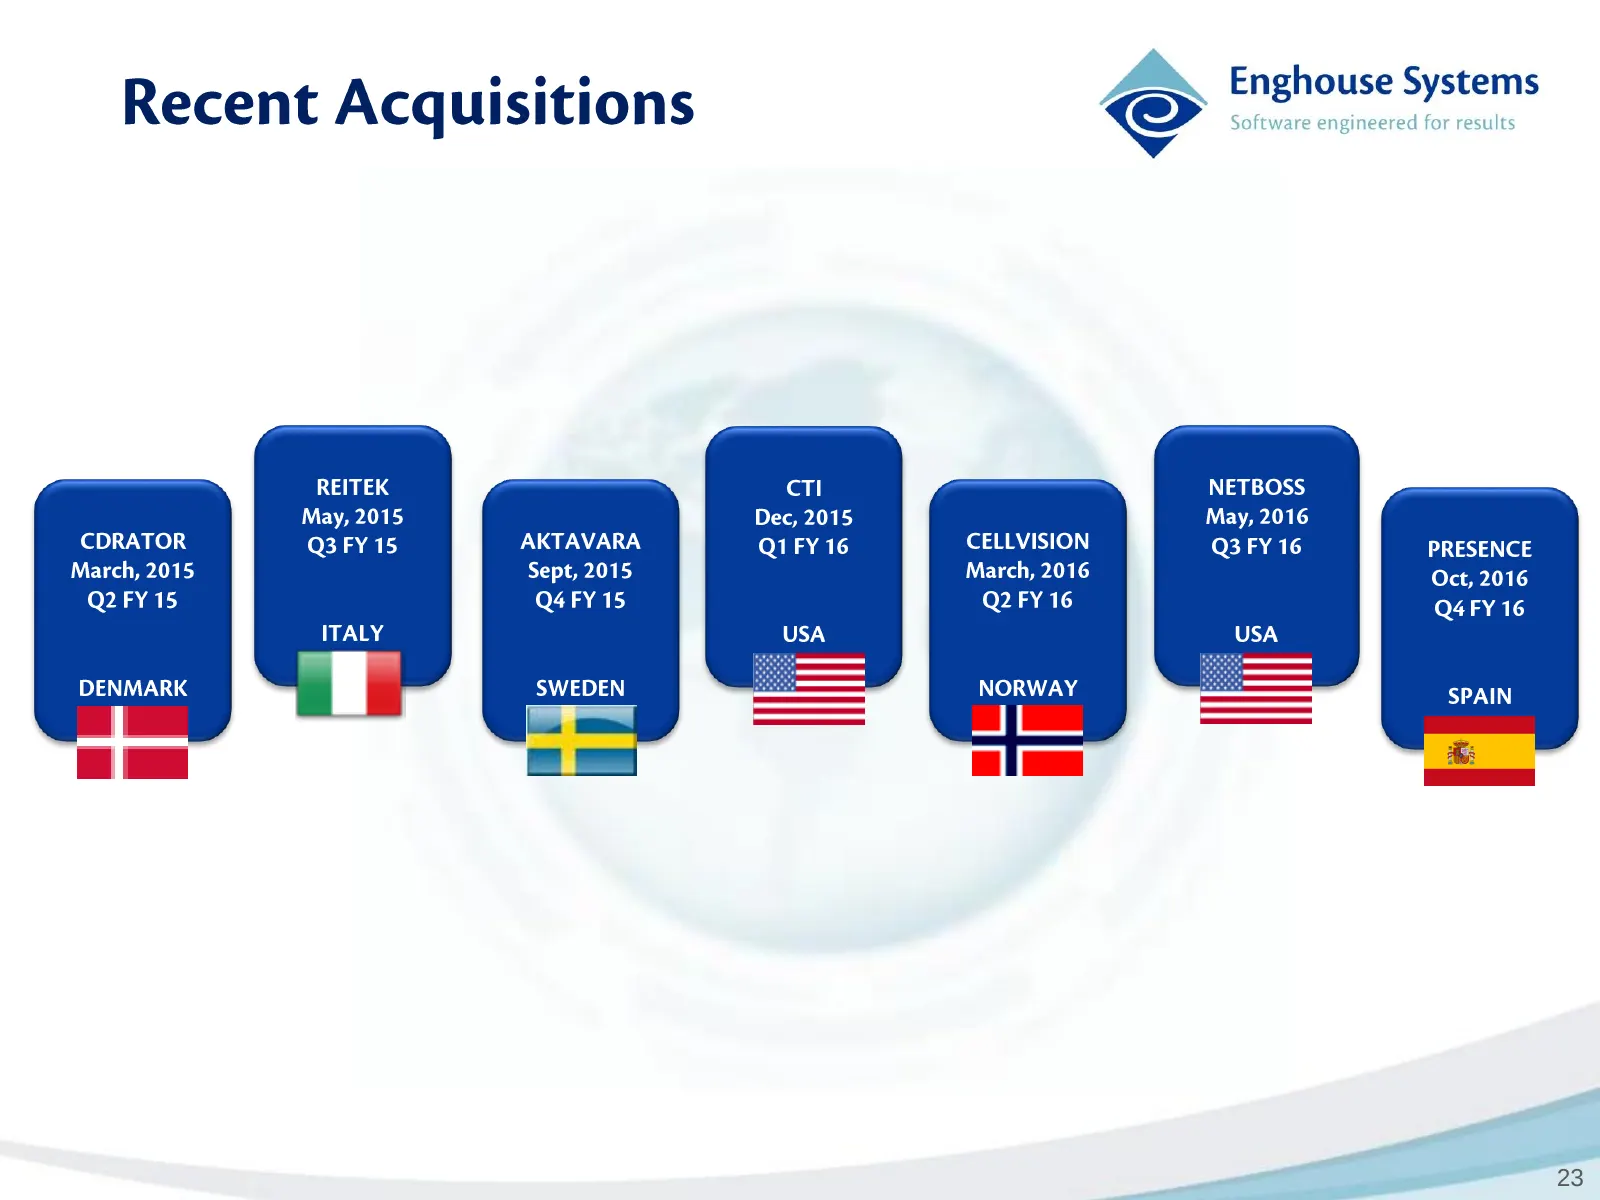
Slide 23: Recent Acquisitions
Recent Acquisitions REITEK May, 2015 Q3FY15 CDRATOR March, 2015 Q2FY15 DENMARK a AKTAVARA Sept, 2015 Q4FY 15 SWEDEN la aa cTl Dec, 2015 QUFY 16 CELLVISION March, 2016 Q2FY 16 NORWAY Enghouse Systems © Software engineered for results NETBOSS May, 2016 Q3 FY 16 PRESENCE Oct, 2016 Q4FY 16 23
Slide 24: Thank You!
Enghouse Systems © Software engineered for results THANK You!
Source: Internet Archive copy of enghouse.com
More decks from Enghouse Systems Limited
 Q3 FY2026 Earnings Presentation16 slides · Sep 11, 2026
 Q1 2026 Earnings Presentation16 slides · Mar 13, 2026
 Q1 2025 Earnings Presentation16 slides · Mar 11, 2025
 Q3 2024 Earnings Presentation16 slides · Sep 6, 2024
 Q1 2024 Earnings Presentation15 slides · Mar 14, 2024
 Q4 FY2023 Earnings Presentation15 slides · Dec 15, 2023