Flywire Corporation - Voting · NASDAQ:FLYW
Flywire Corporation - Voting — Flywire — Q3 2026 Earnings Presentation
38 slides from Flywire Corporation - Voting's earnings presentation, Nov 3, 2026
Slide 1: Q3 2026 Earnings Supplement
Q3 2026 Earnings Supplement November 3, 2026
Slide 2: Disclosures
Disclosures This presentation includes forward-looking statements within the meaning of the Private Securities Litigation Reform Act of 1995 and Section 21E of the Securities Exchange Act of 1934, as amended. All statements other than statements of historical facts contained in this presentation, in
Slide 3: How We Do It: Software, Payments and FlyMates
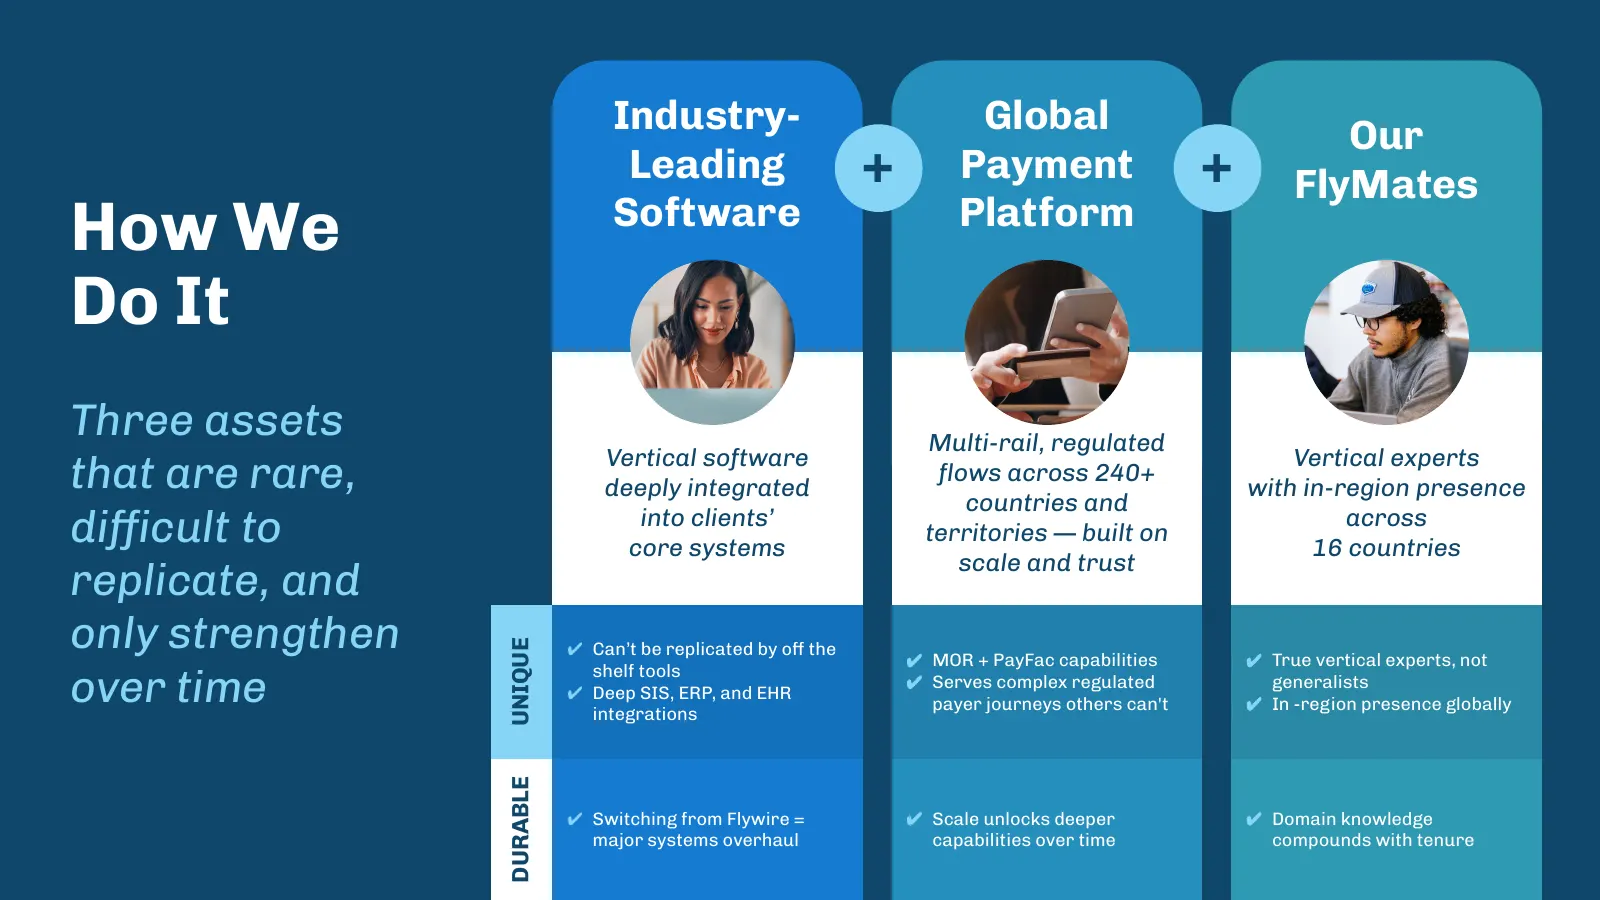
Industry- Global Our Leading + Payment + FlyMates How We Software Platform Do It Three assets Multi-rail, regulated Vertical software Vertical experts that are rare, deeply integrated flows across 240+ with in-region presence countries and difficult to into clients’ core systems territories — built o
Slide 4: Clients Look to Flywire to Solve Payments Complexity
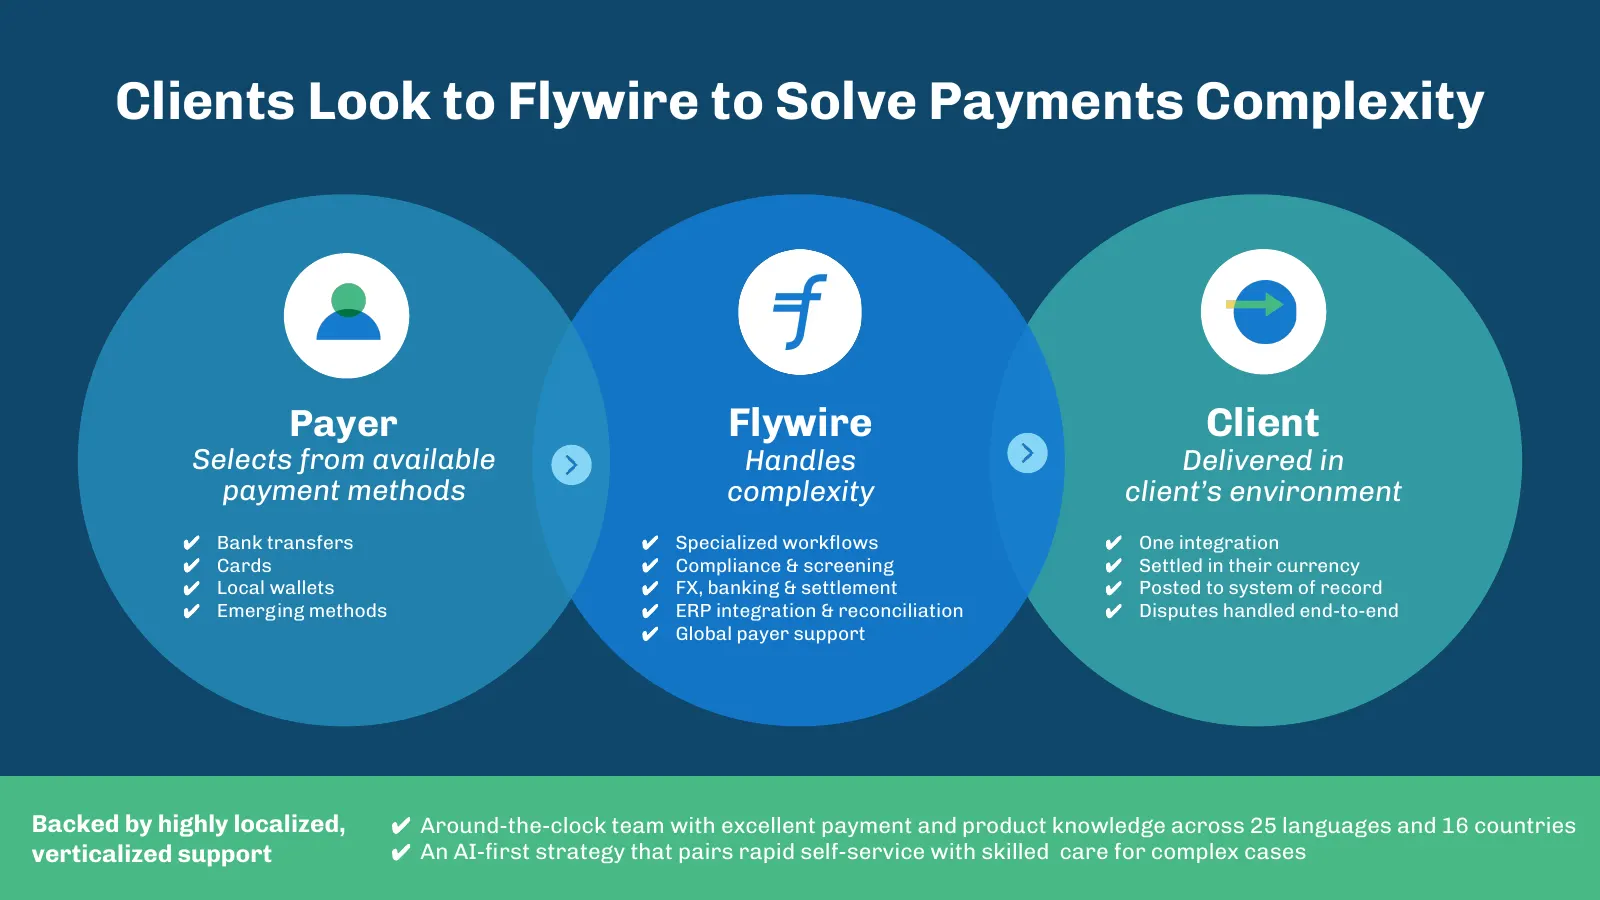
Clients Look to Flywire to Solve Payments Complexity Payer Flywire Client Selects from available Handles Delivered in payment methods complexity client’s environment ✔ Bank transfers ✔ Specialized workflows ✔ One integration ✔ Cards ✔ Compliance & screening ✔ Settled in their currency ✔ Local wallets
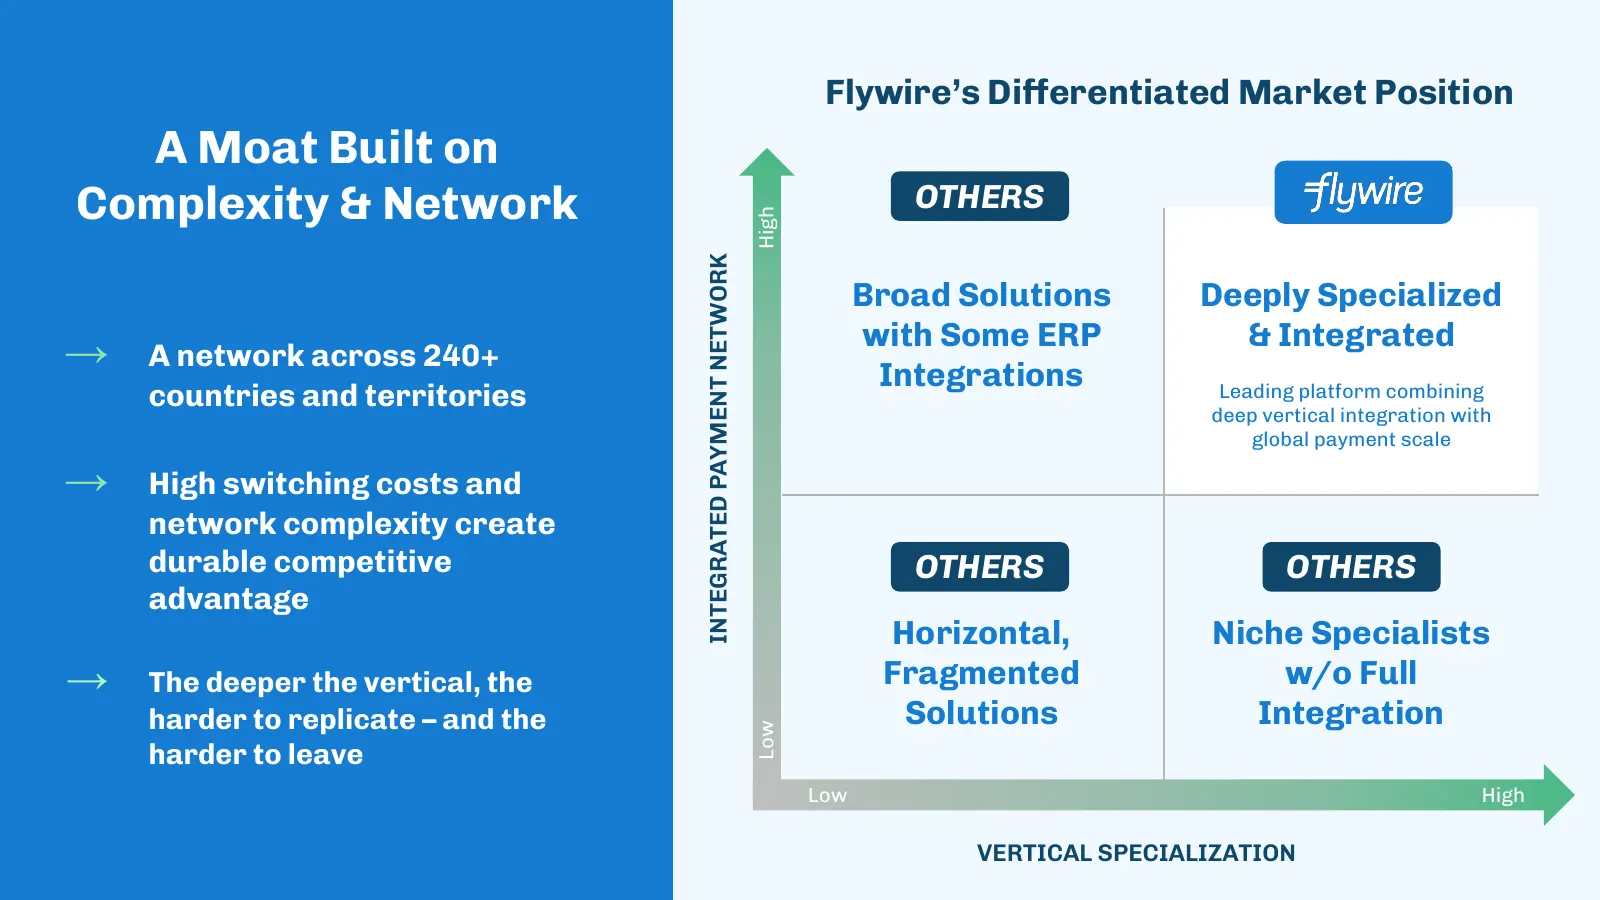
Slide 5: Flywire's Differentiated Market Position
Flywire’s Differentiated Market Position A Moat Built on Complexity & Network OTHERS High INTEGRATED PAYMENT NETWORK Broad Solutions Deeply Specialized with Some ERP & Integrated → A network across 240+ Integrations countries and territories Leading platform combining deep vertical integration with
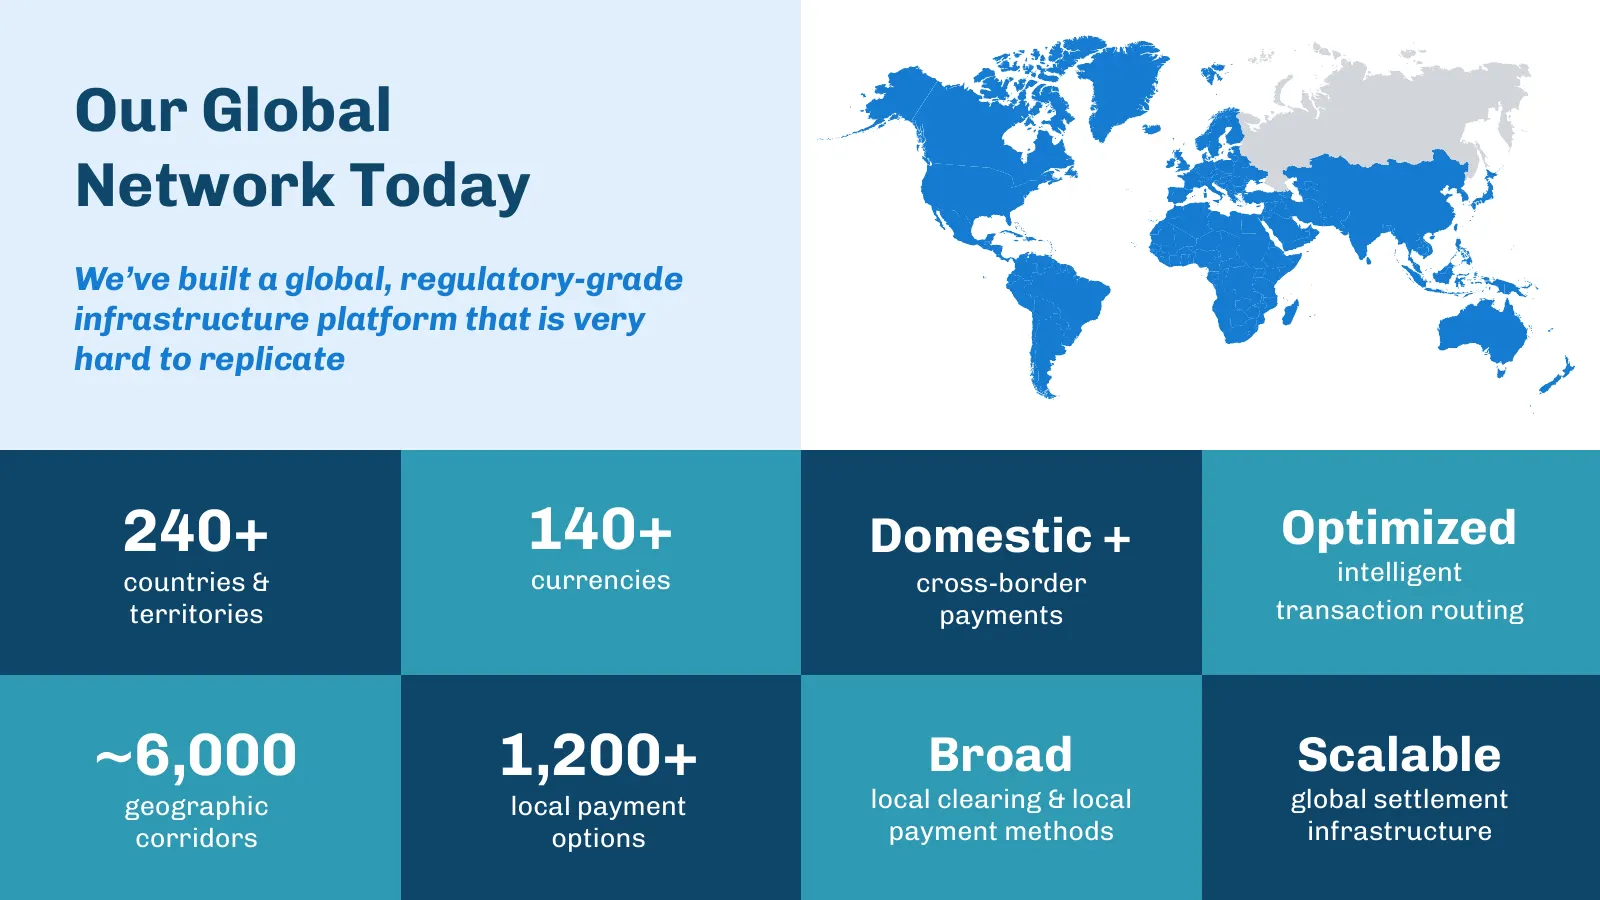
Slide 6: Our Global Network Today
Our Global Network Today We’ve built a global, regulatory-grade infrastructure platform that is very hard to replicate 240+ 140+ Domestic + Optimized countries & currencies cross-border intelligent territories payments transaction routing ~6,000 1,200+ Broad Scalable geographic local payment local c

Slide 7: US EDU Spotlight
US EDU Spotlight a gy 7 1 7 =e 1 / _ 4 VV q = : » i |
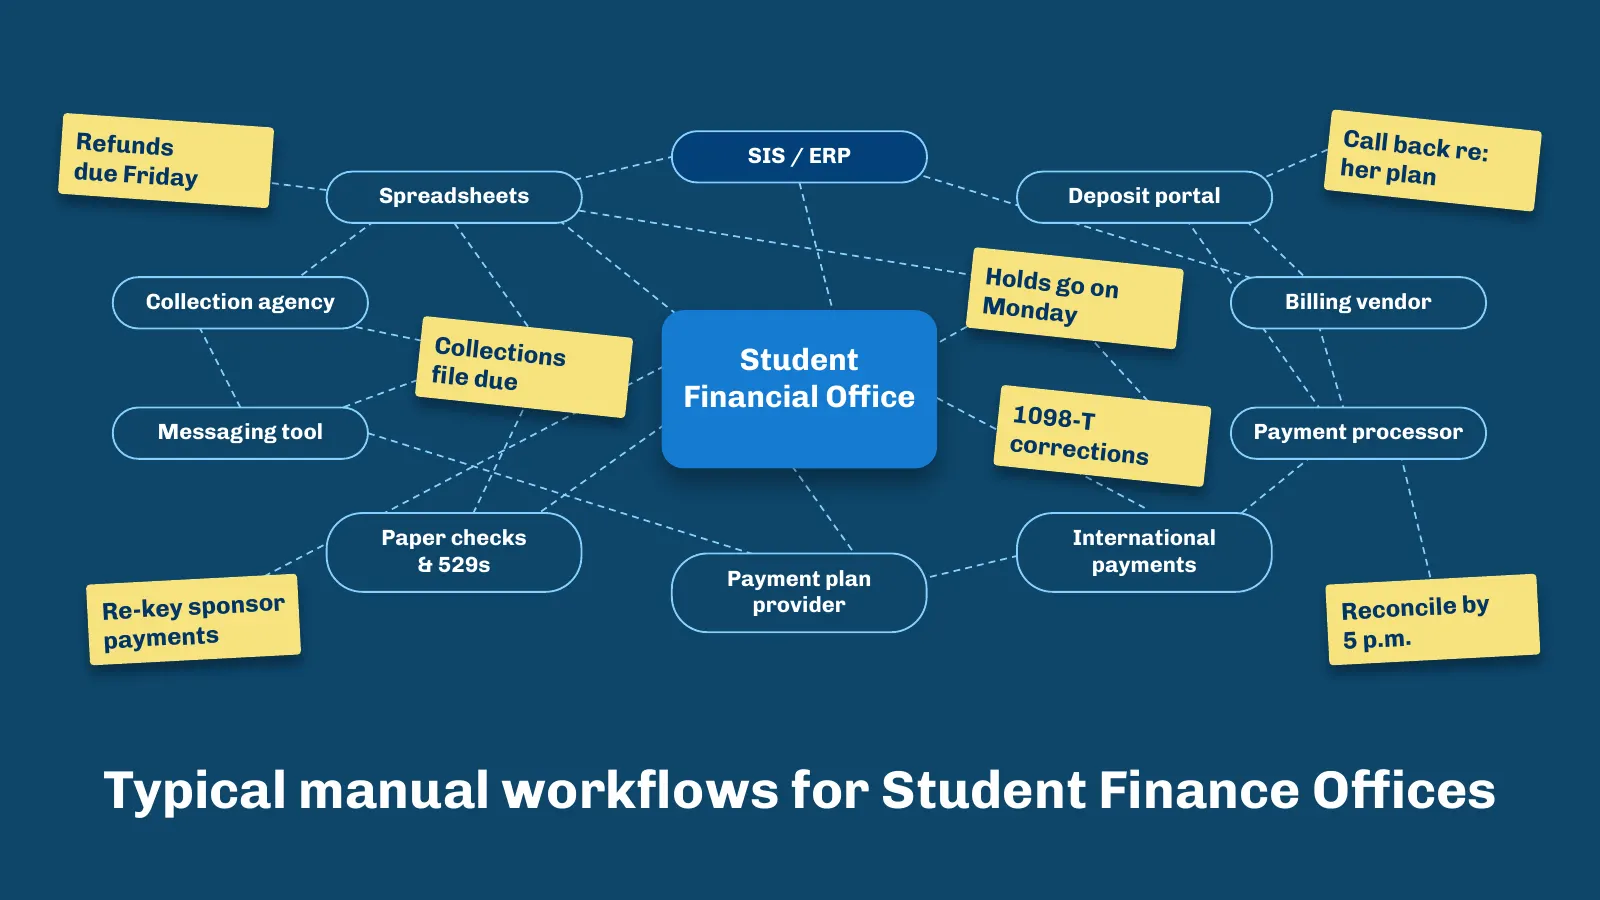
Slide 8: Typical manual workflows for Student Finance Offices
Refunds Call back r SIS / ERP e: due Friday her plan Spreadsheets Deposit portal Holds go o Collection agency n Billing vendor Monday Collection file due s Student Financial Office 1098-T Messaging tool Payment processor correction s Paper checks International & 529s payments Payment plan Re-key spon
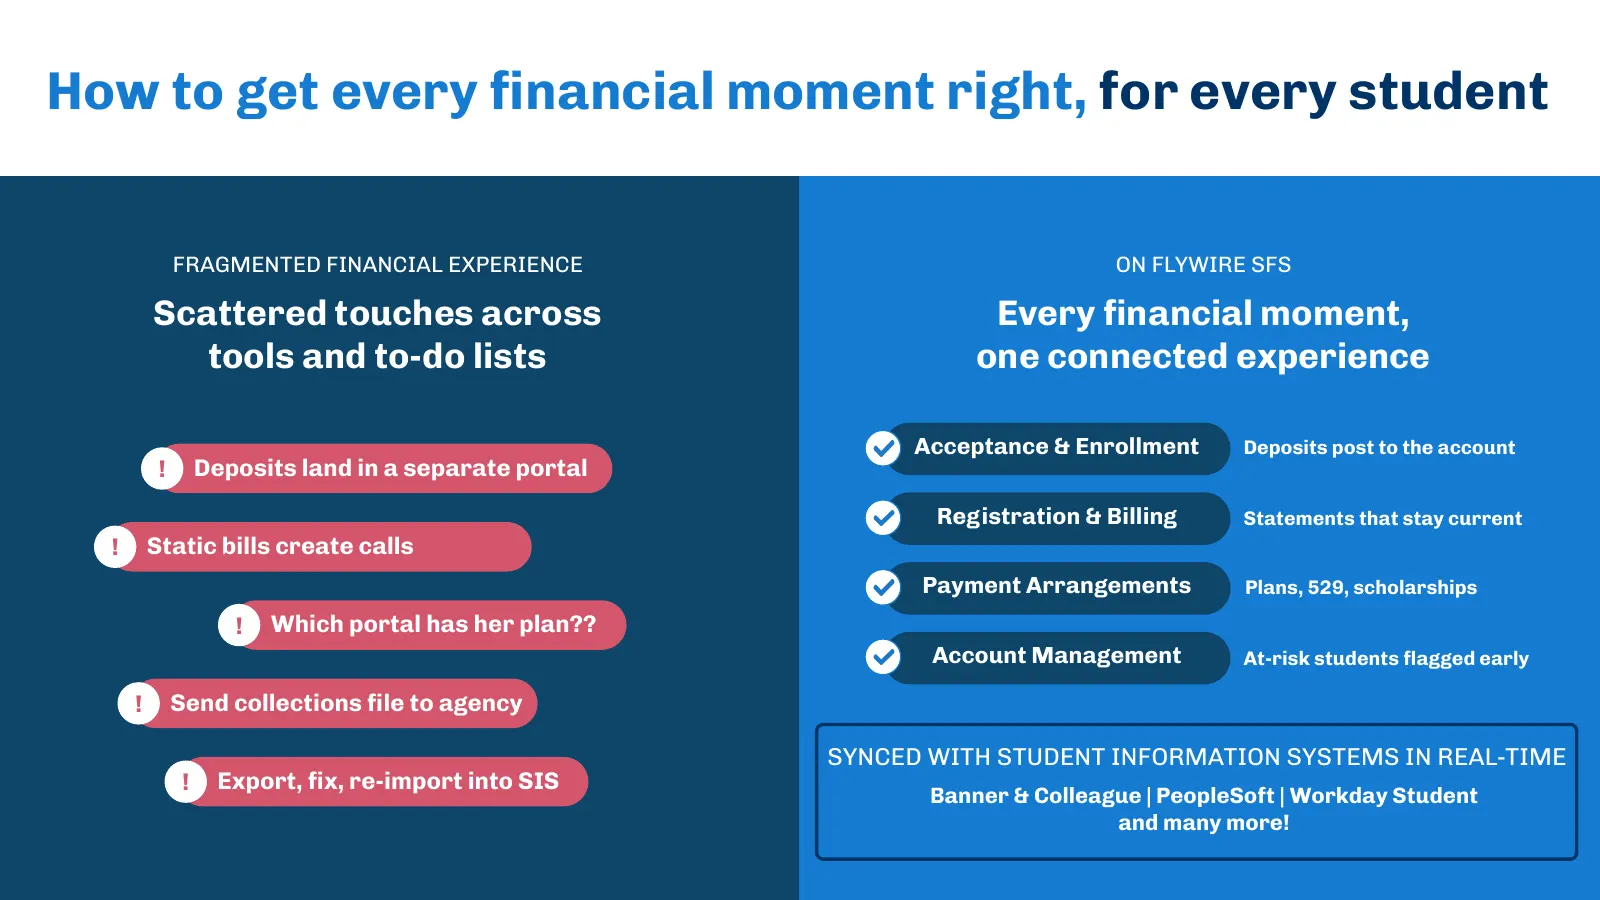
Slide 9: How to get every financial moment right, for every student
How to get every financial moment right, for every student FRAGMENTED FINANCIAL EXPERIENCE ON FLYWIRE SFS Scattered touches across Every financial moment, tools and to-do lists one connected experience Acceptance & Enrollment Deposits post to the account ! Deposits land in a separate portal Registrati
Slide 10: Payment plans activated through Flywire in the US
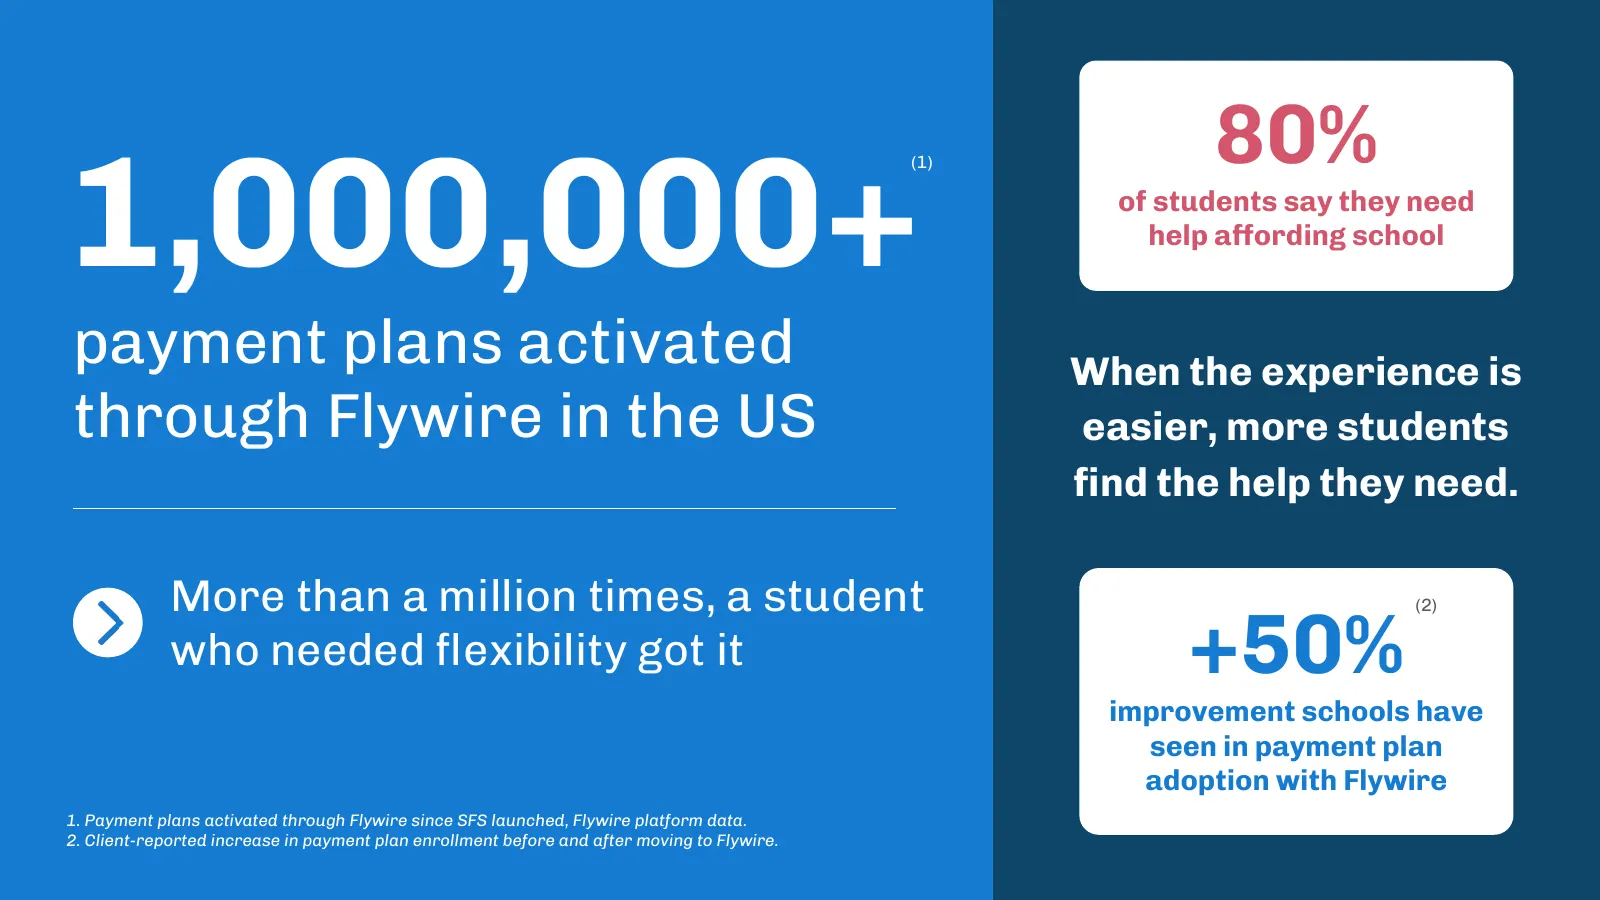
80% 1,000,000+ (1) of students say they need help affording school payment plans activated When the experience is through Flywire in the US easier, more students find the help they need. More than a million times, a student +50% (2) who needed flexibility got it improvement schools have seen in paymen
Slide 11: Your unified suite for every student
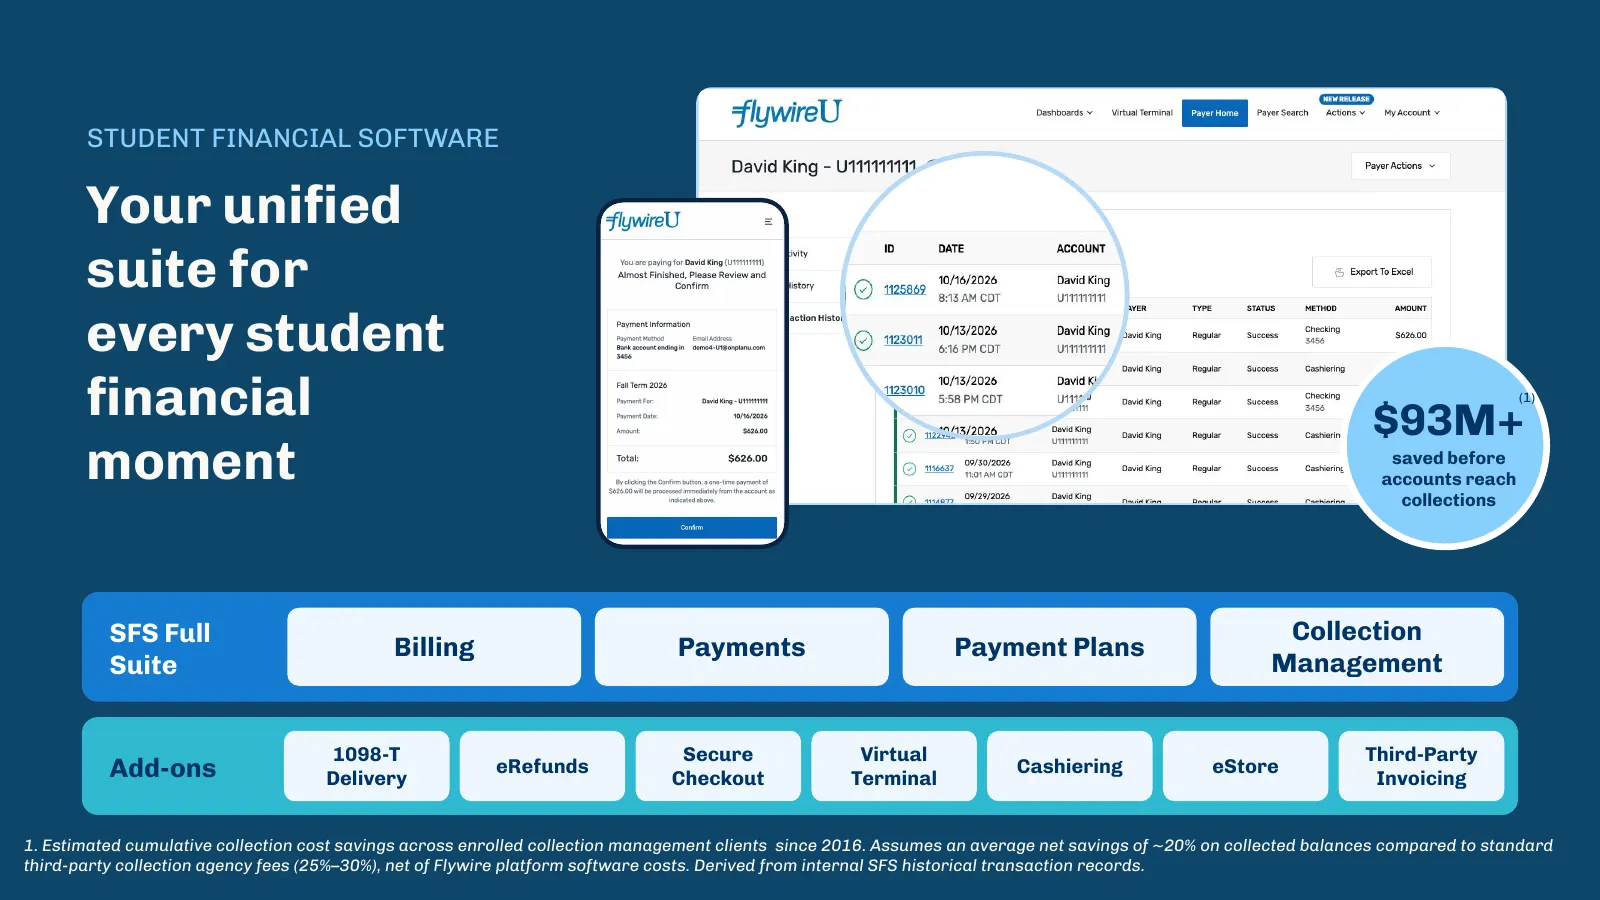
STUDENT FINANCIAL SOFTWARE Your unified suite for every student Payer view financial $93M+ (1) moment saved before accounts reach collections SFS Full Collection Billing Payments Payment Plans Suite Management 1098-T Secure Virtual Third-Party Add-ons Delivery eRefunds Checkout Terminal Cashiering eSt
Slide 12: Collect directly to keep more students and more revenue
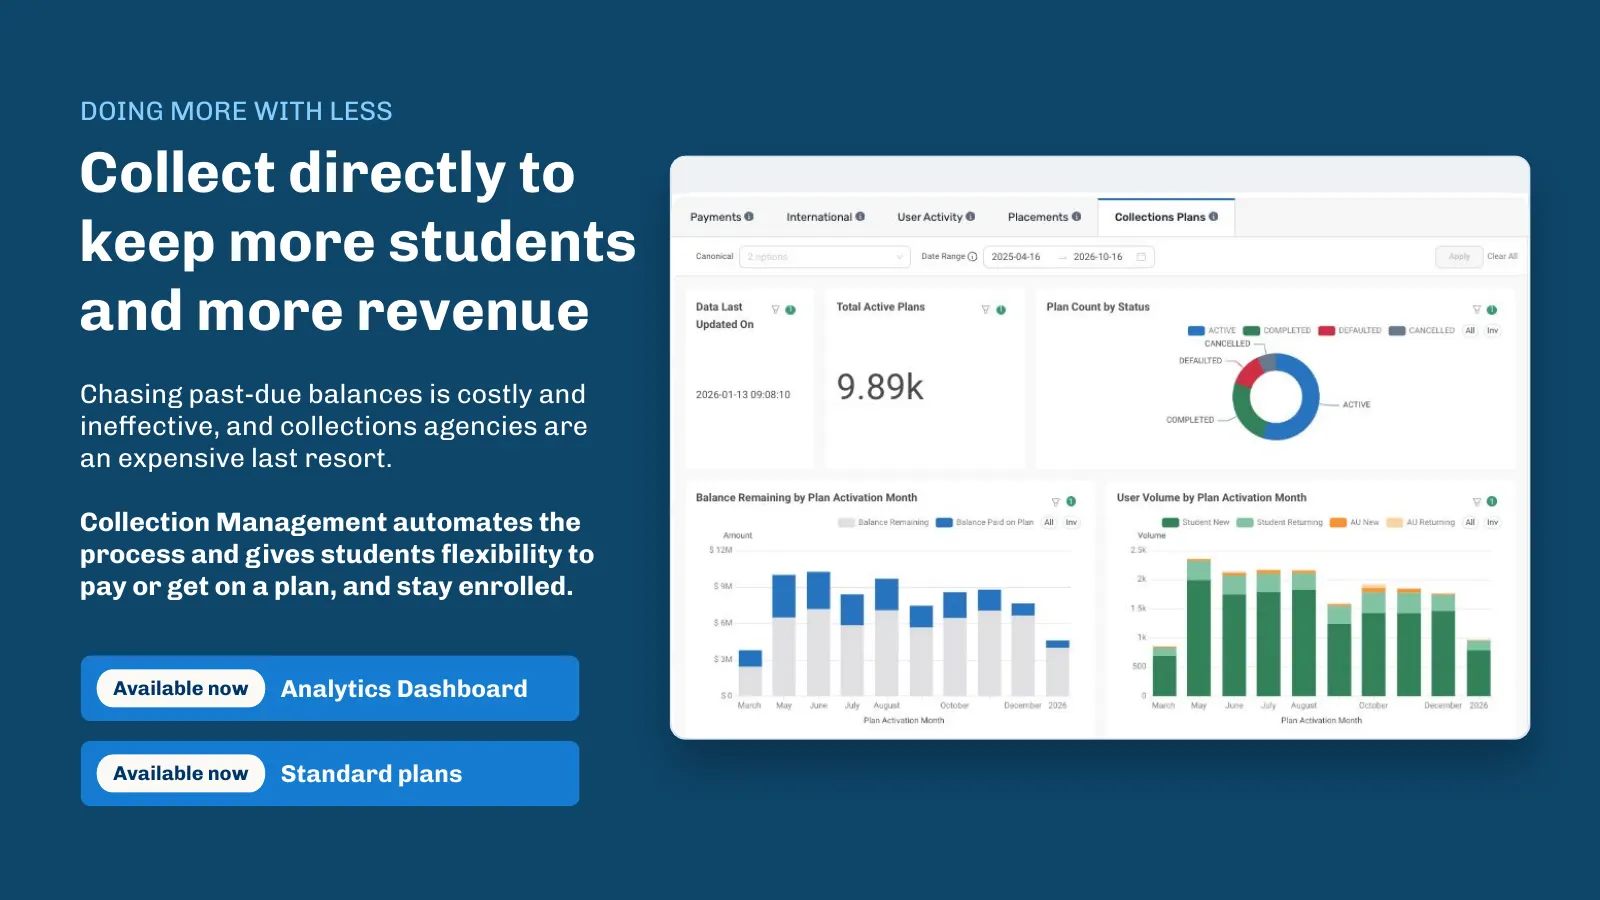
DOING MORE WITH LESS Collect directly to keep more students and more revenue Chasing past-due balances is costly and ineffective, and collections agencies are an expensive last resort. Collection Management automates the process and gives students flexibility to pay or get on a plan, and stay enrolle
Slide 13: Digitizing every way students pay
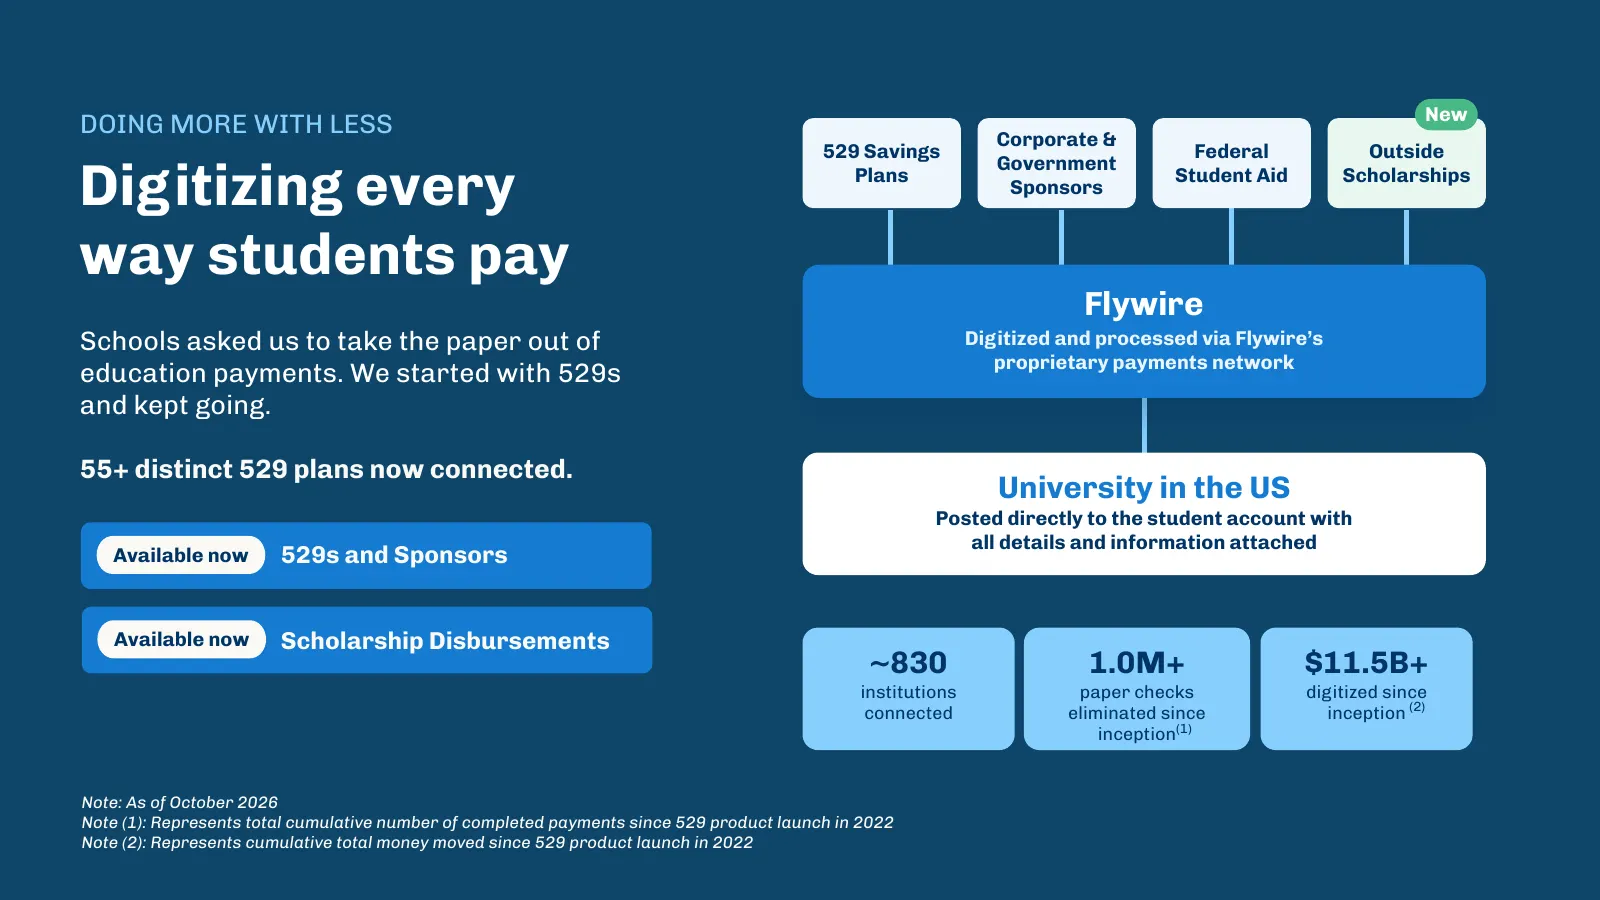
New DOING MORE WITH LESS Corporate & 529 Savings Federal Outside Digitizing every Government Plans Student Aid Scholarships Sponsors way students pay Flywire Schools asked us to take the paper out of Digitized and processed via Flywire’s proprietary payments network education payments. We started wi
Slide 14: Q3 2026 Performance
Q3 2026 Performance AT cr mF Fy TZ V&A Cc LT j WE gy a 1) => V Gg ww. f[ yy 7 wy | 2 a ry XX —— Dp Ty | a on bal ra ~ a = iv es —_
Slide 15: GAAP Financial Highlights
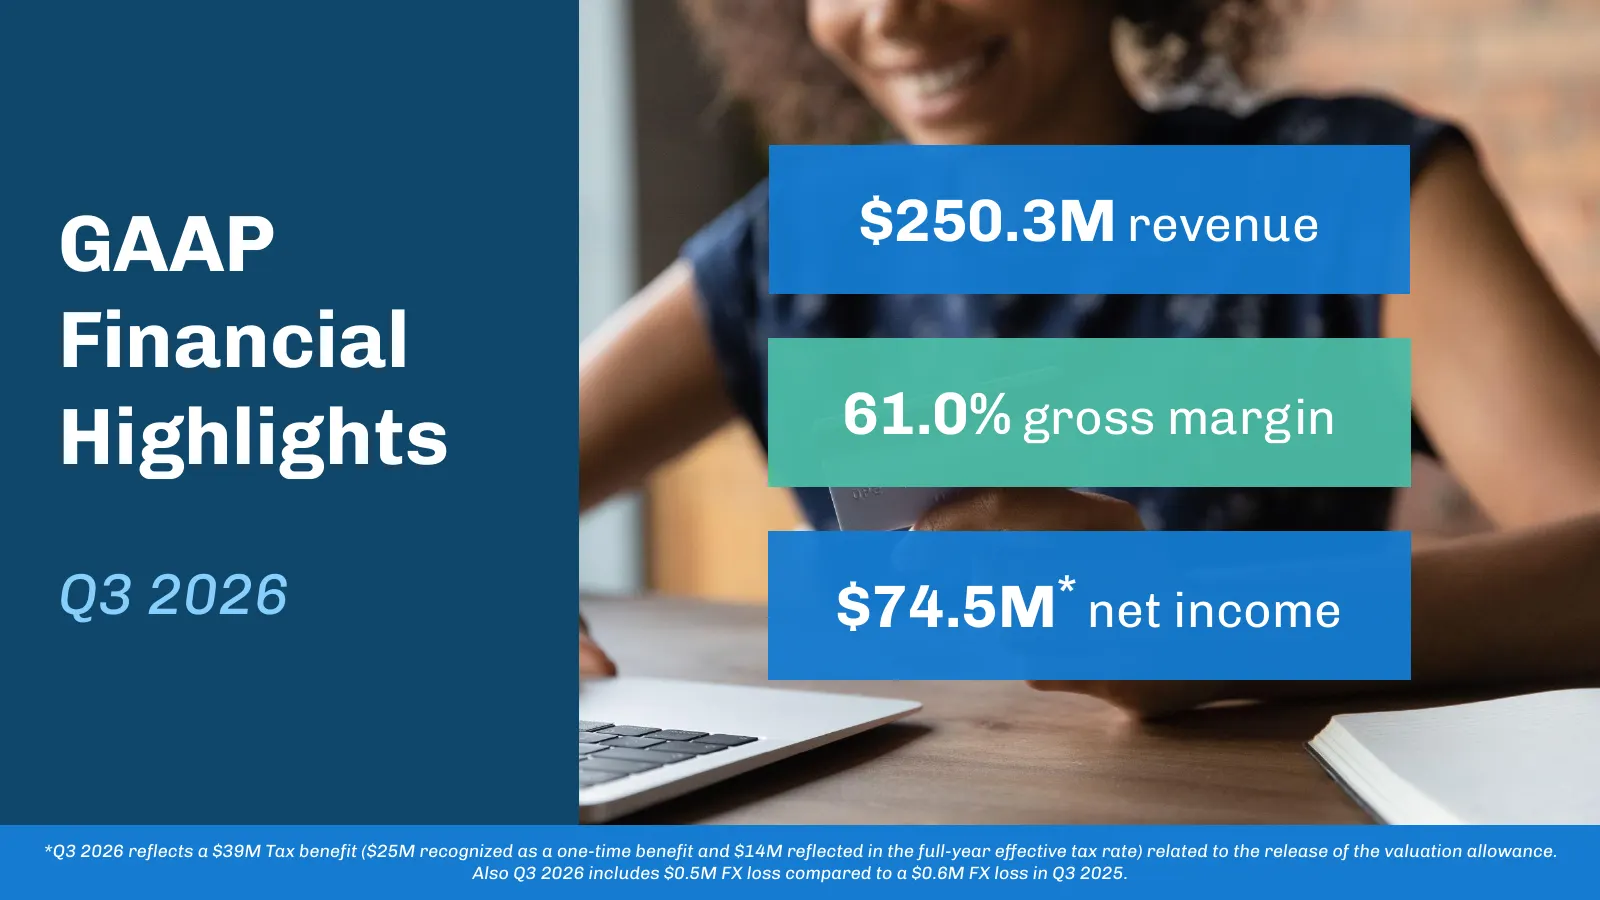
GAAP $250.3M revenue Financial 61.0% gross margin Highlights Q3 2026 $74.5M* net income *Q3 2026 reflects a $39M Tax benefit ($25M recognized as a one-time benefit and $14M reflected in the full-year effective tax rate) related to the release of the valuation allowance. Also Q3 2026 includes $0.5M FX lo
Slide 16: Key Operating Metrics
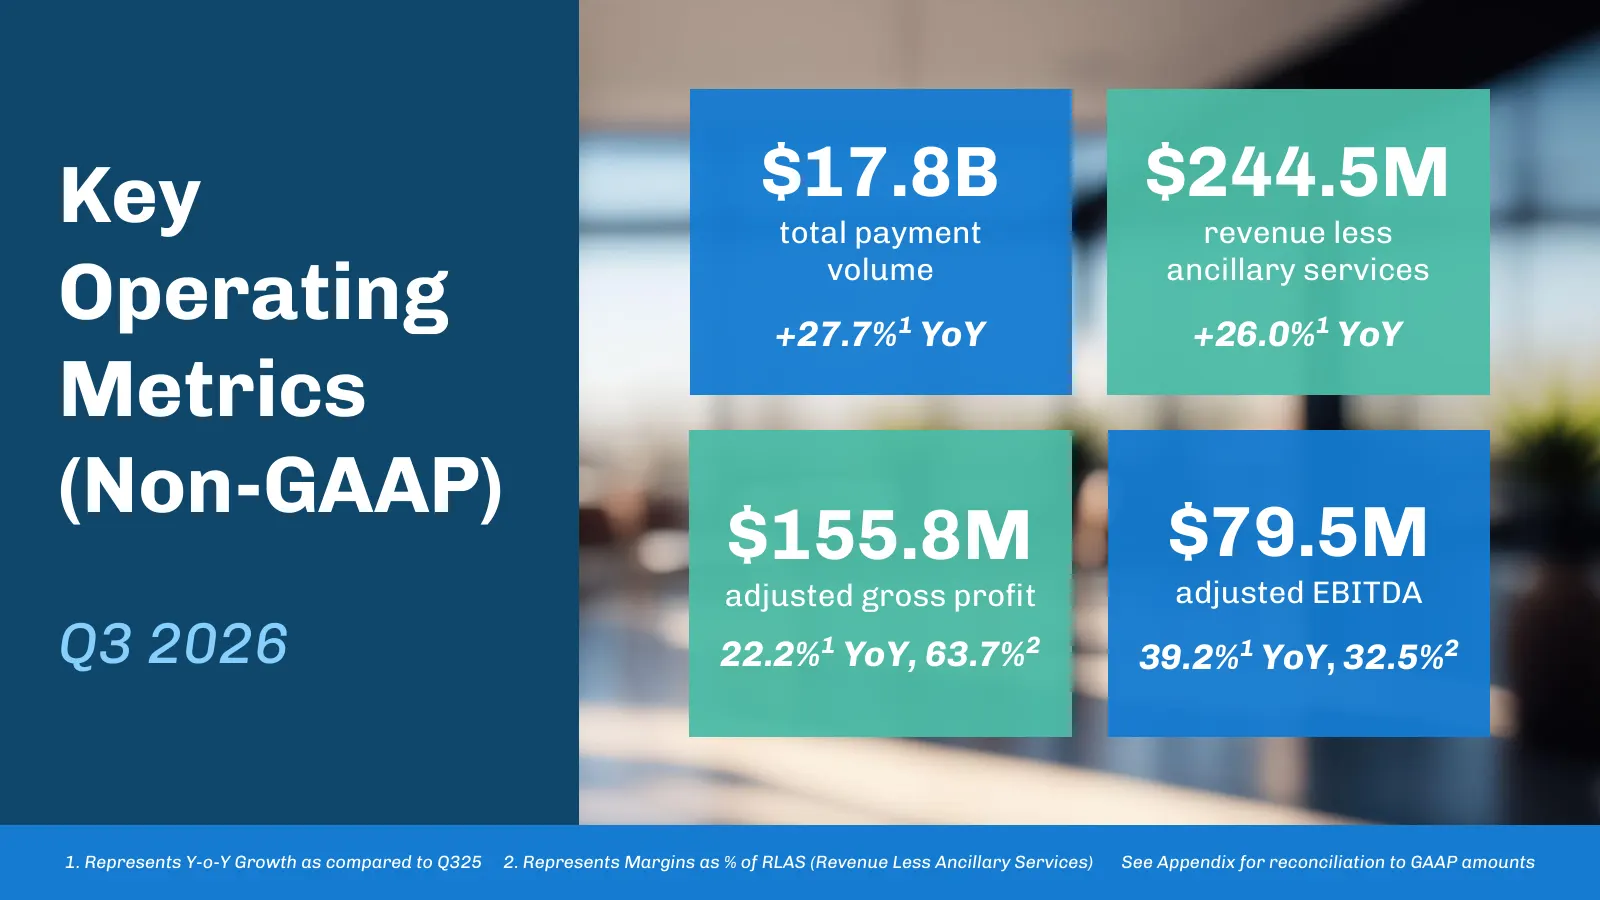
Key $17.8B $244.5M total payment revenue less Operating volume +27.7%1 YoY ancillary services +26.0%1 YoY Metrics (Non-GAAP) $155.8M $79.5M adjusted gross profit adjusted EBITDA Q3 2026 22.2%1 YoY, 63.7%2 39.2%1 YoY, 32.5%2 1. Represents Y-o-Y Growth as compared to Q325 2. Represents Margins as % of
Slide 17: Q3 Actual Performance vs. Guidance: Strong Beat Across the Board
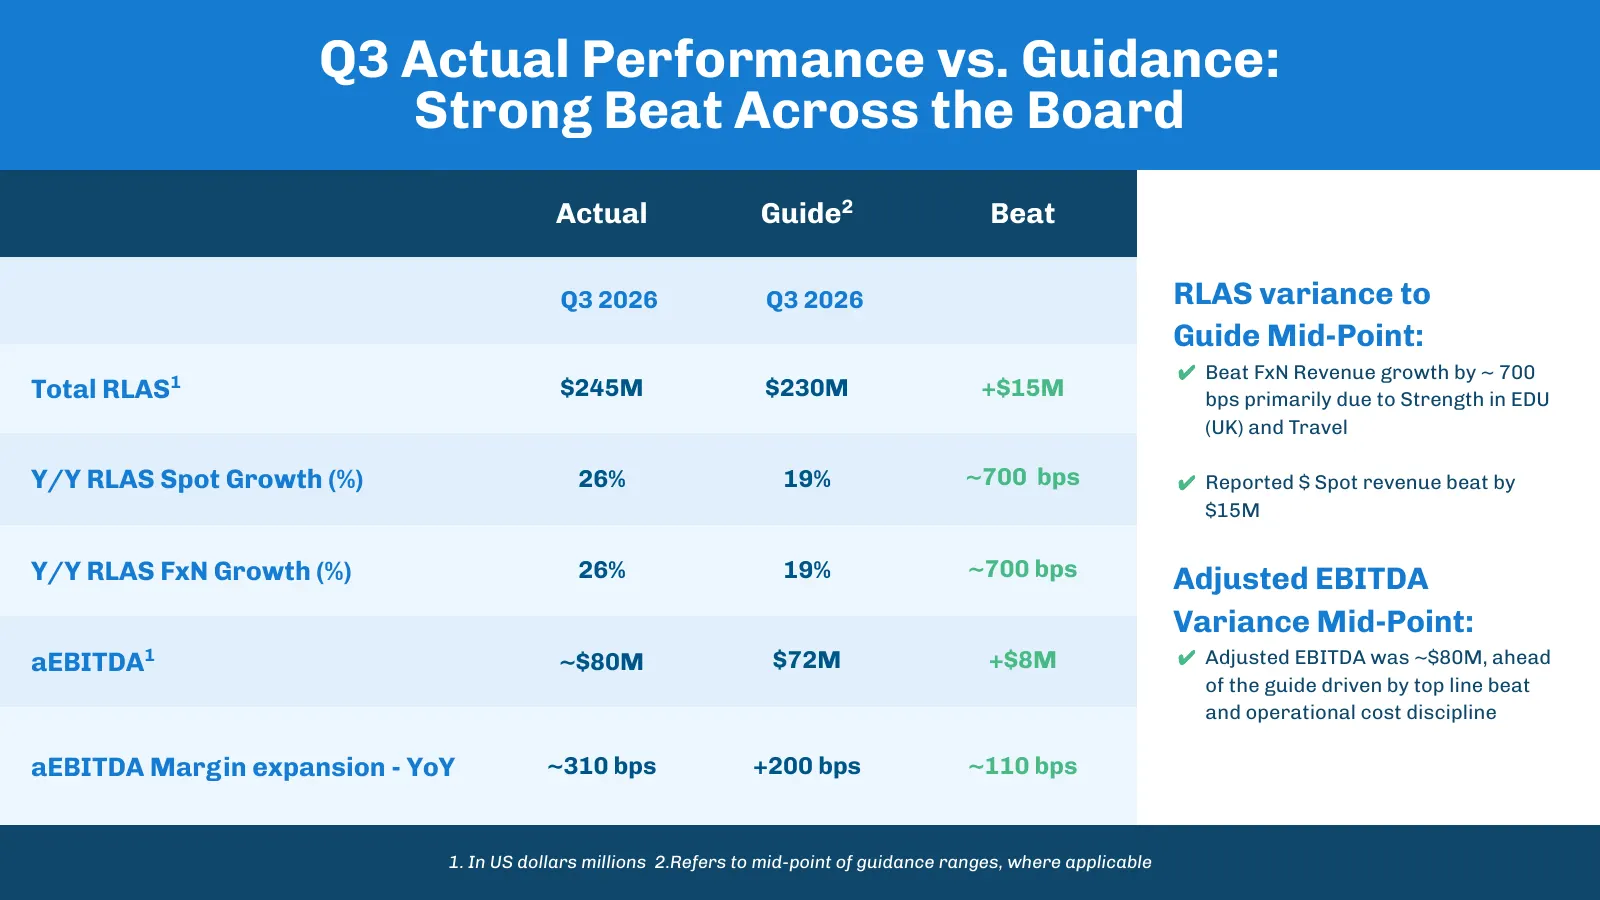
Q3 Actual Performance vs. Guidance: Strong Beat Across the Board Actual Guide2 Beat Q3 2026 Q3 2026 RLAS variance to Guide Mid-Point: ✔ Beat FxN Revenue growth by ~ 700 Total RLAS1 $245M $230M +$15M bps primarily due to Strength in EDU (UK) and Travel Y/Y RLAS Spot Growth (%) 26% 19% ~700 bps ✔ Repo
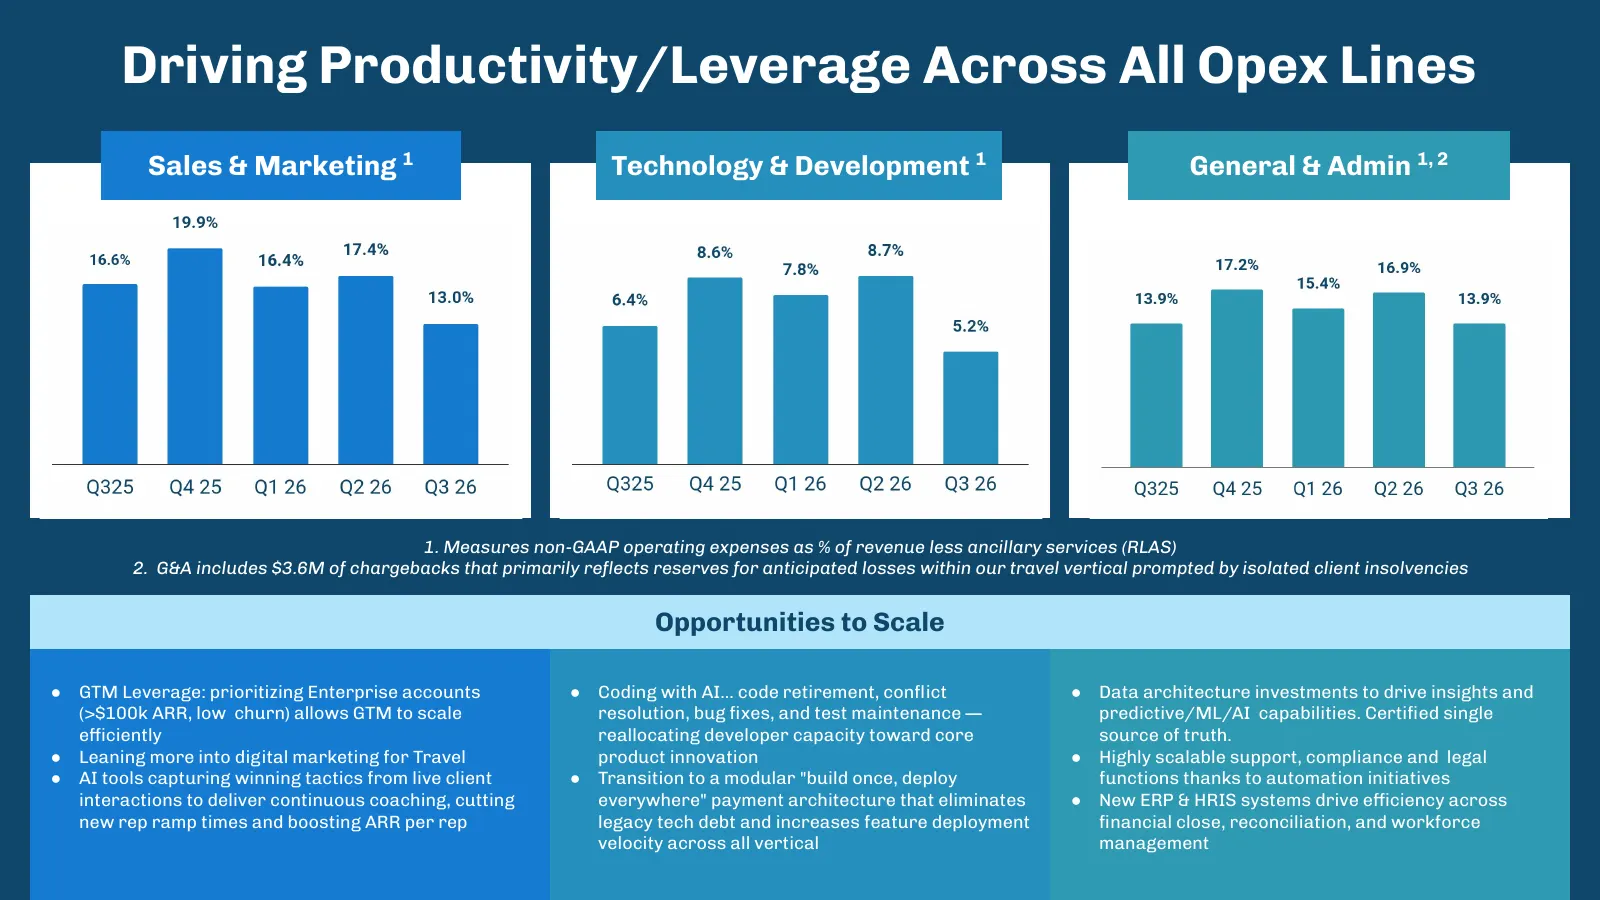
Slide 18: Driving Productivity/Leverage Across All Opex Lines
Driving Productivity/Leverage Across All Opex Lines Sales & Marketing 1 Technology & Development 1 General & Admin 1, 2 1. Measures non-GAAP operating expenses as % of revenue less ancillary services (RLAS) 2. G&A includes $3.6M of chargebacks that primarily reflects reserves for anticipated losses w
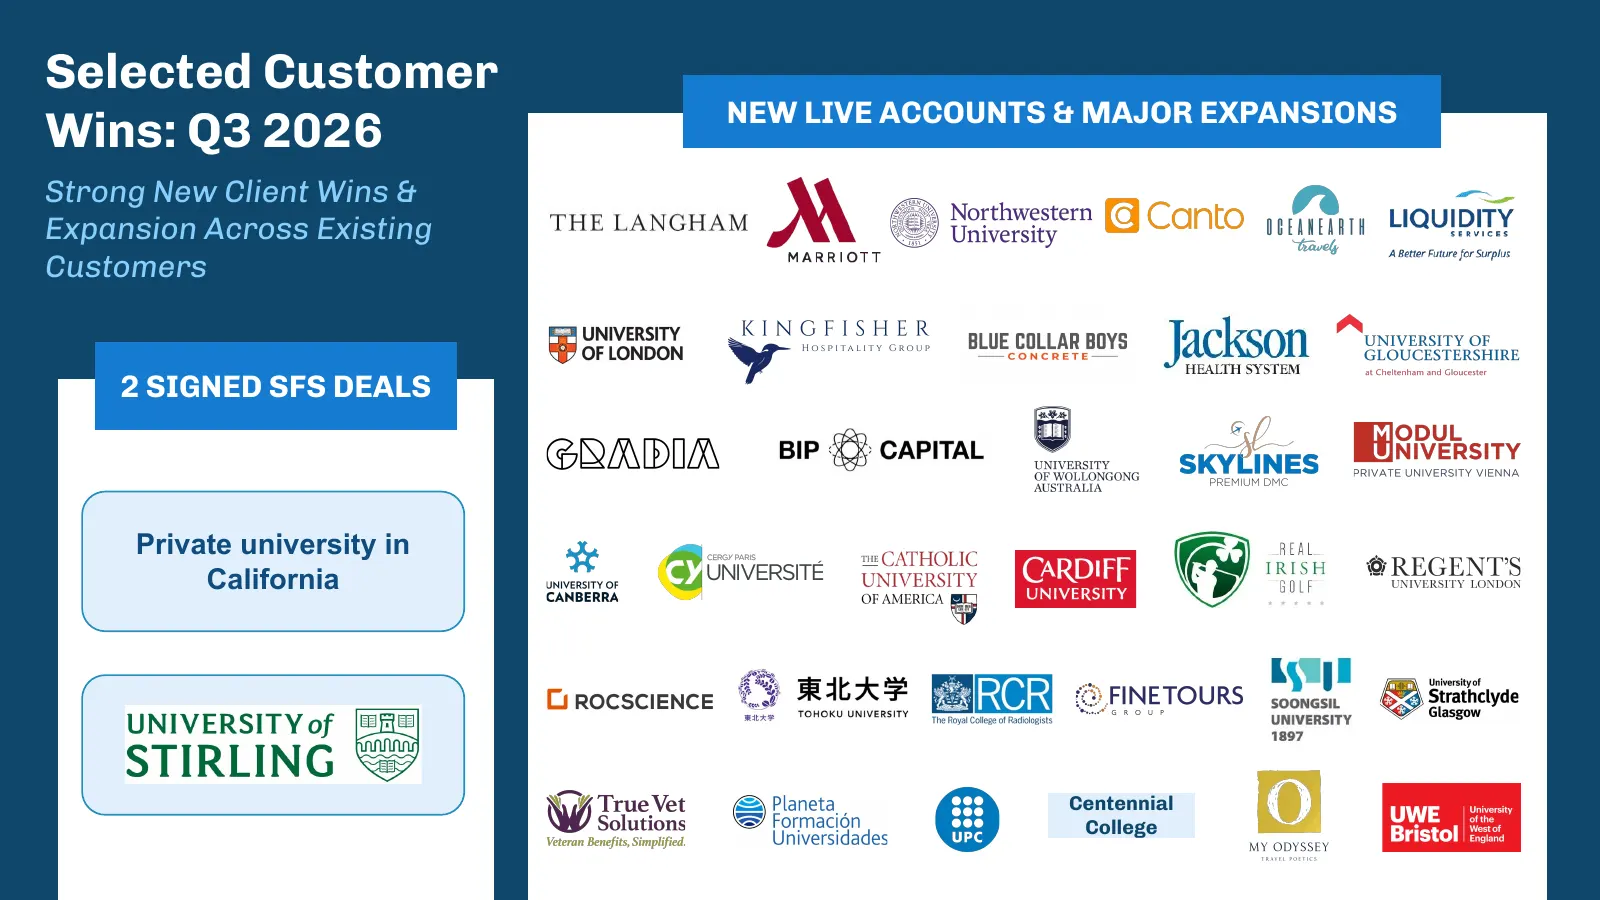
Slide 19: Selected Customer Wins: Q3 2026
Selected Customer NEW LIVE ACCOUNTS & MAJOR EXPANSIONS Wins: Q3 2026 Strong New Client Wins & Expansion Across Existing Customers 2 SIGNED SFS DEALS Private university in California Centennial College

Slide 20: 2026 & Q4 Financial Outlook
2026 & Q4 Financial Outlook
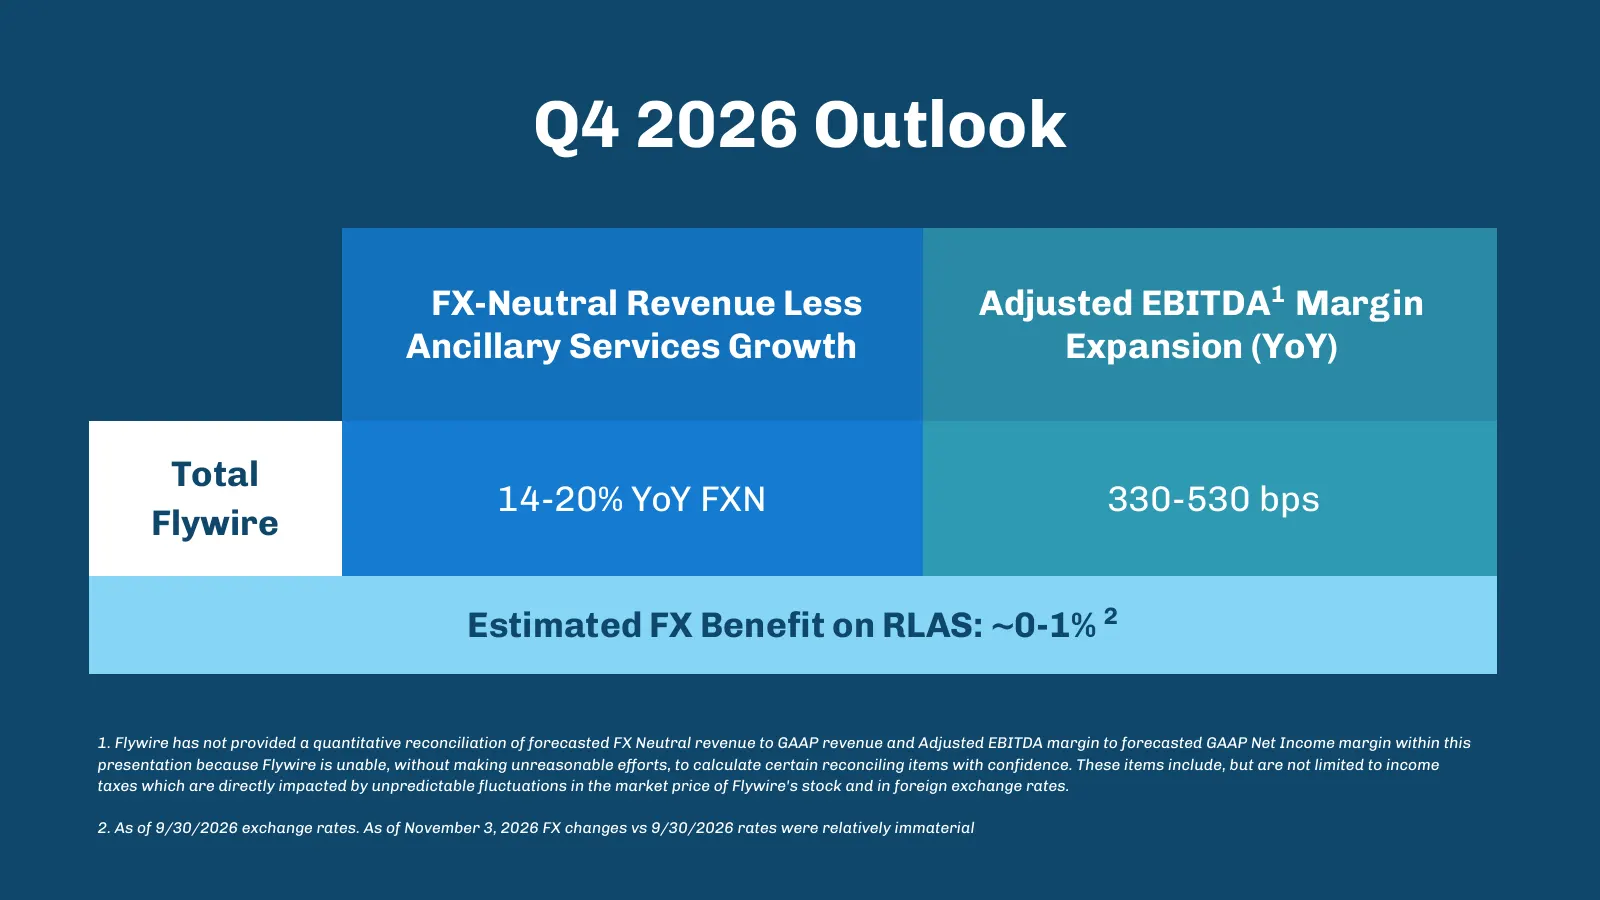
Slide 21: Q4 2026 Outlook
Q4 2026 Outlook FX-Neutral Revenue Less Adjusted EBITDA1 Margin Ancillary Services Growth Expansion (YoY) Total 14-20% YoY FXN 330-530 bps Flywire Estimated FX Benefit on RLAS: ~0-1% 2 1. Flywire has not provided a quantitative reconciliation of forecasted FX Neutral revenue to GAAP revenue and Adjus
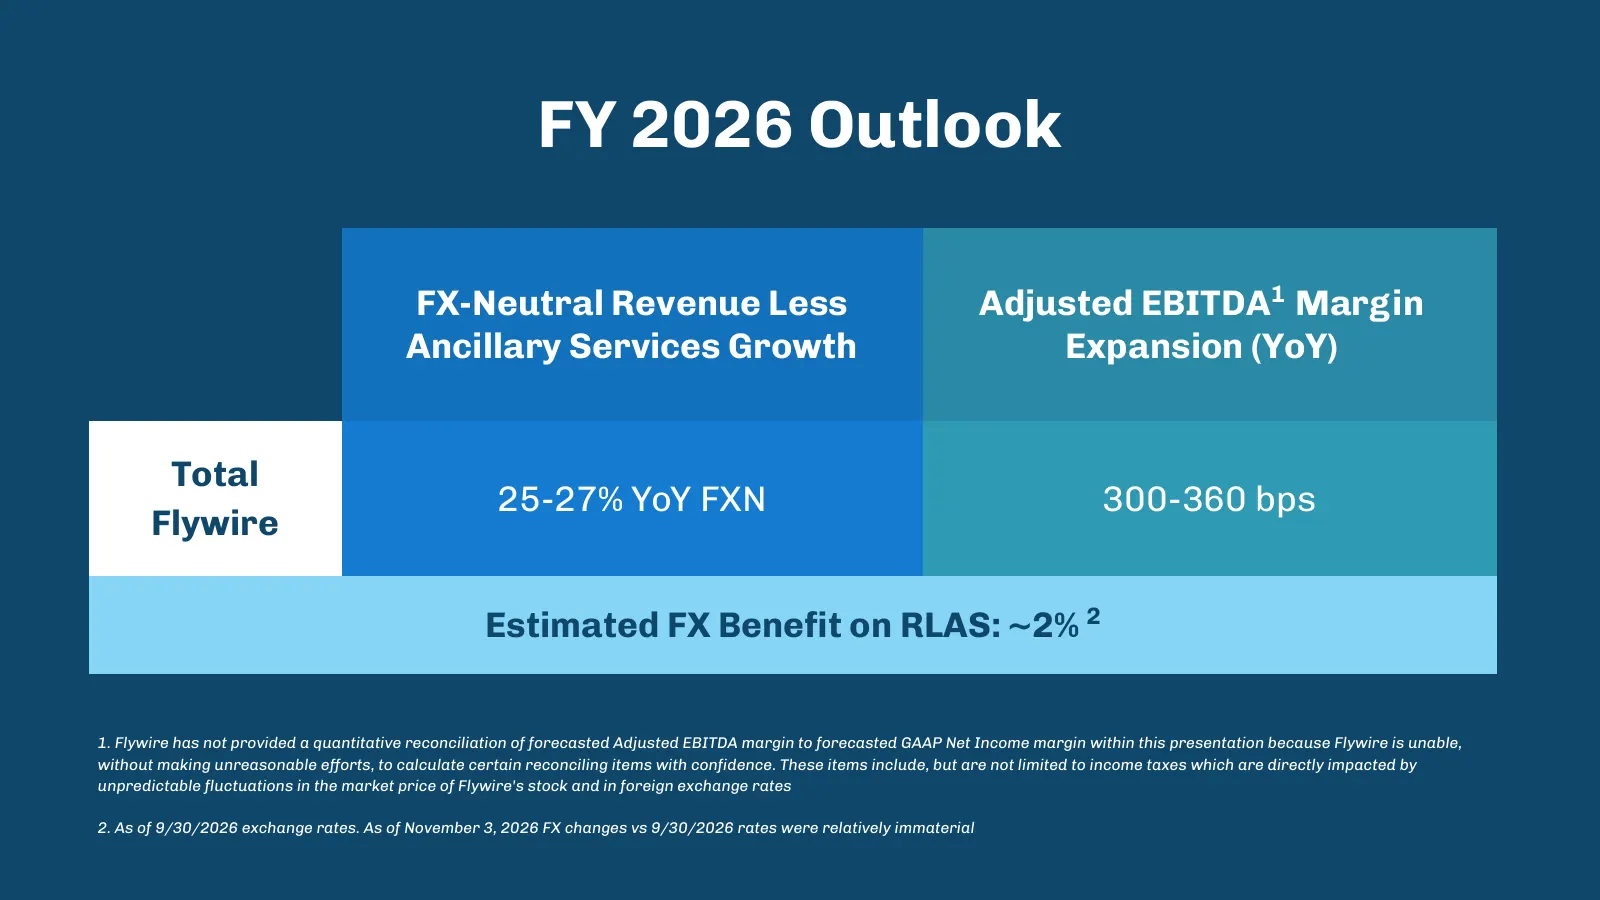
Slide 22: FY 2026 Outlook
FY 2026 Outlook FX-Neutral Revenue Less Adjusted EBITDA1 Margin Ancillary Services Growth Expansion (YoY) Total 25-27% YoY FXN 300-360 bps Flywire Estimated FX Benefit on RLAS: ~2% 2 1. Flywire has not provided a quantitative reconciliation of forecasted Adjusted EBITDA margin to forecasted GAAP Net
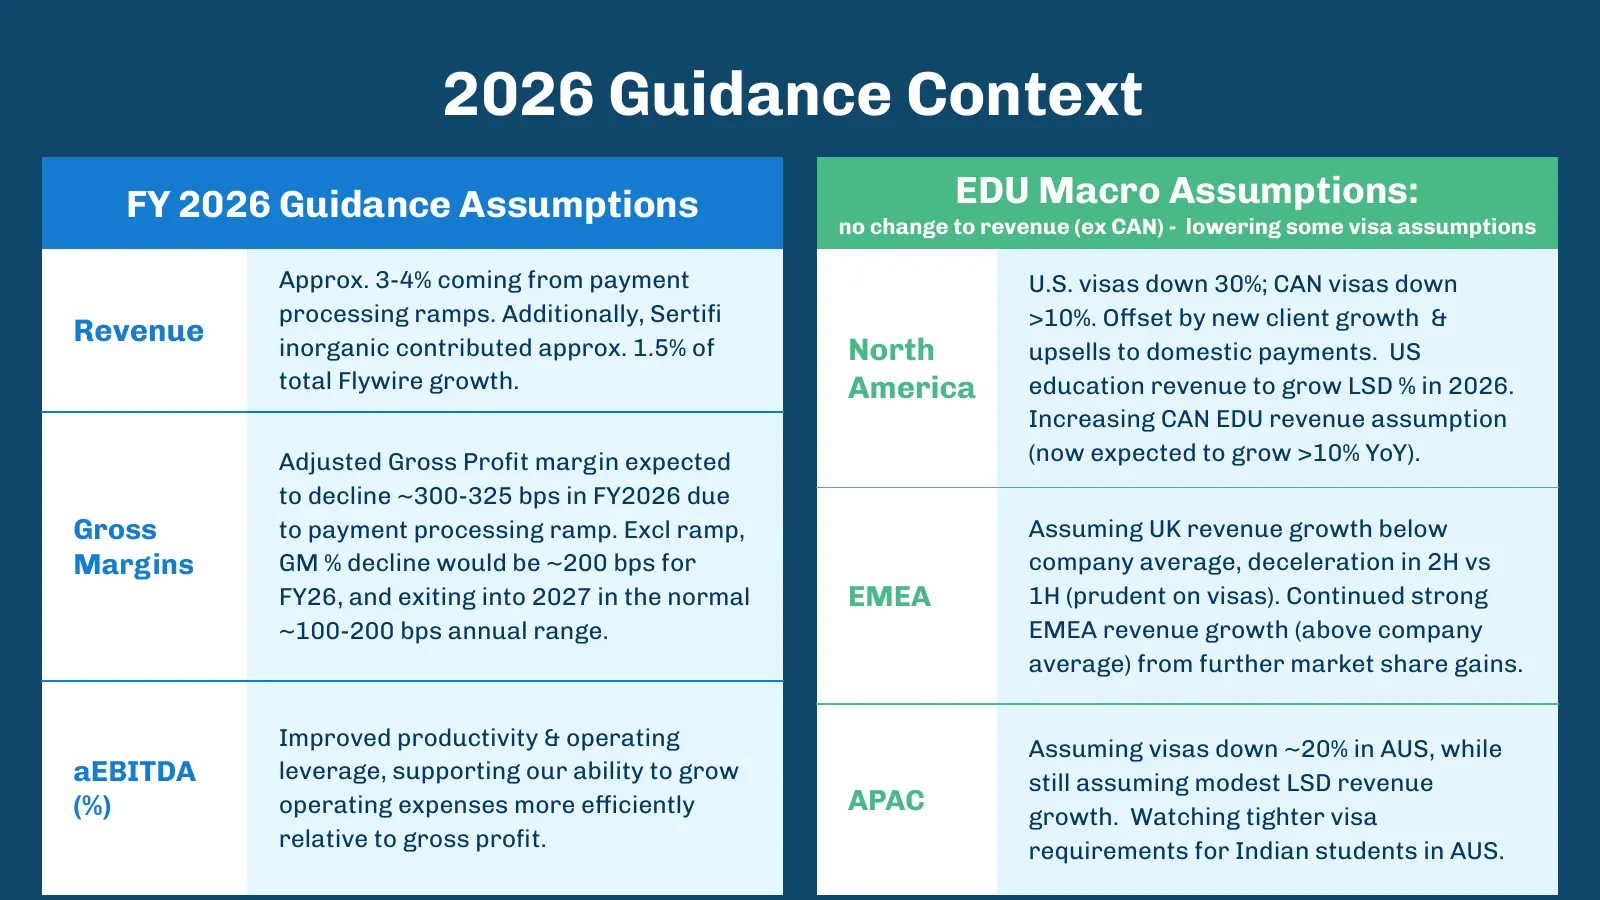
Slide 23: 2026 Guidance Context
2026 Guidance Context FY 2026 Guidance Assumptions EDU Macro Assumptions: no change to revenue (ex CAN) - lowering some visa assumptions Approx. 3-4% coming from payment U.S. visas down 30%; CAN visas down processing ramps. Additionally, Sertifi >10%. Offset by new client growth & Revenue inorganic c

Slide 24: Capital Allocation & Structure
Capital Allocation & Structure
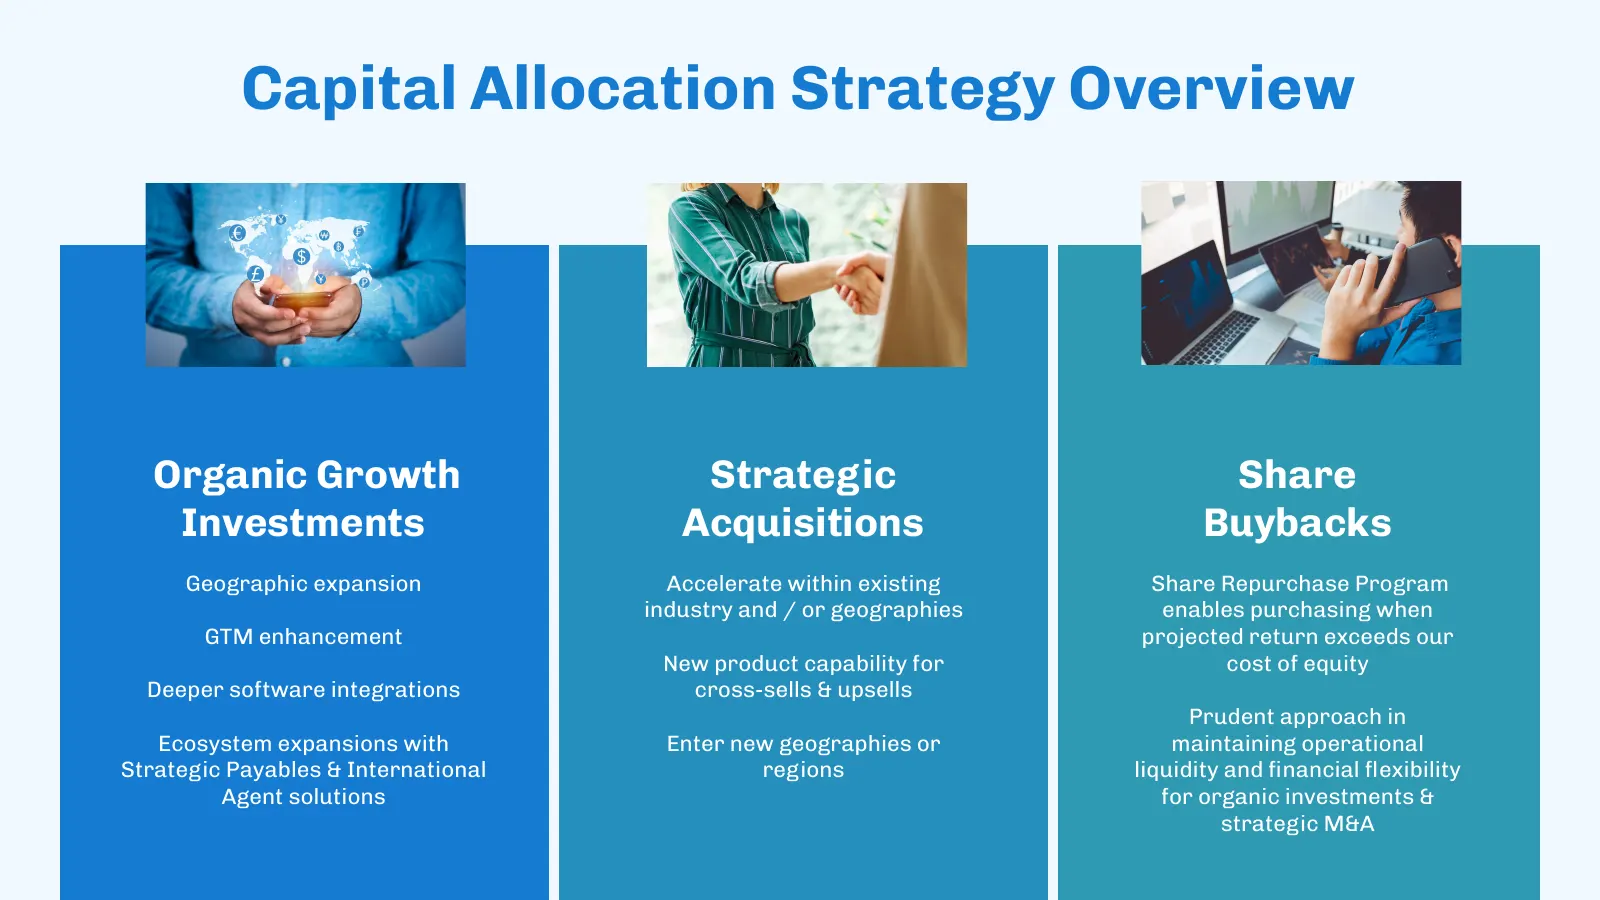
Slide 25: Capital Allocation Strategy Overview
Capital Allocation Strategy Overview Organic Growth Strategic Share Investments Acquisitions Buybacks Geographic expansion Accelerate within existing Share Repurchase Program industry and / or geographies enables purchasing when GTM enhancement projected return exceeds our New product capability for
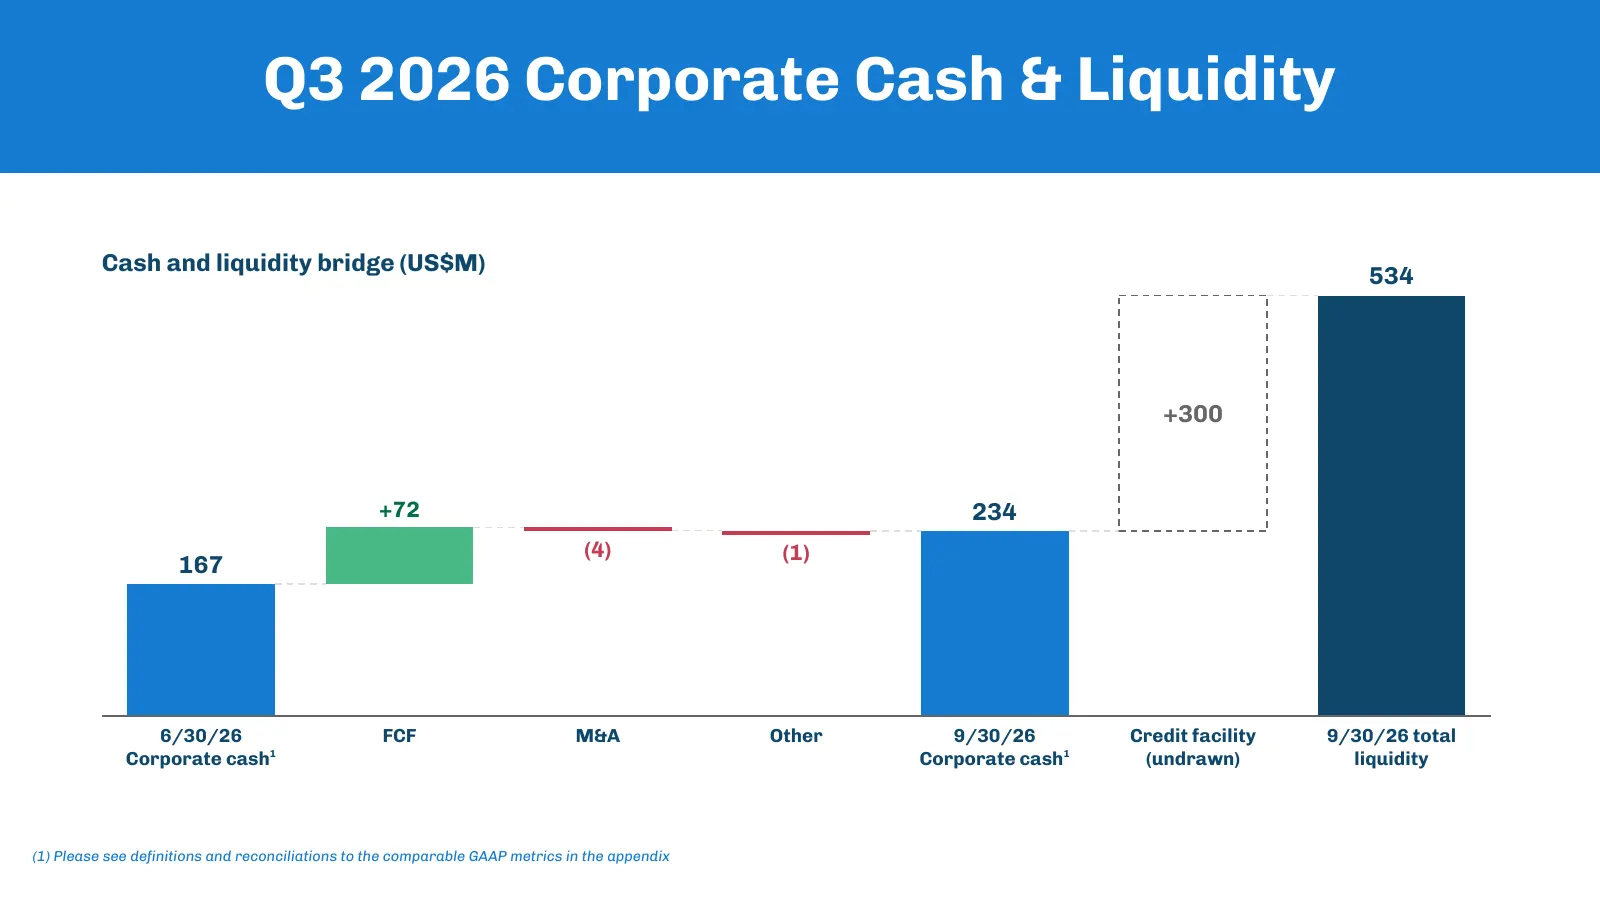
Slide 26: Q3 2026 Corporate Cash & Liquidity
Q3 2026 Corporate Cash & Liquidity Cash and liquidity bridge (US$M) 534 +300 +72 234 (4) (1) 167 6/30/26 FCF M&A Other 9/30/26 Credit facility 9/30/26 total Corporate cash¹ Corporate cash¹ (undrawn) liquidity (1) Please see definitions and reconciliations to the comparable GAAP metrics in the appendi
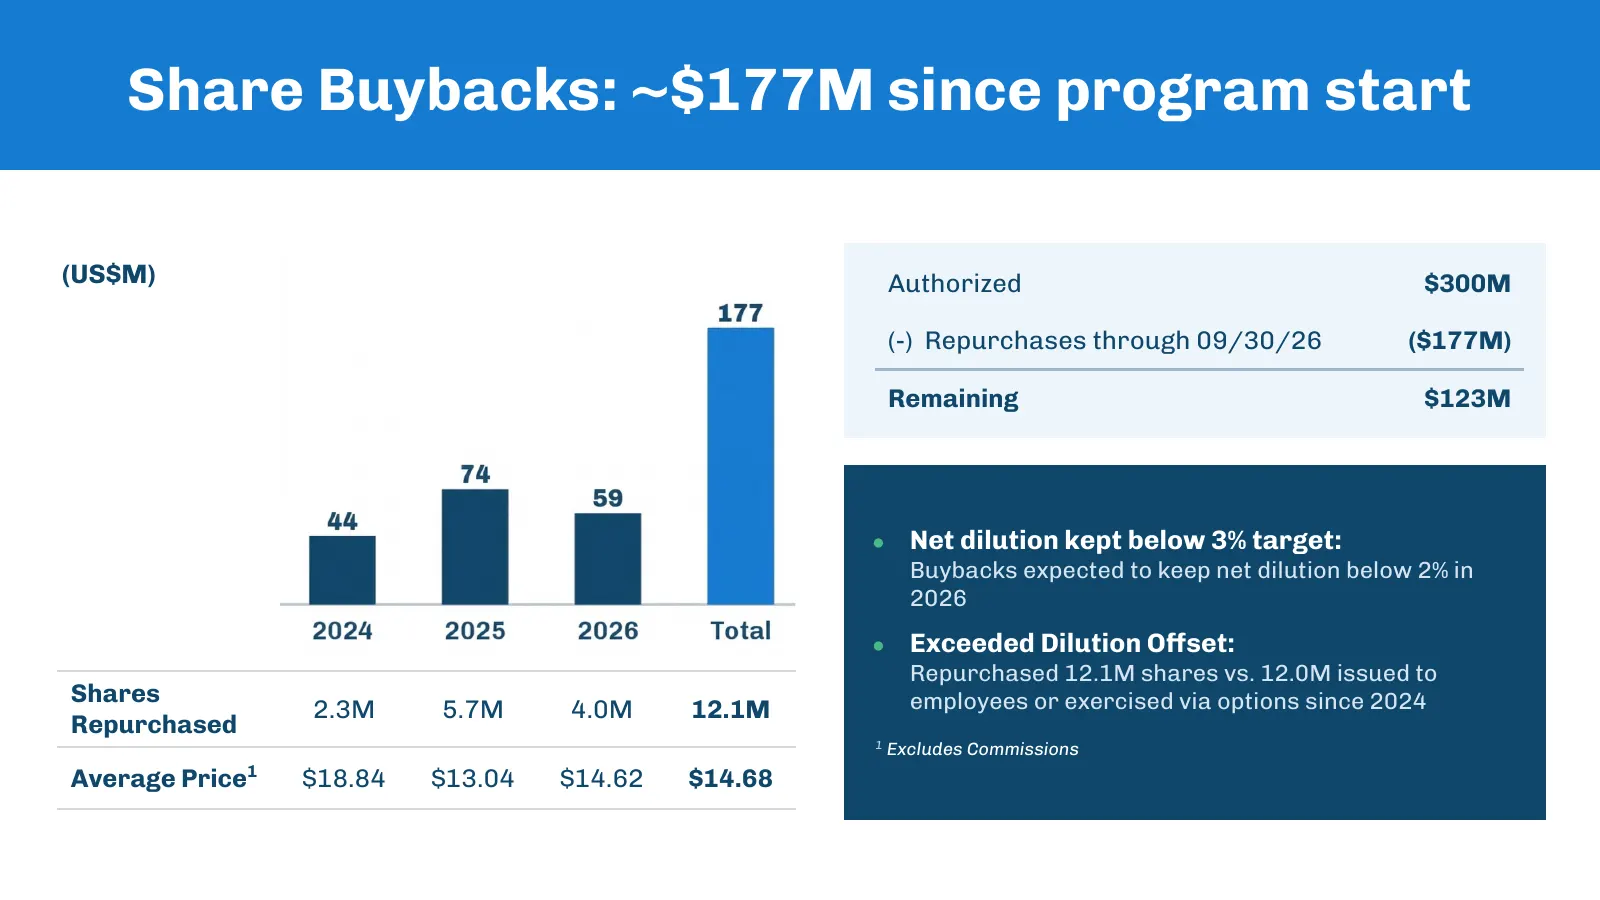
Slide 27: Share Buybacks: ~$177M since program start
Share Buybacks: ~$177M since program start (US$M) Authorized $300M (-) Repurchases through 09/30/26 ($177M) Remaining $123M ● Net dilution kept below 3% target: Buybacks expected to keep net dilution below 2% in 2026 ● Exceeded Dilution Offset: Repurchased 12.1M shares vs. 12.0M issued to Shares emp
Slide 28: Appendix
Appendix
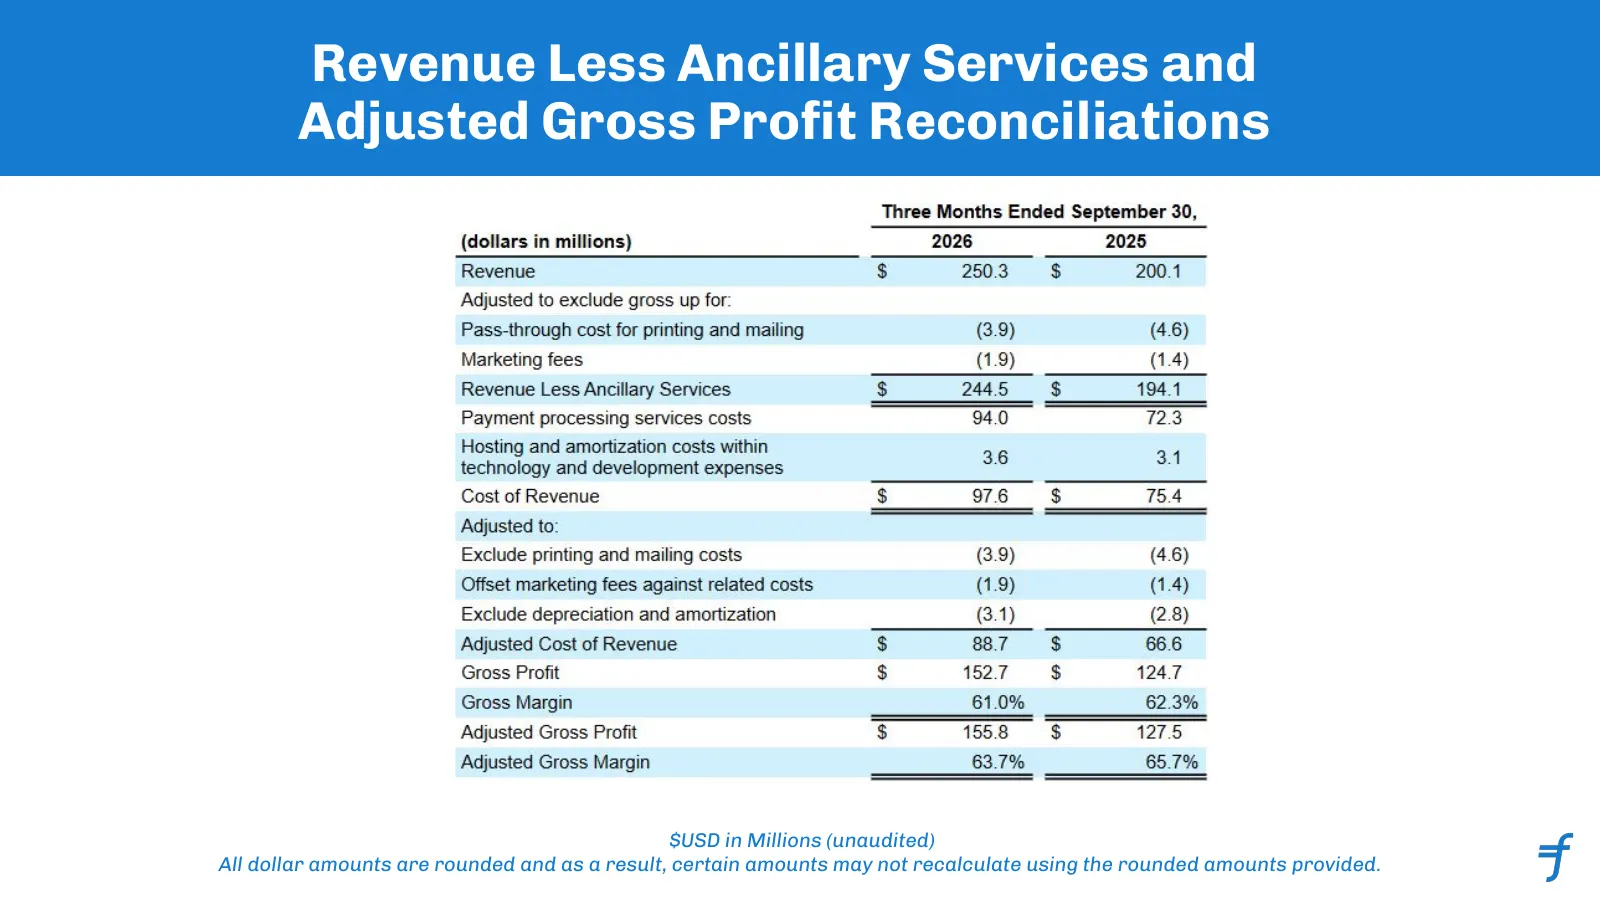
Slide 29: Revenue Less Ancillary Services and Adjusted Gross Profit Reconciliations
Revenue Less Ancillary Services and Adjusted Gross Profit Reconciliations $USD in Millions (unaudited) All dollar amounts are rounded and as a result, certain amounts may not recalculate using the rounded amounts provided.
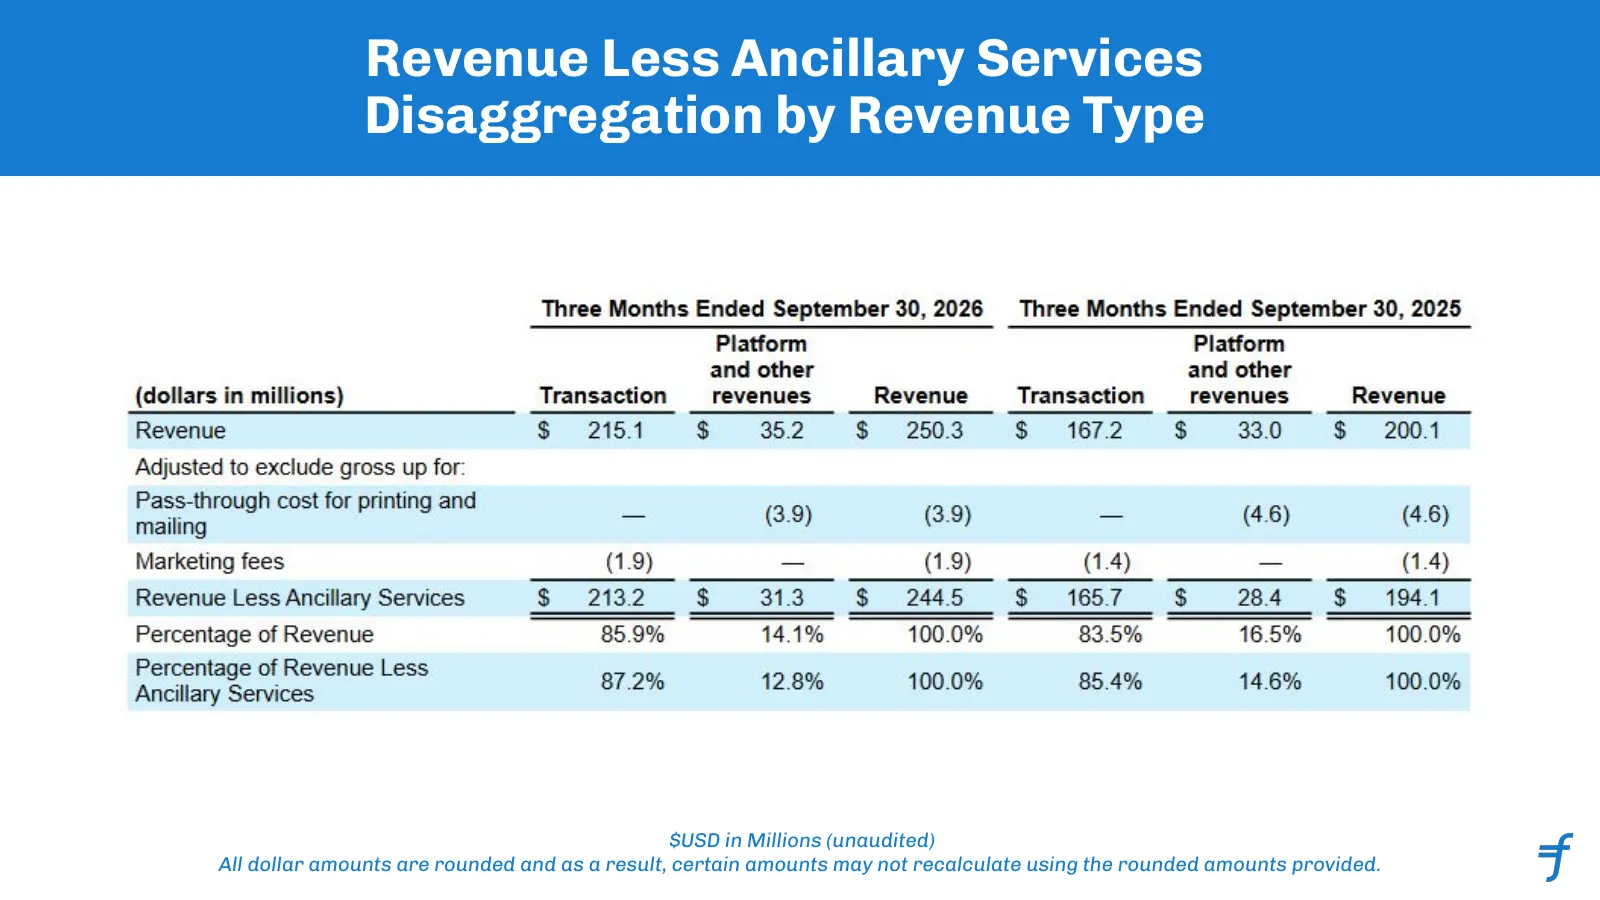
Slide 30: Revenue Less Ancillary Services Disaggregation by Revenue Type
Revenue Less Ancillary Services Disaggregation by Revenue Type $USD in Millions (unaudited) All dollar amounts are rounded and as a result, certain amounts may not recalculate using the rounded amounts provided.
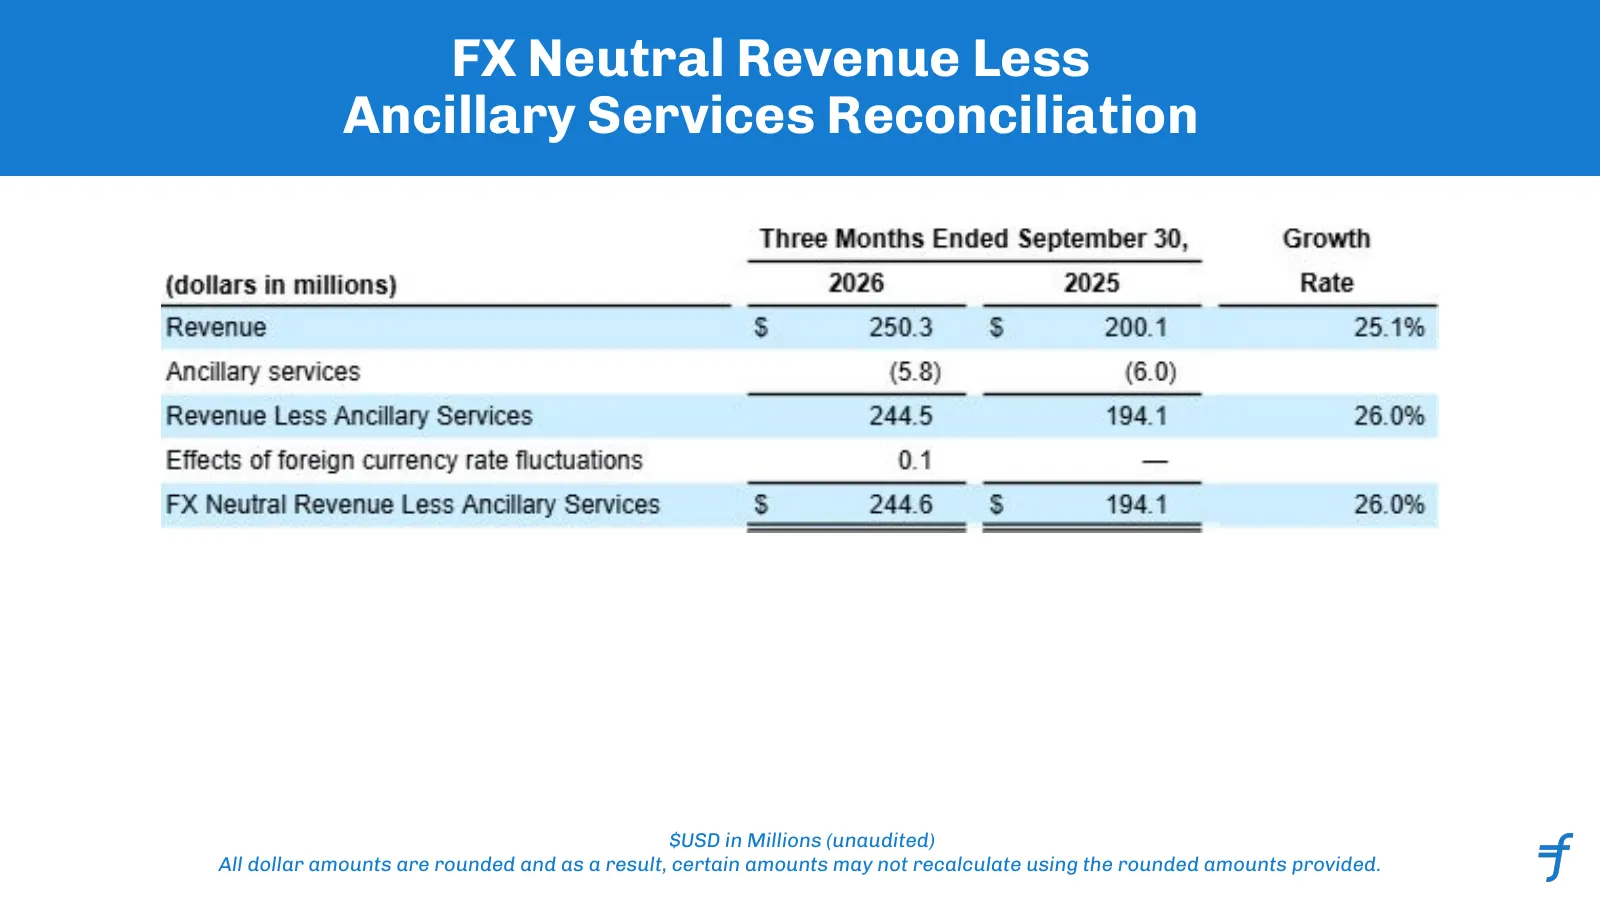
Slide 31: FX Neutral Revenue Less Ancillary Services Reconciliation
FX Neutral Revenue Less Ancillary Services Reconciliation $USD in Millions (unaudited) All dollar amounts are rounded and as a result, certain amounts may not recalculate using the rounded amounts provided.
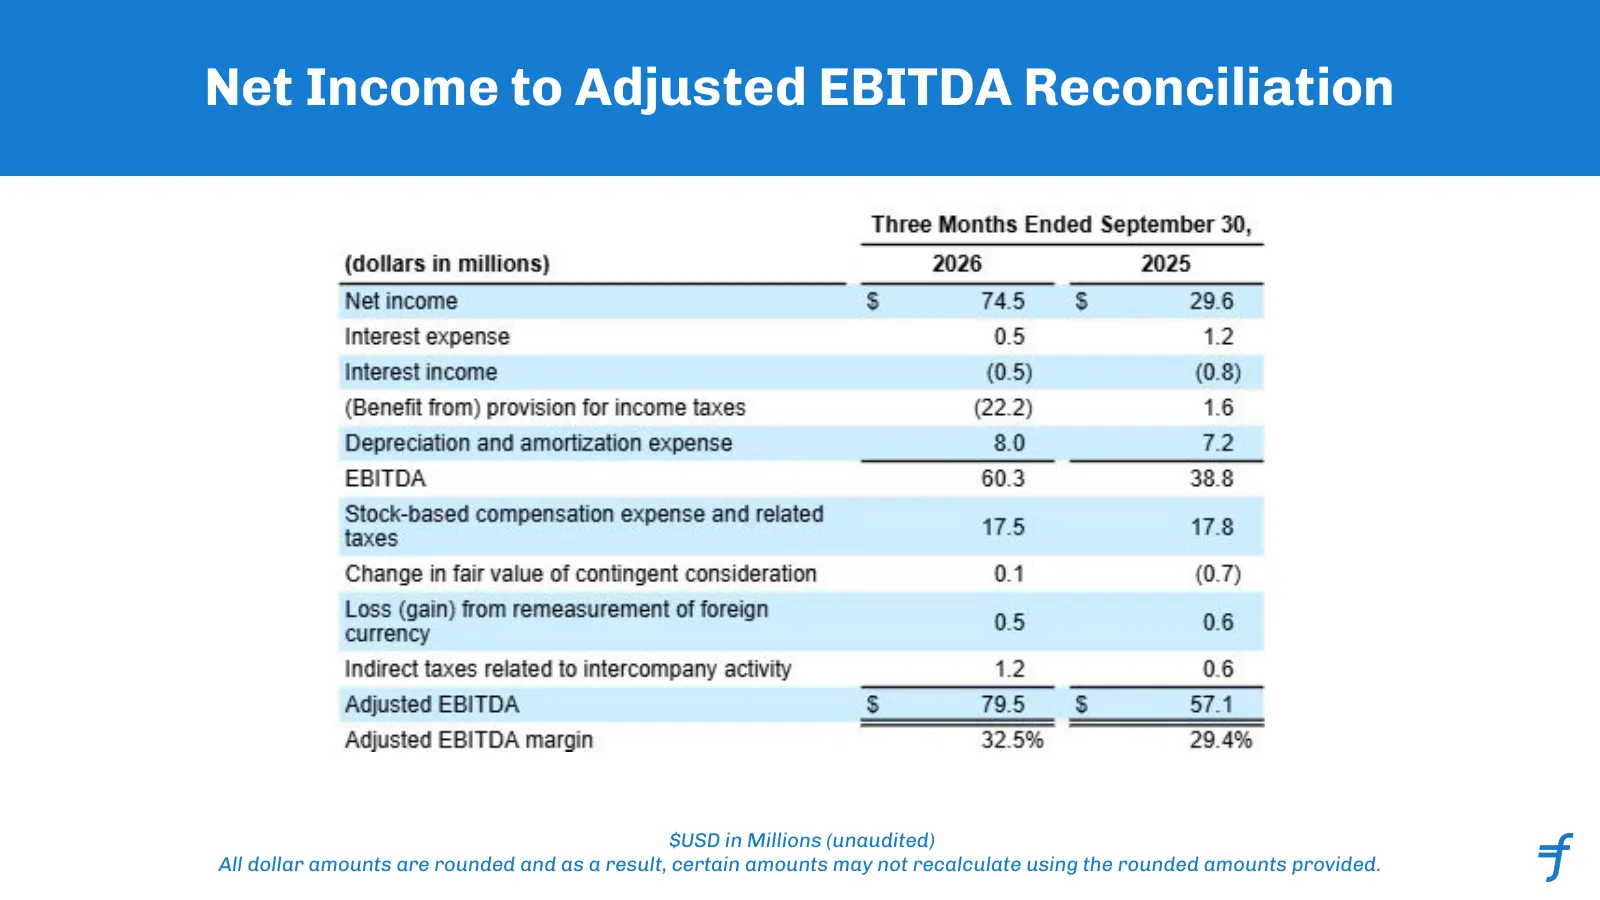
Slide 32: Net Income to Adjusted EBITDA Reconciliation
Net Income to Adjusted EBITDA Reconciliation $USD in Millions (unaudited) All dollar amounts are rounded and as a result, certain amounts may not recalculate using the rounded amounts provided.
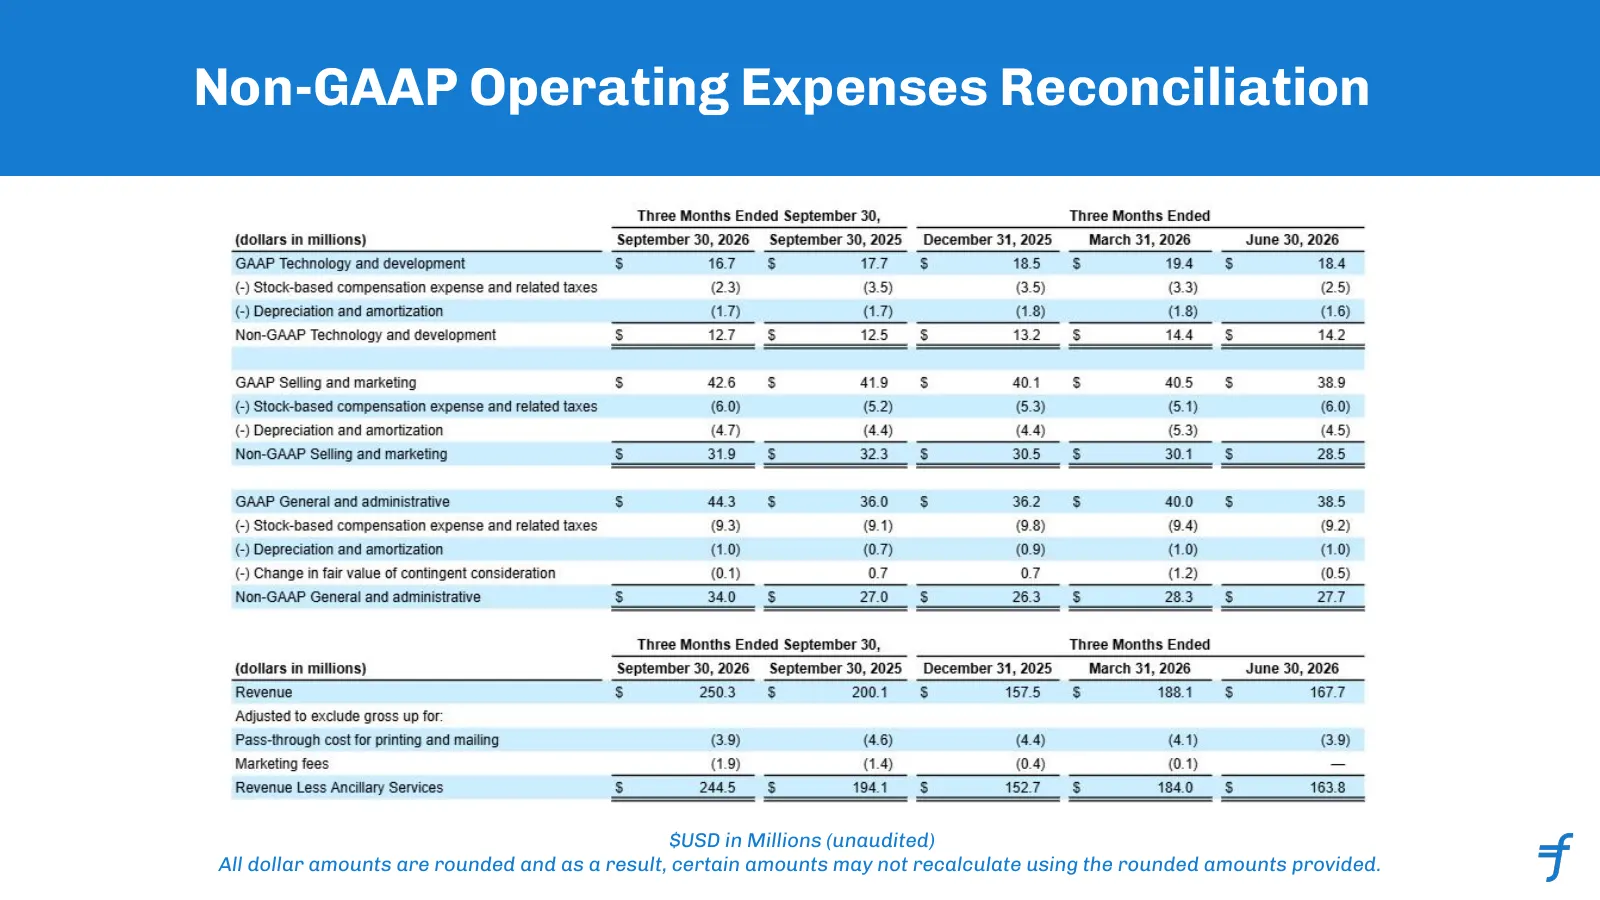
Slide 33: Non-GAAP Operating Expenses Reconciliation
Non-GAAP Operating Expenses Reconciliation $USD in Millions (unaudited) All dollar amounts are rounded and as a result, certain amounts may not recalculate using the rounded amounts provided.
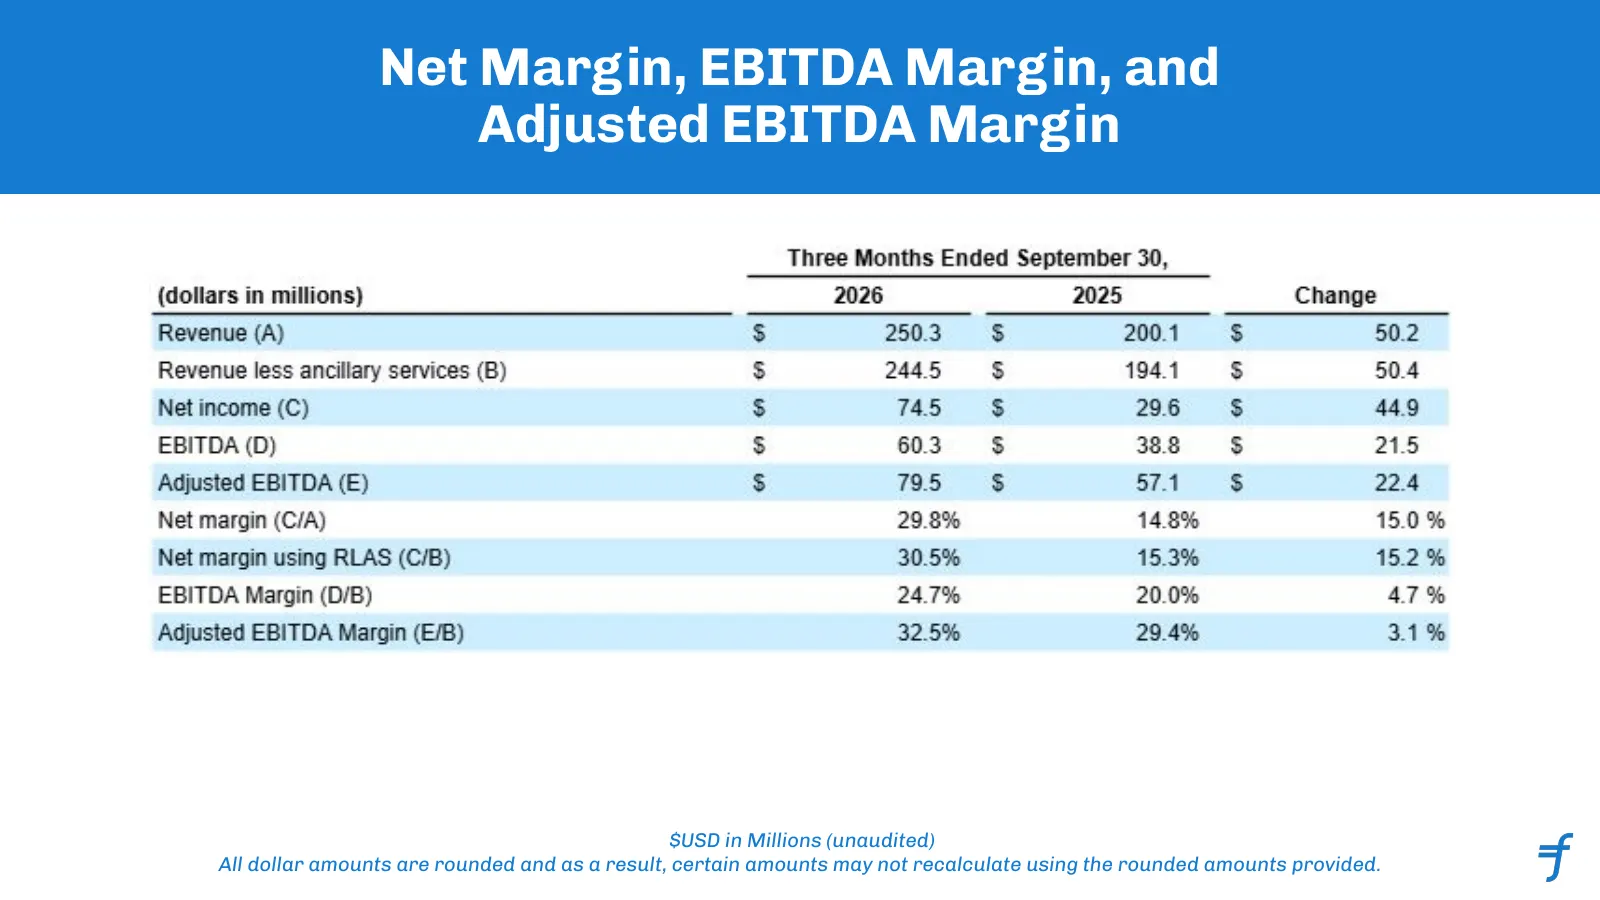
Slide 34: Net Margin, EBITDA Margin, and Adjusted EBITDA Margin
Net Margin, EBITDA Margin, and Adjusted EBITDA Margin $USD in Millions (unaudited) All dollar amounts are rounded and as a result, certain amounts may not recalculate using the rounded amounts provided.
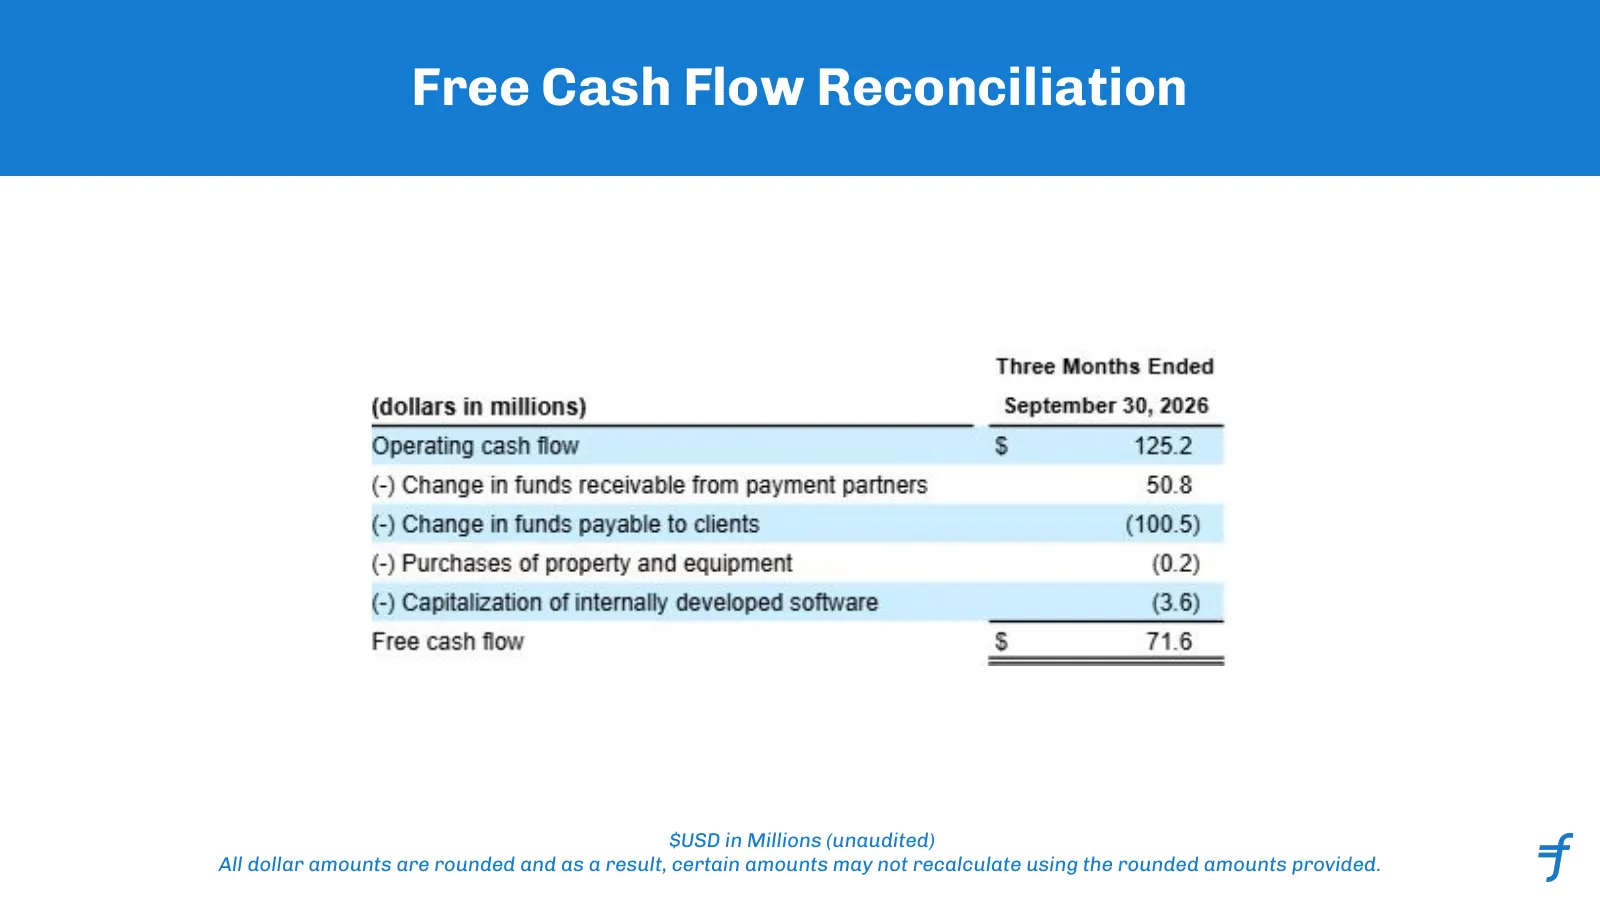
Slide 35: Free Cash Flow Reconciliation
Free Cash Flow Reconciliation $USD in Millions (unaudited) All dollar amounts are rounded and as a result, certain amounts may not recalculate using the rounded amounts provided.
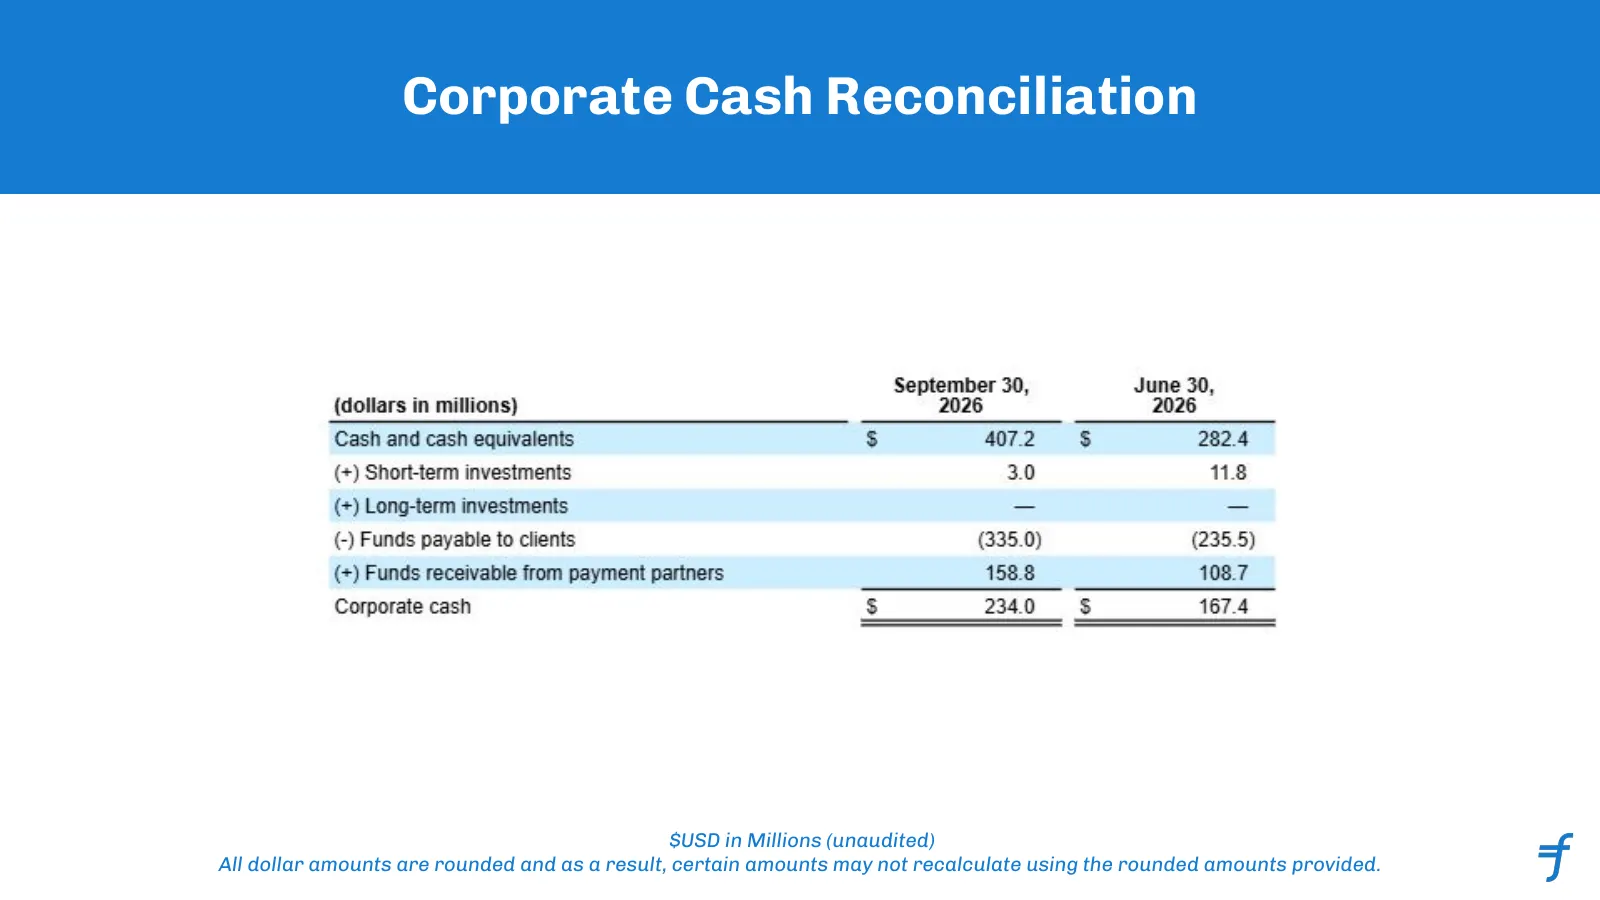
Slide 36: Corporate Cash Reconciliation
Corporate Cash Reconciliation $USD in Millions (unaudited) All dollar amounts are rounded and as a result, certain amounts may not recalculate using the rounded amounts provided.
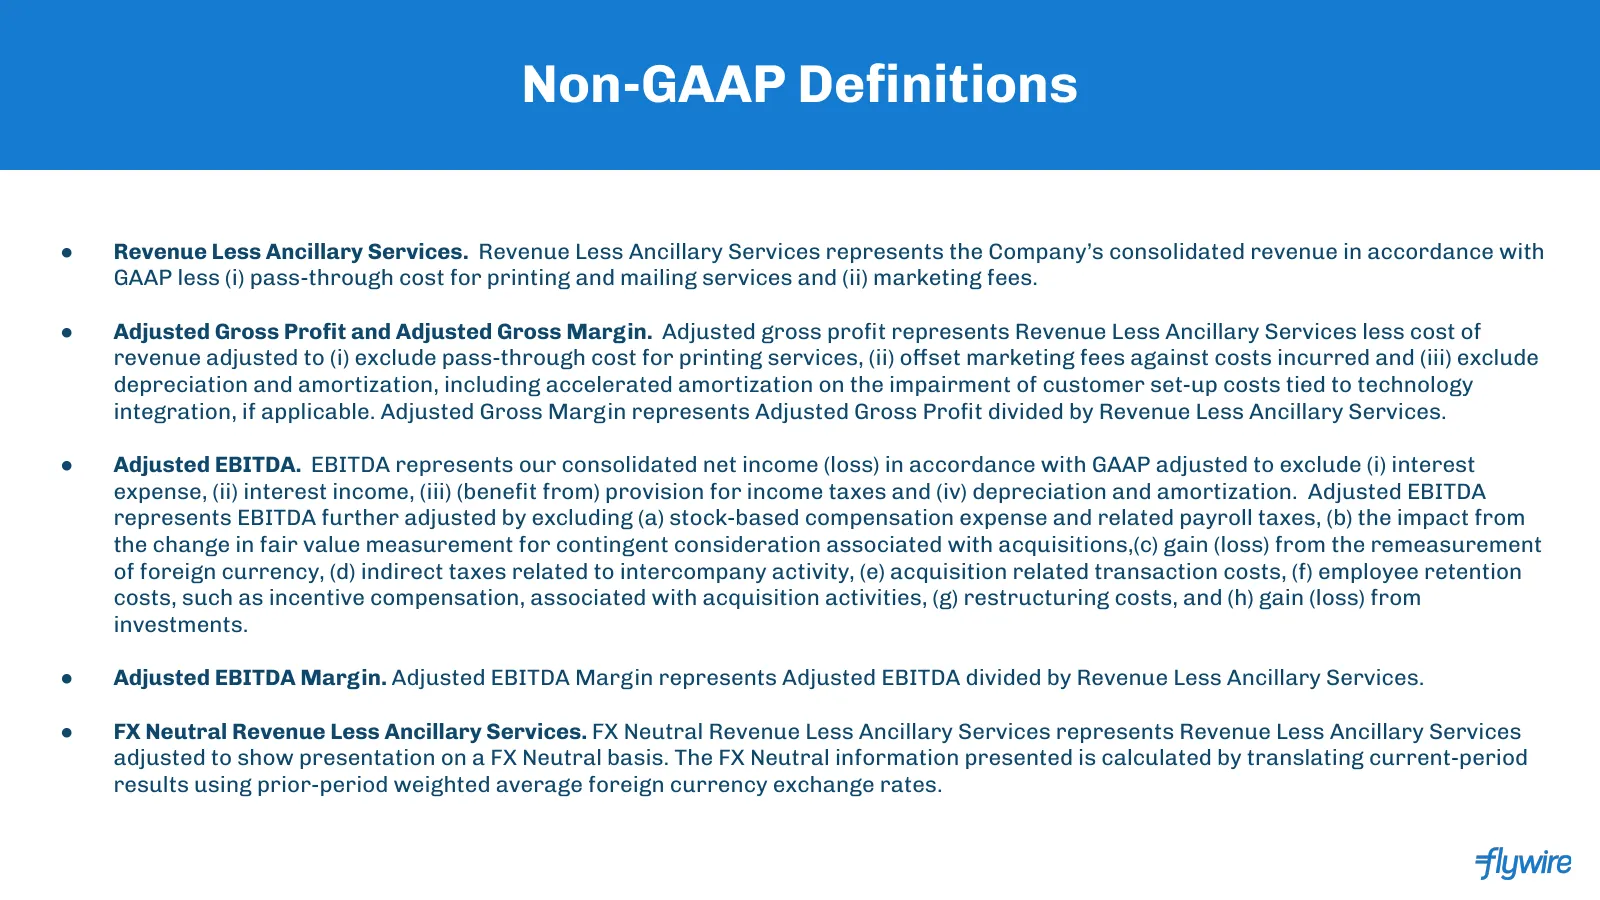
Slide 37: Non-GAAP Definitions
Non-GAAP Definitions ● Revenue Less Ancillary Services. Revenue Less Ancillary Services represents the Company’s consolidated revenue in accordance with GAAP less (i) pass-through cost for printing and mailing services and (ii) marketing fees. ● Adjusted Gross Profit and Adjusted Gross Margin. Adjuste
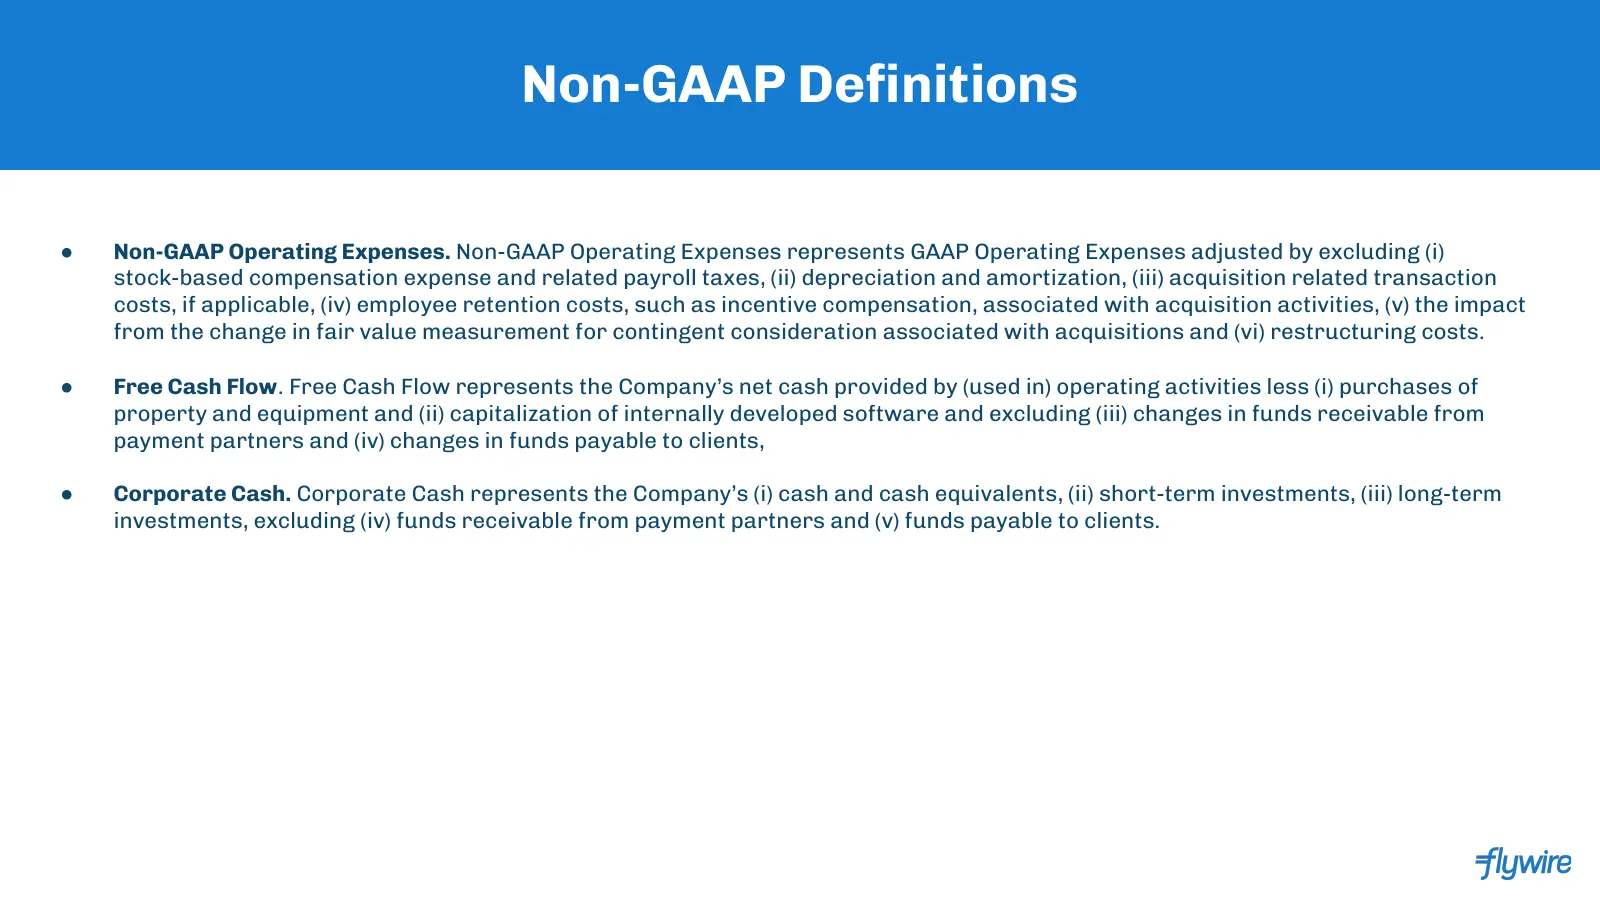
Slide 38: Non-GAAP Definitions
Non-GAAP Definitions ● Non-GAAP Operating Expenses. Non-GAAP Operating Expenses represents GAAP Operating Expenses adjusted by excluding (i) stock-based compensation expense and related payroll taxes, (ii) depreciation and amortization, (iii) acquisition related transaction costs, if applicable, (iv)
Source: 6ix earnings call
More decks from Flywire Corporation - Voting
 Q2 2026 Earnings Presentation41 slides · Aug 4, 2026
 46th Annual William Blair Growth Stock Conference (June 2026)34 slides · Jun 4, 2026
 Q1 2026 Earnings Presentation38 slides · May 5, 2026
 Q4 2025 Earnings Presentation44 slides · Feb 24, 2026
 Q3 2025 Earnings Presentation39 slides · Nov 4, 2025
 Q2 2025 Earnings Presentation34 slides · Aug 5, 2025