Continental Resources — Deutsche Bank 2008 Small and Mid Cap Growth Conference
16 slides from Continental Resources's conference presentation, Feb 12, 2008
Slide 1: Deutsche Bank 2008 Small and Mid Cap Growth Conference
Exhibit 99.1 Deutsche Bank 2008 Small and Mid Cap Growth Conference
Slide 2: Forward Looking Statements
Forward Looking Statements This presentation includes forward-looking information that are subject to a number of risks and uncertainties, many of which are beyond our control. All information, other than historical facts included in this presentation, regarding our strategy, future operations, dril
Slide 3: Company Overview
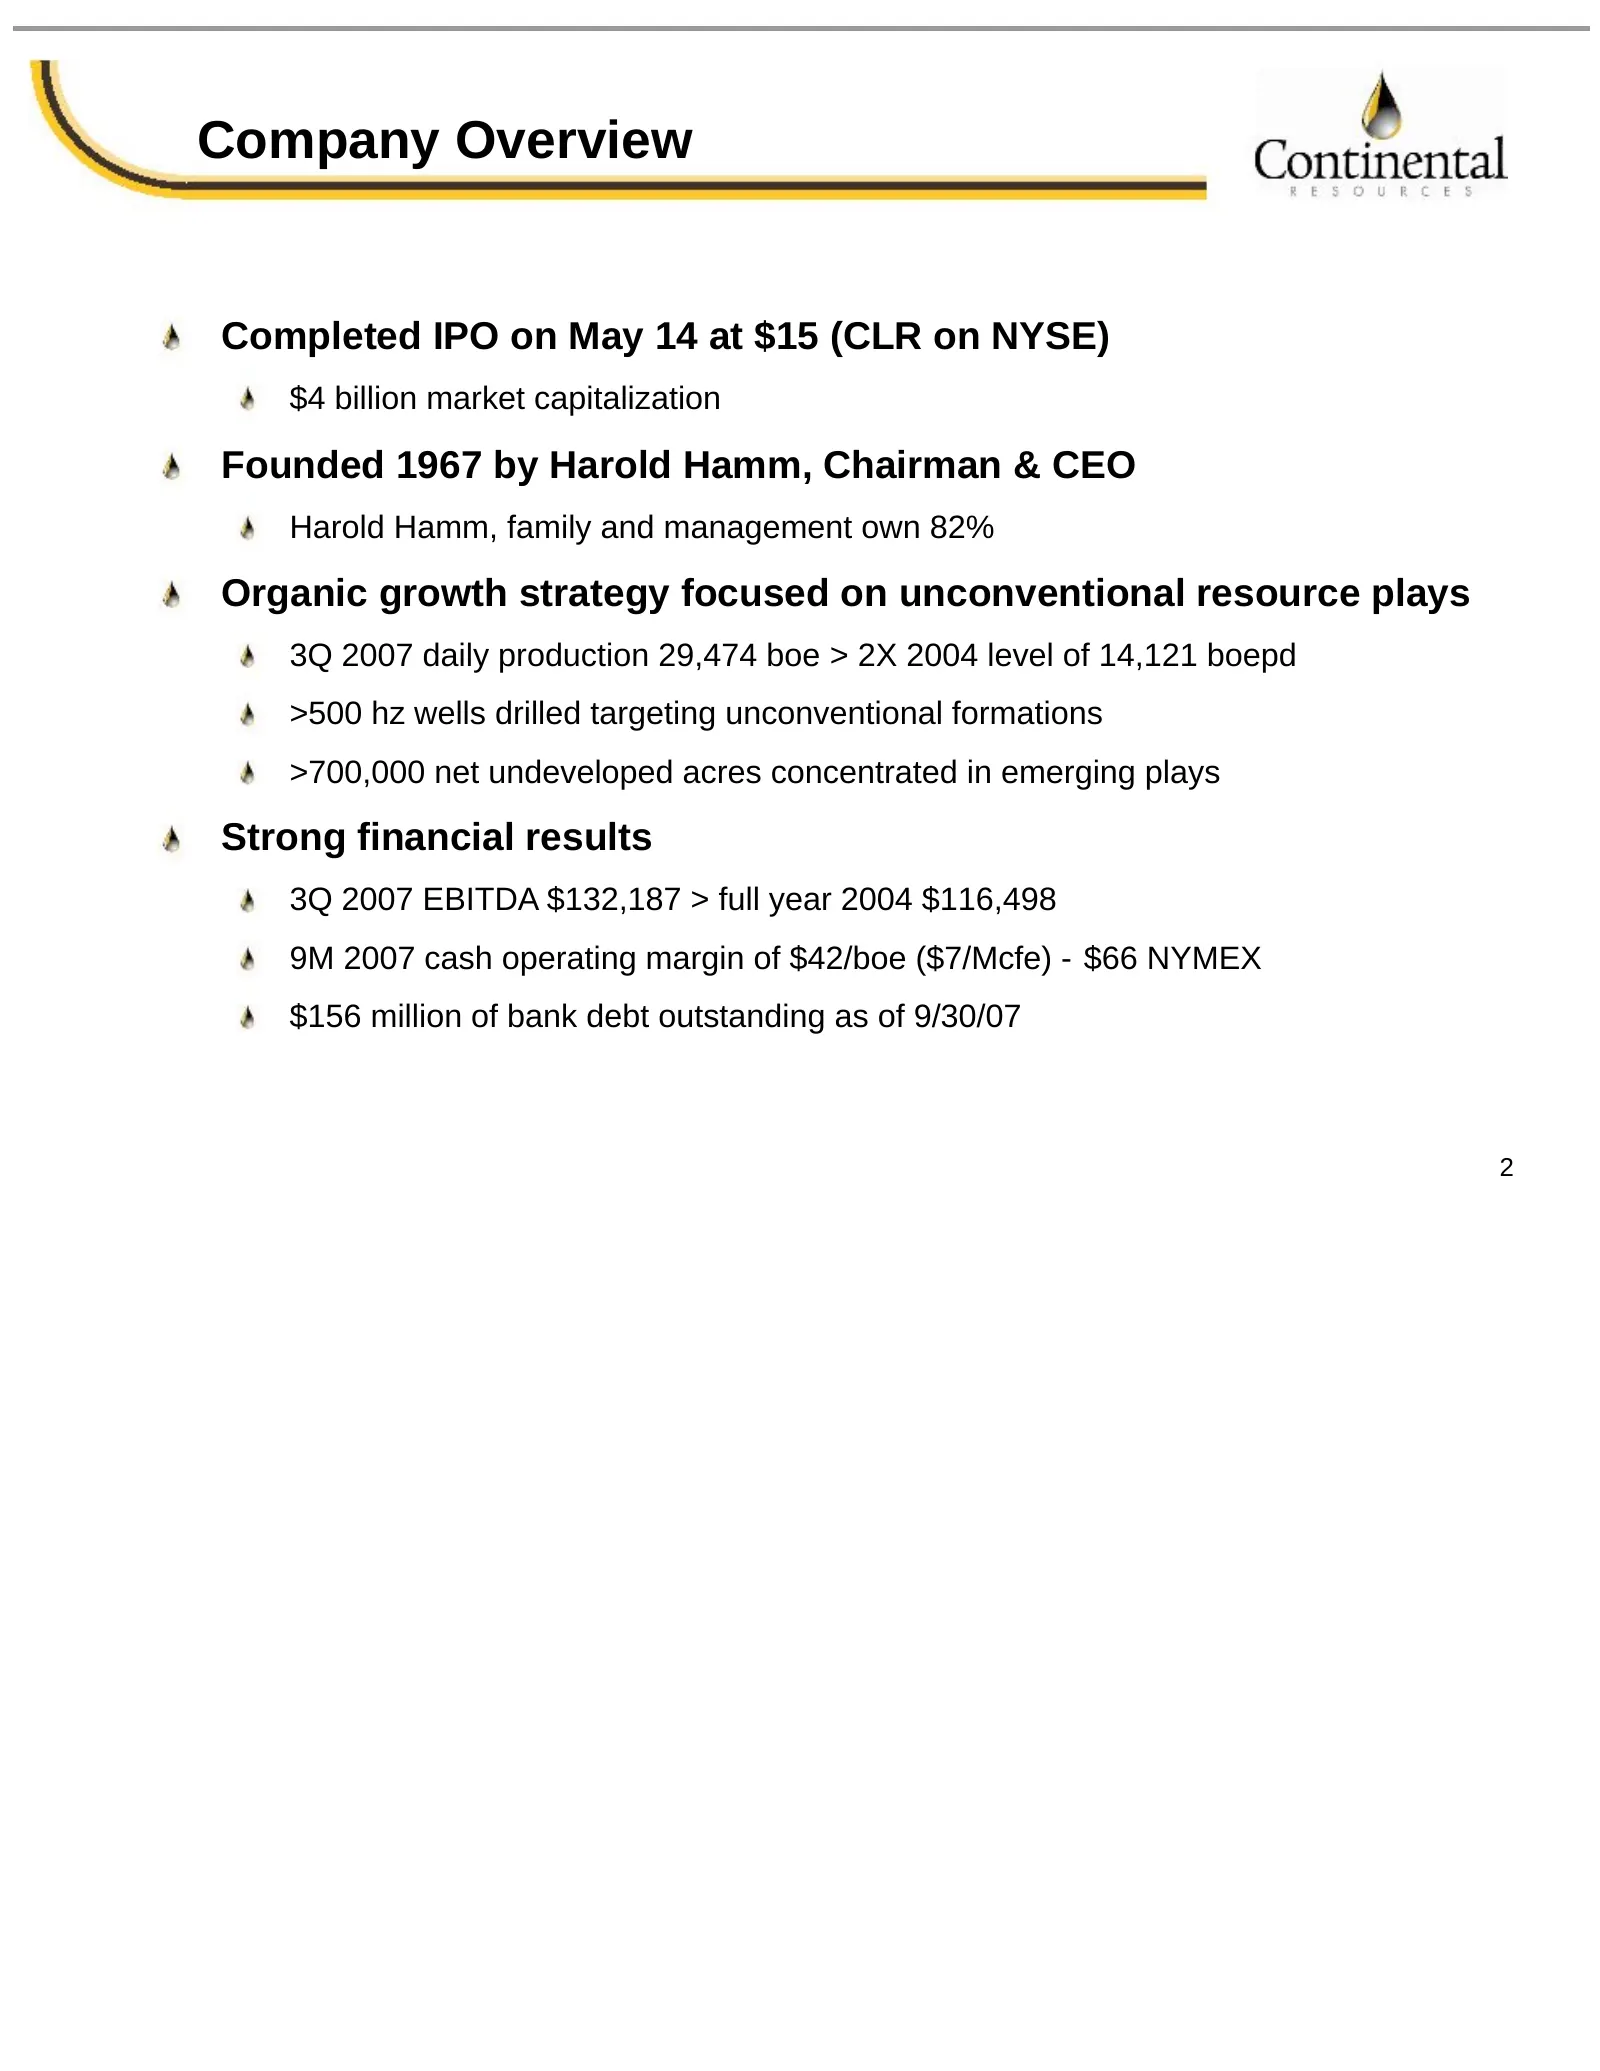
Company Overview Completed IPO on May 14 at $15 (CLR on NYSE) $4 billion market capitalization Founded 1967 by Harold Hamm, Chairman & CEO Harold Hamm, family and management own 82% Organic growth strategy focused on unconventional resource plays 3Q 2007 daily production 29,474 boe > 2X 2004 level o
Slide 4: Investment in Asset Base
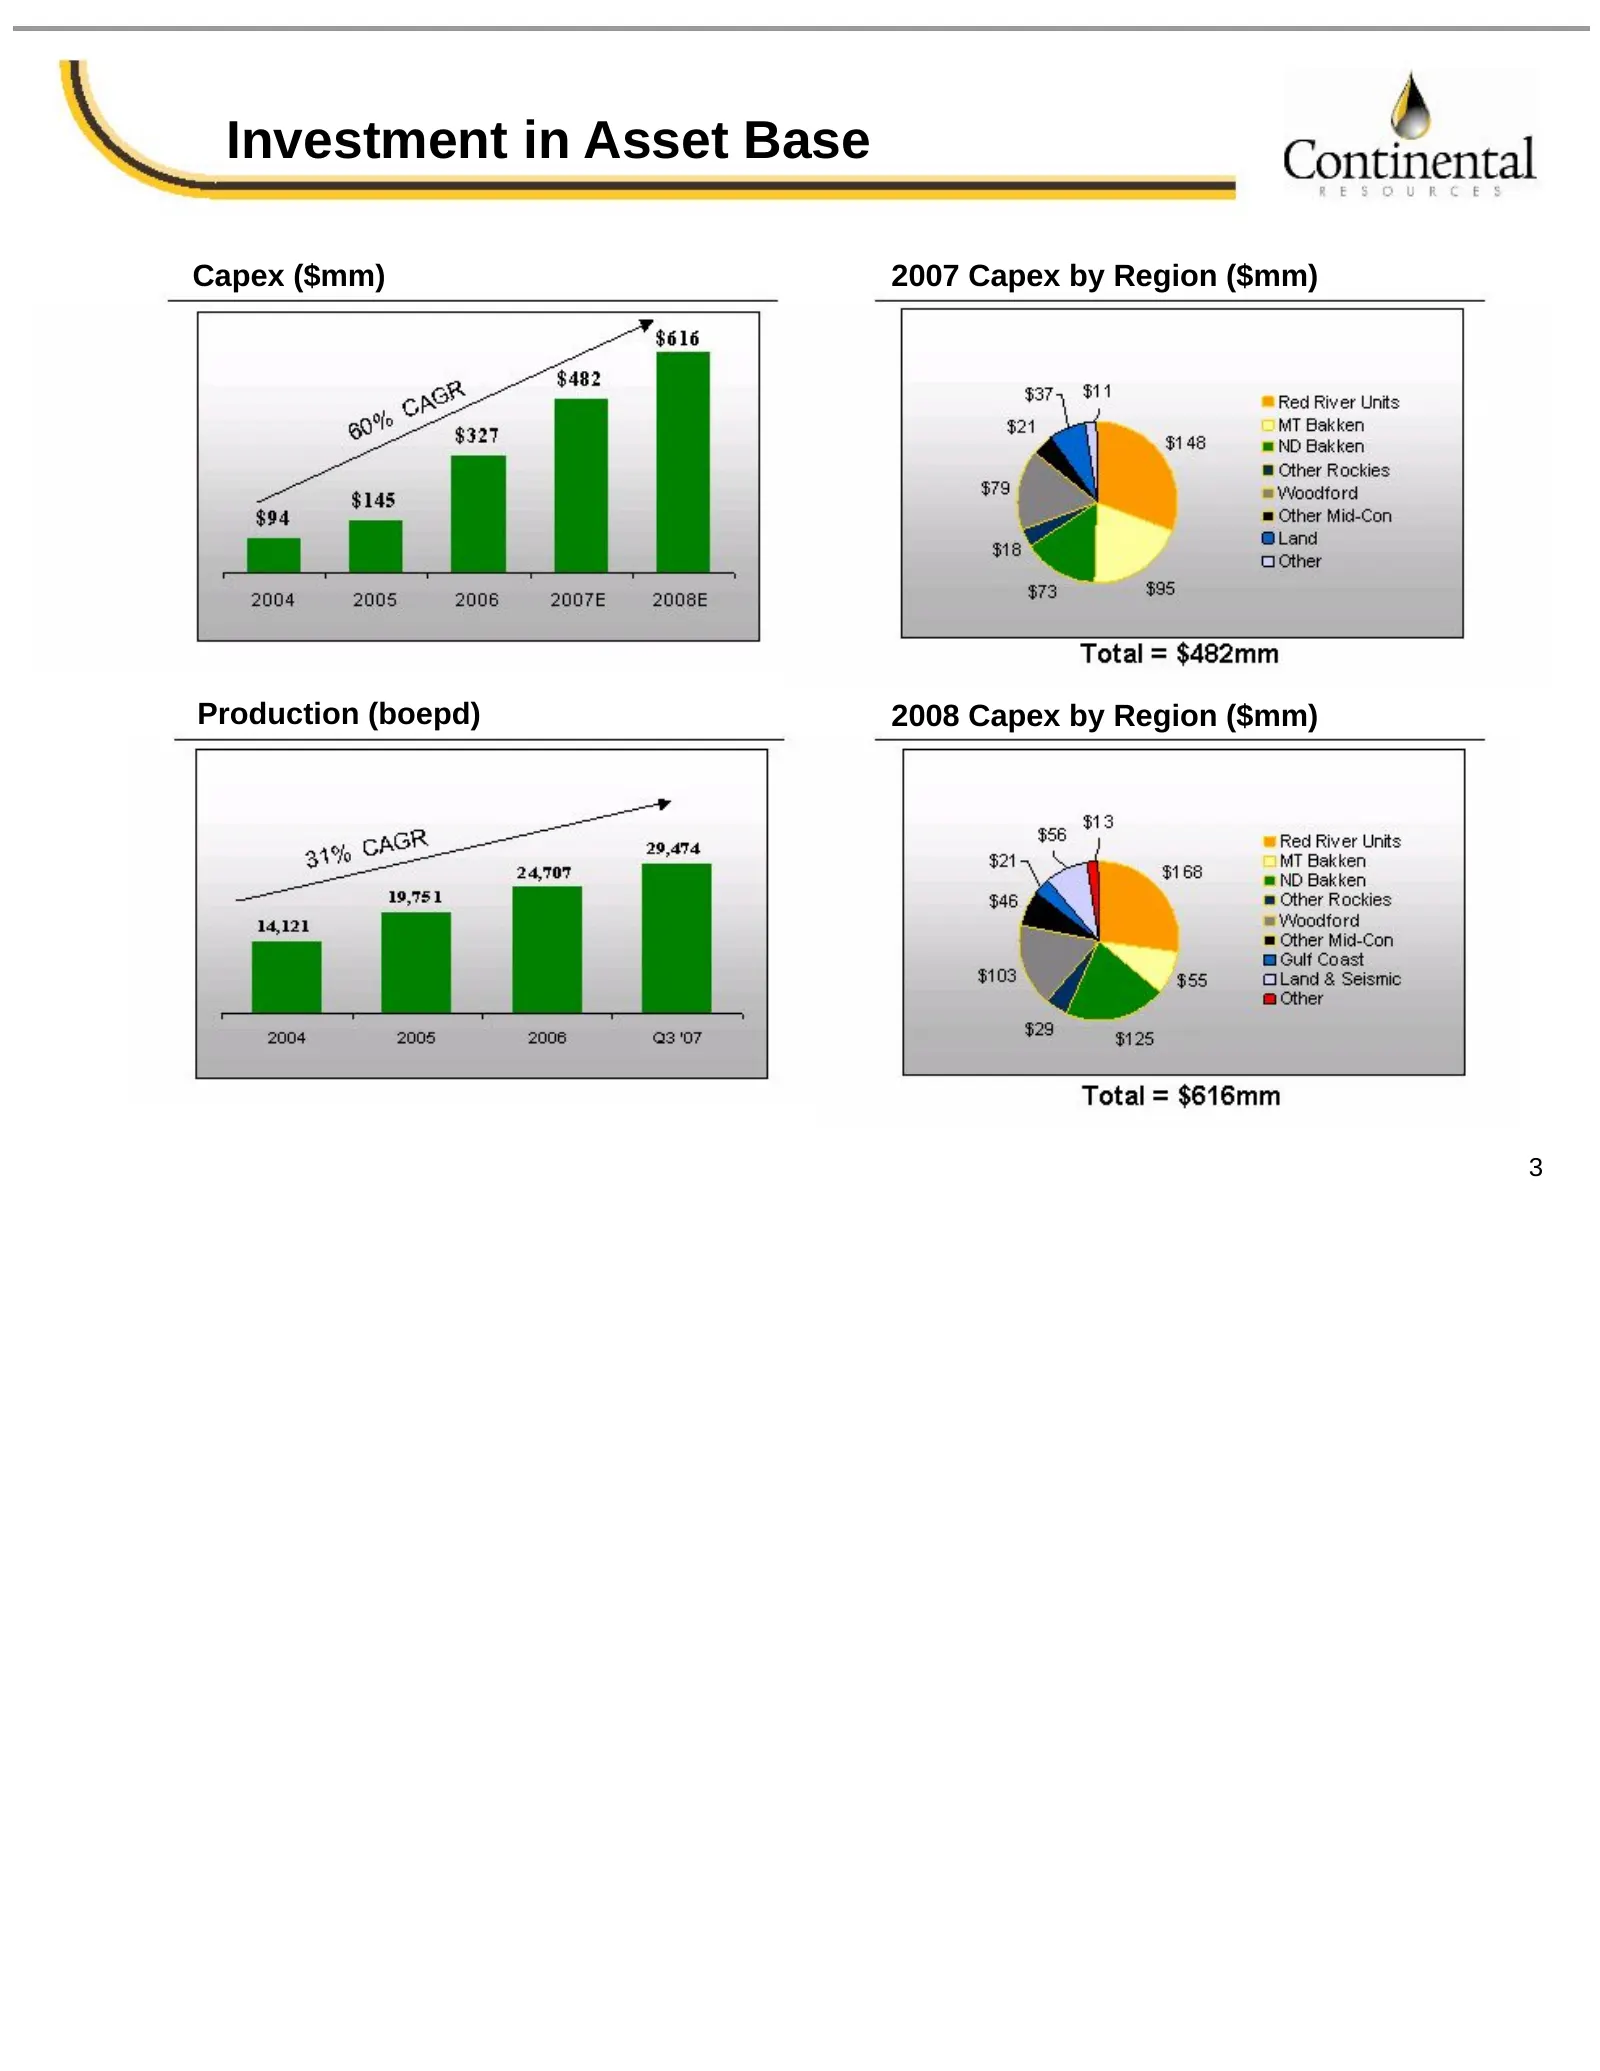
Investment in Asset Base Capex ($mm) 2007 Capex by Region ($mm) Production (boepd) 2008 Capex by Region ($mm) 3
Slide 5: Operational Overview
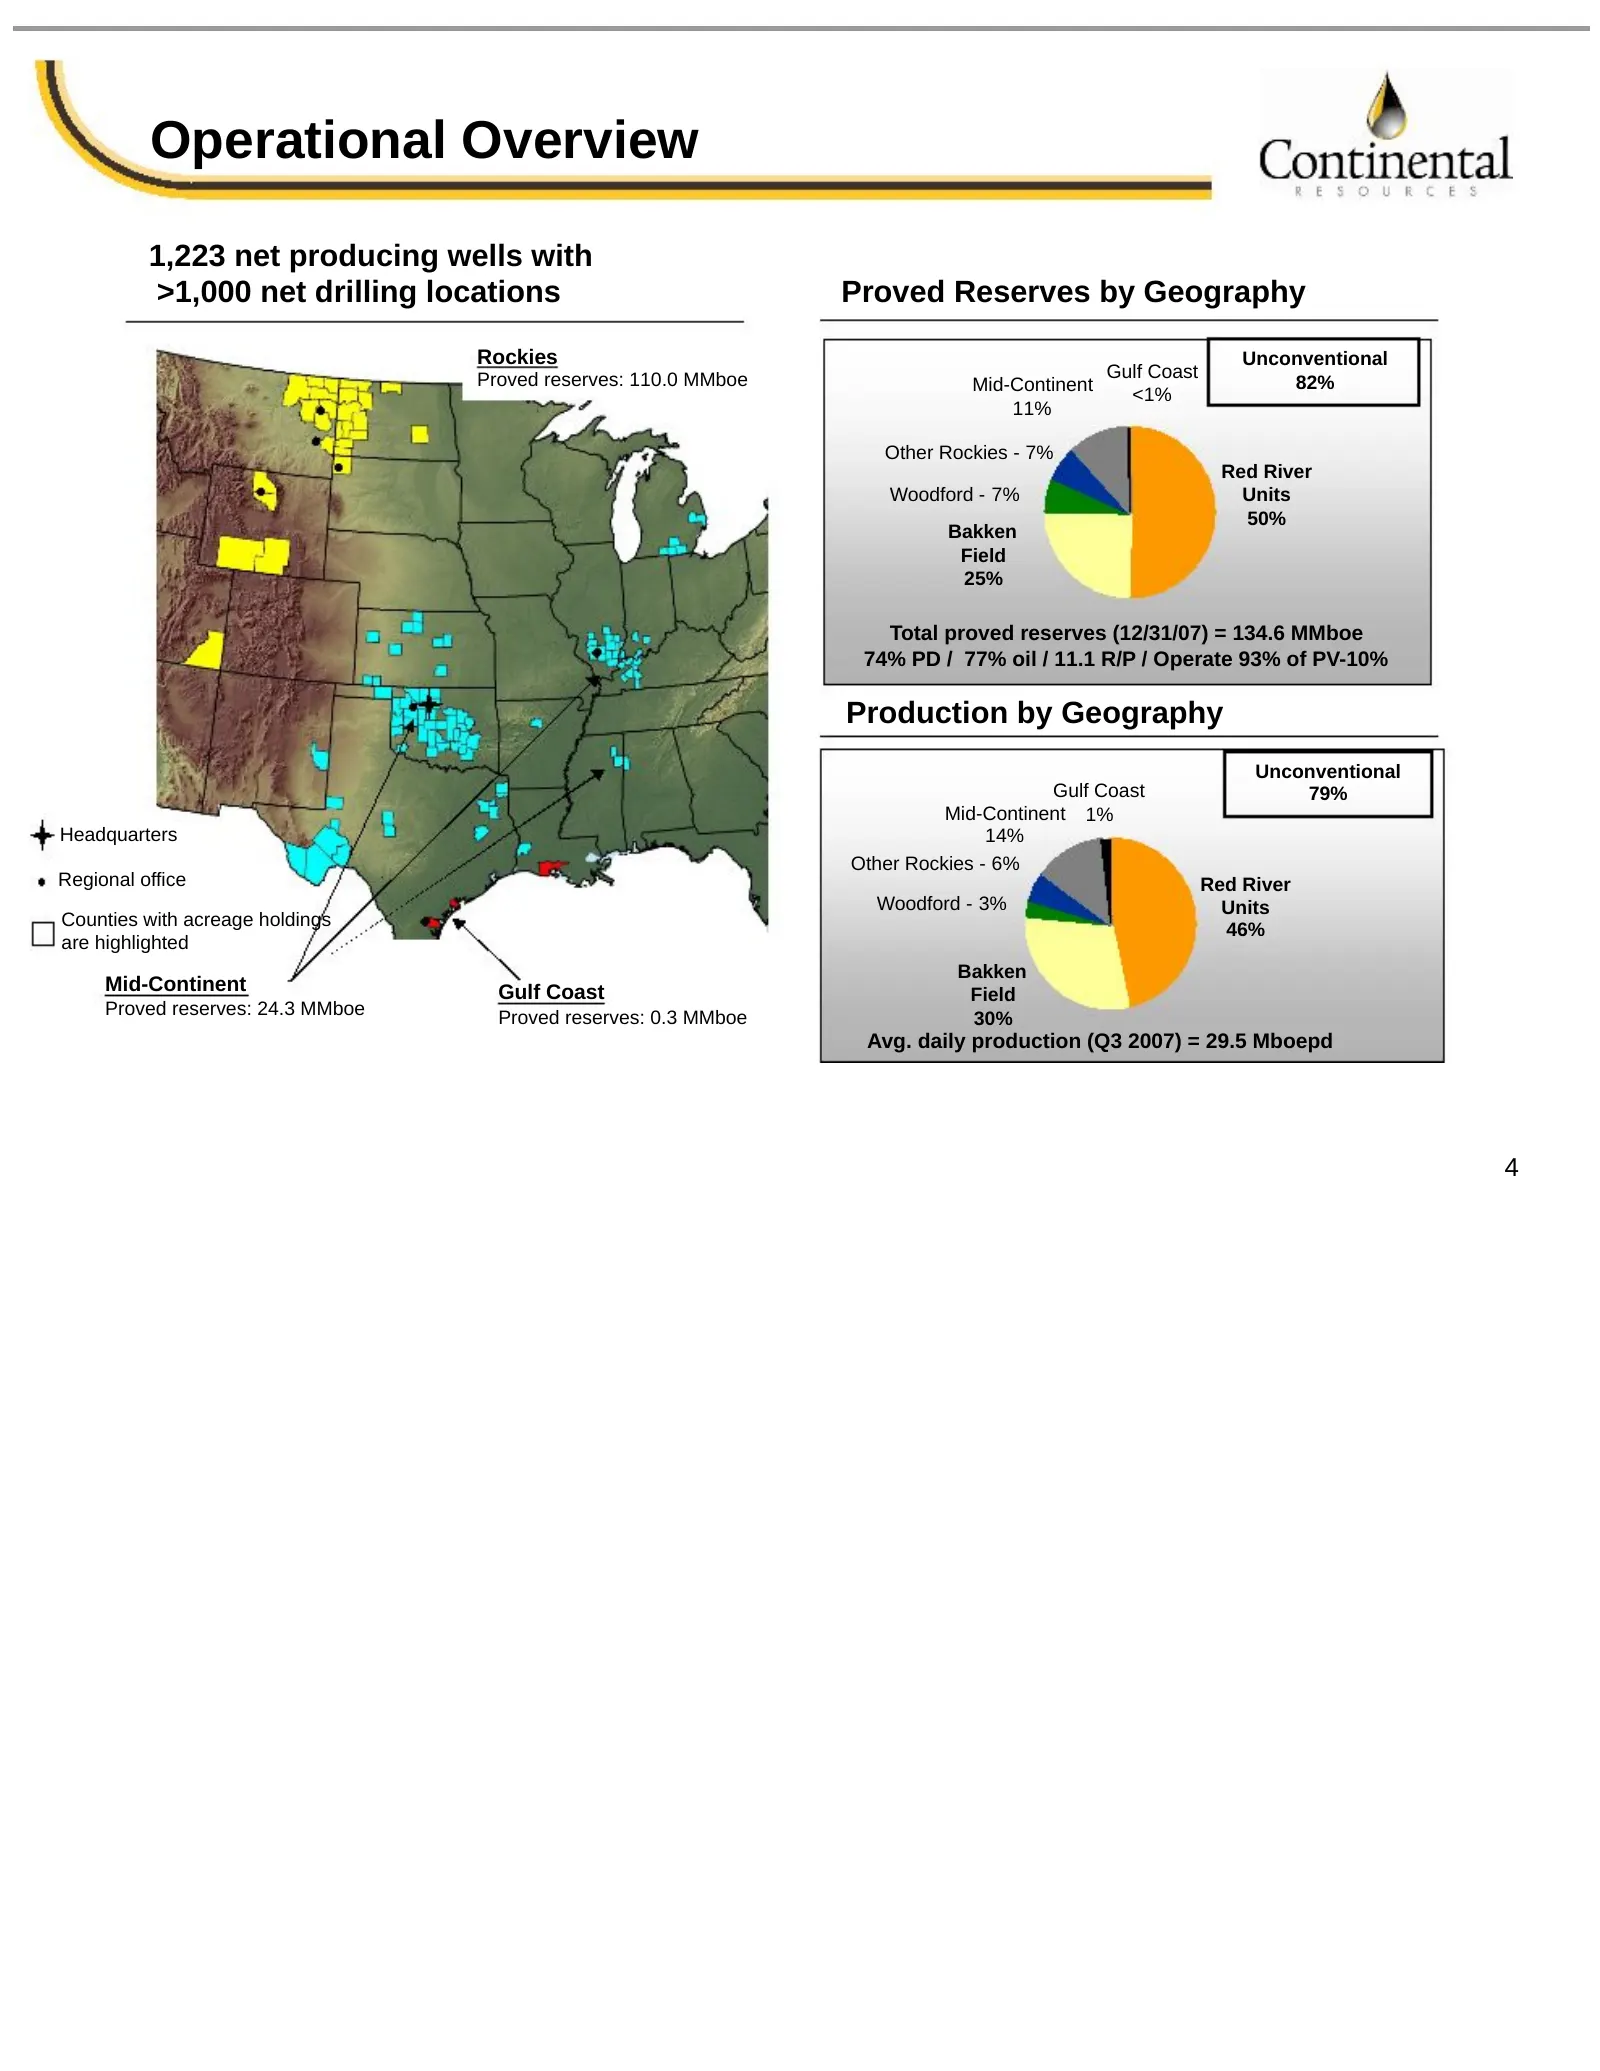
Operational Overview 1,223 net producing wells with >1,000 net drilling locations Proved Reserves by Geography Rockies Unconventional Proved reserves: 110.0 MMboe Gulf Coast Mid-Continent 82% <1% 11% Other Rockies - 7% Red River Woodford - 7% Units 50% Bakken Field 25% Total proved reserves (12/31/0
Slide 6: Key Drilling Projects
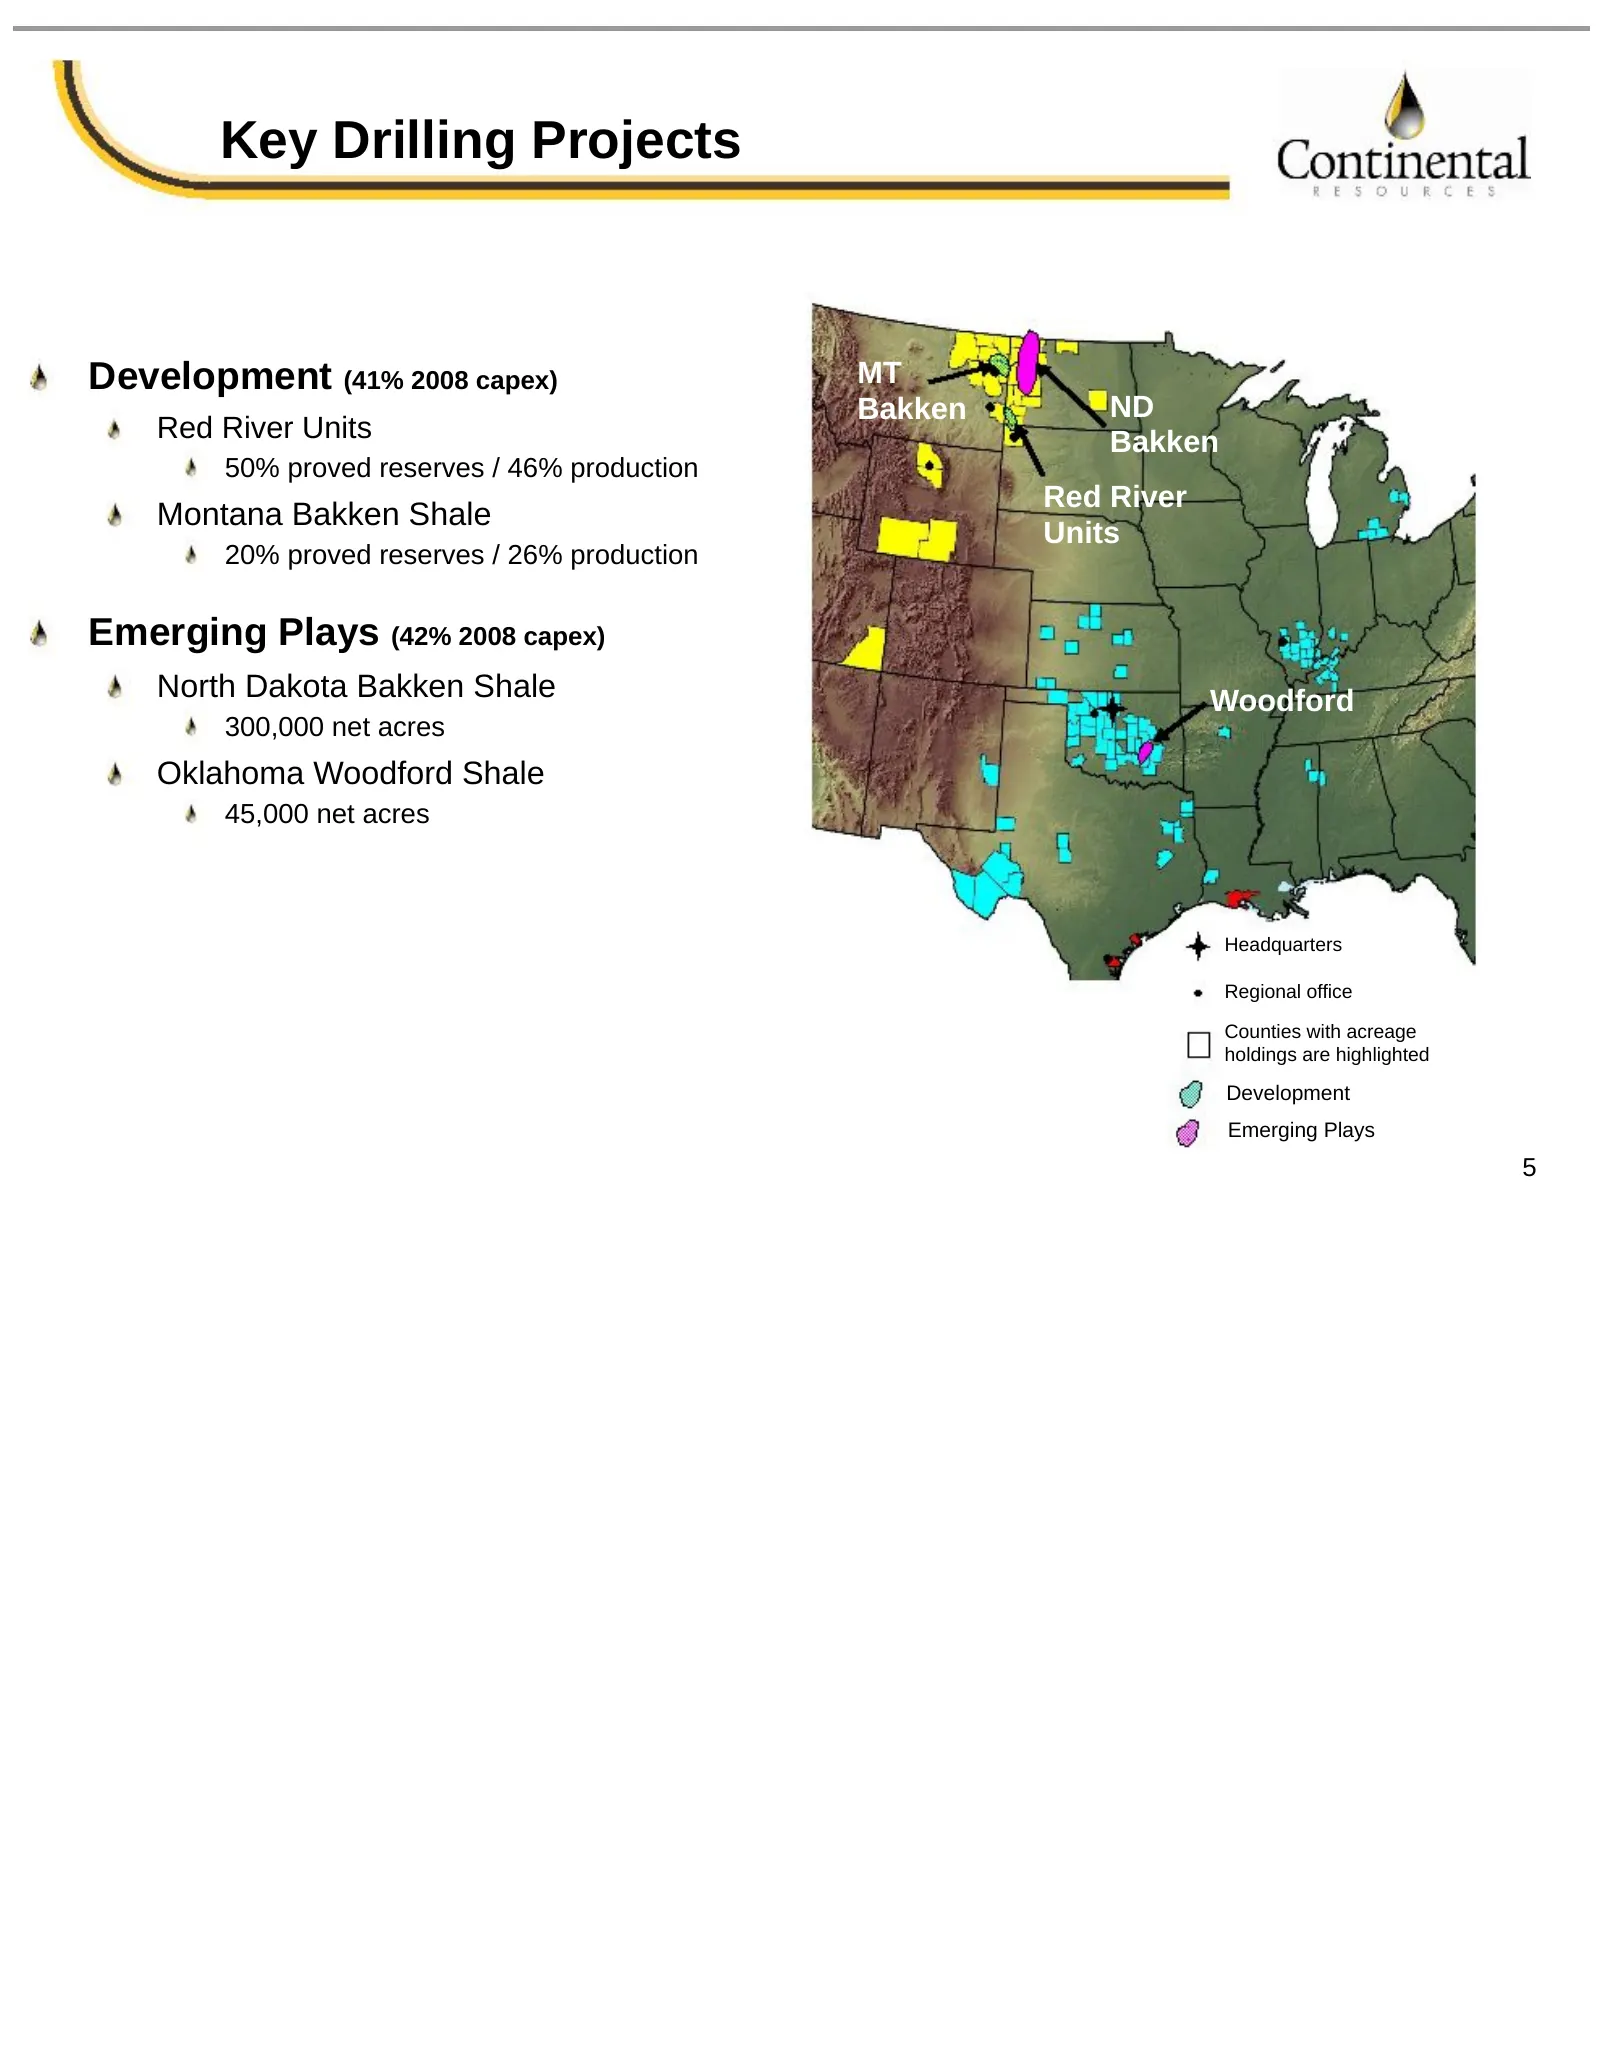
Key Drilling Projects Development (41% 2008 capex) MT Bakken ND Red River Units Bakken 50% proved reserves / 46% production Red River Montana Bakken Shale Units 20% proved reserves / 26% production Emerging Plays (42% 2008 capex) North Dakota Bakken Shale Woodford 300,000 net acres Oklahoma Woodford
Slide 7: Red River Enhanced Recovery Units
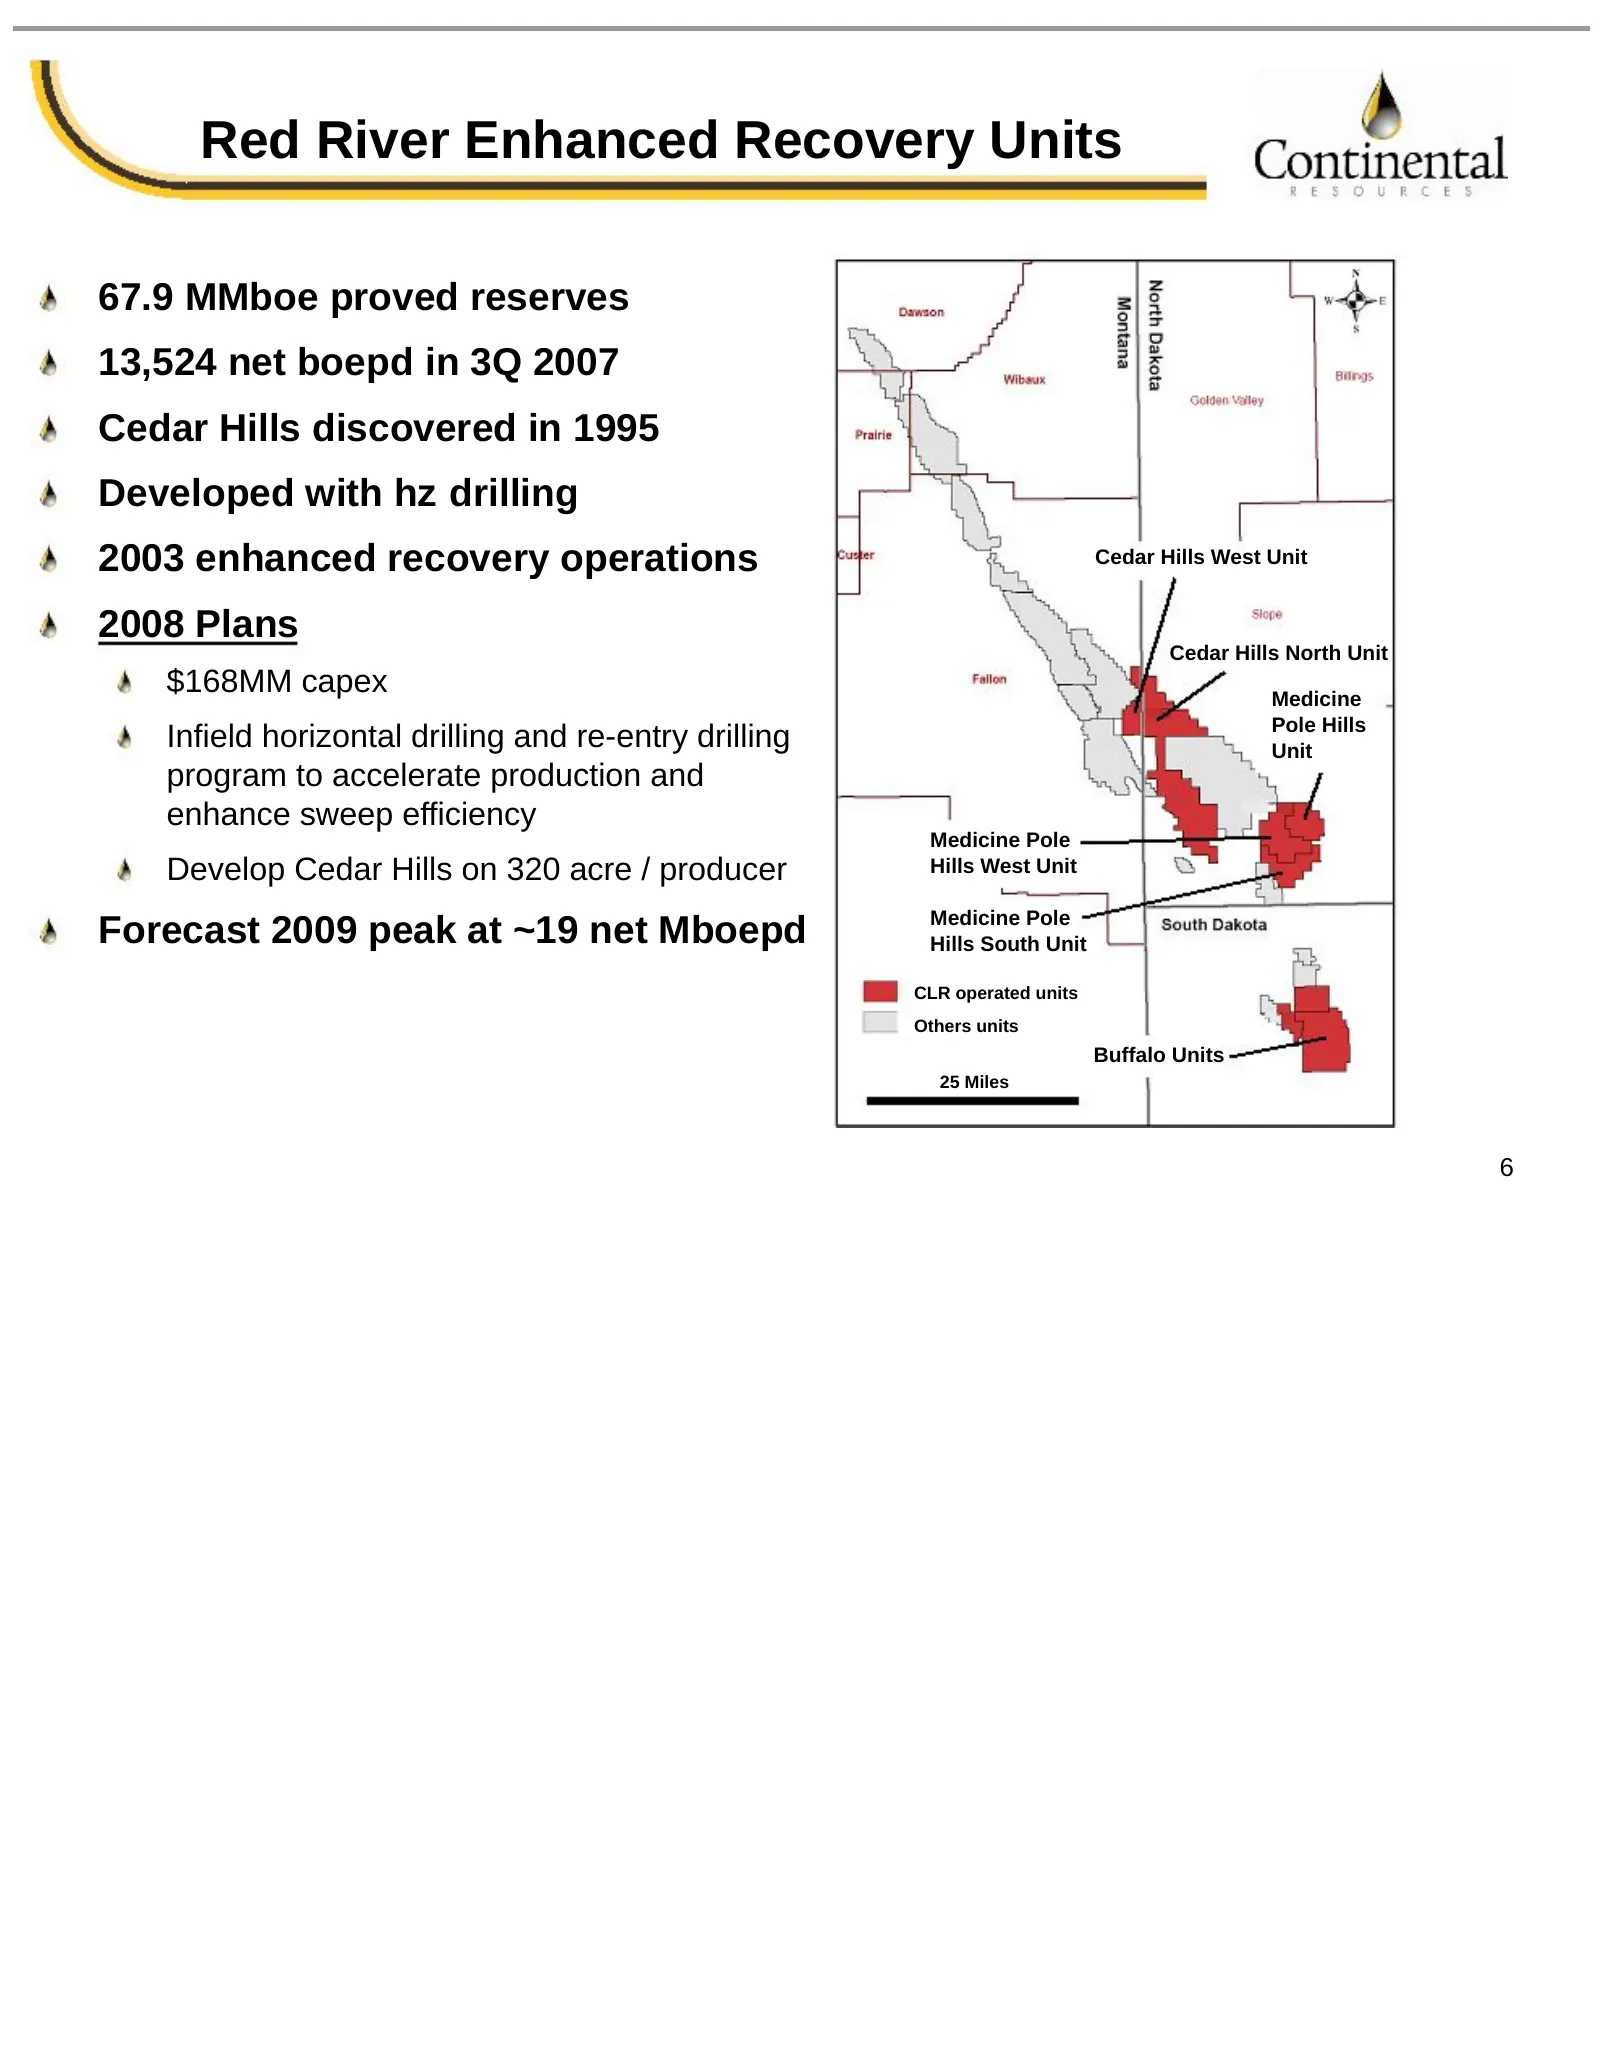
Red River Enhanced Recovery Units 67.9 MMboe proved reserves 13,524 net boepd in 3Q 2007 Cedar Hills discovered in 1995 Developed with hz drilling 2003 enhanced recovery operations Cedar Hills West Unit 2008 Plans Cedar Hills North Unit $168MM capex Medicine Pole Hills Infield horizontal drilling an
Slide 8: Montana Bakken Shale
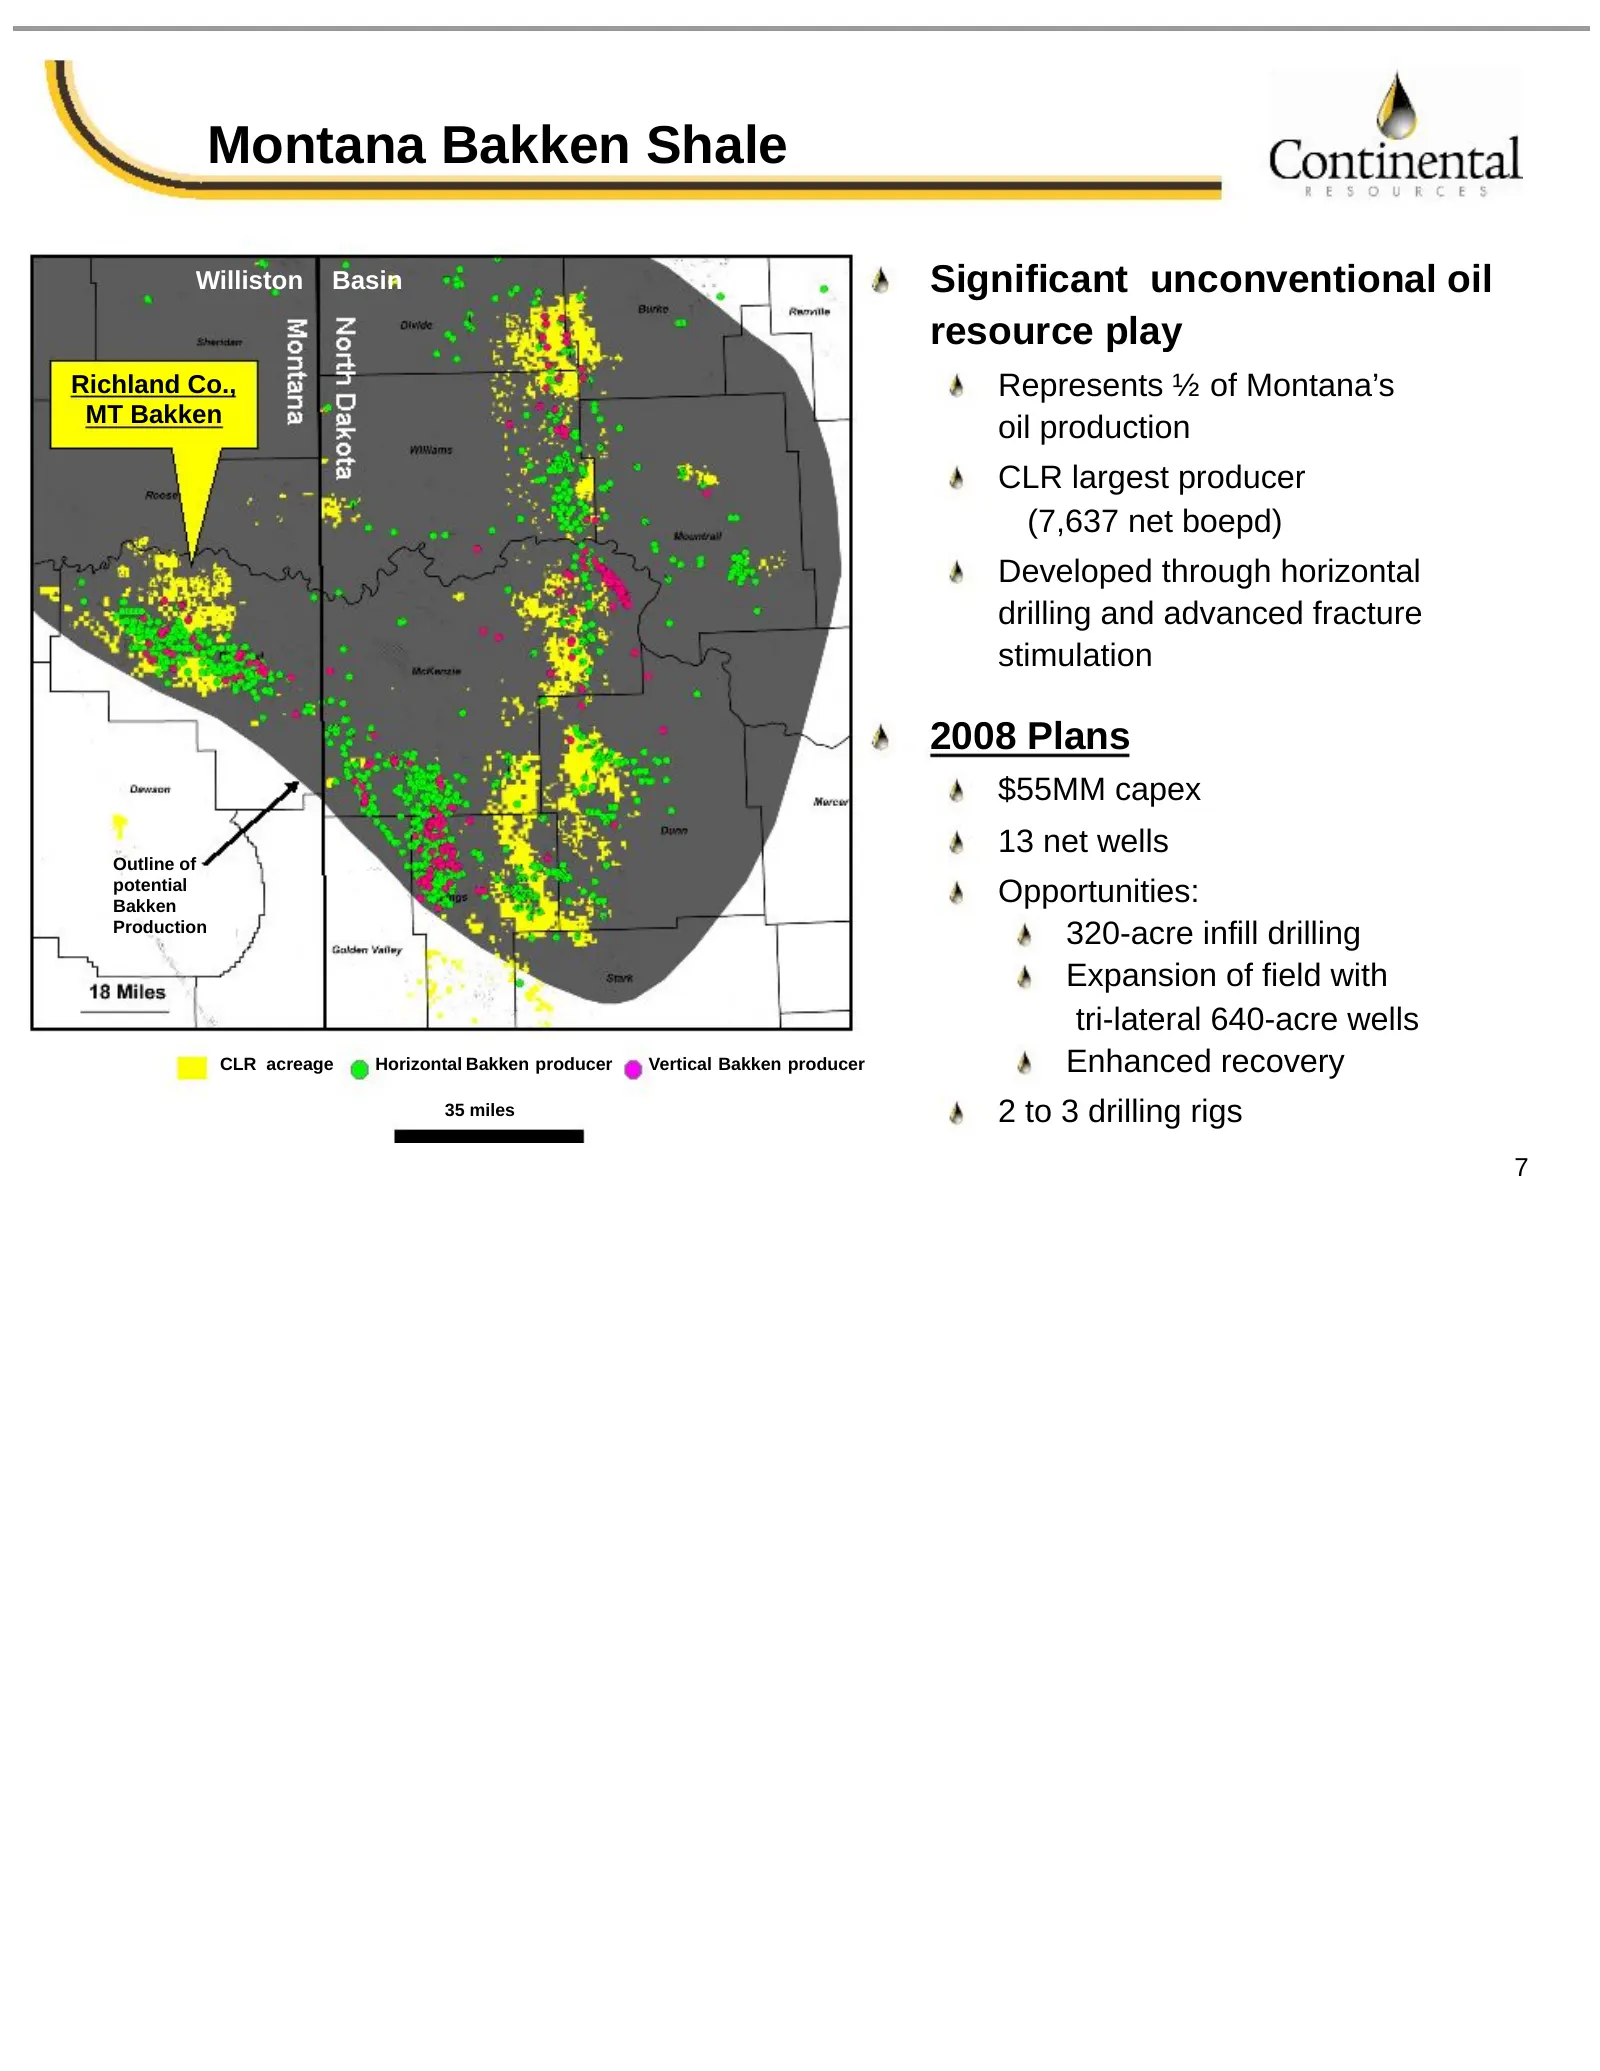
Montana Bakken Shale Williston Basin Significant unconventional oil resource play Richland Co., Represents ½ of Montana’s MT Bakken oil production CLR largest producer (7,637 net boepd) Developed through horizontal drilling and advanced fracture stimulation 2008 Plans $55MM capex 13 net wells Outlin
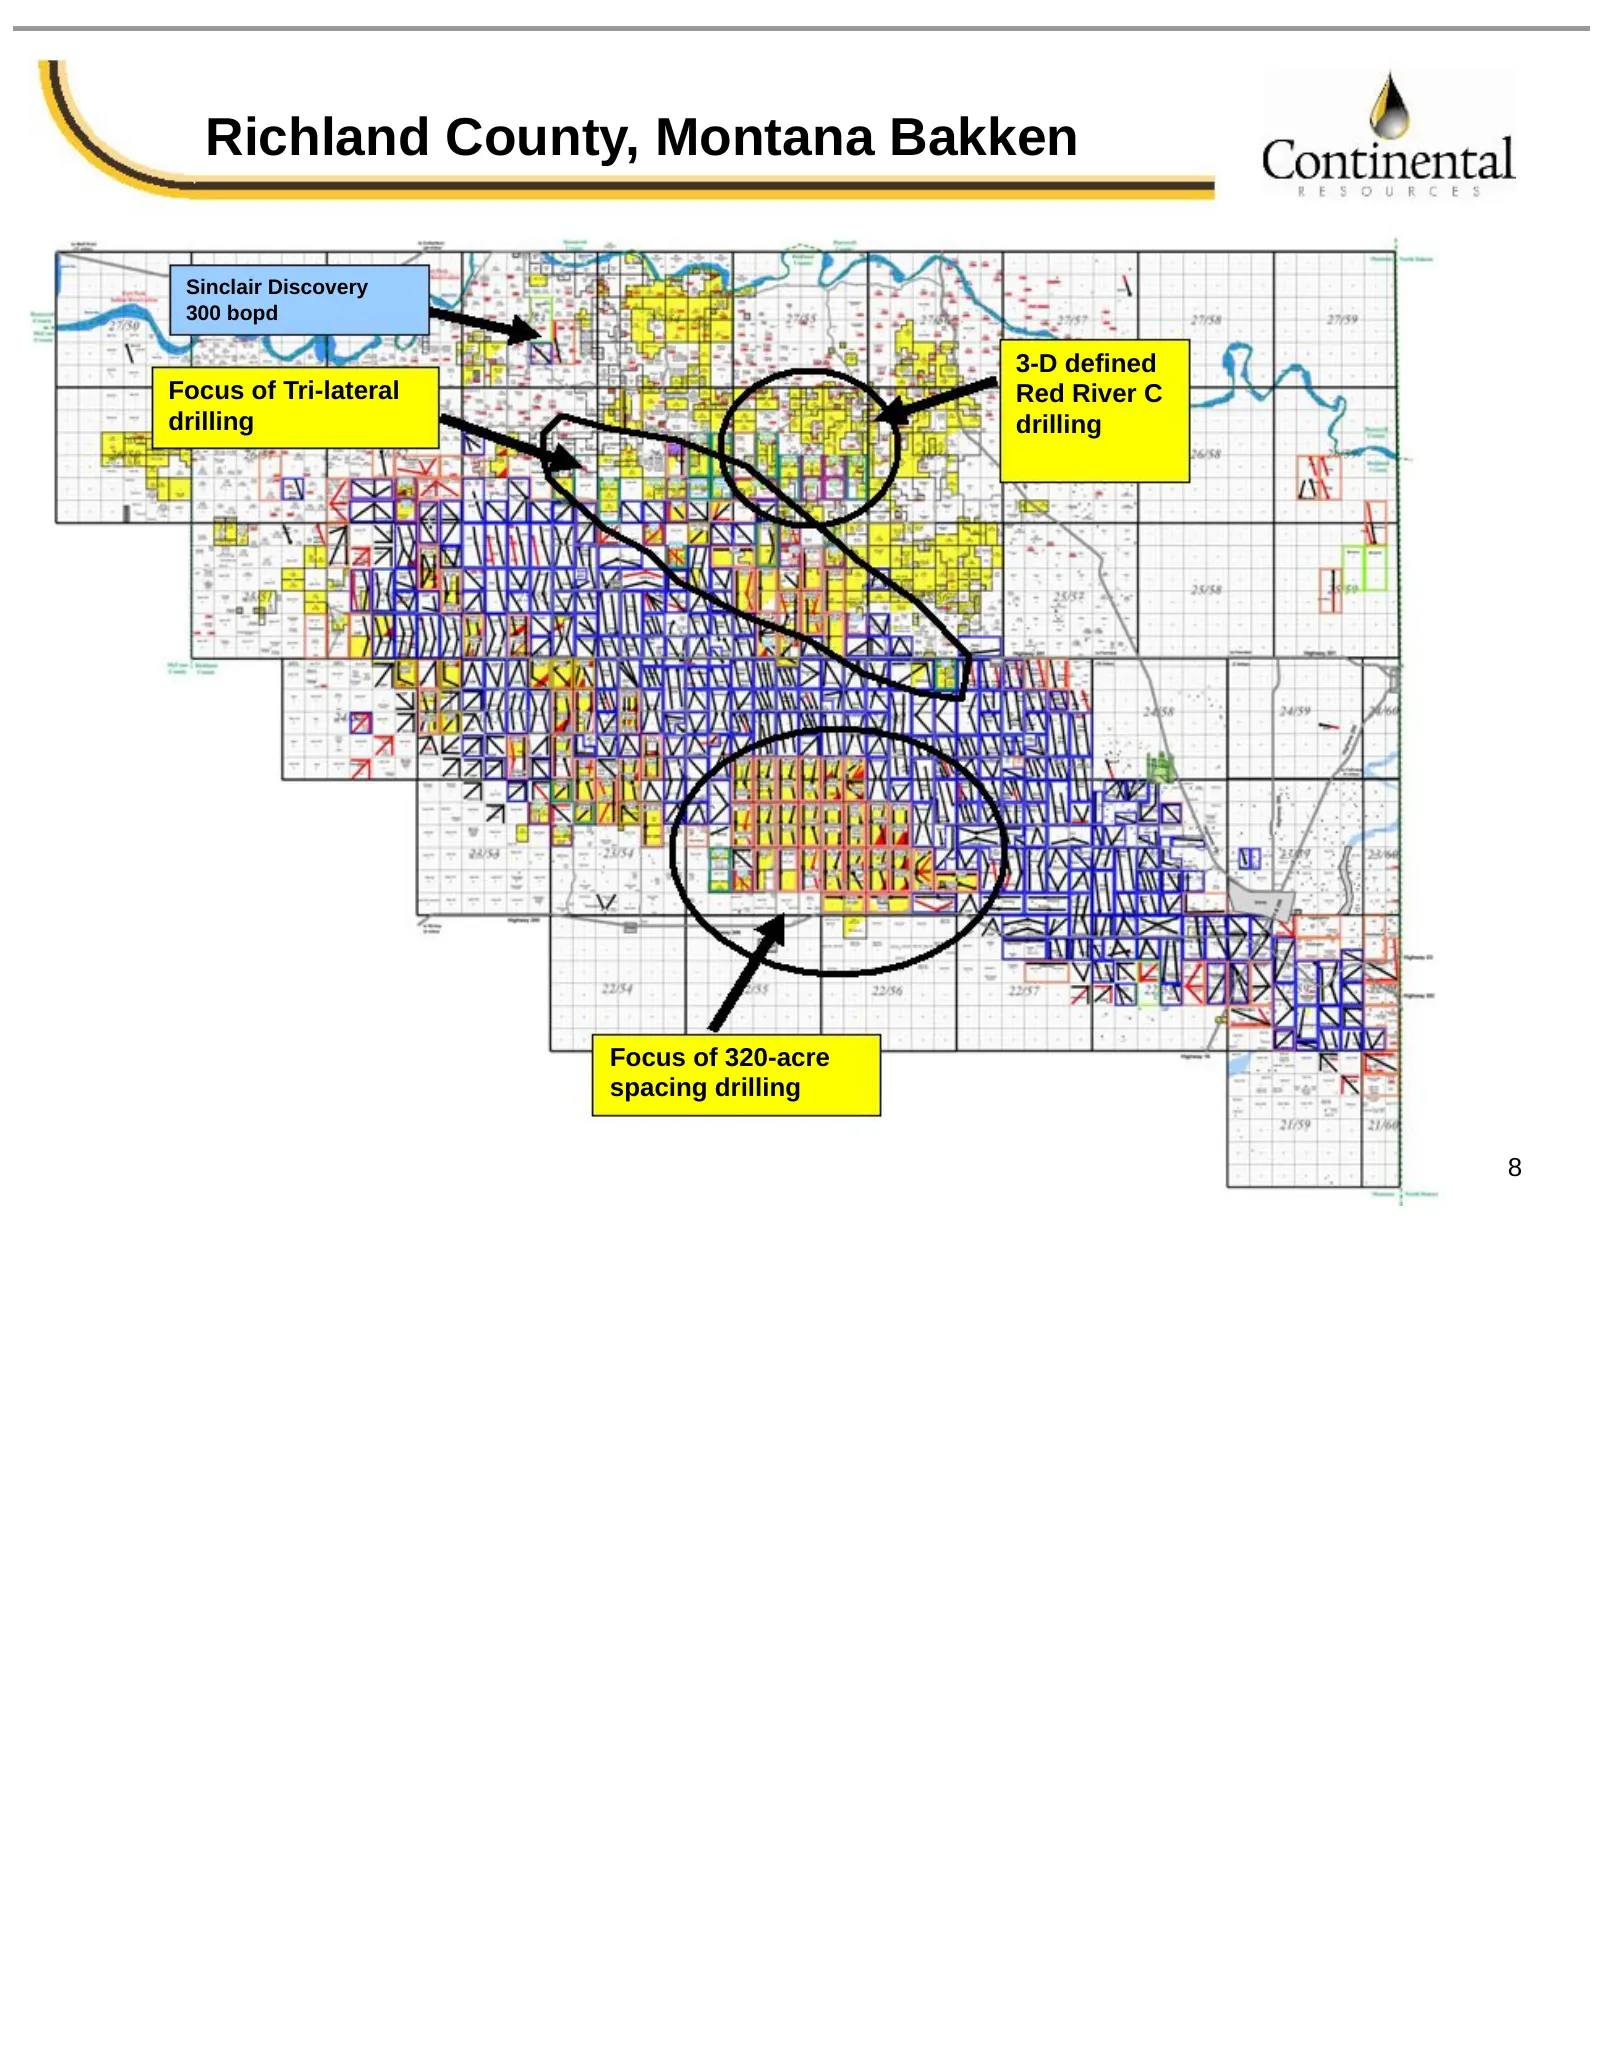
Slide 9: Richland County, Montana Bakken
Richland County, Montana Bakken Sinclair Discovery 300 bopd 3-D defined Focus of Tri-lateral Red River C drilling drilling Focus of 320-acre spacing drilling 8
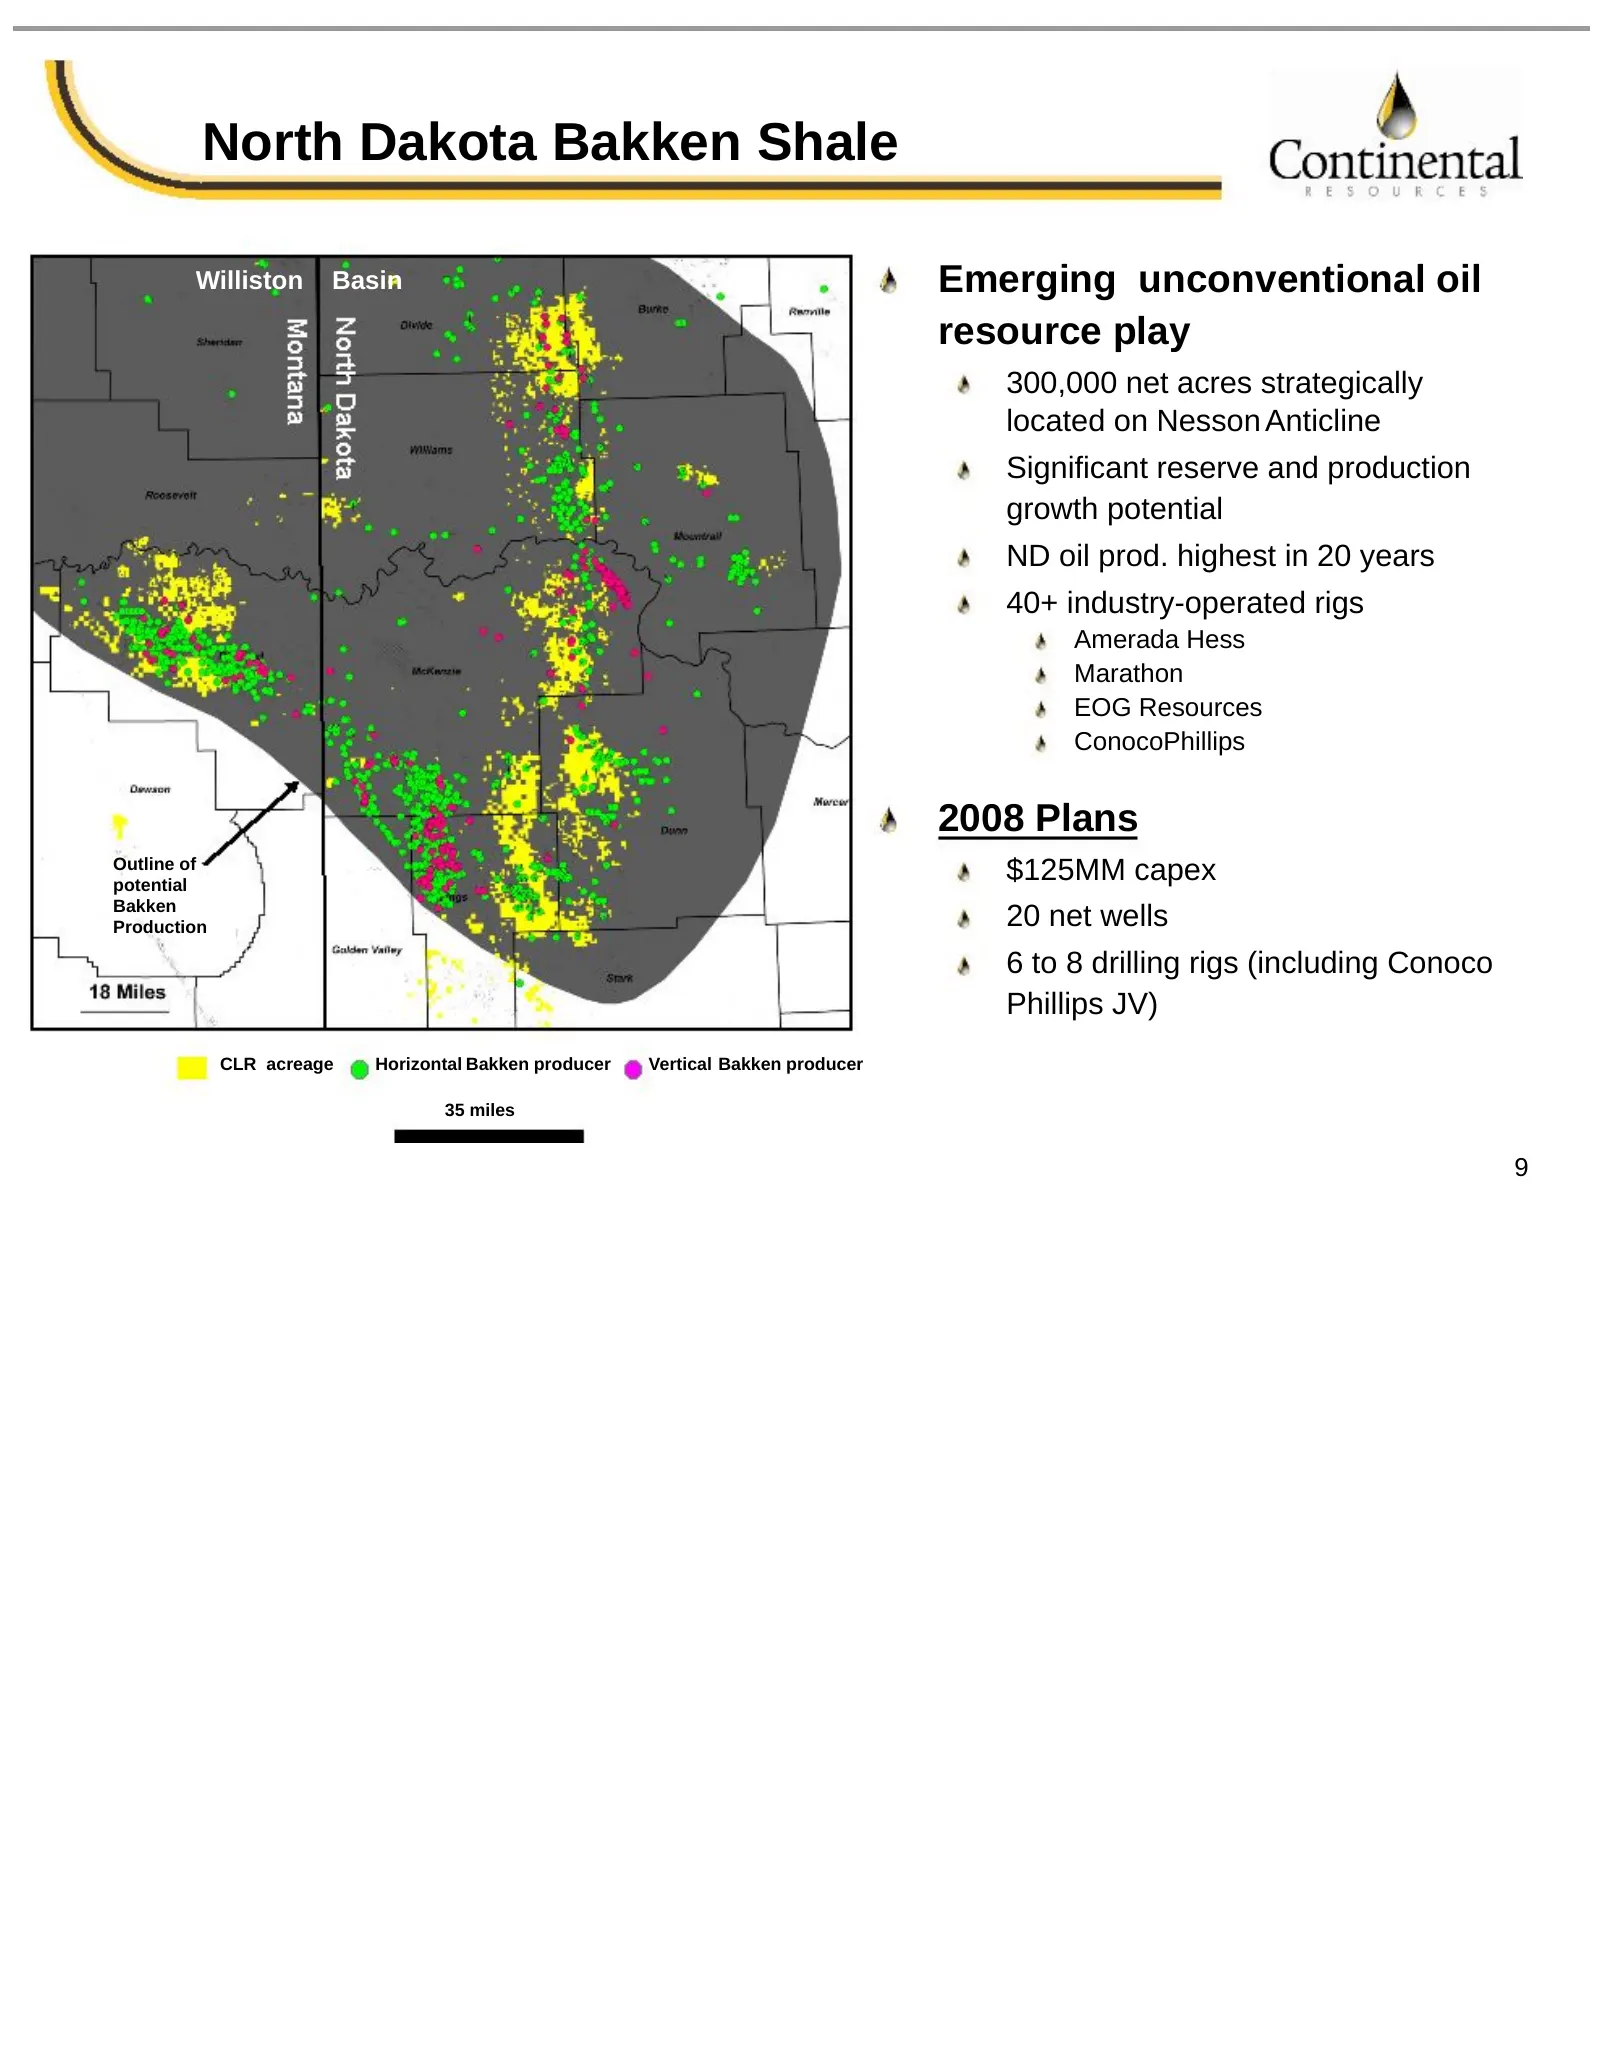
Slide 10: North Dakota Bakken Shale
North Dakota Bakken Shale Williston Basin Emerging unconventional oil resource play 300,000 net acres strategically located on Nesson Anticline Significant reserve and production growth potential ND oil prod. highest in 20 years 40+ industry-operated rigs Amerada Hess Marathon EOG Resources ConocoPh
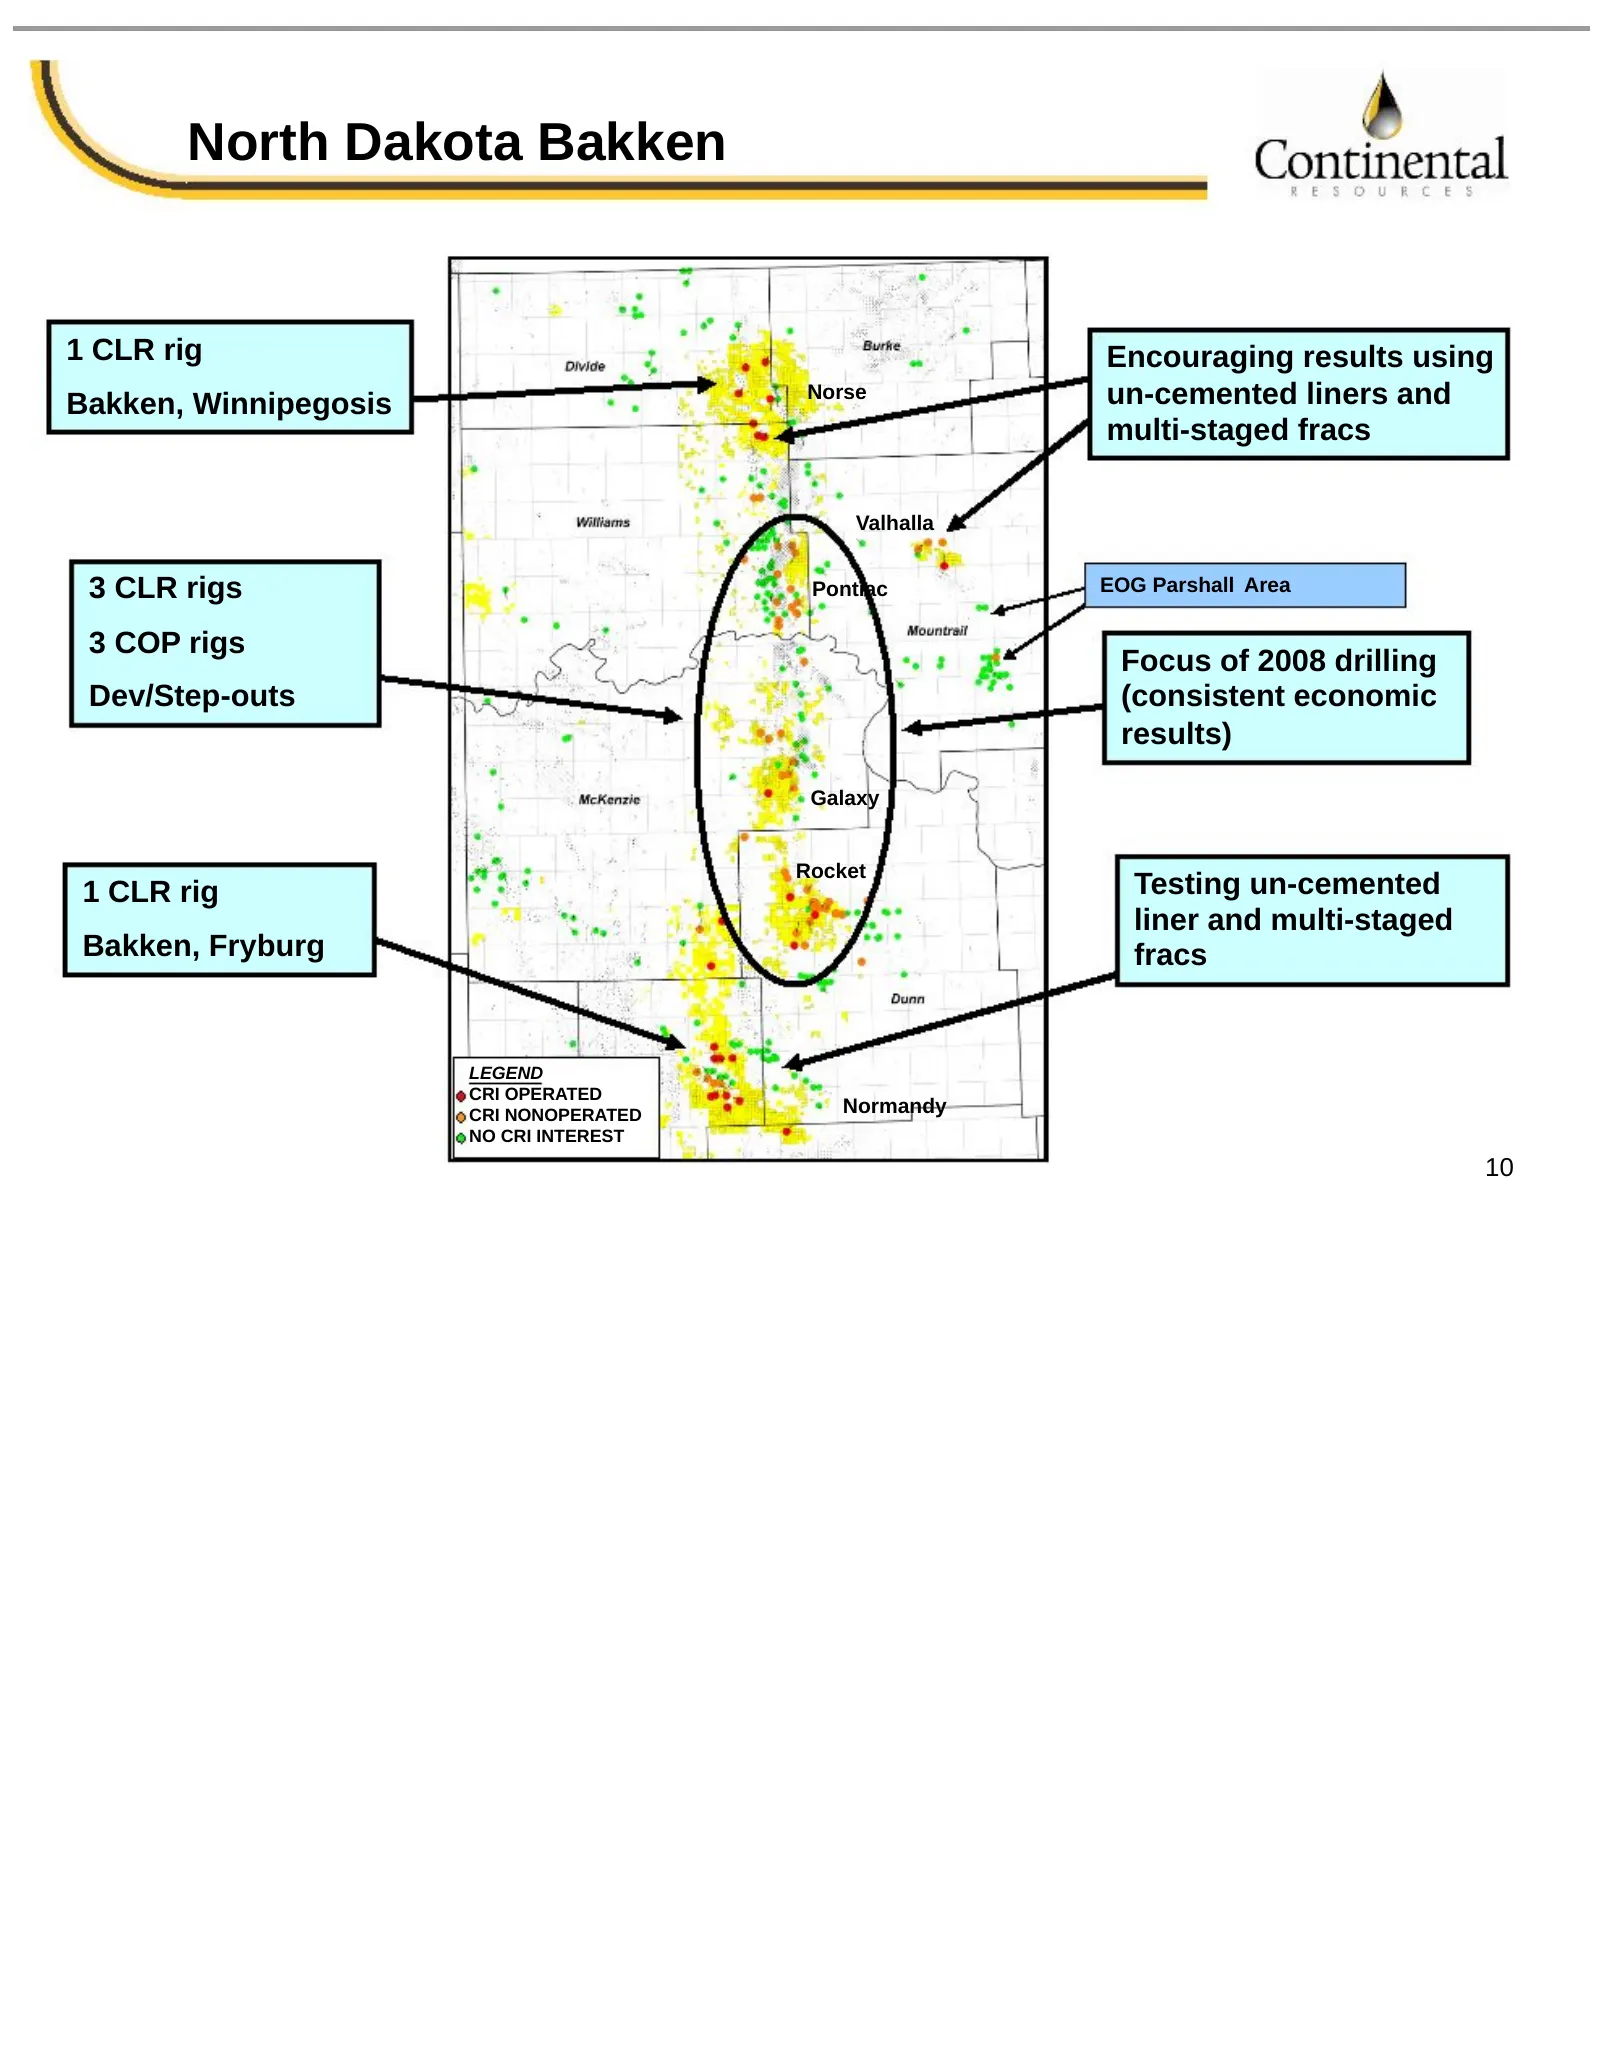
Slide 11: North Dakota Bakken
North Dakota Bakken 1 CLR rig Encouraging results using Bakken, Winnipegosis Norse un-cemented liners and multi-staged fracs Valhalla 3 CLR rigs Pontiac EOG Parshall Area 3 COP rigs Focus of 2008 drilling Dev/Step-outs (consistent economic results) Galaxy Rocket 1 CLR rig Testing un-cemented liner a
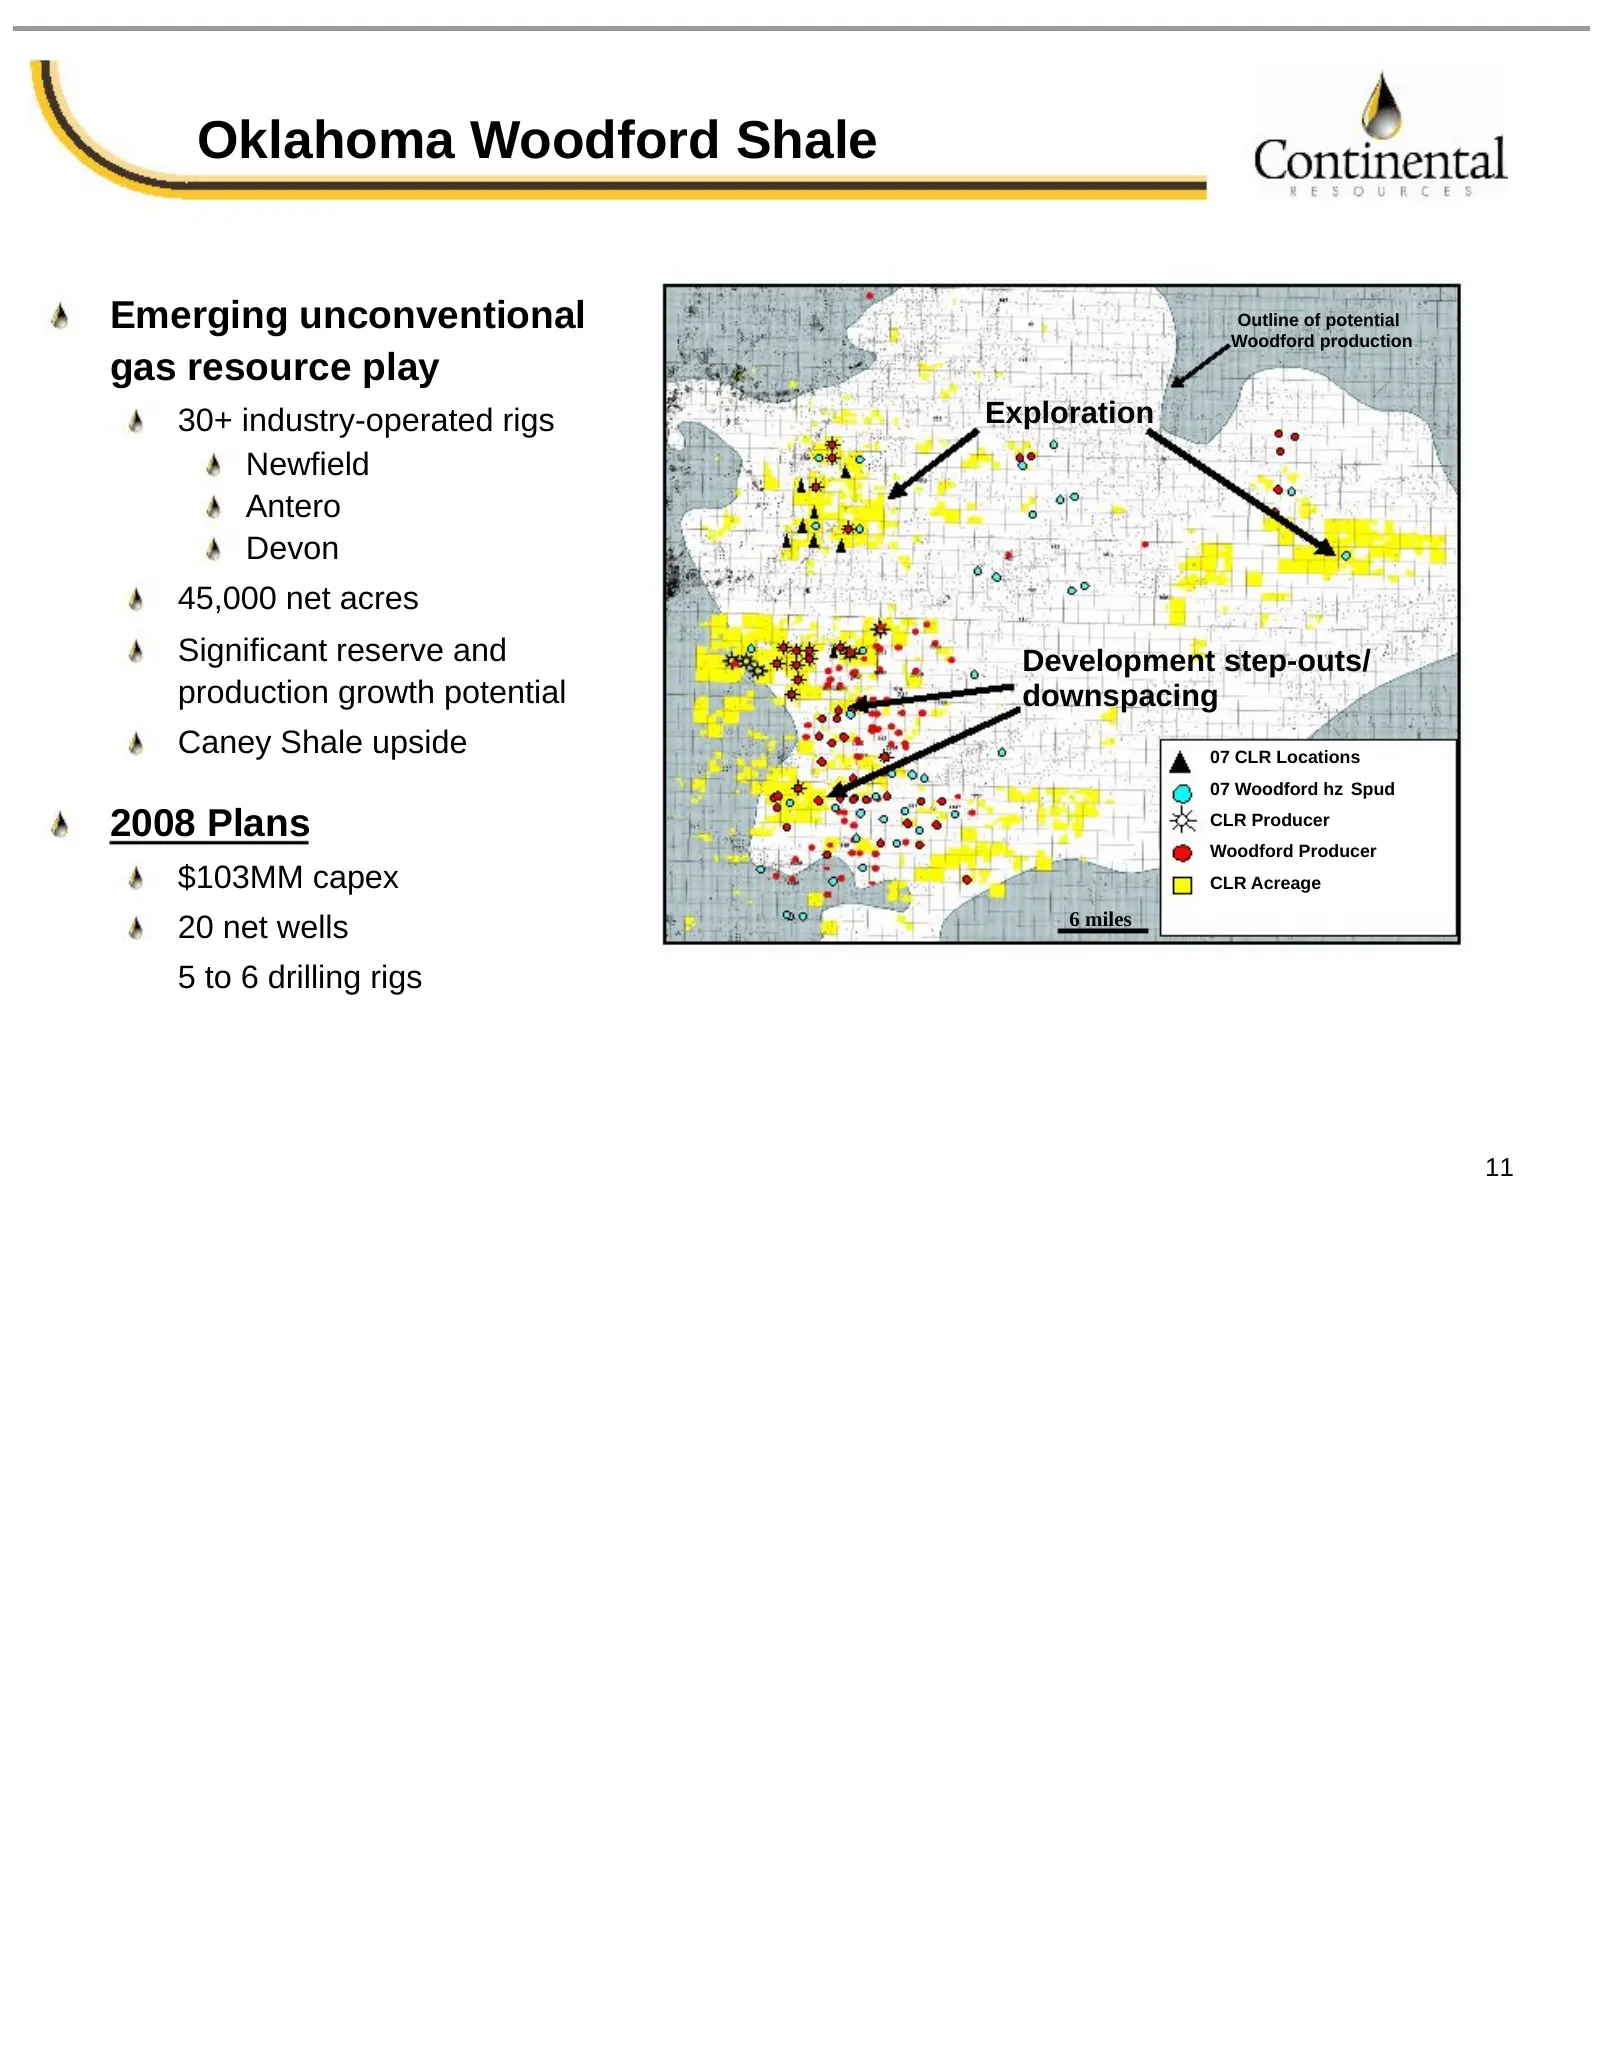
Slide 12: Oklahoma Woodford Shale
Oklahoma Woodford Shale Emerging unconventional Outline of potential Woodford production gas resource play 30+ industry-operated rigs Exploration Newfield Antero Devon 45,000 net acres Significant reserve and Development step-outs/ production growth potential downspacing Caney Shale upside 07 CLR Lo
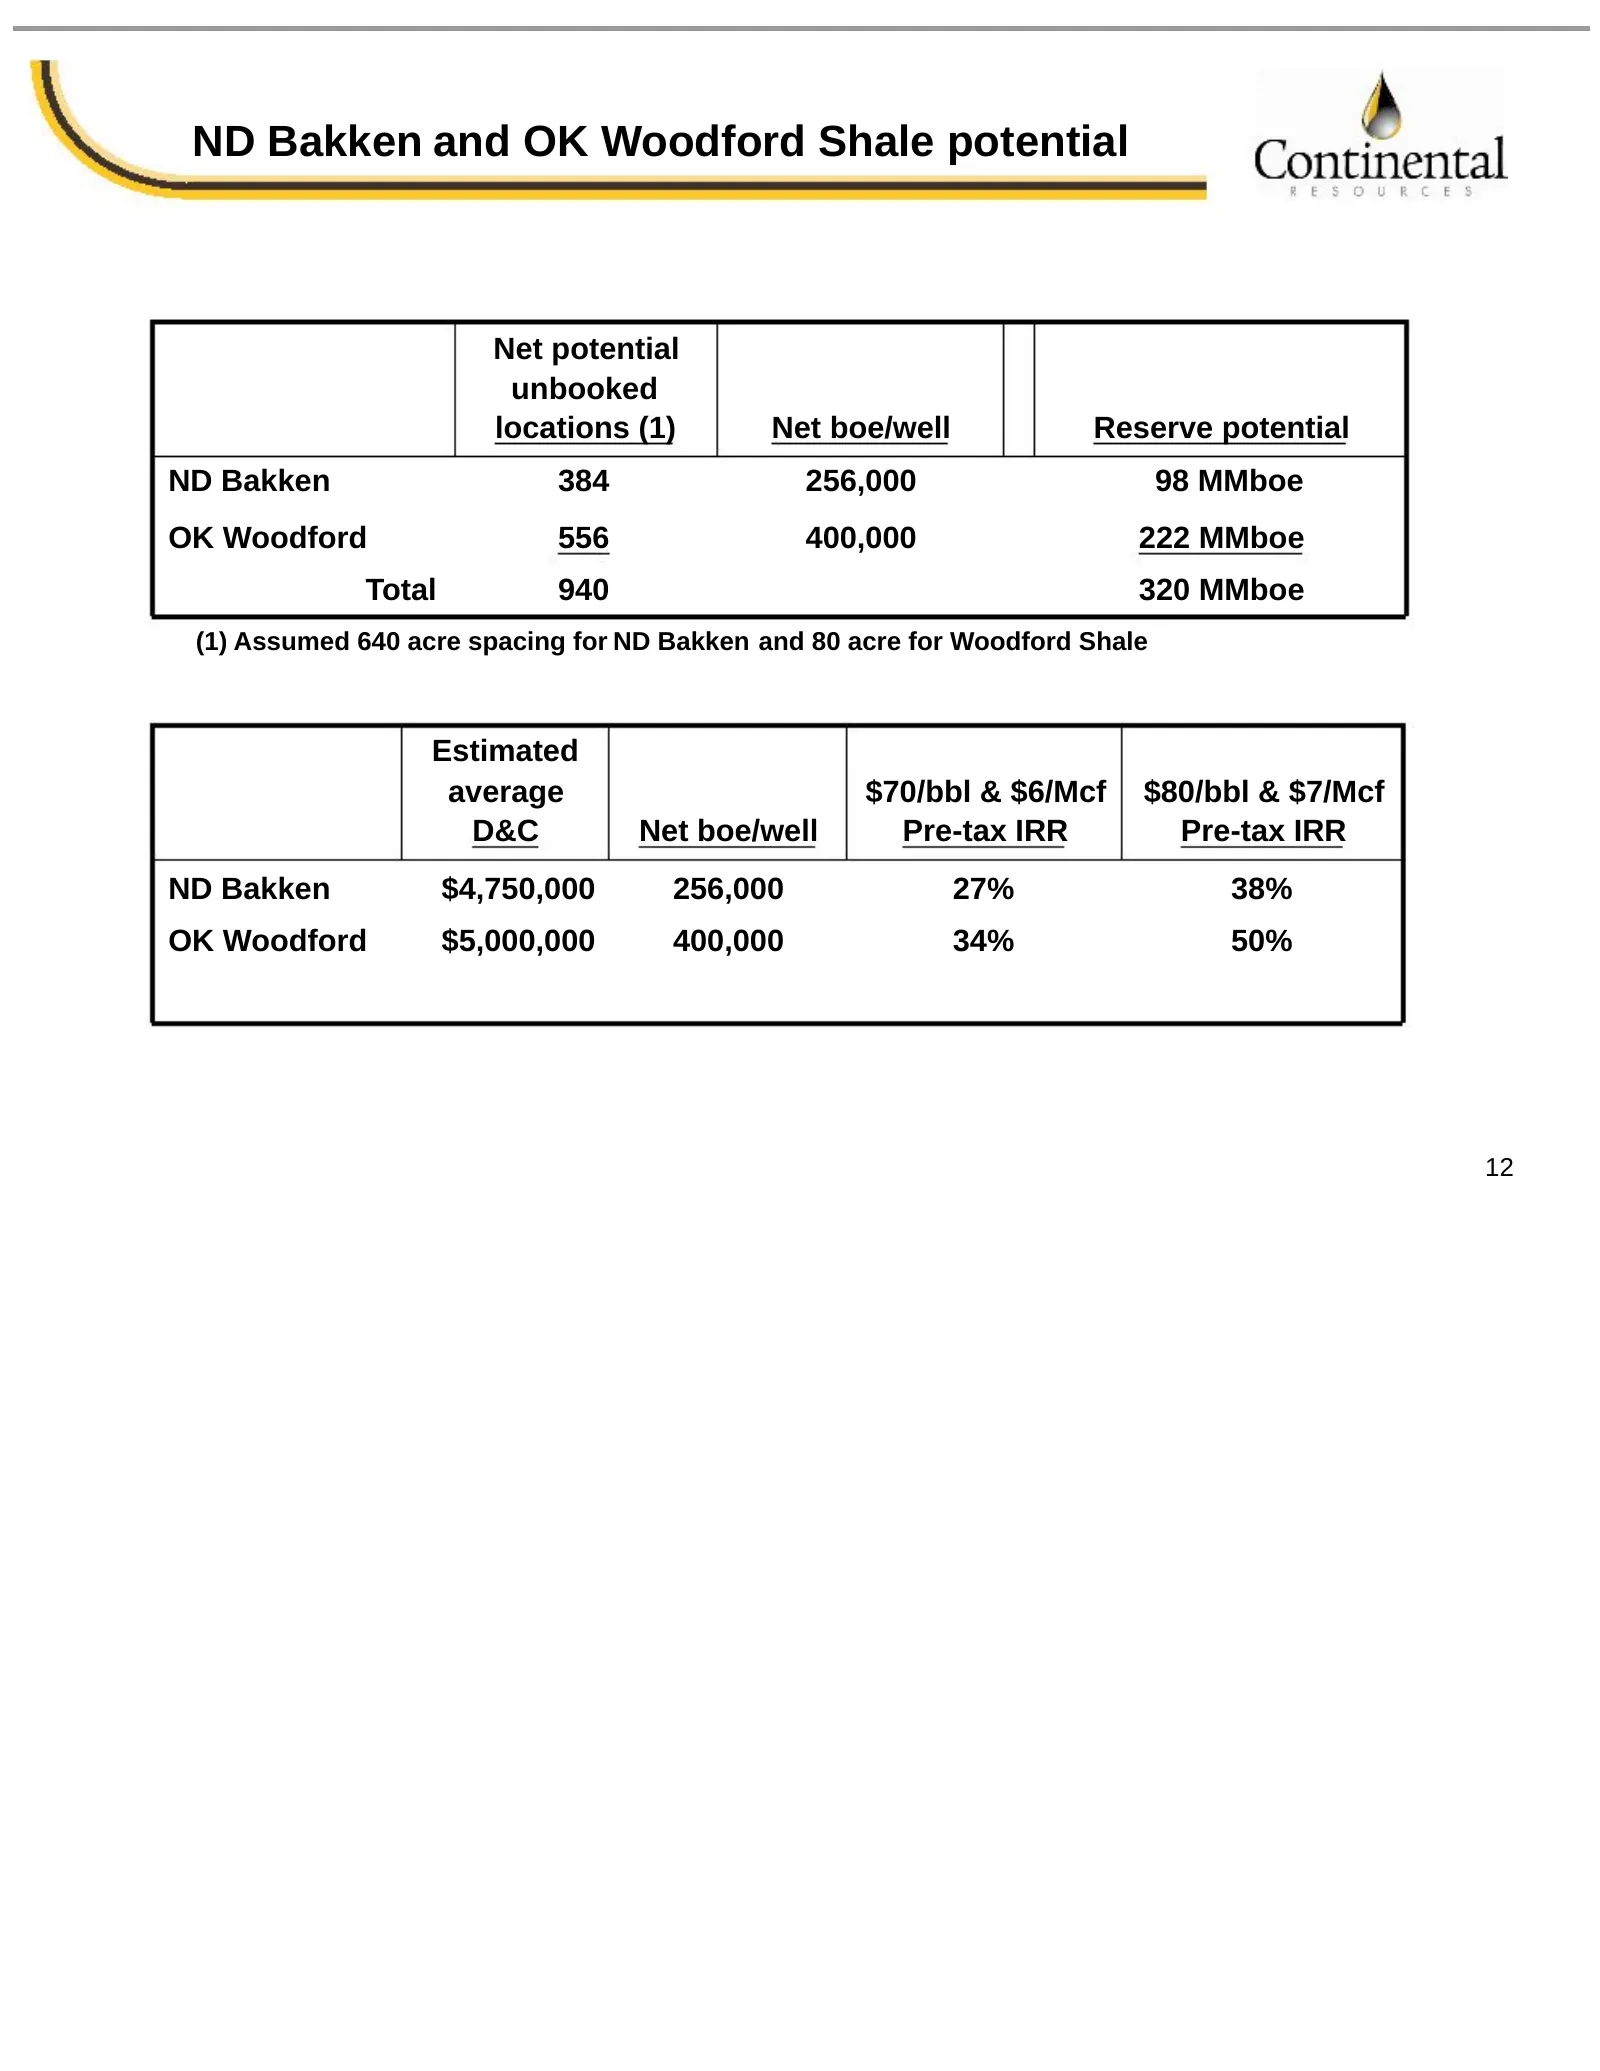
Slide 13: ND Bakken and OK Woodford Shale potential
ND Bakken and OK Woodford Shale potential Net potential unbooked locations (1) Net boe/well Reserve potential ND Bakken 384 256,000 98 MMboe OK Woodford 556 400,000 222 MMboe Total 940 320 MMboe (1) Assumed 640 acre spacing for ND Bakken and 80 acre for Woodford Shale Estimated average $70/bbl & $6/
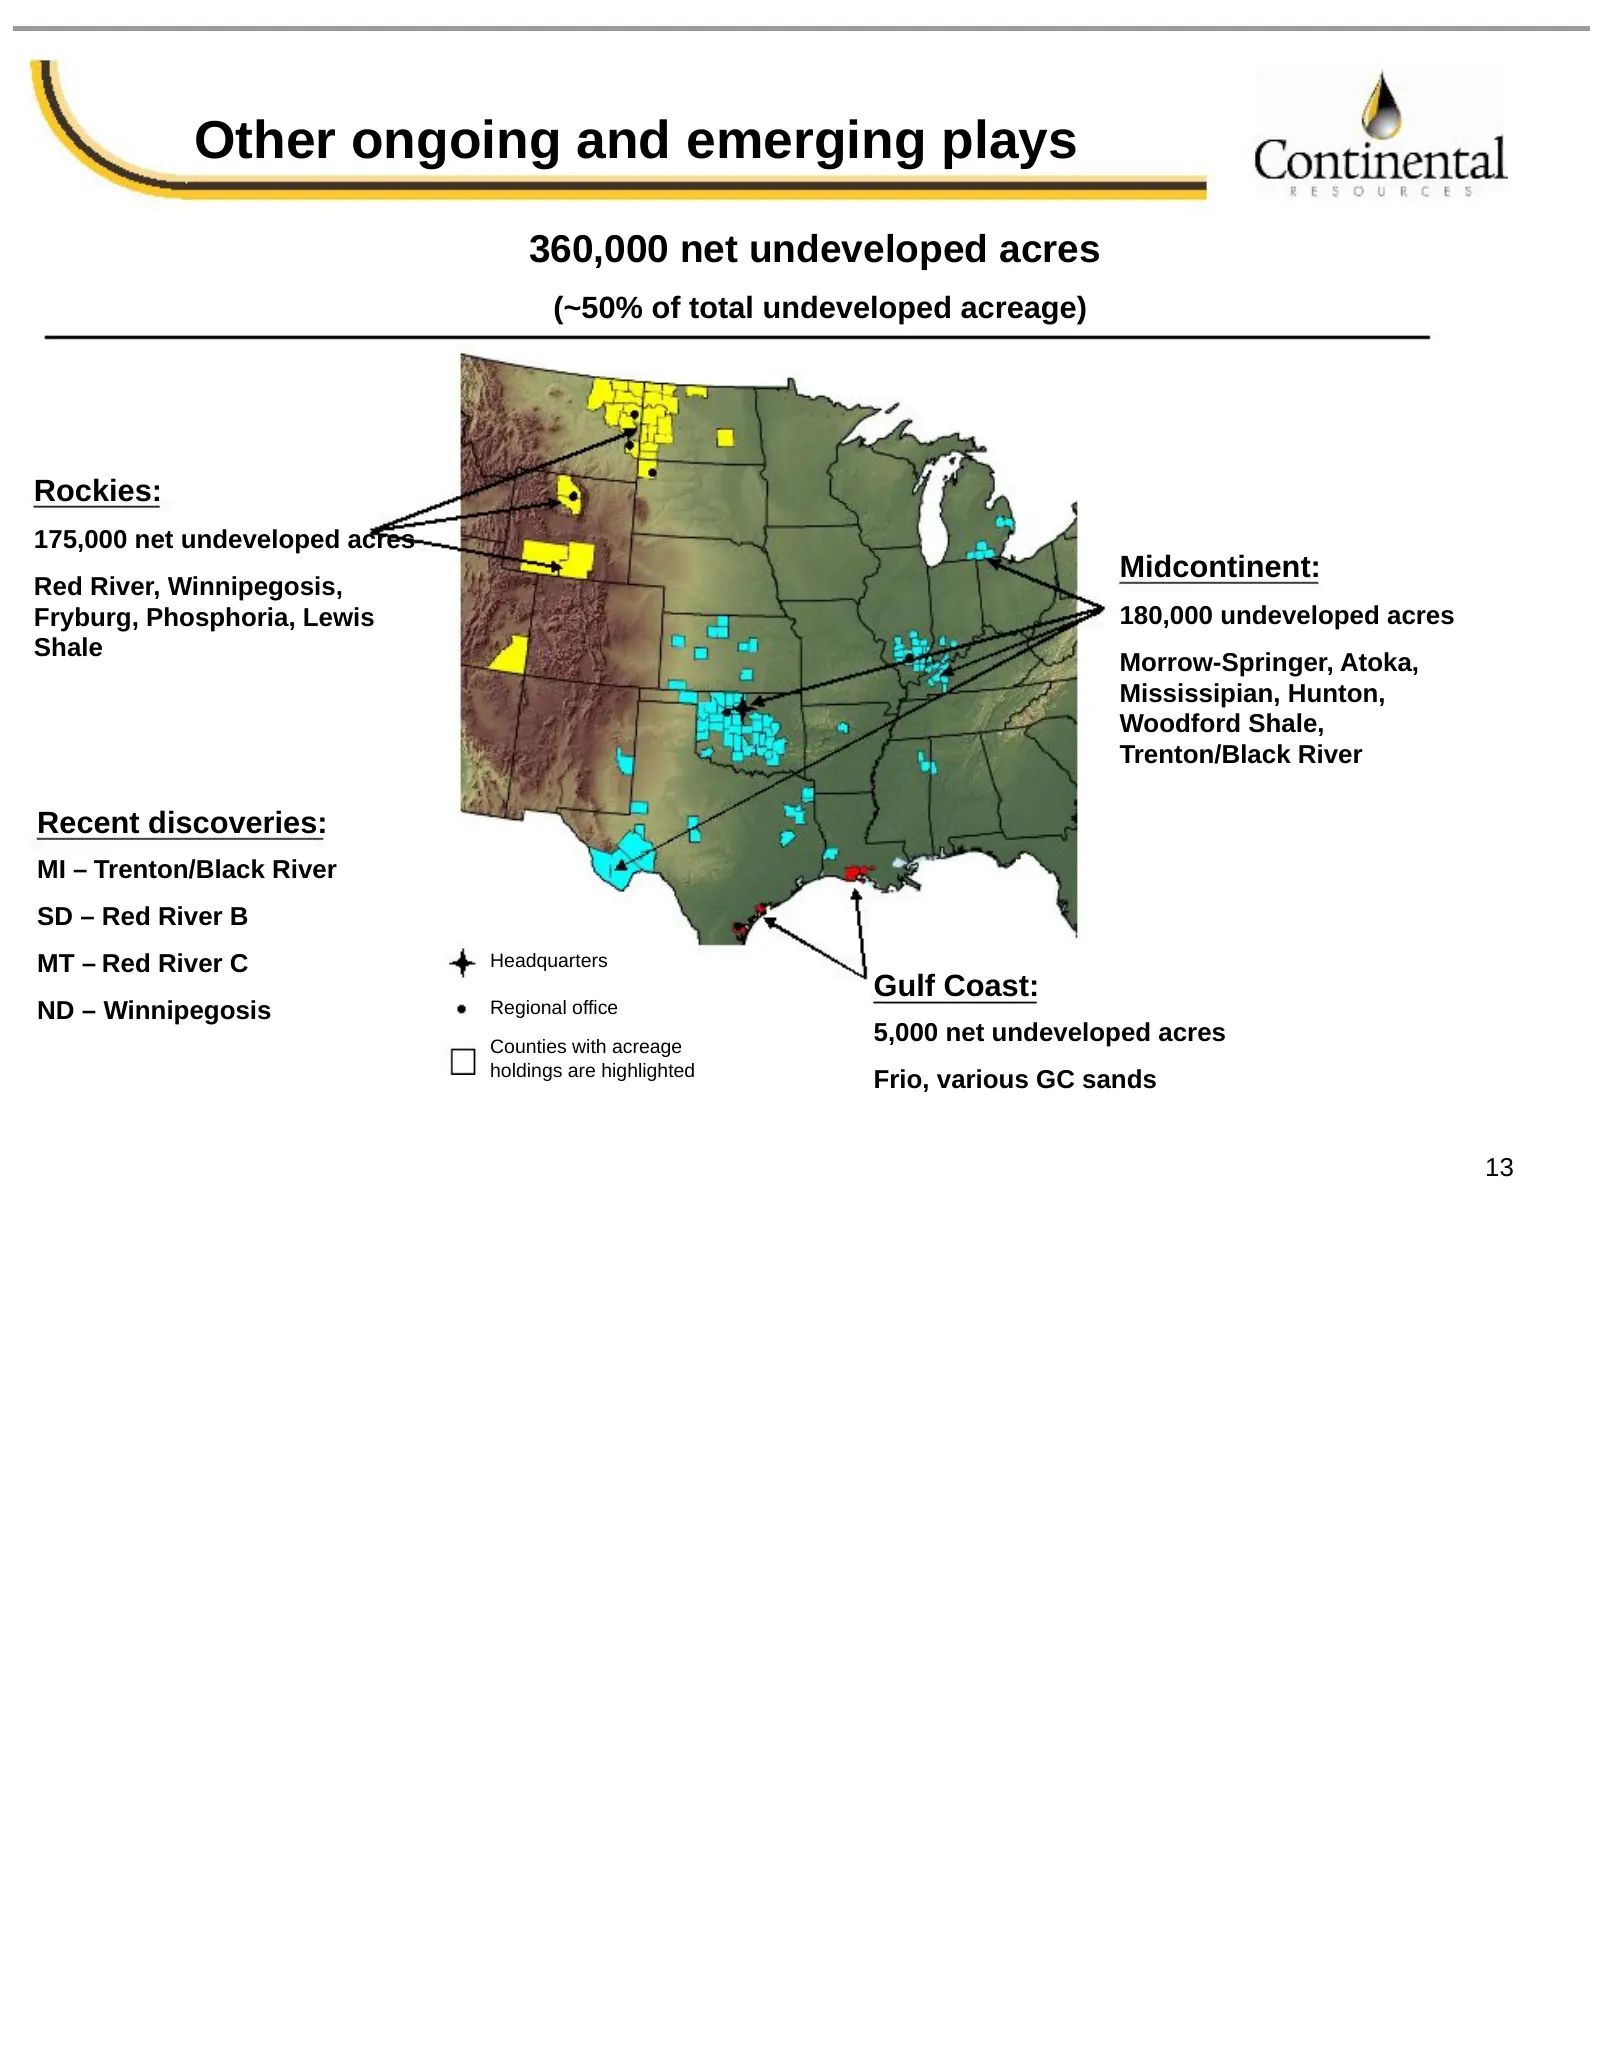
Slide 14: Other ongoing and emerging plays
Other ongoing and emerging plays 360,000 net undeveloped acres (~50% of total undeveloped acreage) Rockies: 175,000 net undeveloped acres Midcontinent: Red River, Winnipegosis, Fryburg, Phosphoria, Lewis 180,000 undeveloped acres Shale Morrow-Springer, Atoka, Mississipian, Hunton, Woodford Shale, Tr
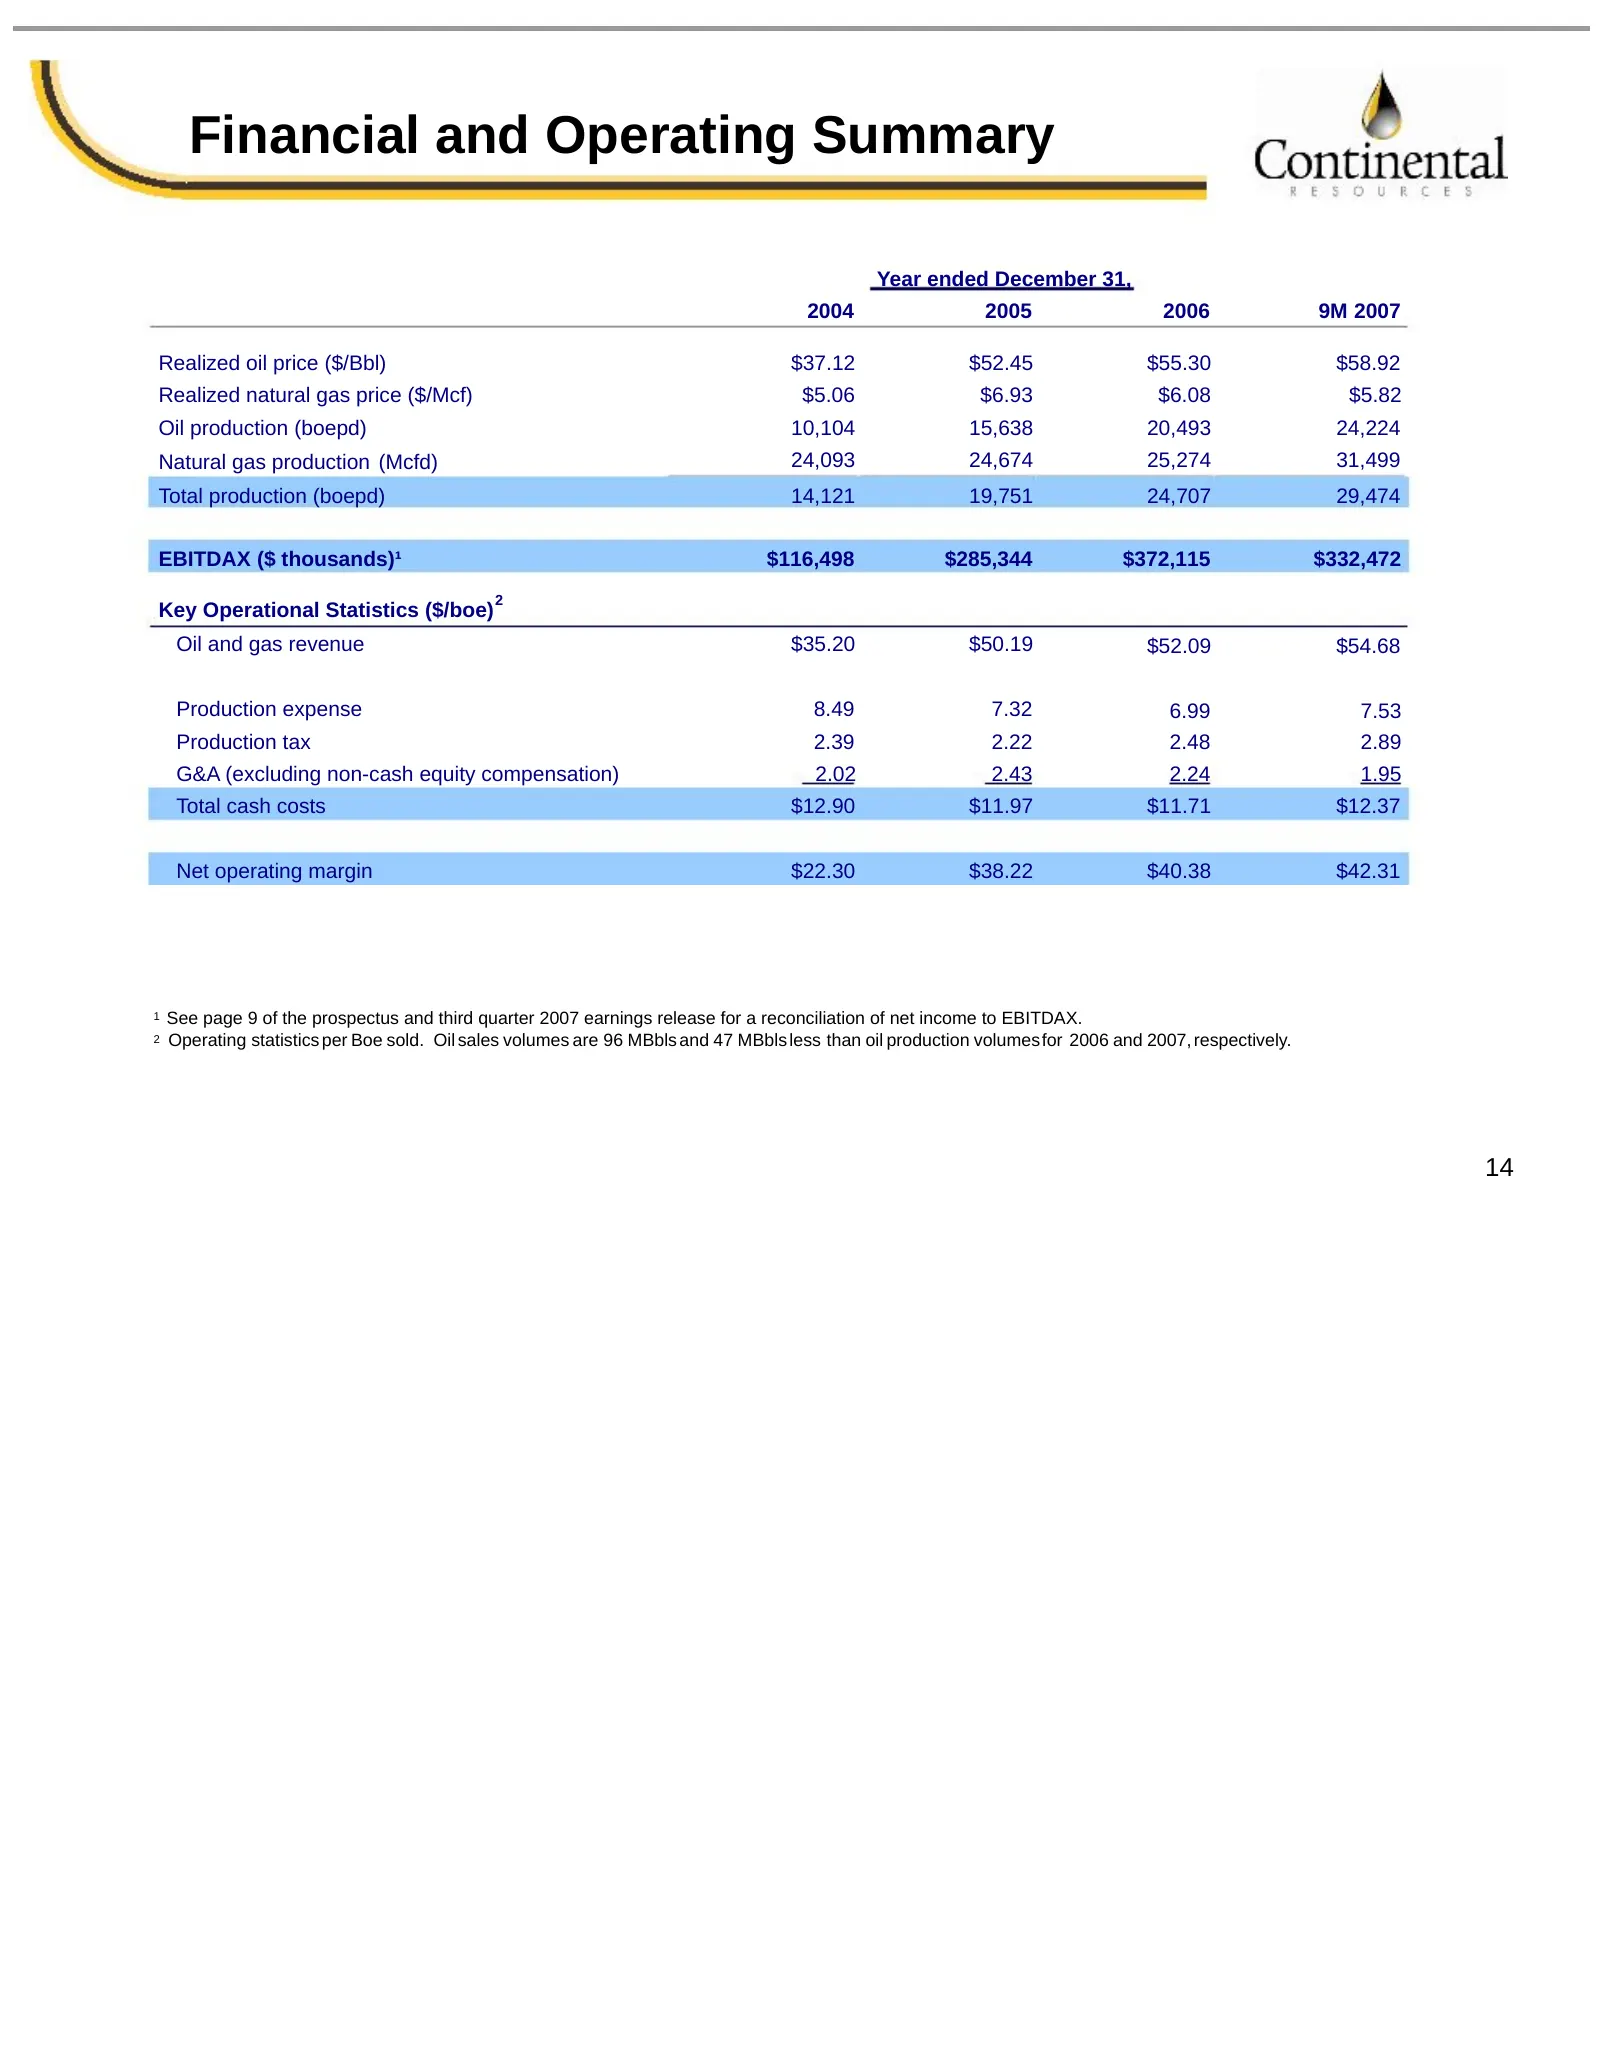
Slide 15: Financial and Operating Summary
Financial and Operating Summary Year ended December 31, 2004 2005 2006 9M 2007 Realized oil price ($/Bbl) $37.12 $52.45 $55.30 $58.92 Realized natural gas price ($/Mcf) $5.06 $6.93 $6.08 $5.82 Oil production (boepd) 10,104 15,638 20,493 24,224 Natural gas production (Mcfd) 24,093 24,674 25,274 31,49
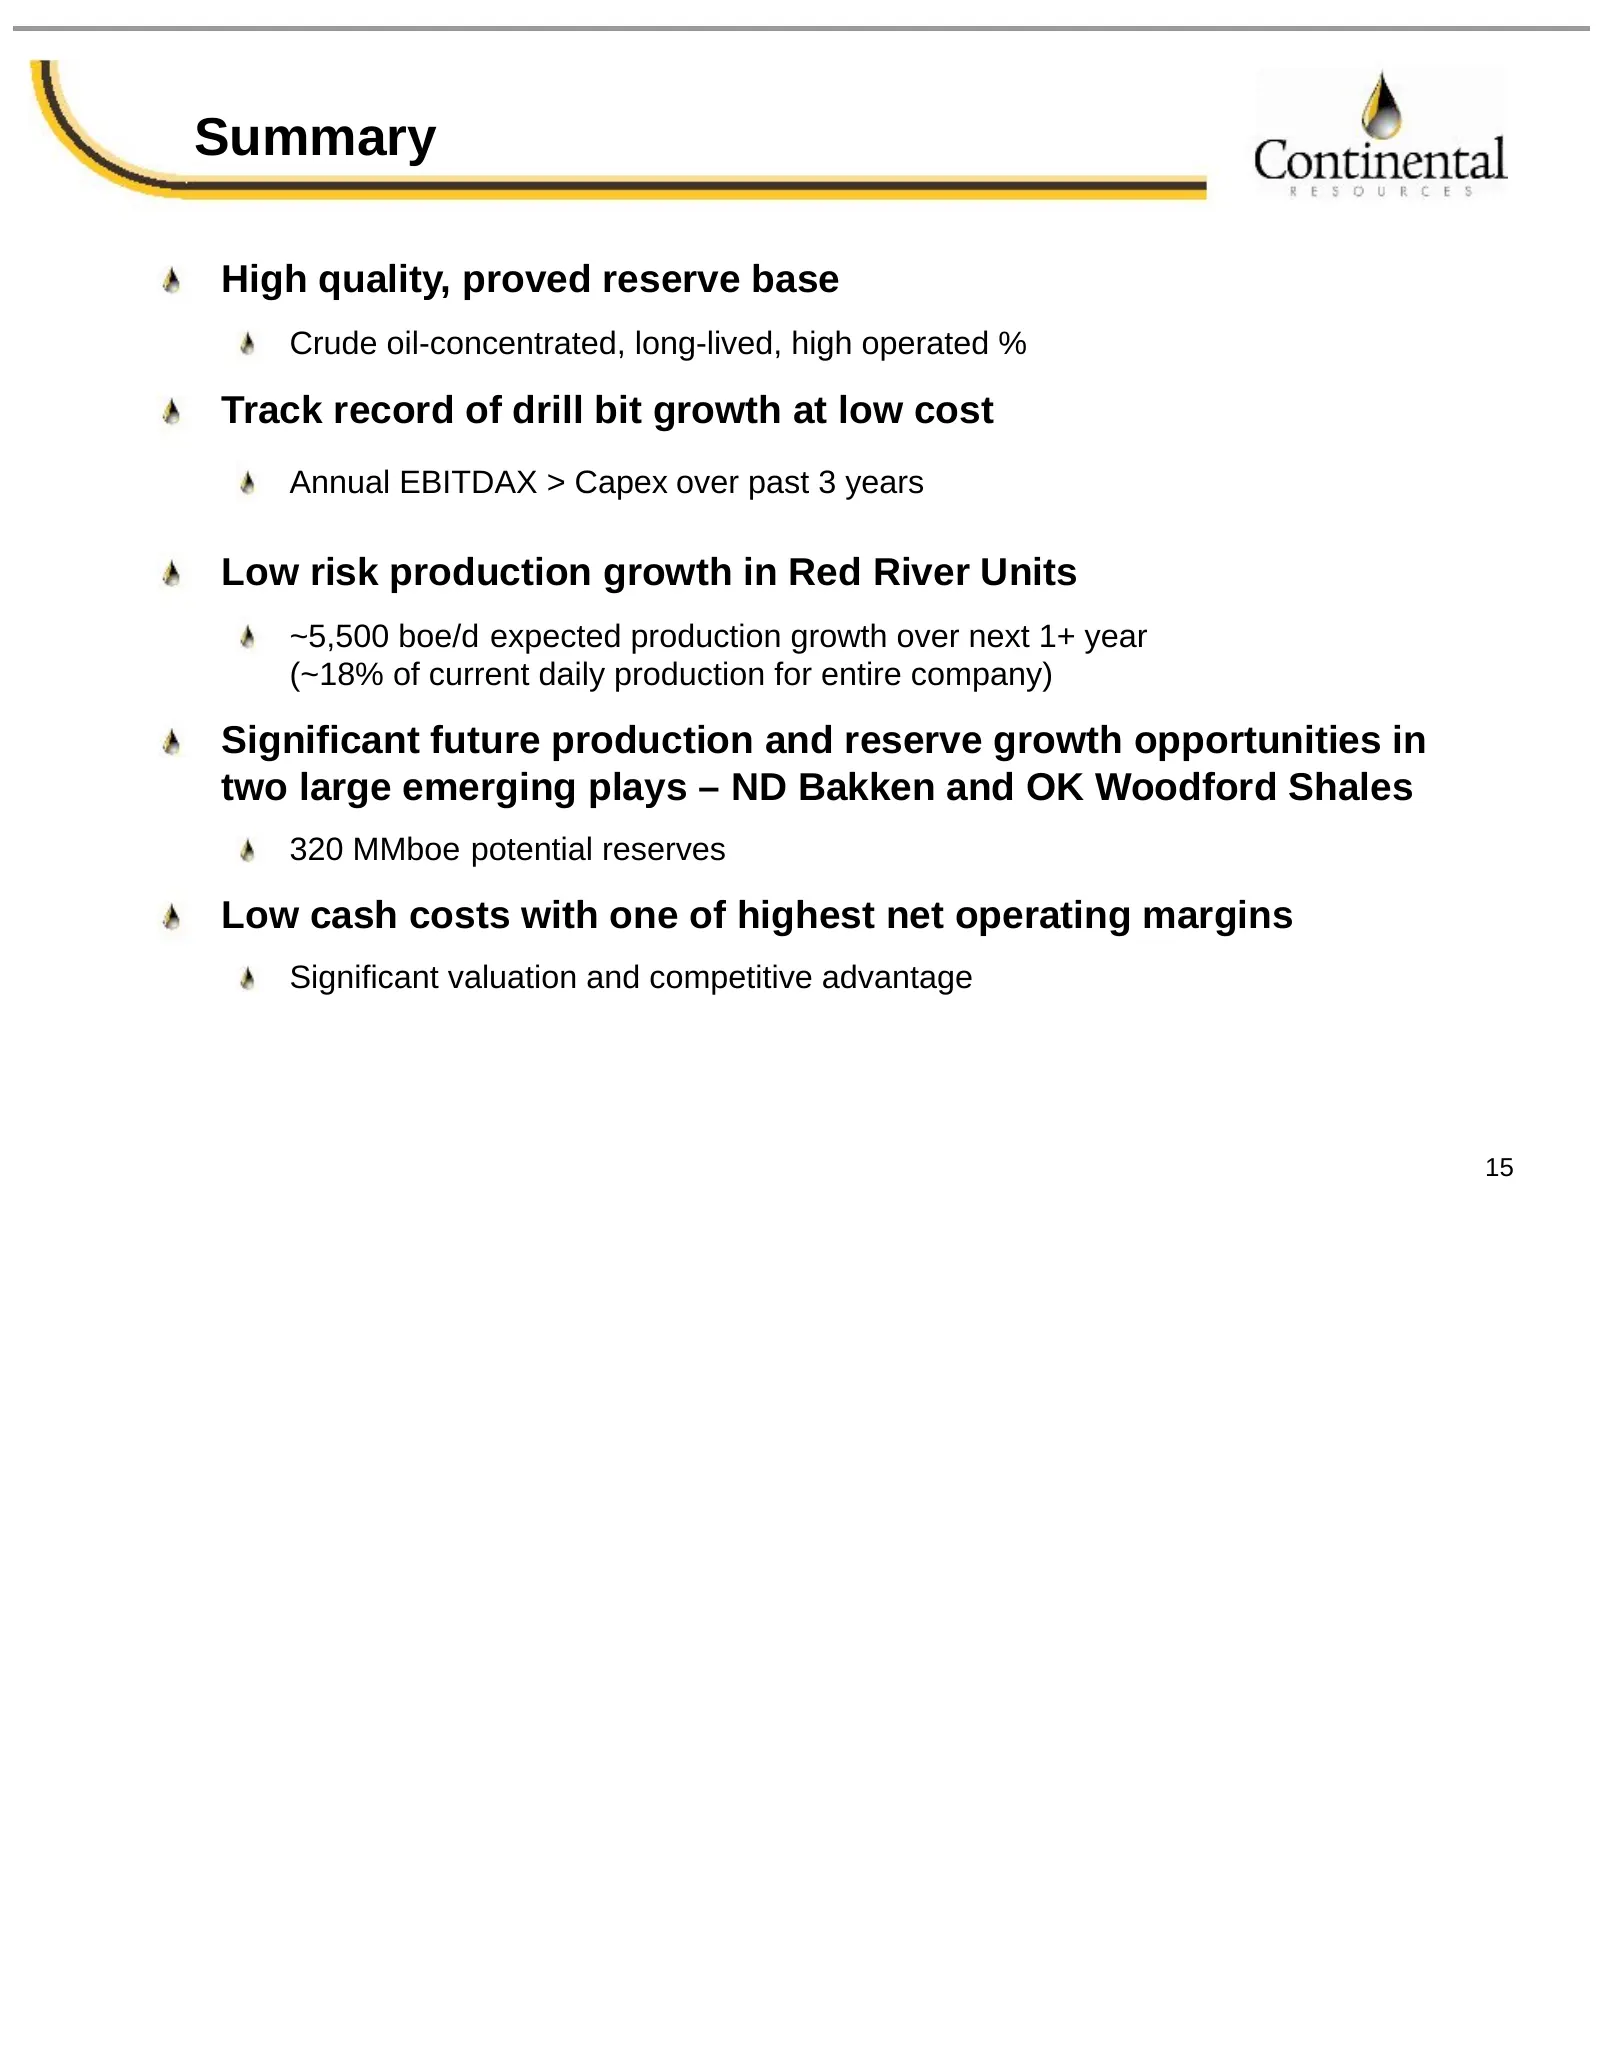
Slide 16: Summary
Summary High quality, proved reserve base Crude oil-concentrated, long-lived, high operated % Track record of drill bit growth at low cost Annual EBITDAX > Capex over past 3 years Low risk production growth in Red River Units ~5,500 boe/d expected production growth over next 1+ year (~18% of current
Source: SEC EDGAR · 8-K filed Feb 12, 2008
More decks from Continental Resources Inc
 Investor Day (October 2010)17 slides · Oct 12, 2010
 Investor Day (October 2010)14 slides · Oct 12, 2010
 Investor Day (October 2010)35 slides · Oct 12, 2010
 Investor Day (October 2010)16 slides · Oct 12, 2010
 Investor Day (October 2010)10 slides · Oct 12, 2010
 ENERCOM Energy Conference 201026 slides · Aug 24, 2010