Croda International PLC · LSE:CRDA
Croda International — Q3 2014 Earnings Presentation
18 slides from Croda International's earnings presentation, November 2014
Slide 1: Croda International Plc Q3 IMS November 2014
Croda International Plc Q3 IMS November 2014
Slide 2: Underlying progress accelerates in Q3
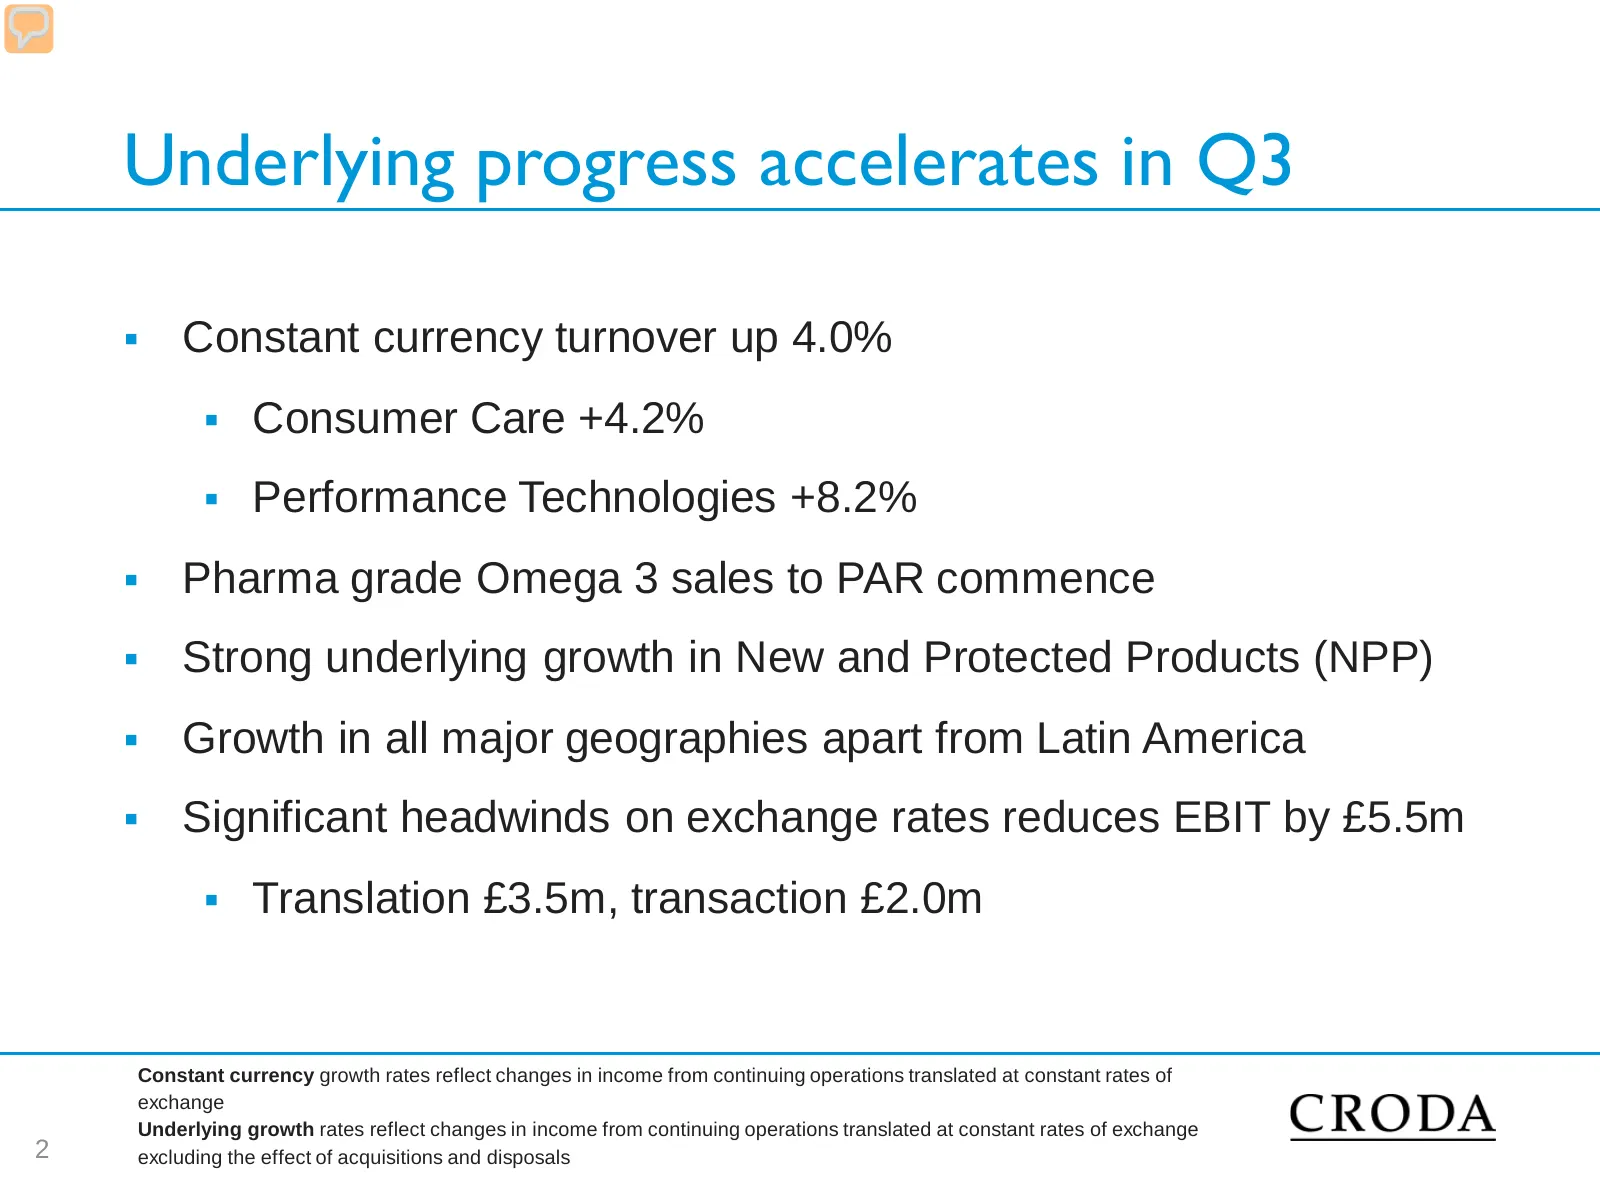
Underlying progress accelerates in Q3 Constant currency turnover up 4.0% Consumer Care +4.2% Performance Technologies +8.2% Pharma grade Omega 3 sales to PAR commence Strong underlying growth in New and Protected Products (NPP) Growth in all major geographies apart from Latin America S
Slide 3: Strategic Priorities
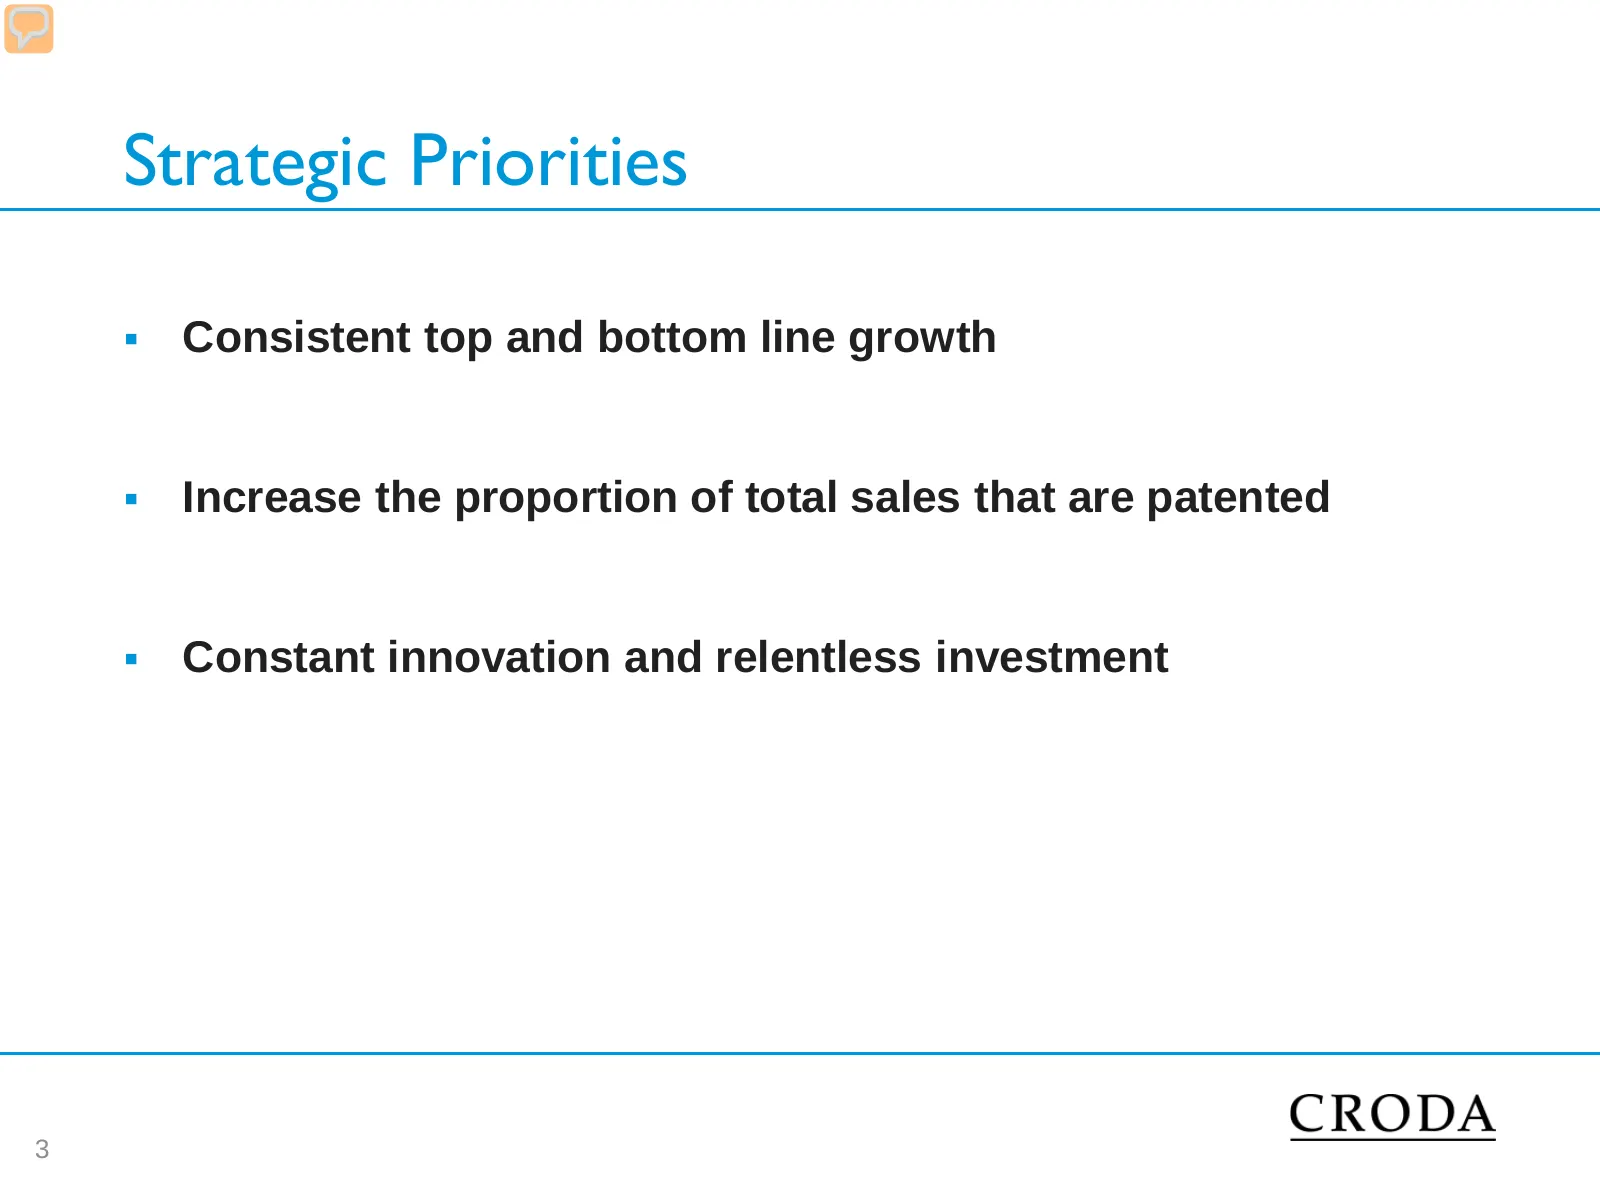
Strategic Priorities Consistent top and bottom line growth Increase the proportion of total sales that are patented Constant innovation and relentless investment 3
Slide 4: Consistent top and bottom line growth
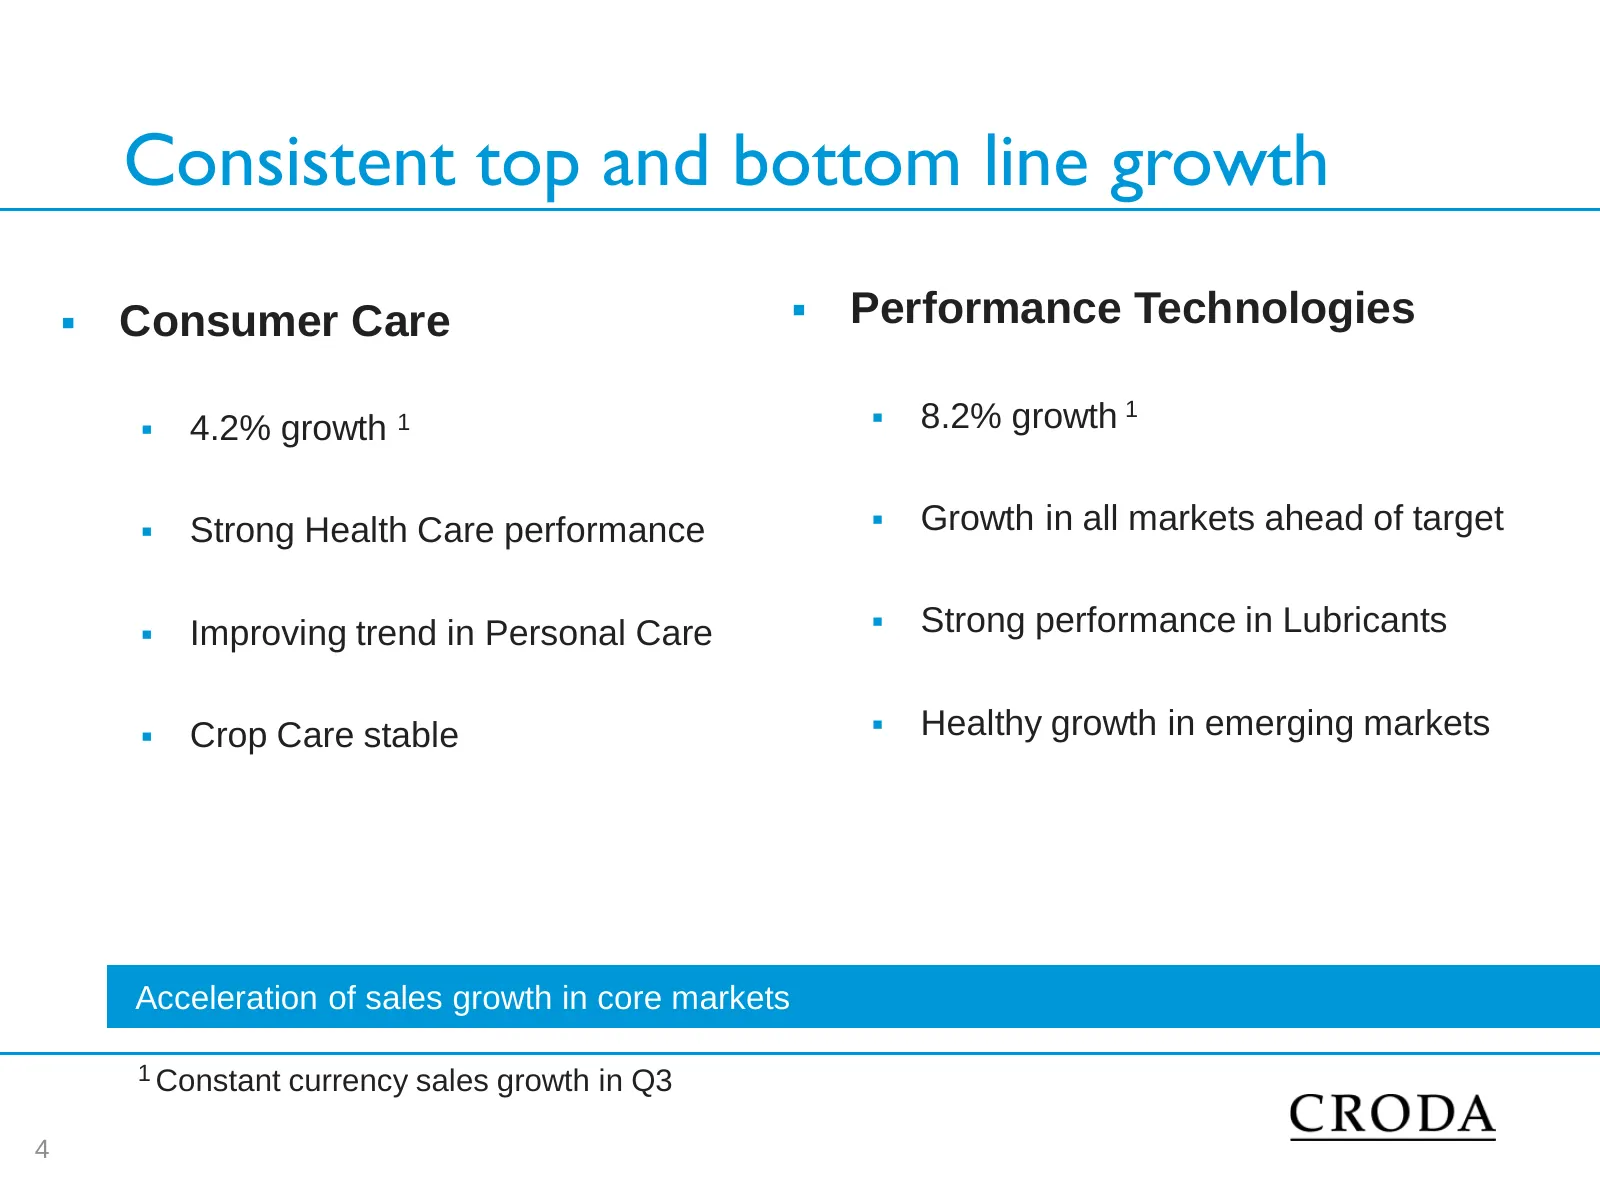
Consistent top and bottom line growth Consumer Care Performance Technologies 4.2% growth 1 8.2% growth 1 Strong Health Care performance Growth in all markets ahead of target Improving trend in Personal Care Strong performance in Lubricants Crop Care stable Healthy growth in emerg
Slide 5: Increasing the proportion of sales that are patented
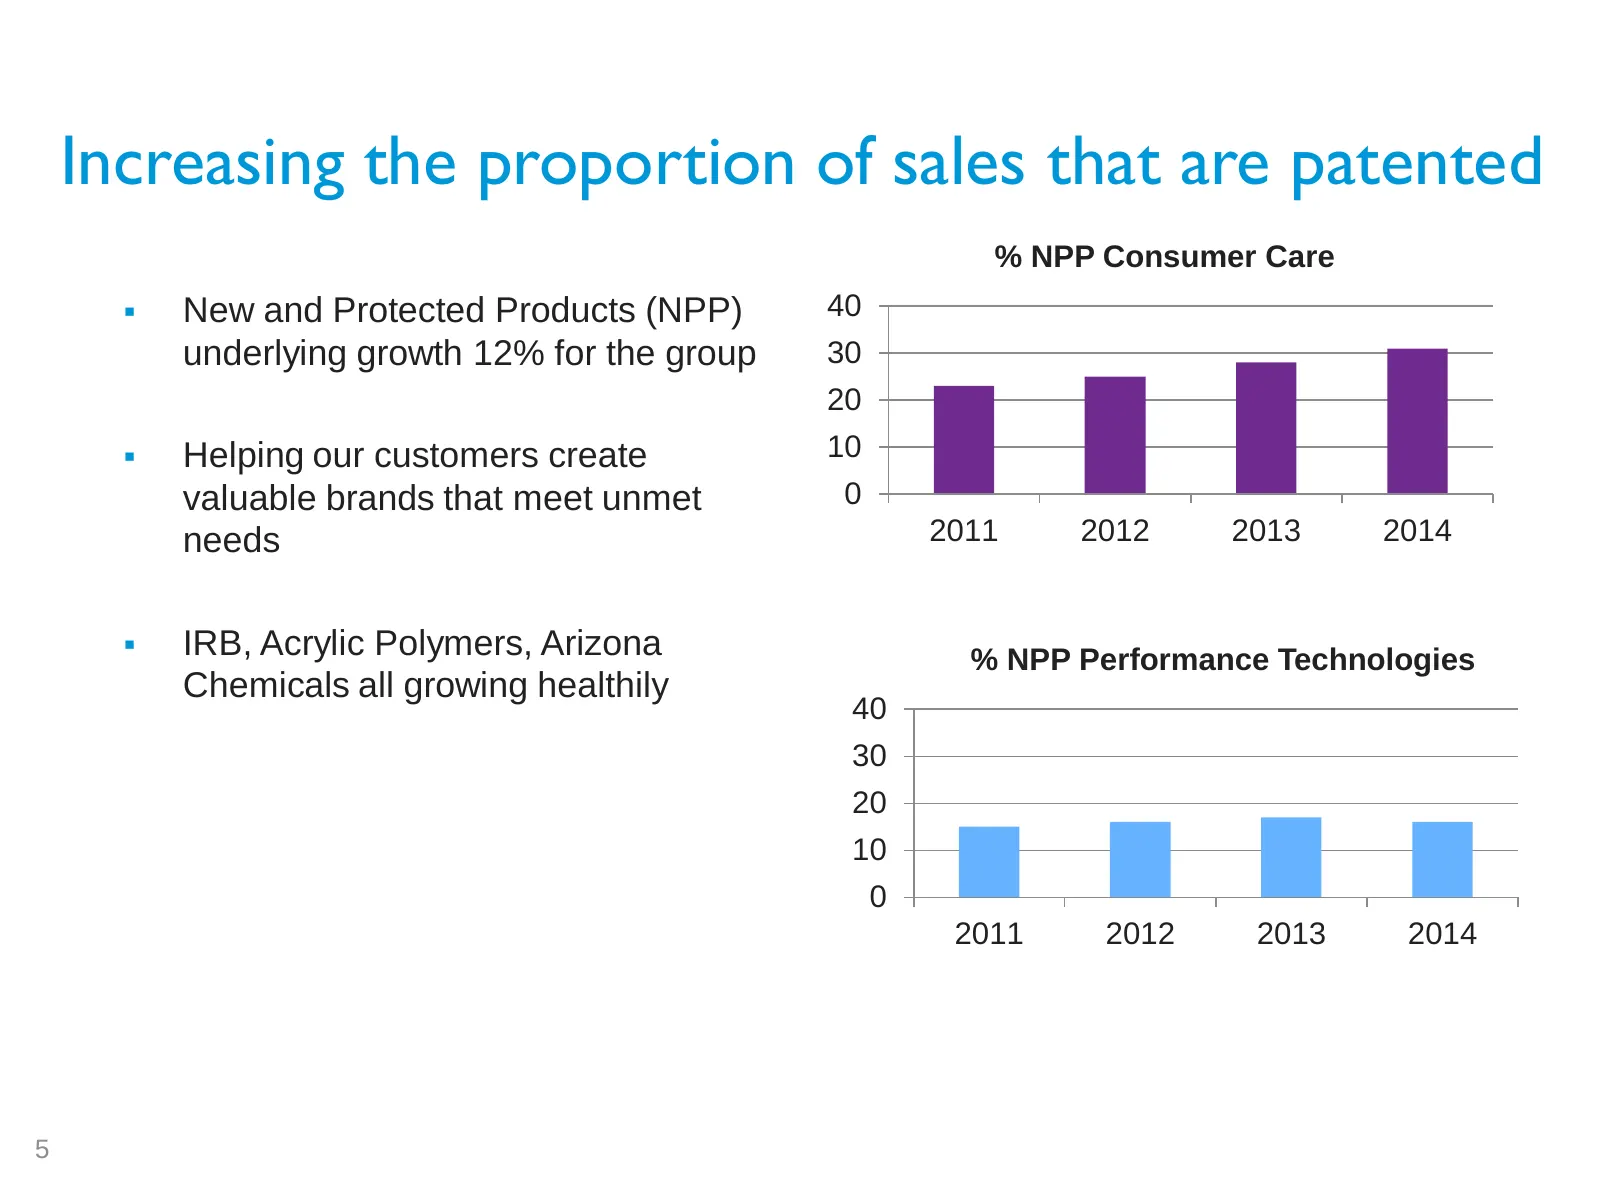
Increasing the proportion of sales that are patented % NPP Consumer Care New and Protected Products (NPP) 40 underlying growth 12% for the group 30 20 Helping our customers create 10 valuable brands that meet unmet 0 needs 2011 2012 2013 2014 IRB, Acrylic Polymers, Arizona % NPP Performance Te
Slide 6: Constant innovation and relentless investment
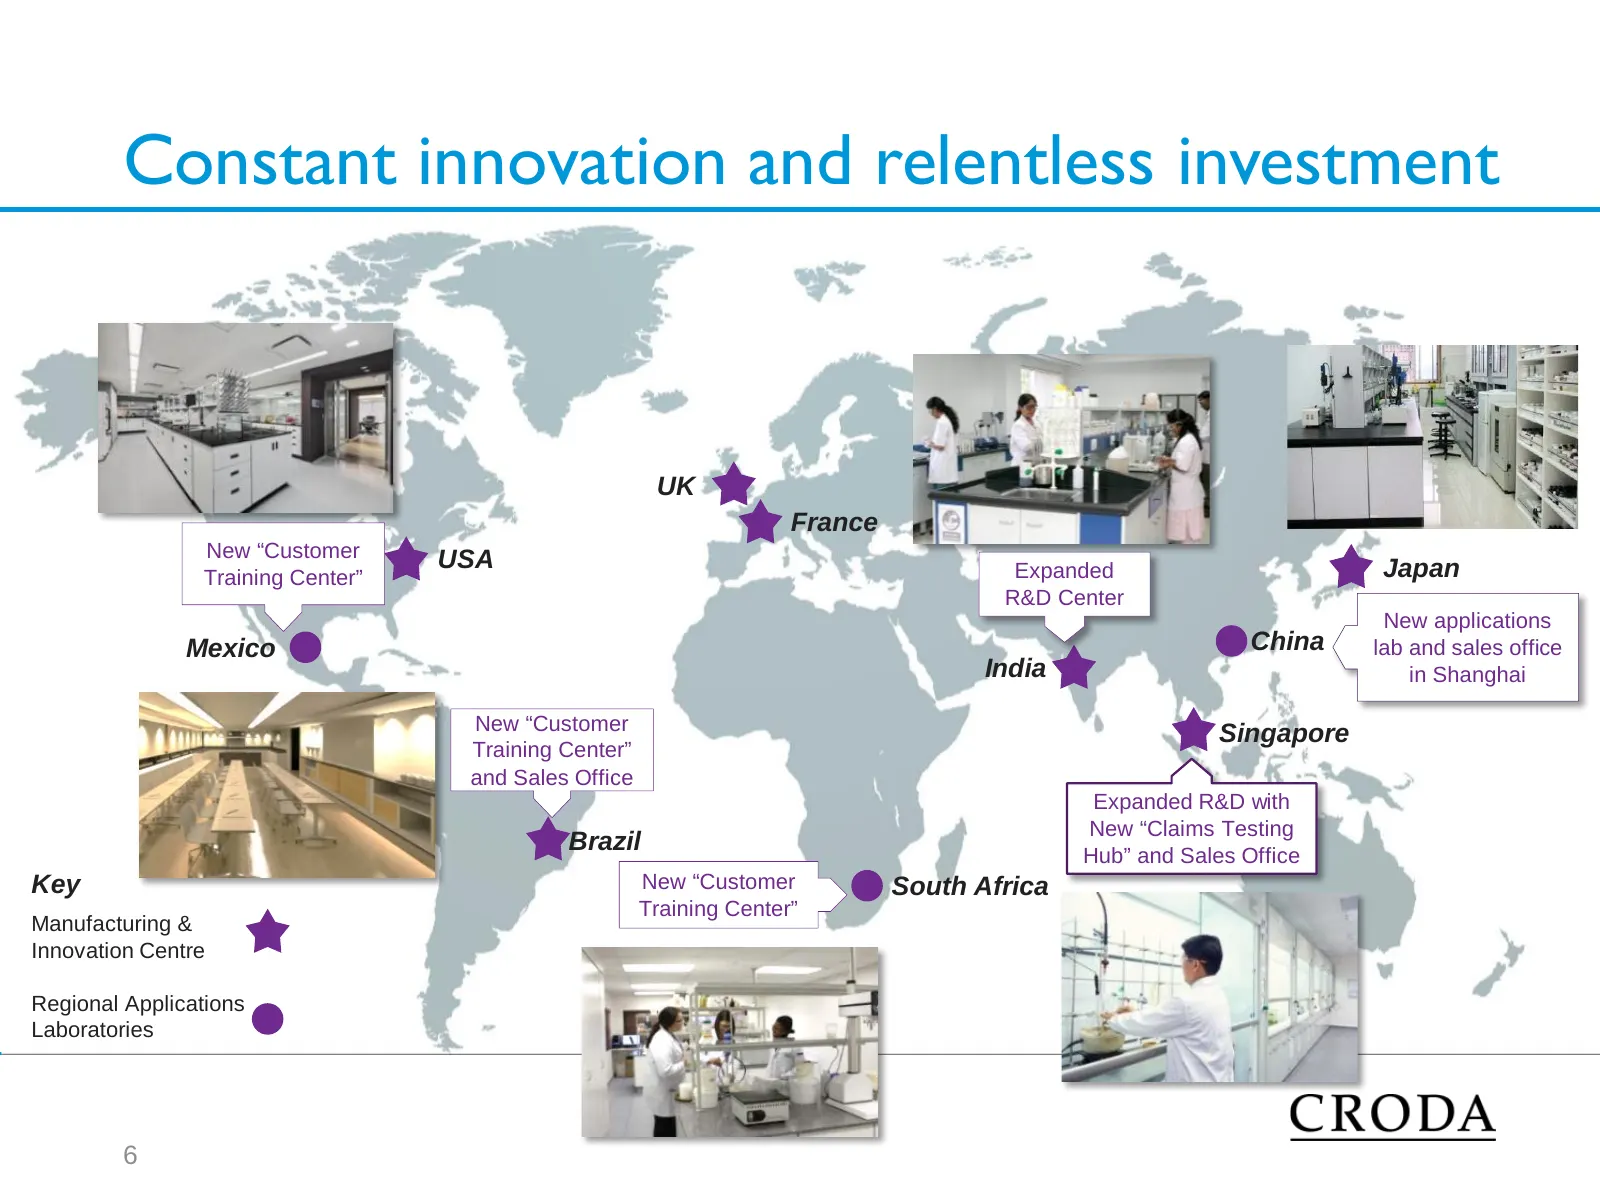
Constant innovation and relentless investment UK France New “Customer USA Training Center” Expanded Japan R&D Center New applications Mexico China lab and sales office India in Shanghai New “Customer Singapore Training Center” and Sales Office Expanded R&D with New “Claims Testing Brazil Hub” and Sa
Slide 7: Investing in new technology – Pharma active ingredient
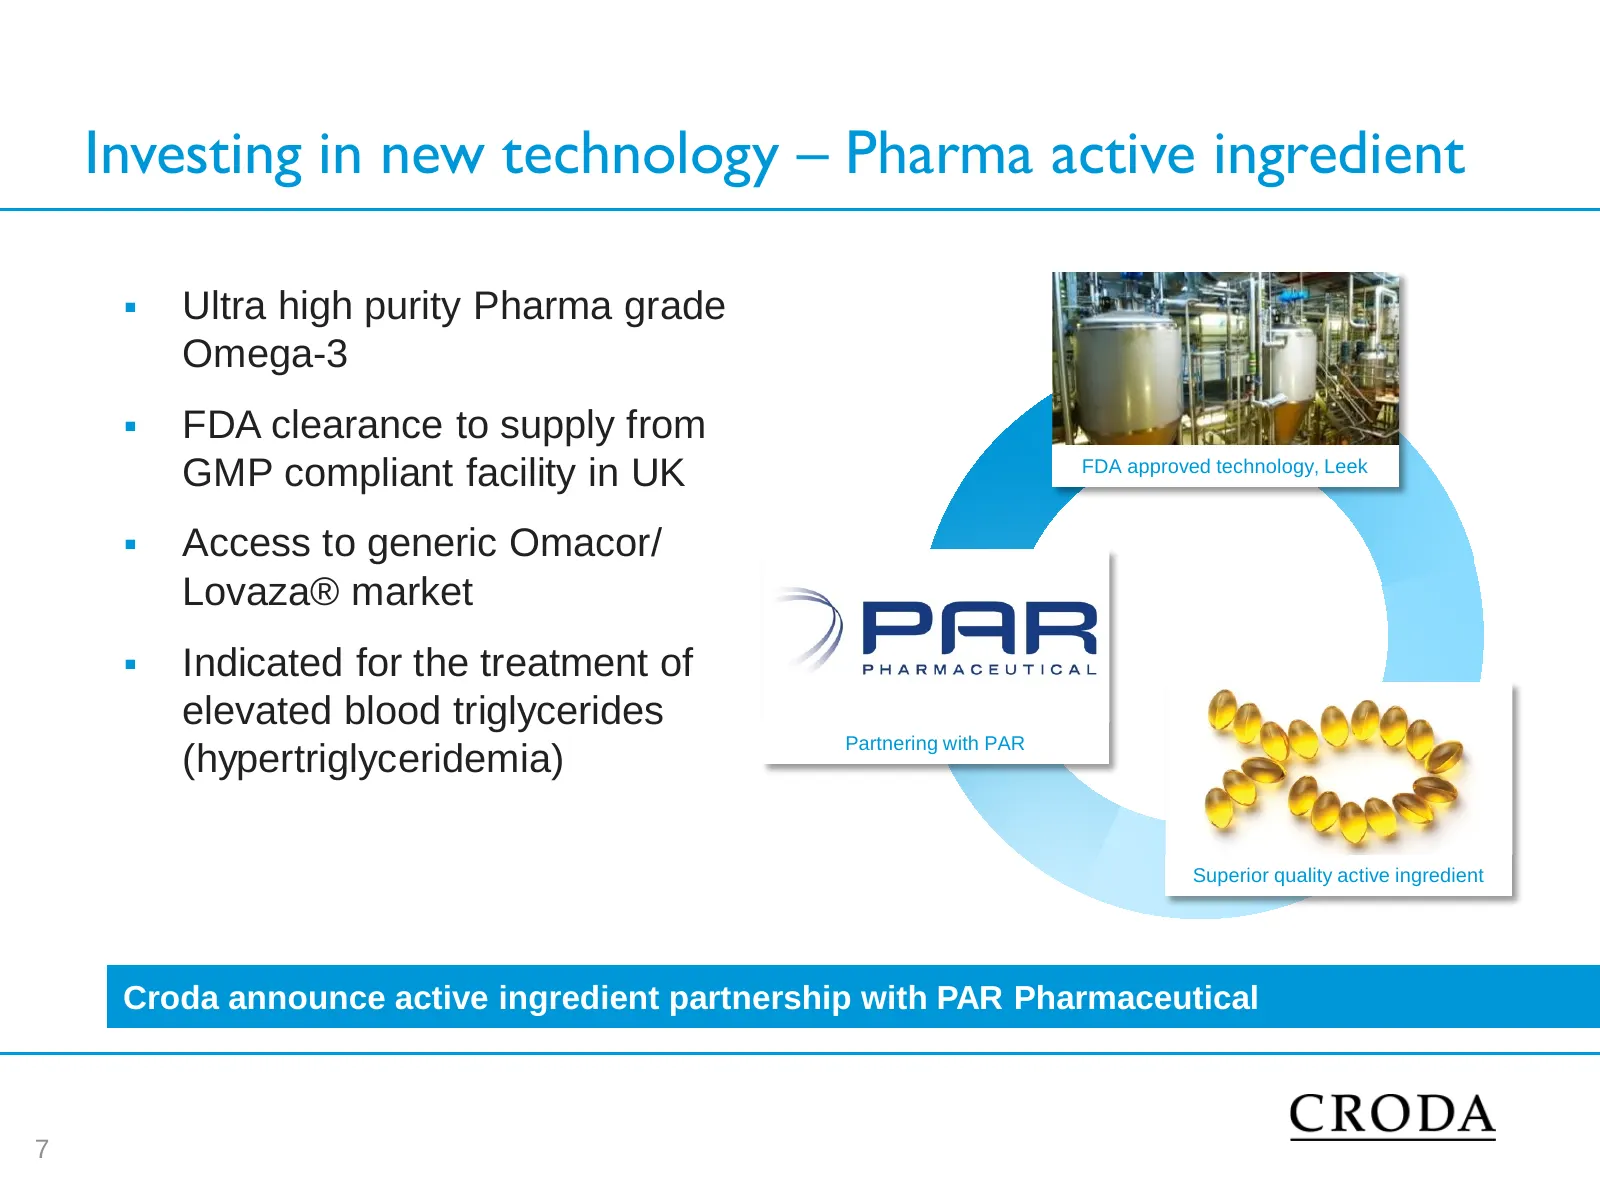
Investing in new technology – Pharma active ingredient Ultra high purity Pharma grade Omega-3 FDA clearance to supply from GMP compliant facility in UK FDA approved technology, Leek Access to generic Omacor/ Lovaza® market Indicated for the treatment of elevated blood triglycerides Partnerin
Slide 8: New global customer facing organisation
New global customer facing organisation Creation of 3 global business groups Personal Care Health Care & Crop Care Performance Technologies & Industrial Chemicals (PTIC) Combining Sales, Marketing and Research by sector in dedicated global teams Full Executive Committee accountability with
Slide 9: Executive Committee Responsibility
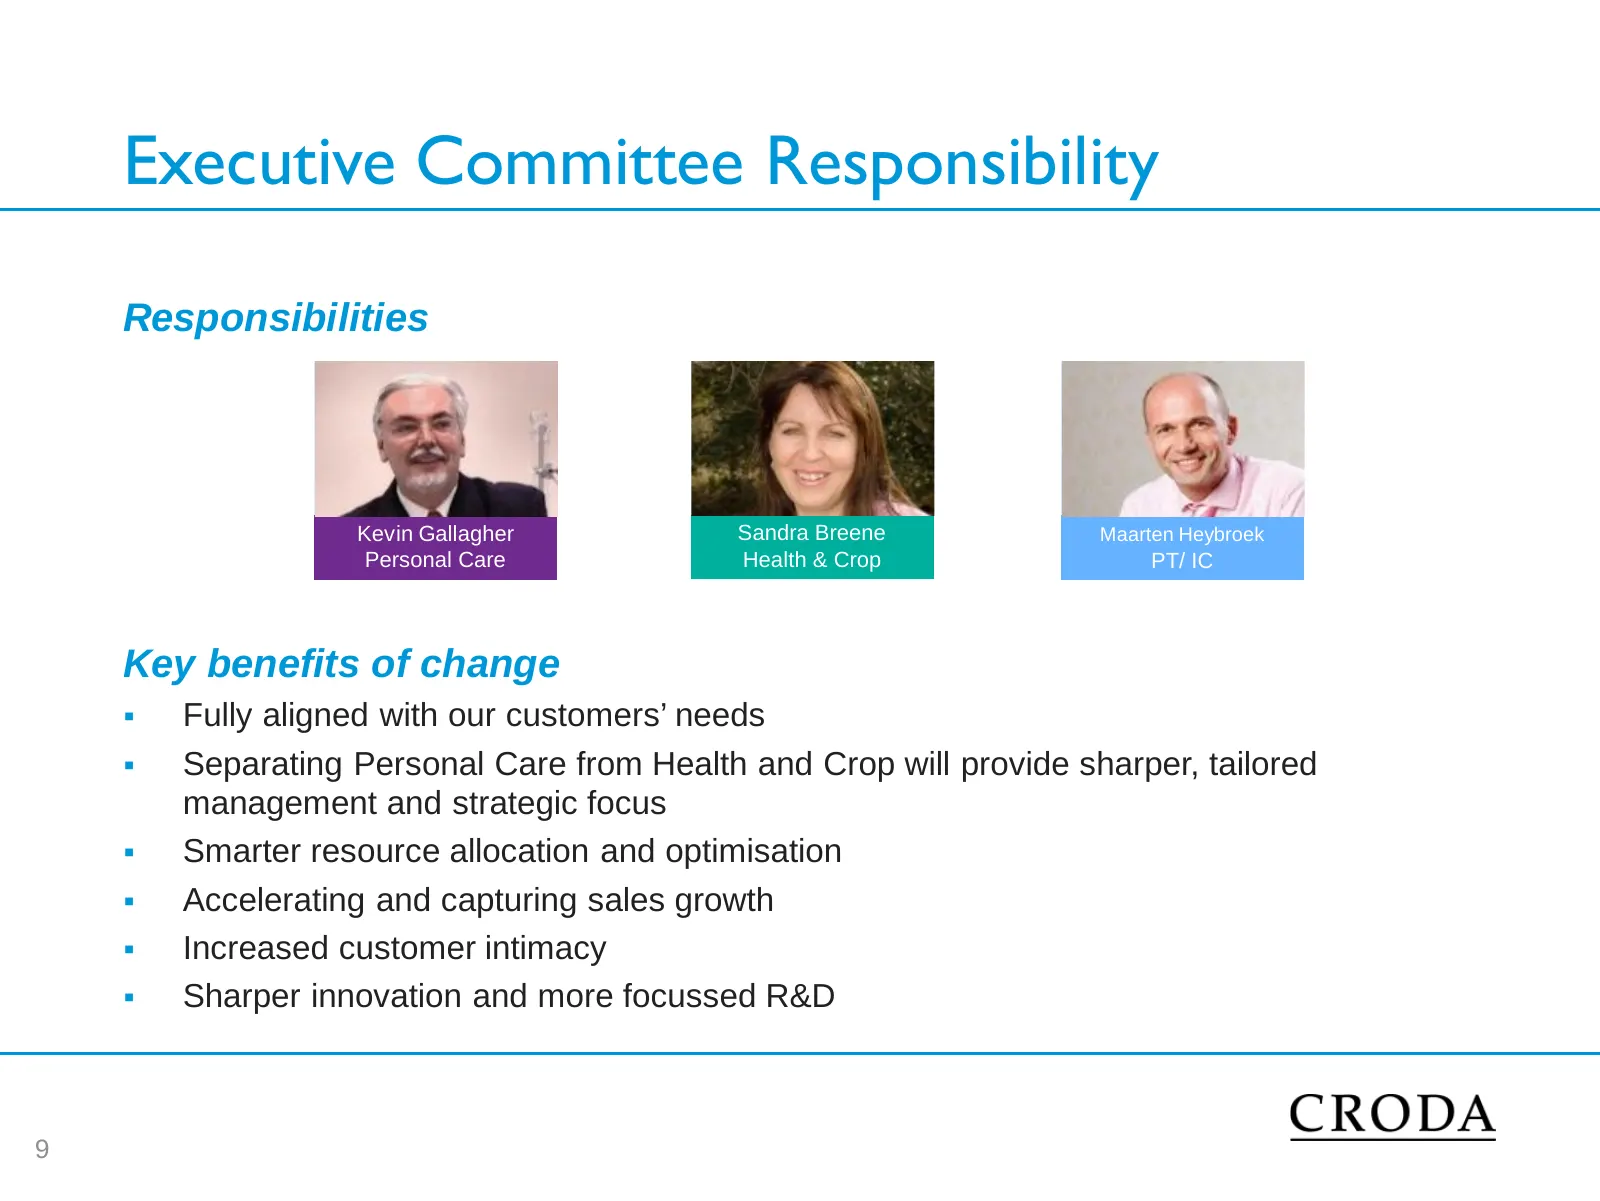
Executive Committee Responsibility Responsibilities Kevin Gallagher Sandra Breene Maarten Heybroek Personal Care Health & Crop PT/ IC Key benefits of change Fully aligned with our customers’ needs Separating Personal Care from Health and Crop will provide sharper, tailored management and strateg
Slide 10: 2014 Q3 results
2014 Q3 results Basis of preparation Unless otherwise stated, all profit and earnings numbers are stated before acquisition costs and goodwill amortisation
Slide 11: Q3 sales by segment
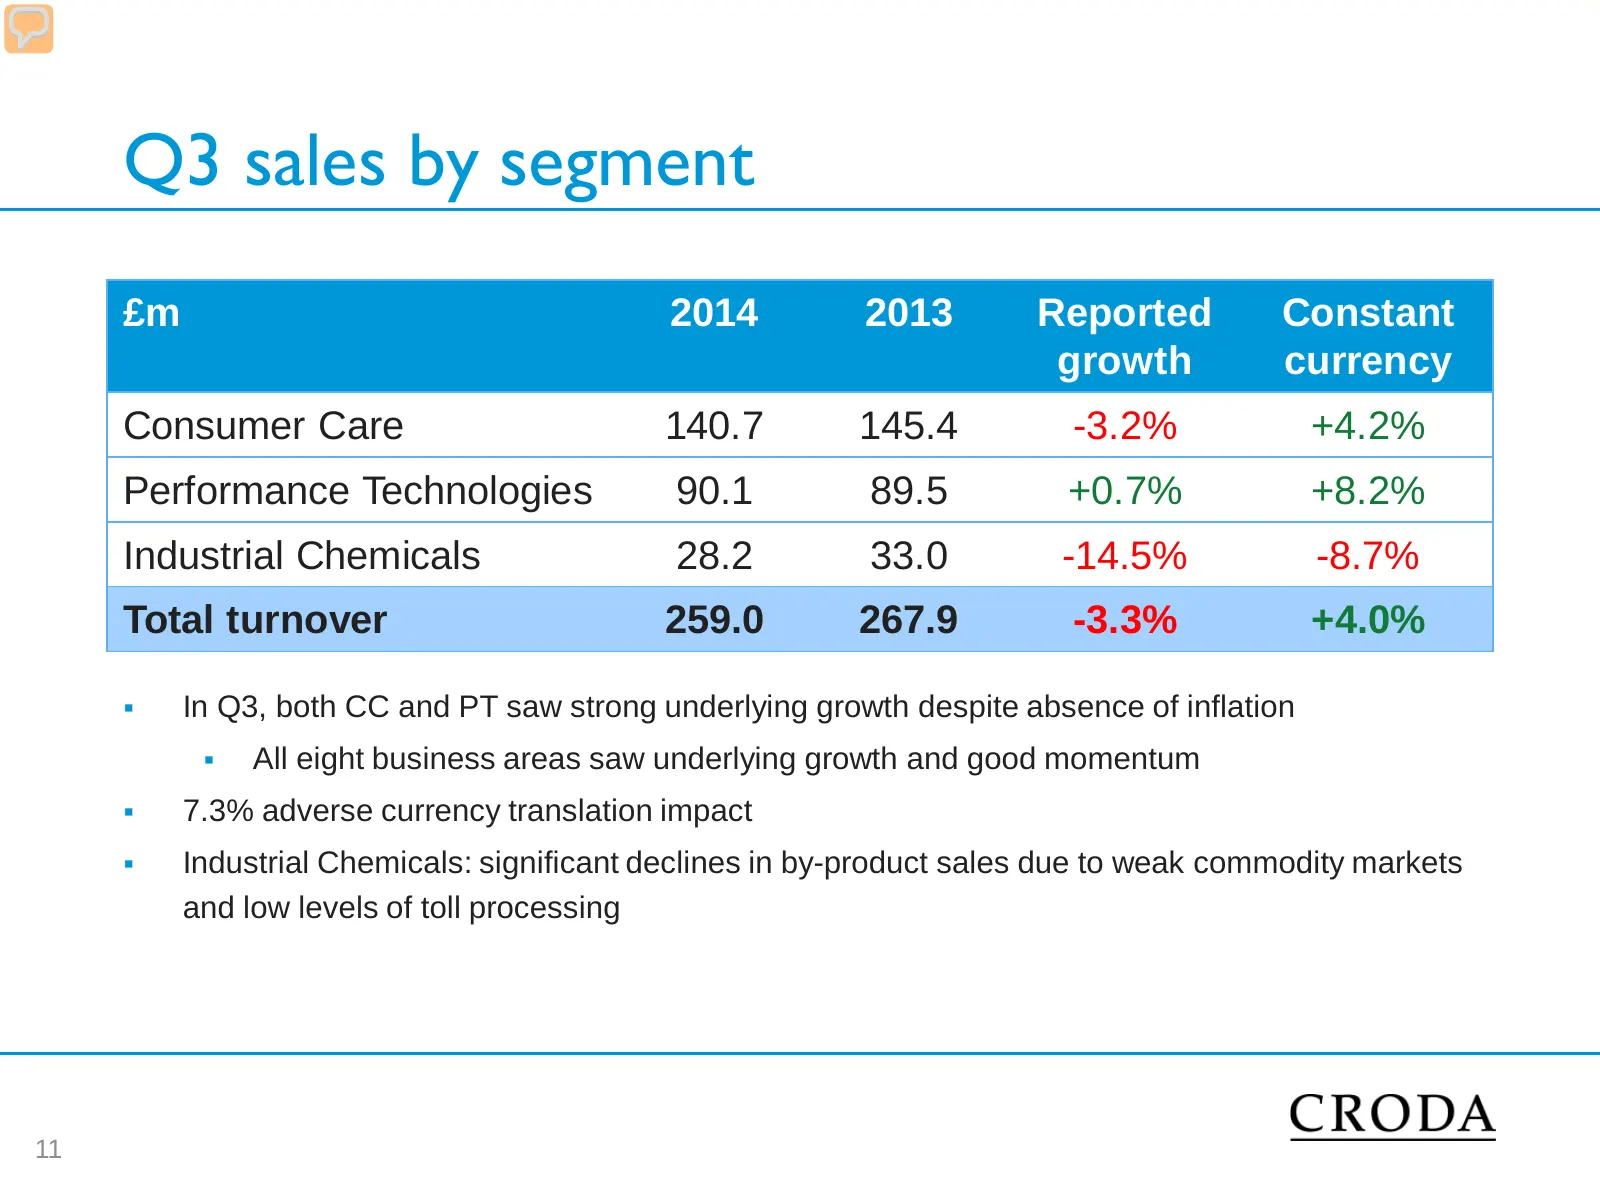
Q3 sales by segment £m 2014 2013 Reported Constant growth currency Consumer Care 140.7 145.4 -3.2% +4.2% Performance Technologies 90.1 89.5 +0.7% +8.2% Industrial Chemicals 28.2 33.0 -14.5% -8.7% Total turnover 259.0 267.9 -3.3% +4.0% In Q3, both CC and PT saw strong underlying growth despite abse
Slide 12: Sales trends – positive momentum
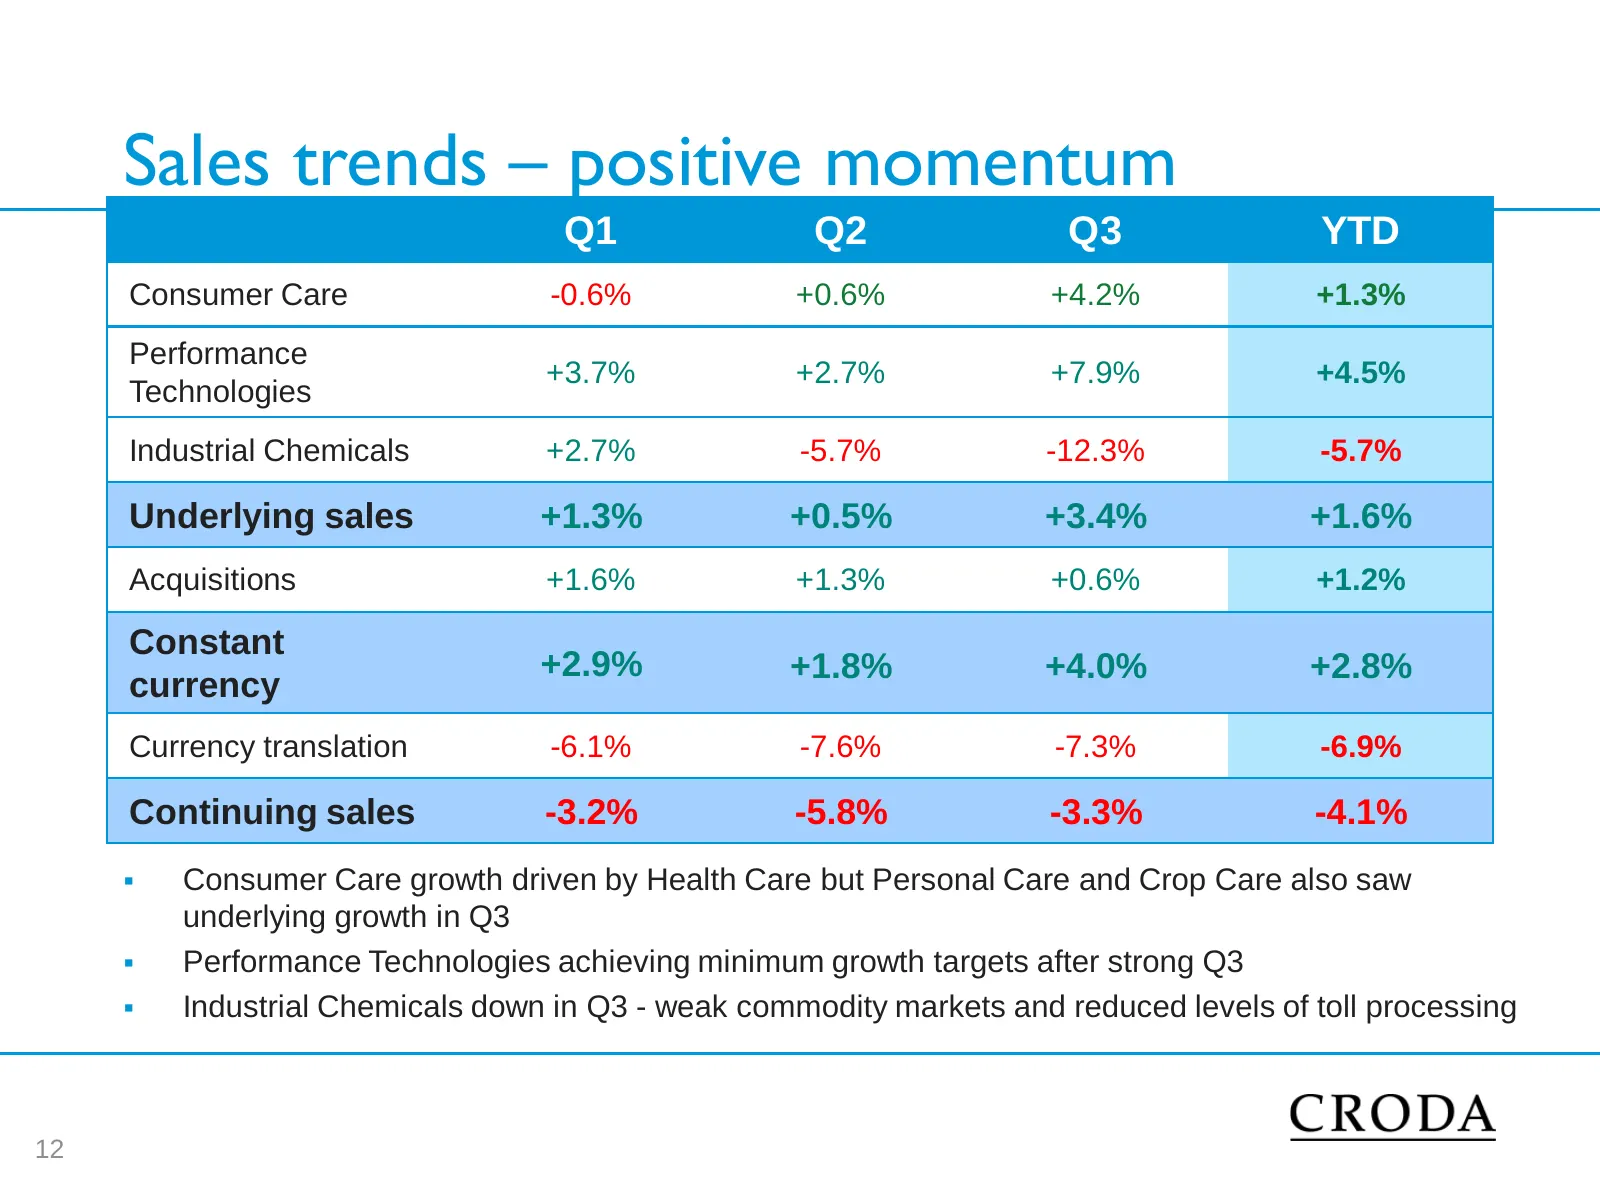
Sales trends – positive momentum Q1 Q2 Q3 YTD Consumer Care -0.6% +0.6% +4.2% +1.3% Performance +3.7% +2.7% +7.9% +4.5% Technologies Industrial Chemicals +2.7% -5.7% -12.3% -5.7% Underlying sales +1.3% +0.5% +3.4% +1.6% Acquisitions +1.6% +1.3% +0.6% +1.2% Constant +2.9% +1.8% +4.0% +2.8% currency C
Slide 13: Consumer Care
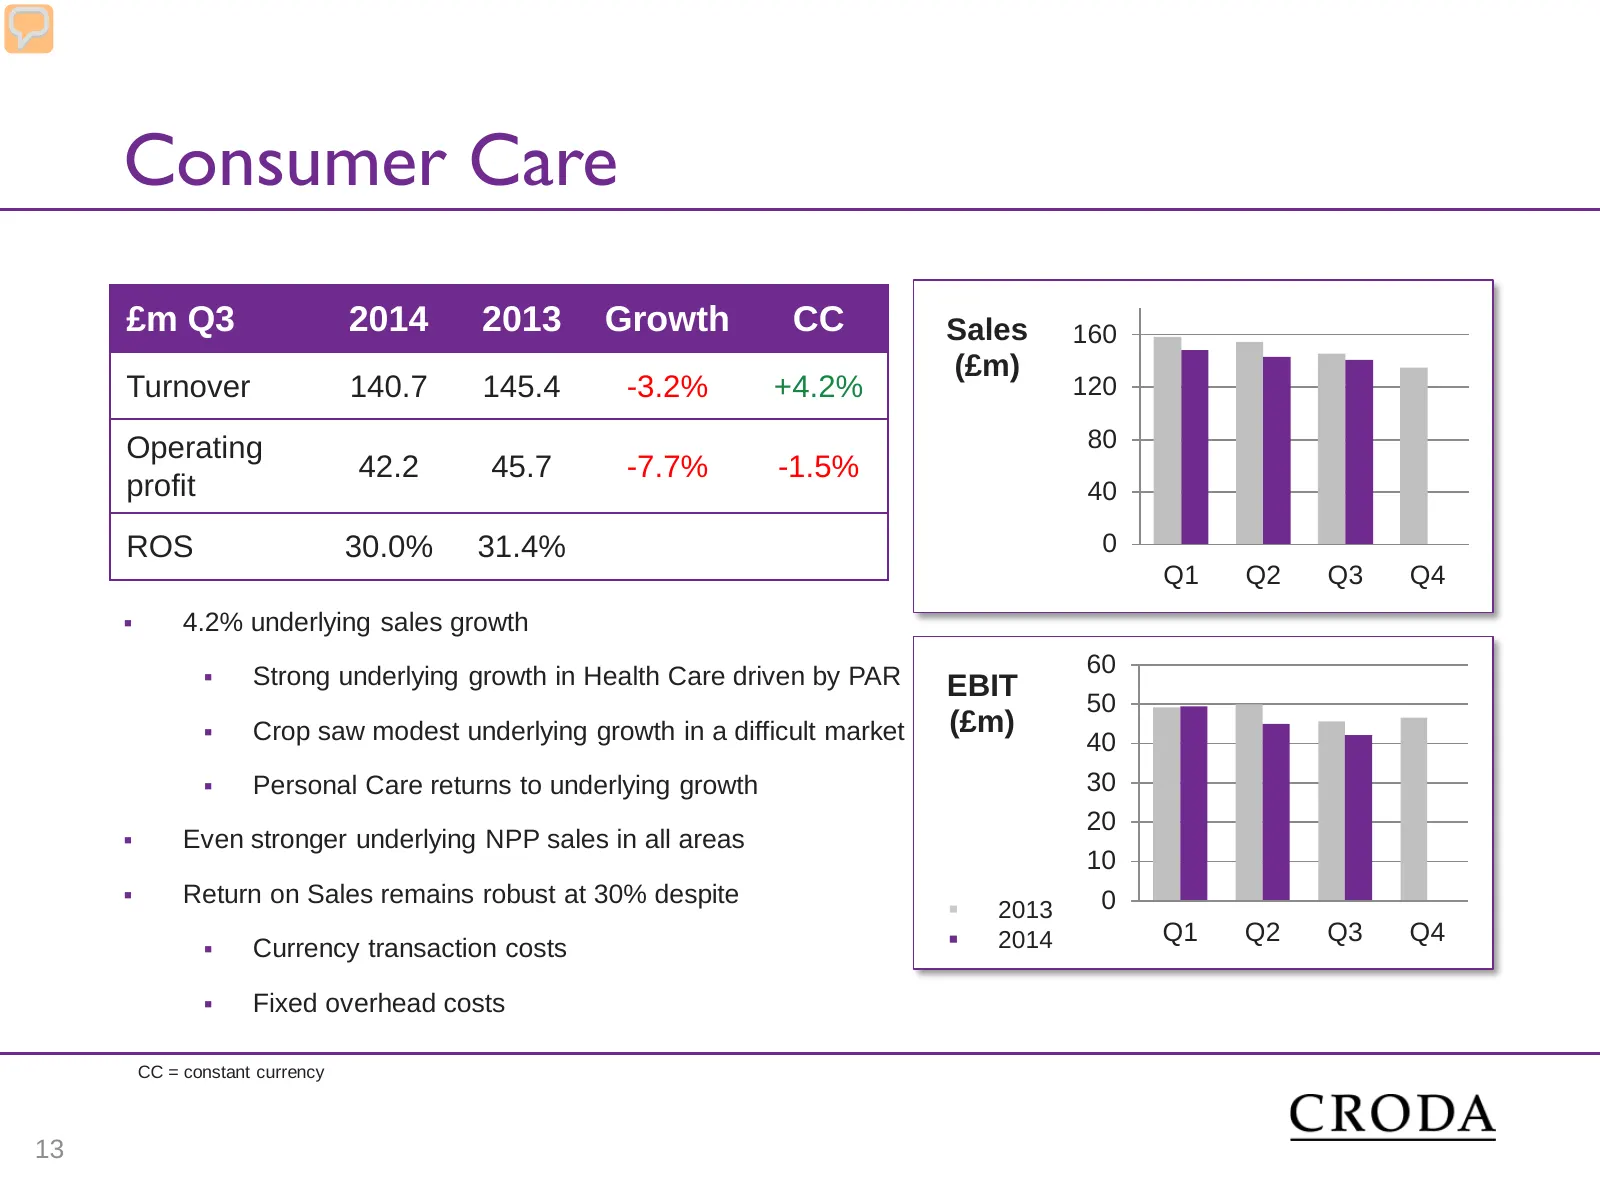
Consumer Care £m Q3 2014 2013 Growth CC Sales 160 (£m) Turnover 140.7 145.4 -3.2% +4.2% 120 Operating 80 42.2 45.7 -7.7% -1.5% profit 40 ROS 30.0% 31.4% 0 Q1 Q2 Q3 Q4 4.2% underlying sales growth Strong underlying growth in Health Care driven by PAR 60 EBIT 50 Crop saw modest underlying growth
Slide 14: Performance Technologies
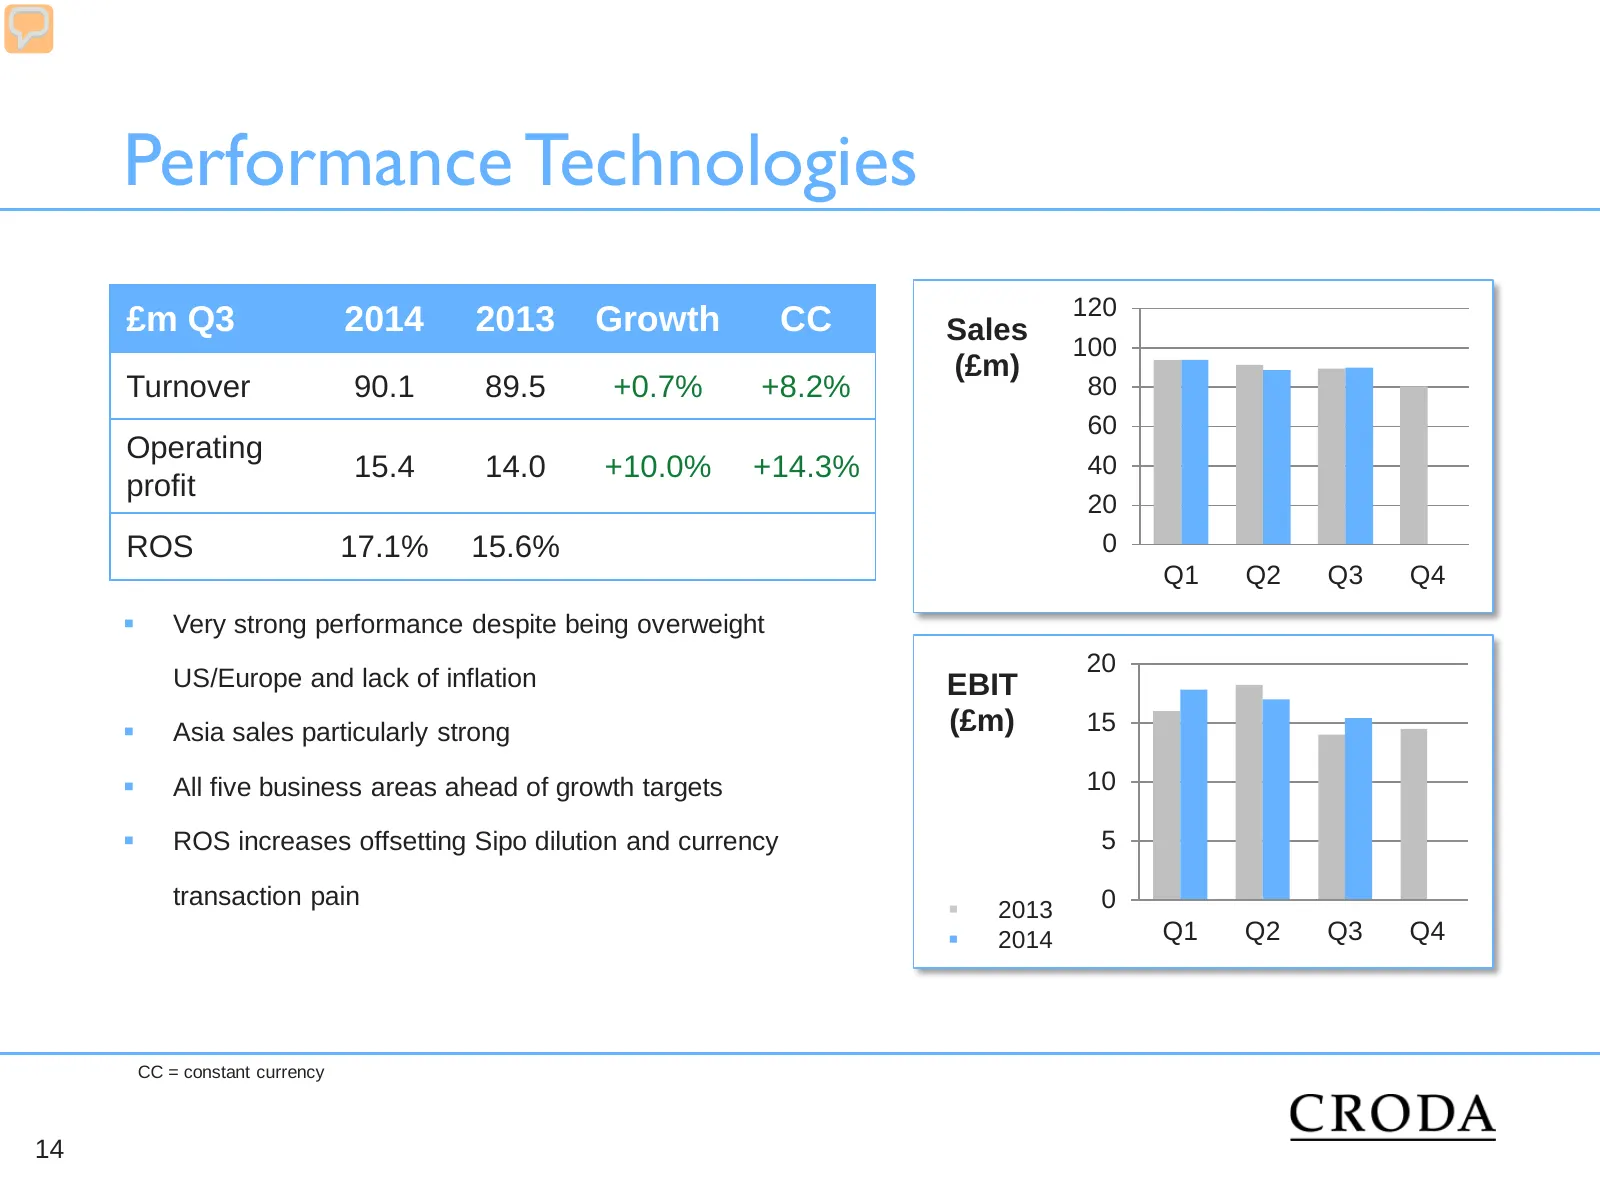
Performance Technologies 120 £m Q3 2014 2013 Growth CC Sales 100 (£m) Turnover 90.1 89.5 +0.7% +8.2% 80 60 Operating 15.4 14.0 +10.0% +14.3% 40 profit 20 ROS 17.1% 15.6% 0 Q1 Q2 Q3 Q4 Very strong performance despite being overweight 20 US/Europe and lack of inflation EBIT Asia sales particularly
Slide 15: Industrial Chemicals
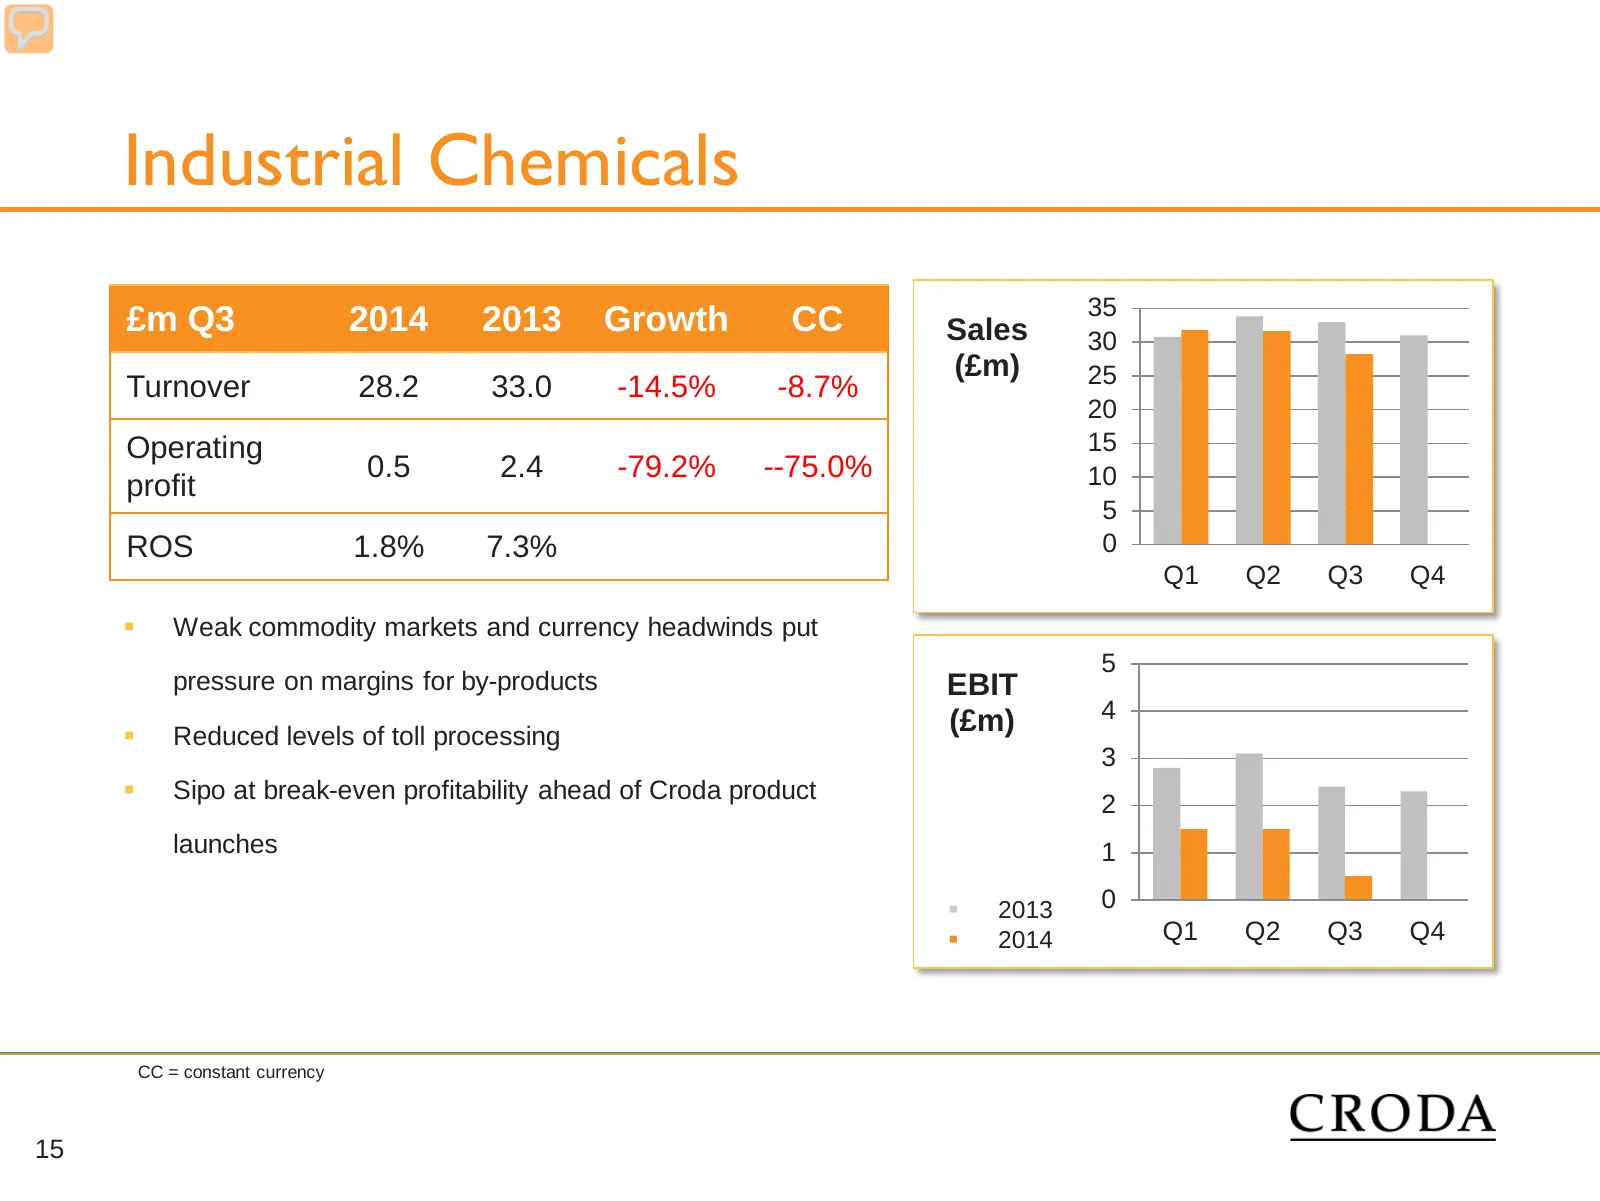
Industrial Chemicals 35 £m Q3 2014 2013 Growth CC Sales 30 (£m) 25 Turnover 28.2 33.0 -14.5% -8.7% 20 Operating 15 0.5 2.4 -79.2% --75.0% 10 profit 5 ROS 1.8% 7.3% 0 Q1 Q2 Q3 Q4 Weak commodity markets and currency headwinds put 5 pressure on margins for by-products EBIT (£m) 4 Reduced levels of
Slide 16: Q3 Pre-tax profit
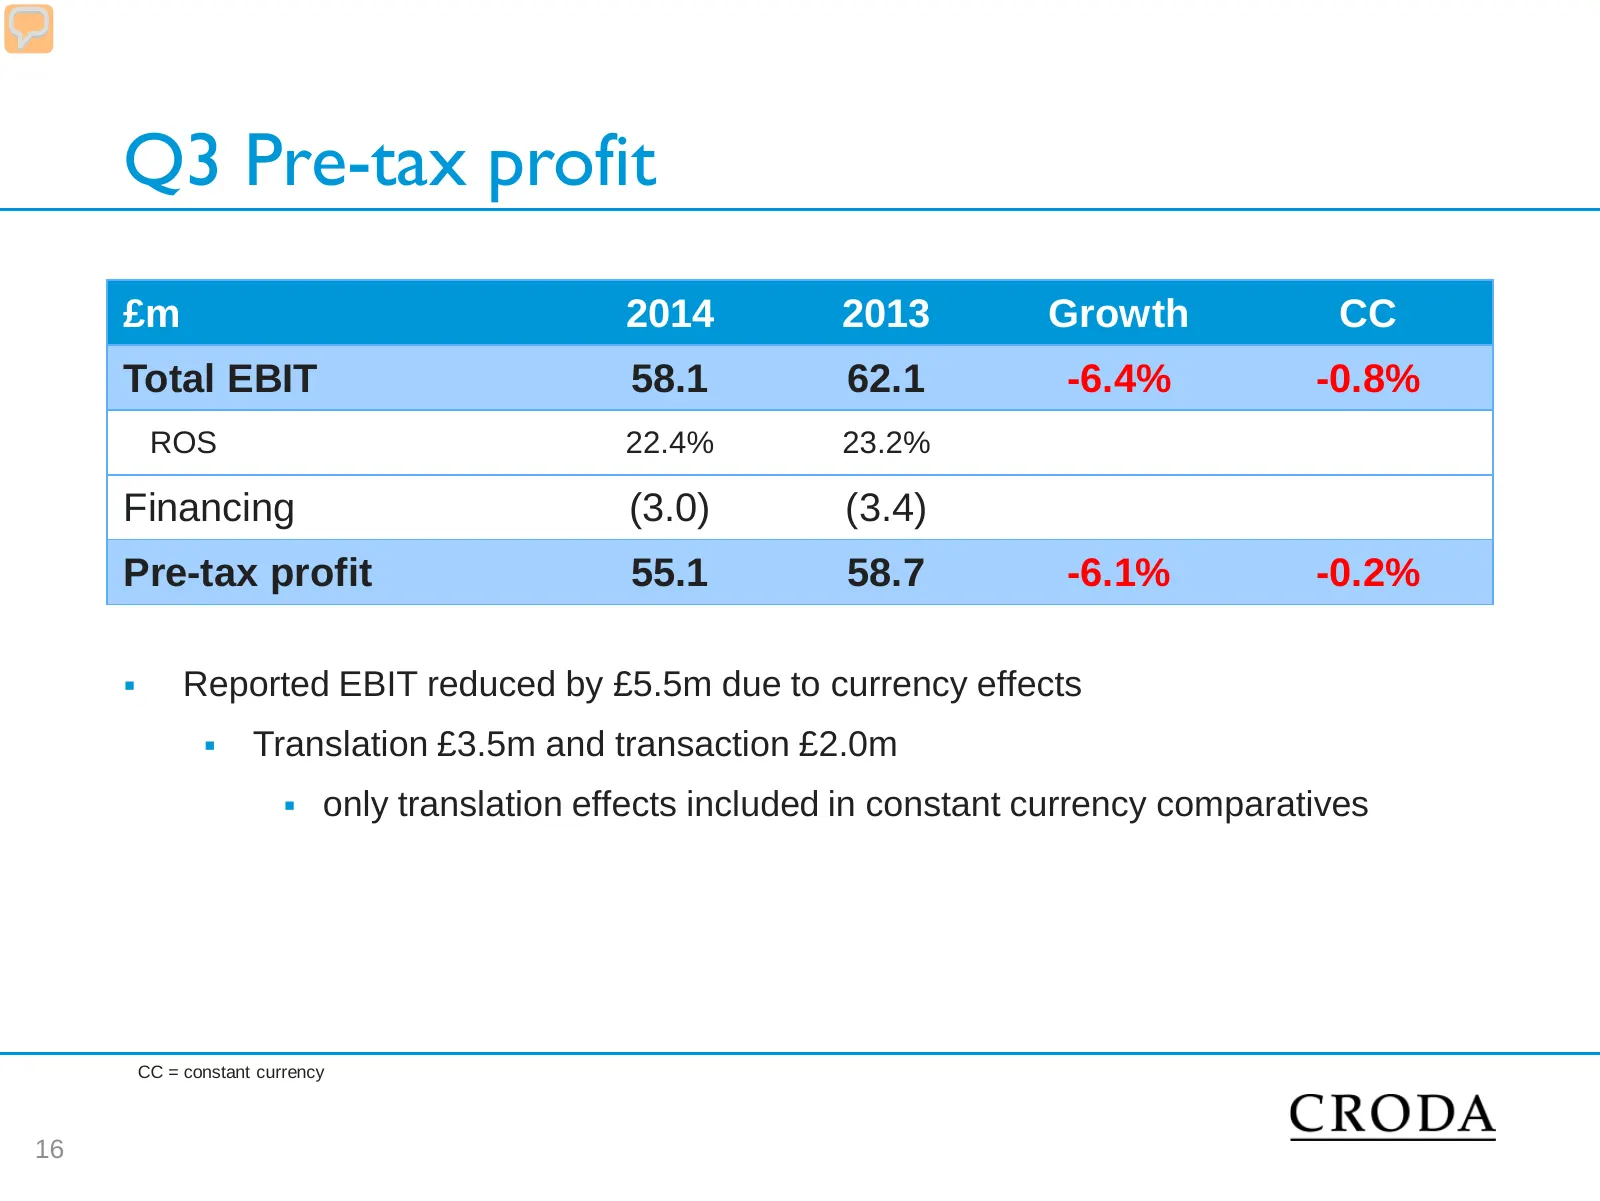
Q3 Pre-tax profit £m 2014 2013 Growth CC Total EBIT 58.1 62.1 -6.4% -0.8% ROS 22.4% 23.2% Financing (3.0) (3.4) Pre-tax profit 55.1 58.7 -6.1% -0.2% Reported EBIT reduced by £5.5m due to currency effects Translation £3.5m and transaction £2.0m only translation effects included in constant curr
Slide 17: Cash flow and net debt
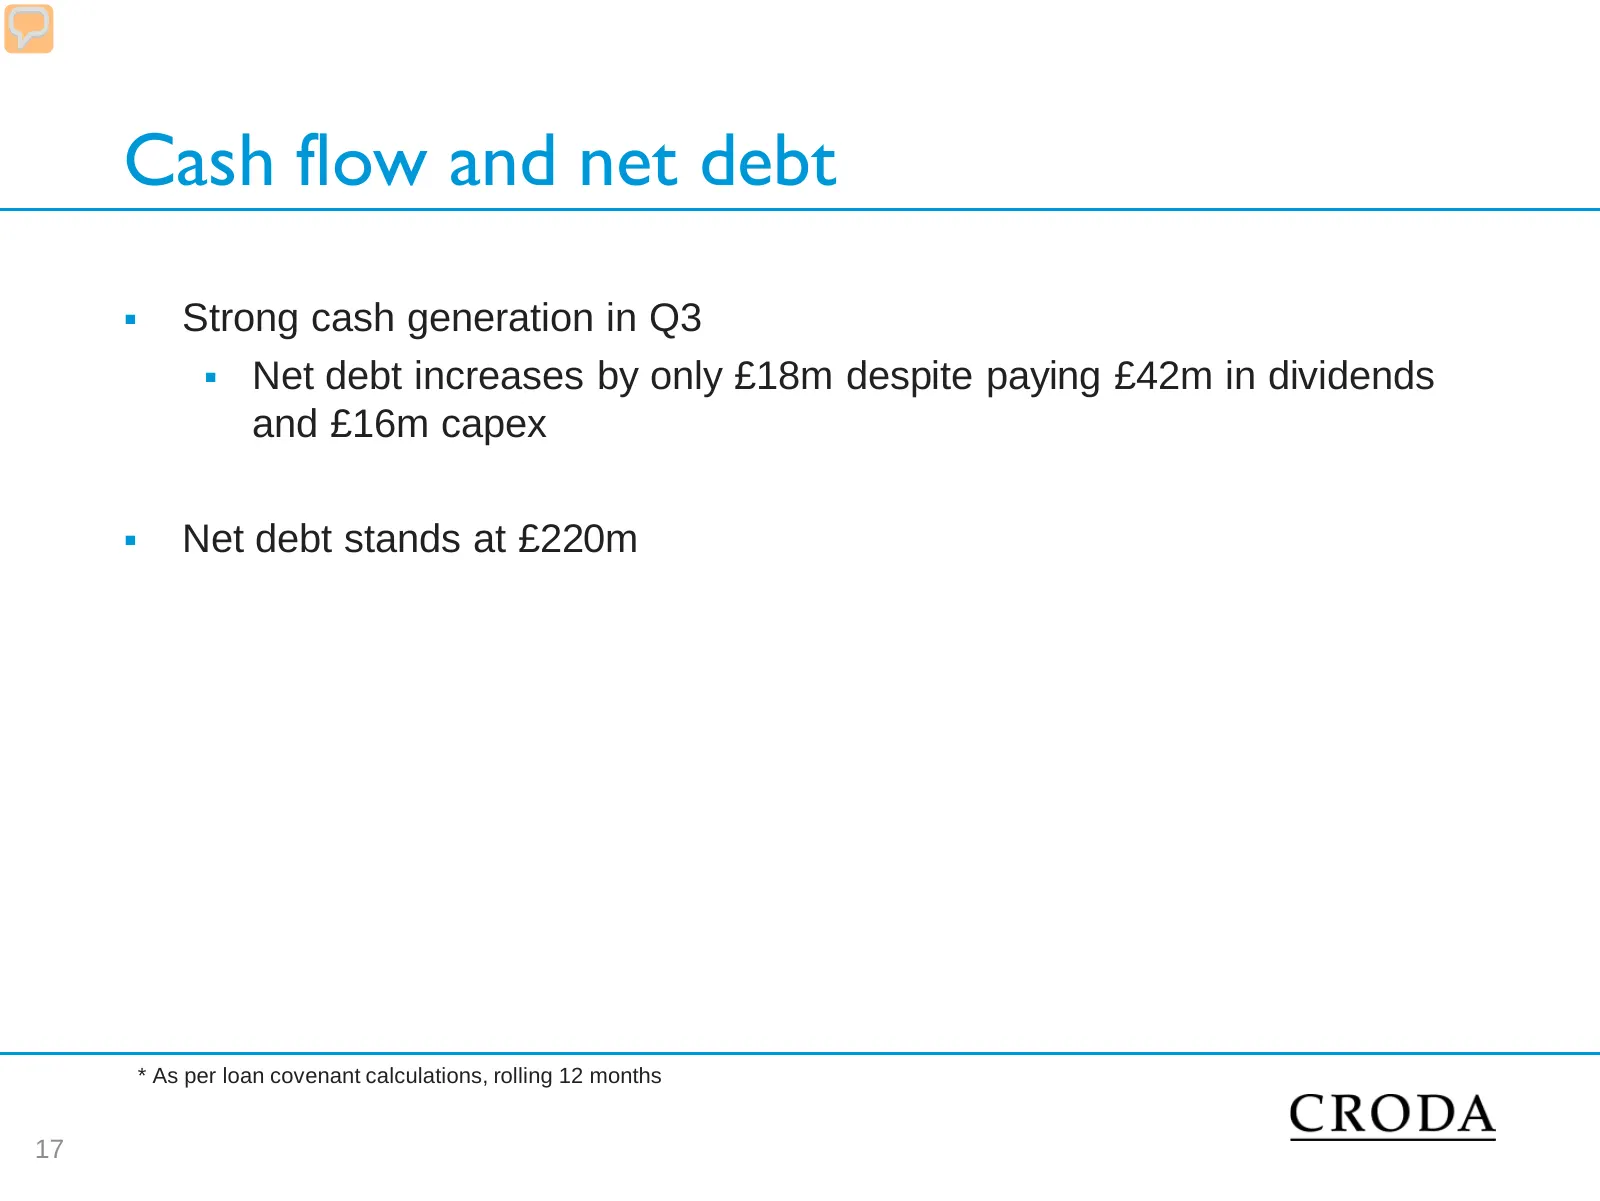
Cash flow and net debt Strong cash generation in Q3 Net debt increases by only £18m despite paying £42m in dividends and £16m capex Net debt stands at £220m * As per loan covenant calculations, rolling 12 months 17
Slide 18: Summary and outlook
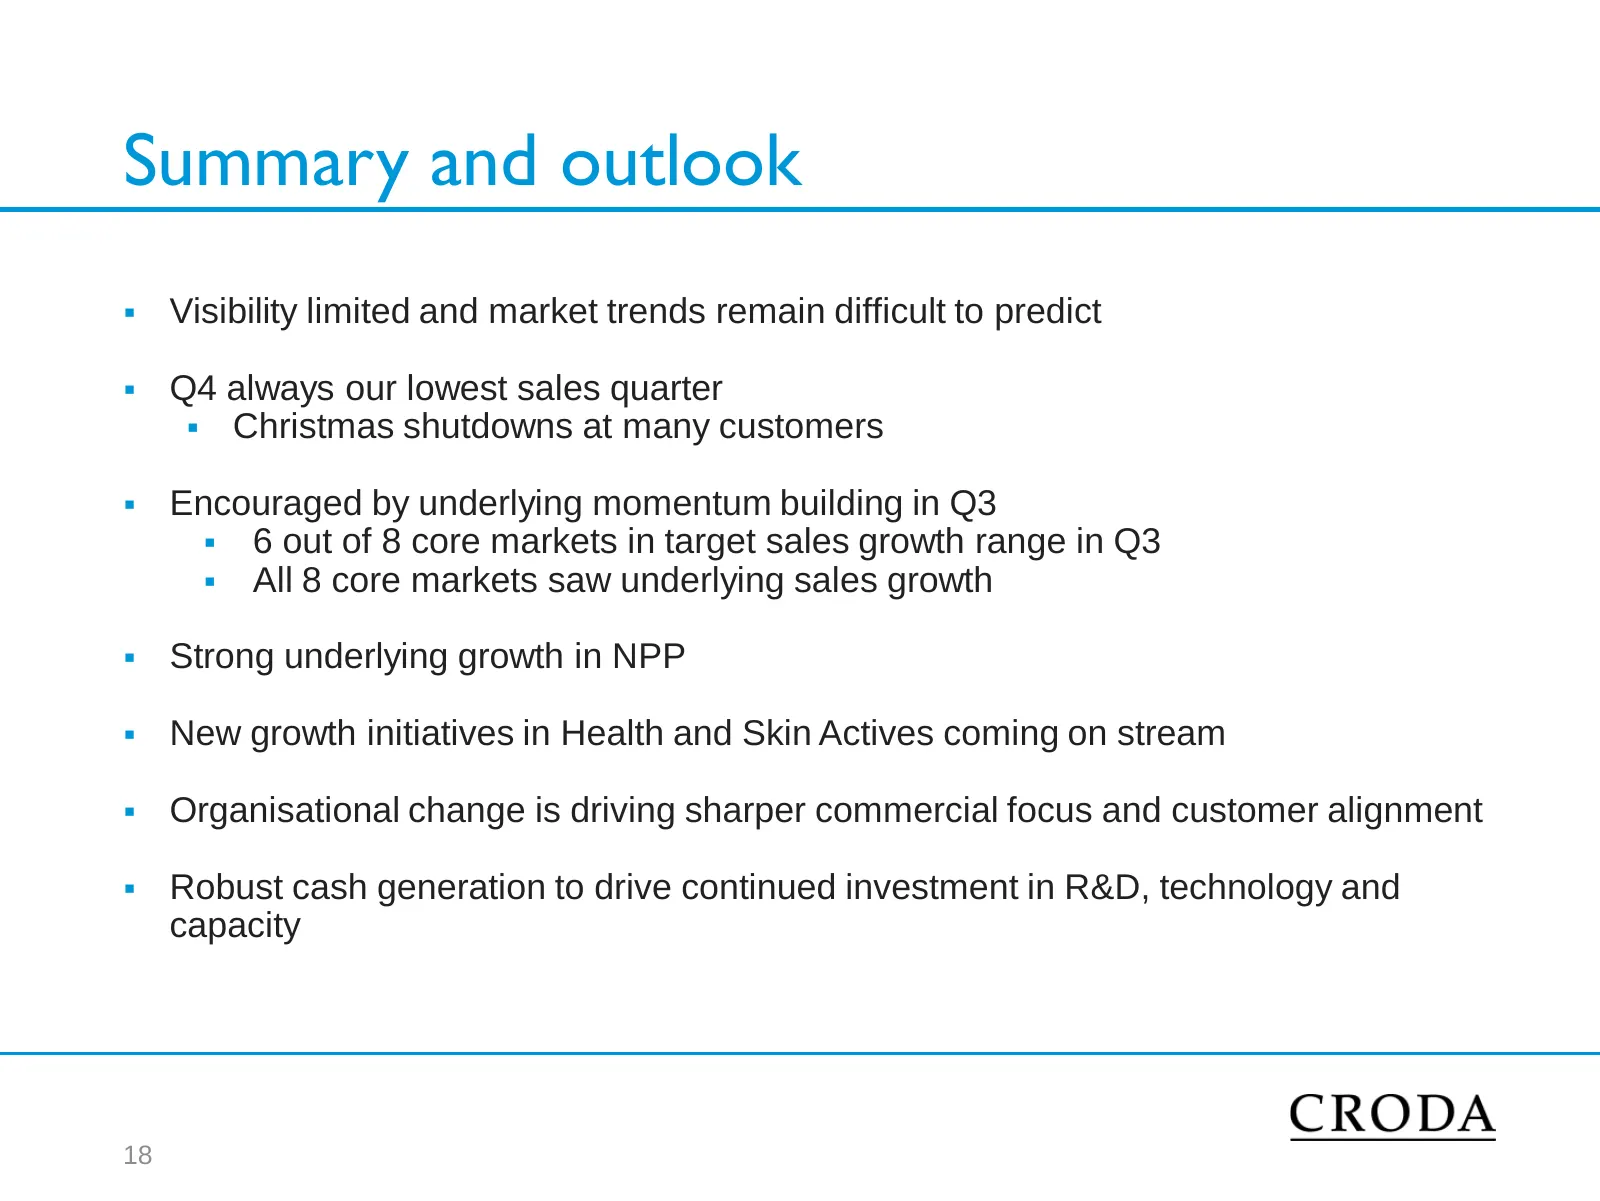
Summary and outlook Visibility limited and market trends remain difficult to predict Q4 always our lowest sales quarter Christmas shutdowns at many customers Encouraged by underlying momentum building in Q3 6 out of 8 core markets in target sales growth range in Q3 All 8 core markets saw
Source: Internet Archive copy of croda.com
More decks from Croda International PLC
 H1 2026 Earnings Presentation30 slides · Jul 28, 2026
 FY2025 Earnings Presentation49 slides · Feb 24, 2026
 H1 2025 Earnings Presentation33 slides · Jul 29, 2025
 Corporate Update (May 2025)13 slides · May 2025
 Bank of America Beautiful Day event 202523 slides · May 2025
 FY2024 Earnings Presentation33 slides · Feb 25, 2025