QMed — Investor Presentation (March 2007)
21 slides from QMed's investor presentation, Mar 15, 2007

Slide 1: QMed, Inc. Managing the Chronically Ill
QMed, Inc. Managing the Chronically Ill

Slide 2: Forward Looking Statements
This presentation contains “forward-looking statements” as that term is defined in the Private Securities Litigation Reform Act of 1995. These statements involve risks and uncertainties that may cause results to differ materially from those set forth in the statements. No forward-looking statement c

Slide 3: Guidance for SNP Revenue
Our guidance for 2007 is $38.5 - $44 Million revenue for New Jersey and South Dakota chronics alone (~3%) Fundamentals South Dakota New Jersey Population 112,994 276,796 Chronic Population 19,840 68,100 % Chronics 17.6% 24.6% Total All Population Costs $705,082,560 $2,922,965,760 Total Chronic Costs

Slide 4: Medicare Special Needs Plans
Medicare Modernization Act established Special Needs Plans for Duals, Institutionalized, and Chronically Ill individuals who have special needs QMedCare is primarily oriented to SNPs for those with chronic conditions e.g CAD, CHF, Stroke Risk adjusted payments (RAPS) from Medicare These payments can

Slide 5: Illustrative Risk Score Levels
1.00 0.92 1.90 1.29 Illustrative Risk Score Levels Average Medicare Non-Institutionalized/Non-Medicaid Institutionalized Dual Eligible (Medicare/Medicaid) Nationwide Risk Score Eligibility Category

Slide 6: Political & Regulatory Outlook
We believe the outlook for SNPs continues to improve We stay active on Capitol Hill and at CMS CMS marketing regulations are evolving to assist SNPs All understand that chronics spend most Medicare funds Medicare can save by removing artificial overpayment to MA with healthier members PFFS plans are

Slide 7: Why QMed’s SNPs are Special
1.0 or less 1.2 - 2.3 $350+ (NJ + SD) $125 (NJ) $101 (SD) Non-engaging Fully Engaging No coverage or Generics Only Brand and Generic Chronic Avoidance Chronically Ill Discounted Contracts Quality Of Care Why QMed’s SNPs are Special RAPs Patient Value Proposition Provider Interest Part D and Donut ho

Slide 8: QMed Background for SNP Success
Successful Medical & Disease Management FFS and capitated markets Seniors and commercial members with cardiovascular disease Demonstration projects with CMS IT systems include electronic medical records, expert system analytics, physician engagement, detailed reporting QMed Background for SNP Succes

Slide 9: QMed Background for SNP Success
Our Medicare SNPs are based on this expertise We are a “Care Model”, not a “Contracting Model” Plan We manage the bottom line Clinical algorithms boost best practice medicine C3 – Community Coordinated Care for patients linked to all providers Quality reporting leading to enhanced physician support

Slide 10: Fundamental Development
Our care model addresses core medical system issues of quality and measurement by reconfiguring healthcare for chronically ill Medicare beneficiaries for the 21 st Century. Fundamental Development

Slide 11: Early Lessons
Price and design for seniors post Part D Understand CMS marketing guidelines Engage the selling broker community Engage physicians and hospitals Execute above peers Enrollment Manage RAPS for Top Line Medical Management for the bottom line Early Lessons

Slide 12: Keys to Enrollment – Recruitment Strategy
Meet the needs of hospitals Meet the needs of physicians Meet the needs of patients Market, market, market – intelligence based on regional and local dynamics Keys to Enrollment – Recruitment Strategy

Slide 13: Patient Value Proposition
Cost of Coverage Comparison HLP (QMed) Wellmark HeartLine Plus $101.00 Supplemental Premium included $140.00 Part D thru donut hole (option 3) included $110.30 Total Cost of Coverage $101.00 $250.30 Monthly Savings 59.6% $149.30 Cost of Coverage Comparison QMed AARP QMedCare $125.00 Approx. Supplime

Slide 14: Comprehensive Marketing
Strategic relationships with more than 300 senior products brokers Hospital systems endorse the program to physicians Physicians can now tell their patients about our SNP health, drug and cost benefits Understand local market dynamics Easy and concise messaging to Medicare Beneficiaries Comprehensiv
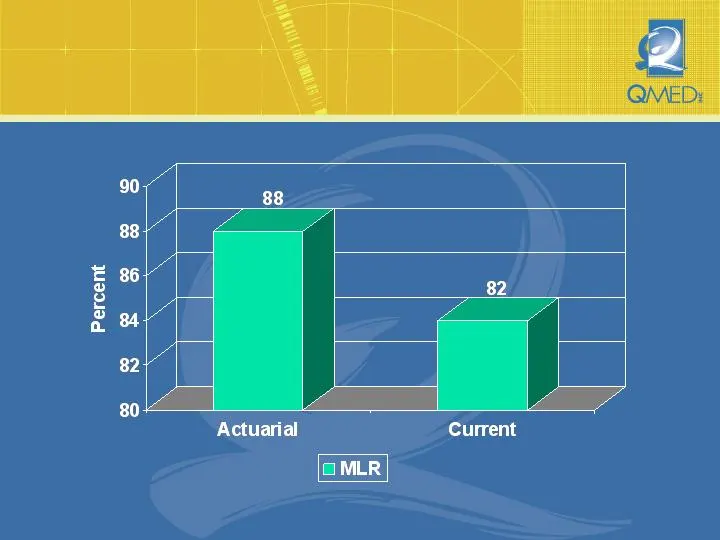
Slide 15: So, How are we doing…?
Reconciled as of 9/30/06 So, How are we doing…?
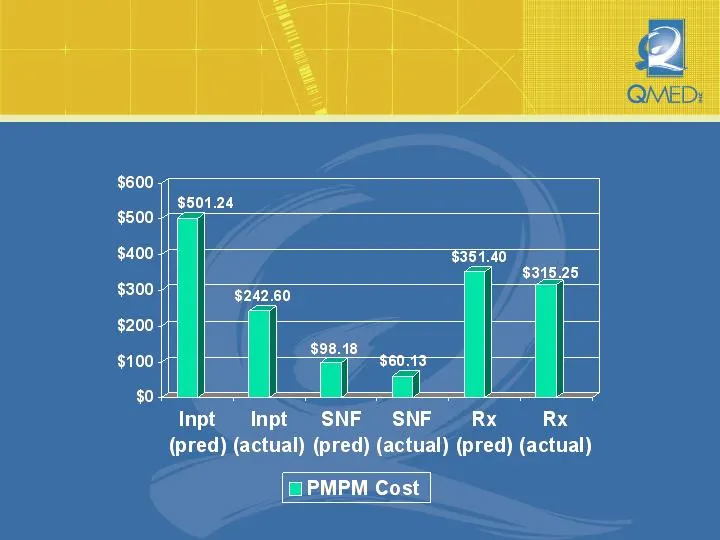
Slide 16: So, How are we doing …?
So, How are we doing …?
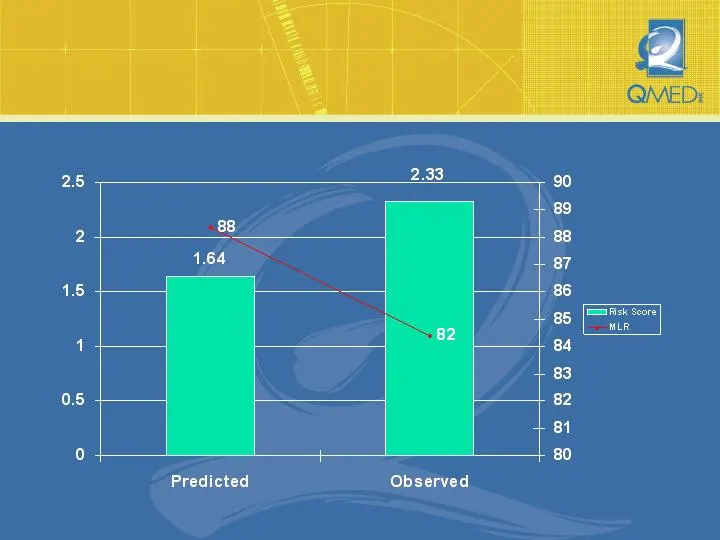
Slide 17: Predicted Observed
25 1.5 05 2.33 88 164 | 2 Predicted Observed Regeeess 83 82 81 80 Sian soore WLR

Slide 18: Unique Infrastructure
– Proactively identifying Gaps to concentrate care efforts for members cost effectively – Chart review identification for proper reimbursement for managing risk underwriting, maintain revenue with balanced budget act – Enhanced our electronic medical record system to capture more comprehensive infor

Slide 19: Investment Perspective
Right Product – Right Time – Right Price – Right Care Model Industry leading IT backbone Market is Large 90k targets of opportunity = $1.8 BILLION (NJ +SD) Dual SNP in May 2007 in SD Expansion probable in 2008 Experienced Motivated Management Team SNP 2007 Guidance $38.5 - $44 Million Investment Per

Slide 20: Investment Perspective
Our care model addresses core medical system issues of quality and measurement by reconfiguring healthcare for chronically ill Medicare beneficiaries for the 21 st Century. We will continue to deliver growth and performance in the fastest growing most important segment in healthcare. Investment Pers

Slide 21: QMed Inc. Managing the Chronically Ill
QMed Inc. Managing the Chronically Ill
Source: SEC EDGAR · 8-K filed Mar 15, 2007