Naspers Limited Class N · JSE:NPN
Naspers Limited Class N — H1 FY2021 Earnings Presentation
20 slides from Naspers Limited Class N's earnings presentation, November 2020
Slide 1: Naspers Limited Financial results for the six months ended 30 September 2020
Naspers Limited Financial results for the six months ended 30 September 2020
Slide 2: Important information
Important information This report contains forward-looking statements as defined in the United States Private Securities Litigation Reform Act of 1995 concerning our financial condition, results of operations and businesses. These forward-looking statements are subject to a number of risks and uncer

Slide 3: Strategic and Business Update
3 STRATEGIC AND BUSINESS UPDATE
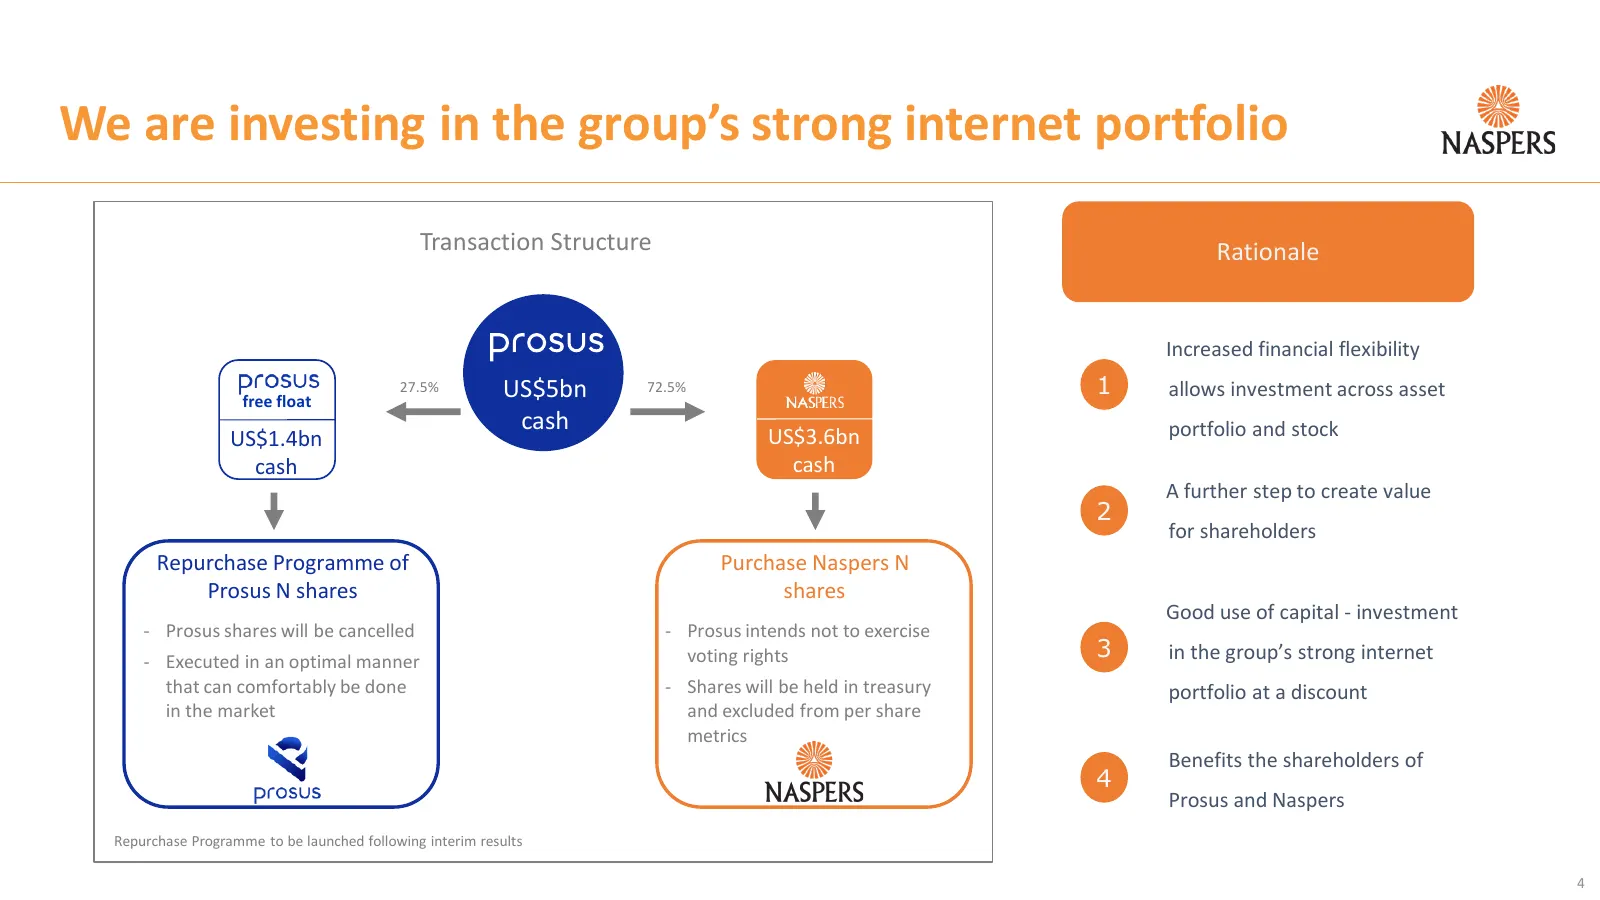
Slide 4: We are investing in the group's strong internet portfolio
We are investing in the group’s strong internet portfolio Transaction Structure Rationale Increased financial flexibility 27.5% US$5bn 72.5% 1 allows investment across asset free float cash portfolio and stock US$1.4bn US$3.6bn cash cash A further step to create value 2 for shareholders Repurchase P
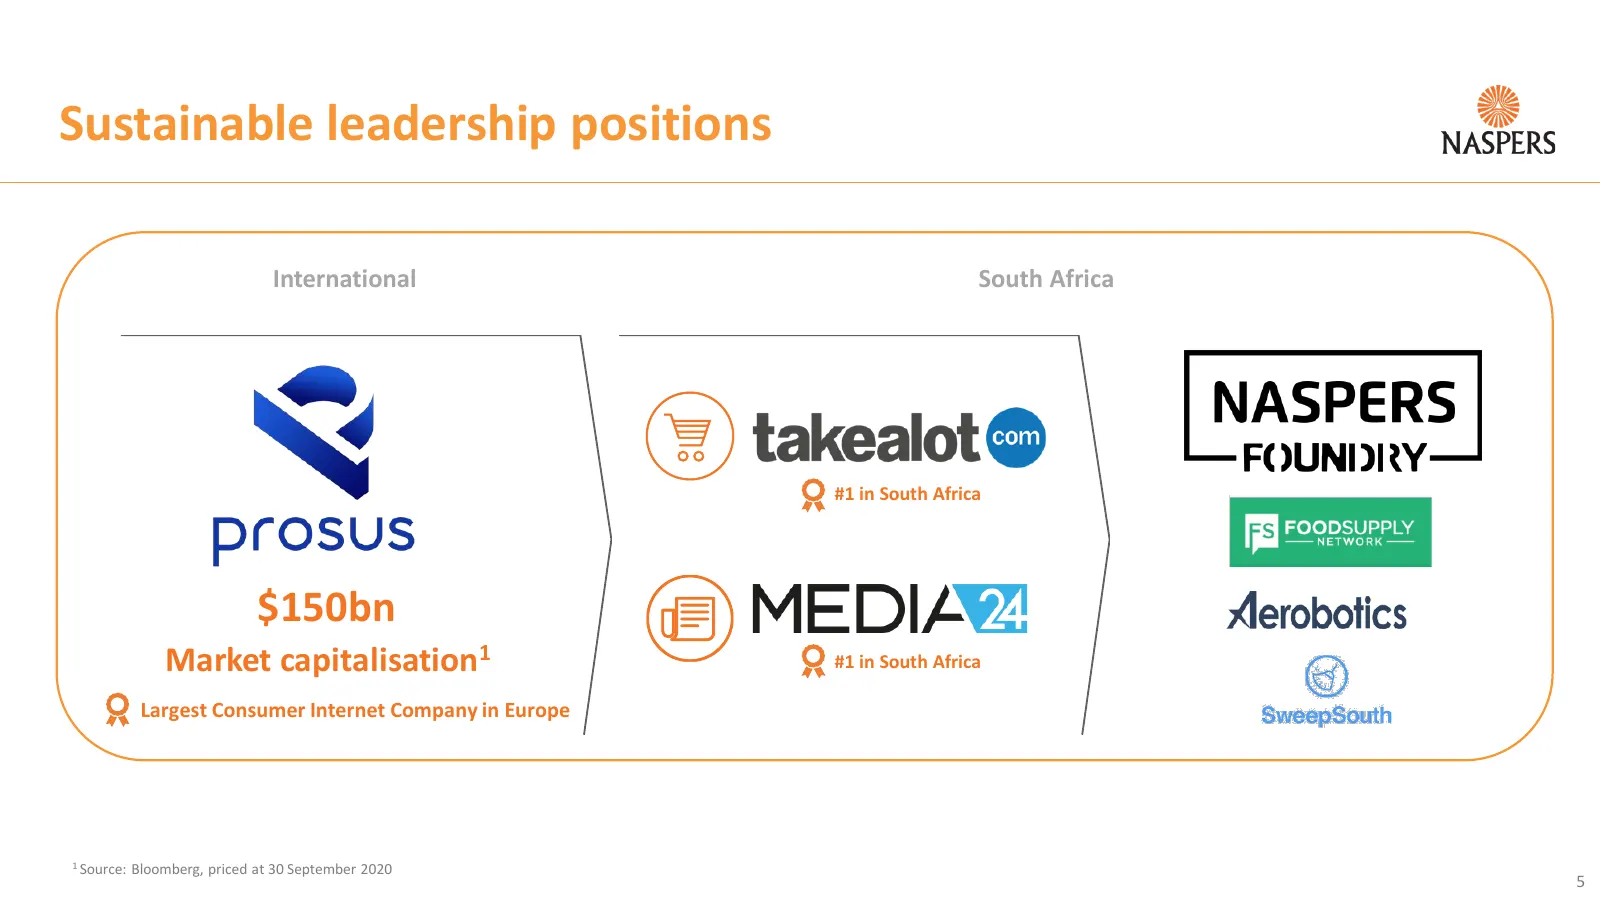
Slide 5: Sustainable leadership positions
Sustainable leadership positions International South Africa #1 in South Africa $150bn Market capitalisation1 #1 in South Africa Largest Consumer Internet Company in Europe 1 Source: Bloomberg, priced at 30 September 2020 5
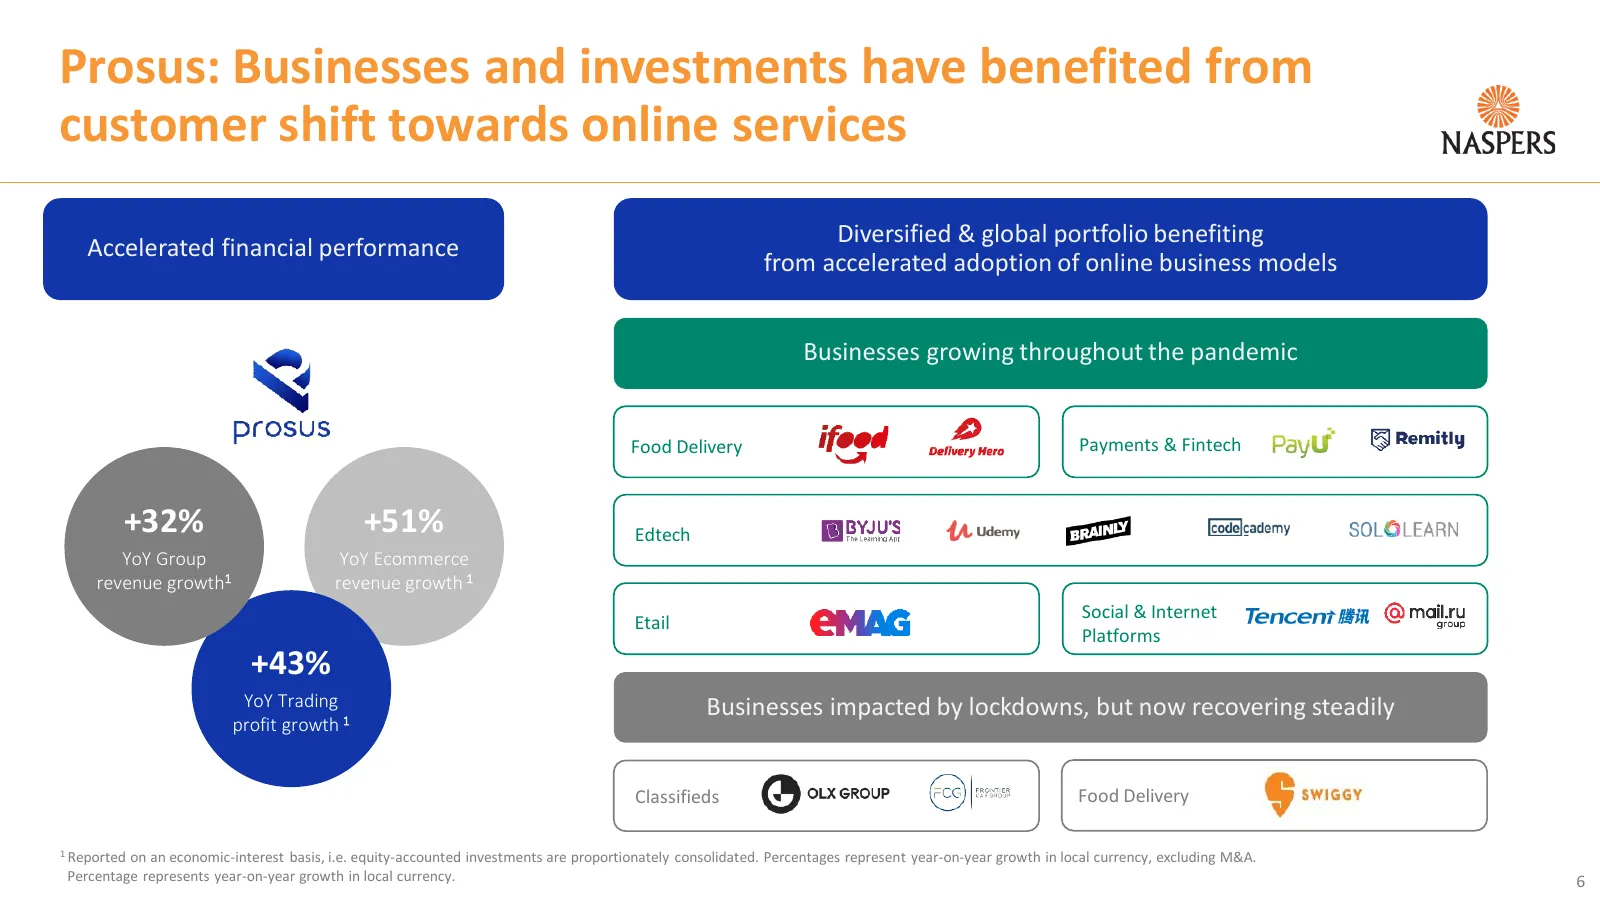
Slide 6: Prosus: Businesses and investments have benefited from customer shift towards online services
Prosus: Businesses and investments have benefited from customer shift towards online services Diversified & global portfolio benefiting Accelerated financial performance from accelerated adoption of online business models Businesses growing throughout the pandemic Food Delivery Payments & Fintech +3
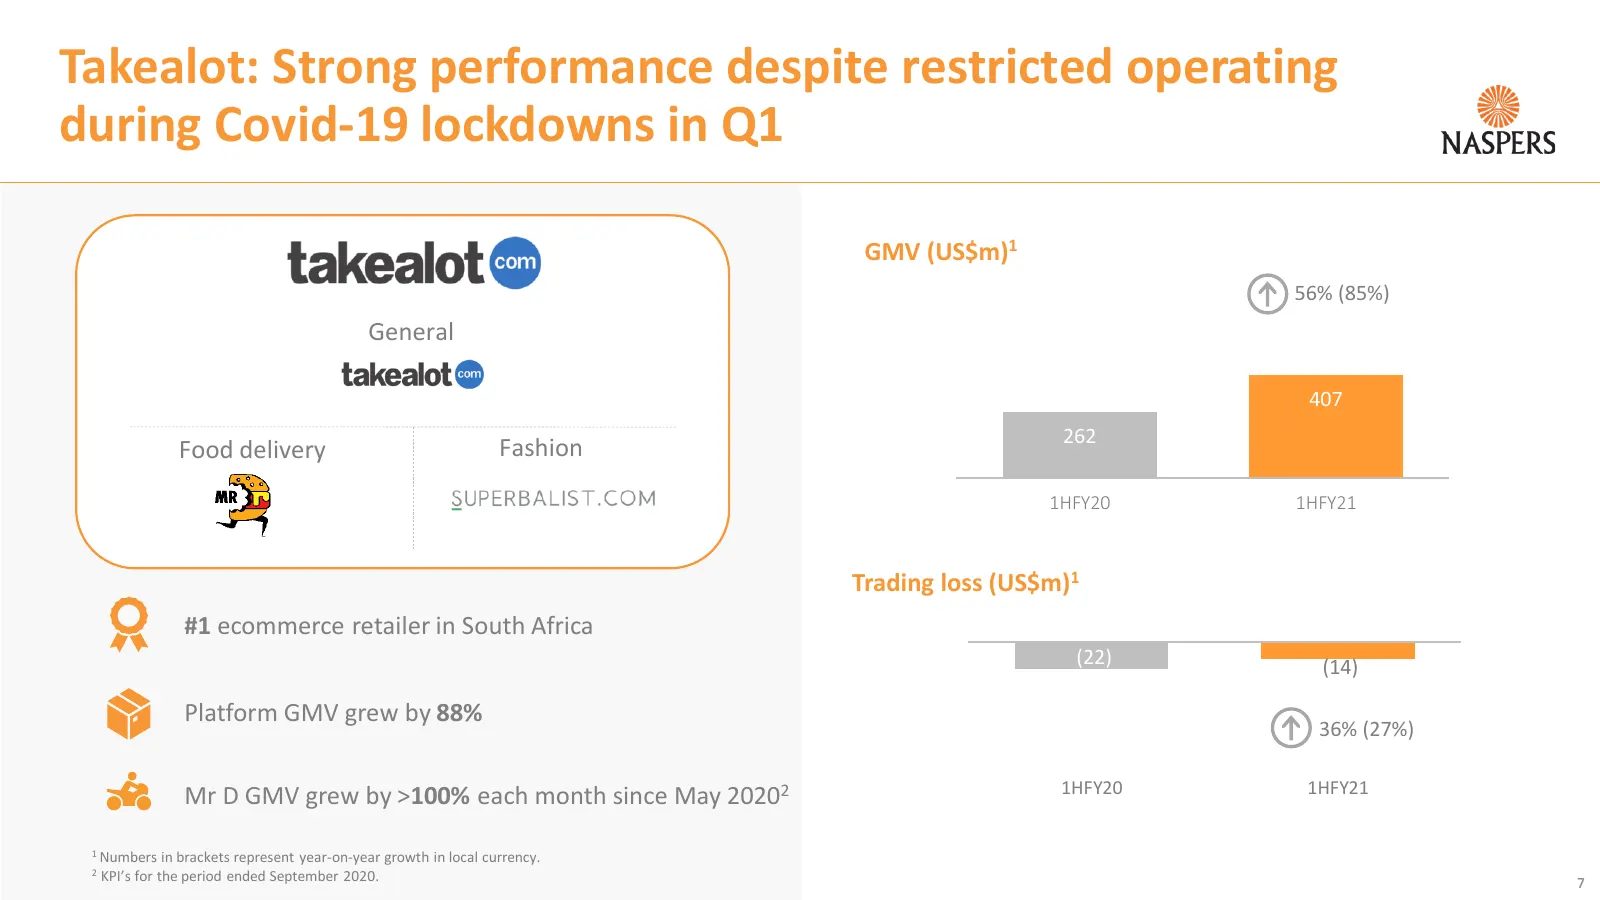
Slide 7: Takealot: Strong performance despite restricted operating during Covid-19 lockdowns in Q1
Takealot: Strong performance despite restricted operating during Covid-19 lockdowns in Q1 GMV (US$m)1 56% (85%) General 407 262 Food delivery Fashion 1HFY20 1HFY21 Trading loss (US$m)1 #1 ecommerce retailer in South Africa (22) (14) Platform GMV grew by 88% 36% (27%) 1HFY20 1HFY21 Mr D GMV grew by >
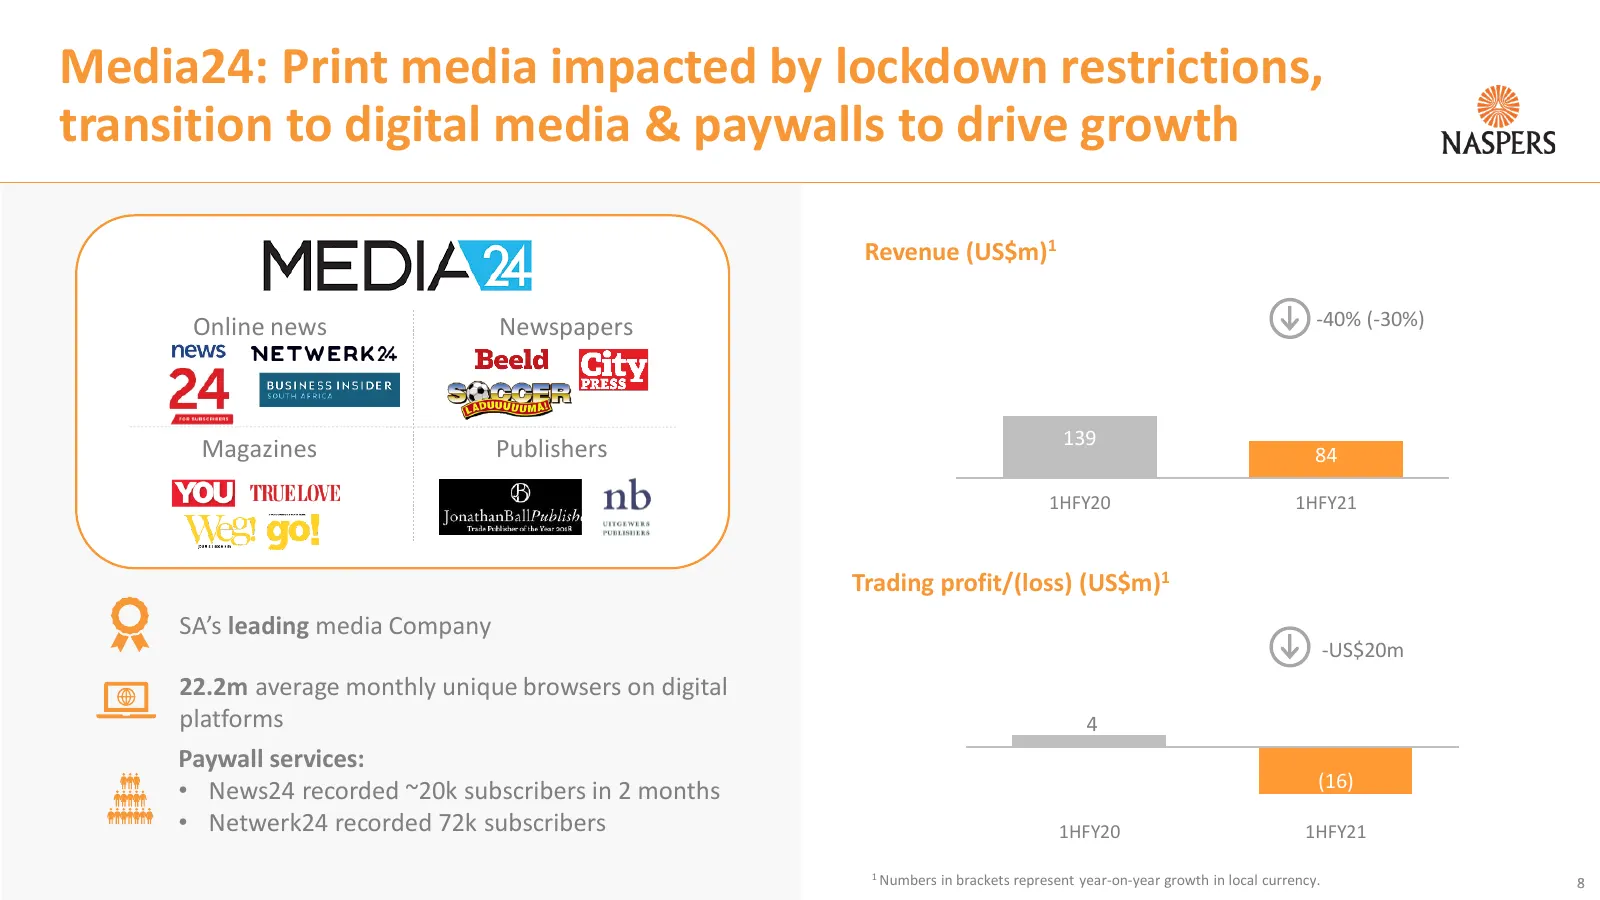
Slide 8: Media24: Print media impacted by lockdown restrictions, transition to digital media & paywalls
Media24: Print media impacted by lockdown restrictions, transition to digital media & paywalls to drive growth Revenue (US$m)1 Online news Newspapers -40% (-30%) 139 Magazines Publishers 84 1HFY20 1HFY21 Trading profit/(loss) (US$m)1 SA’s leading media Company -US$20m 22.2m average monthly unique br
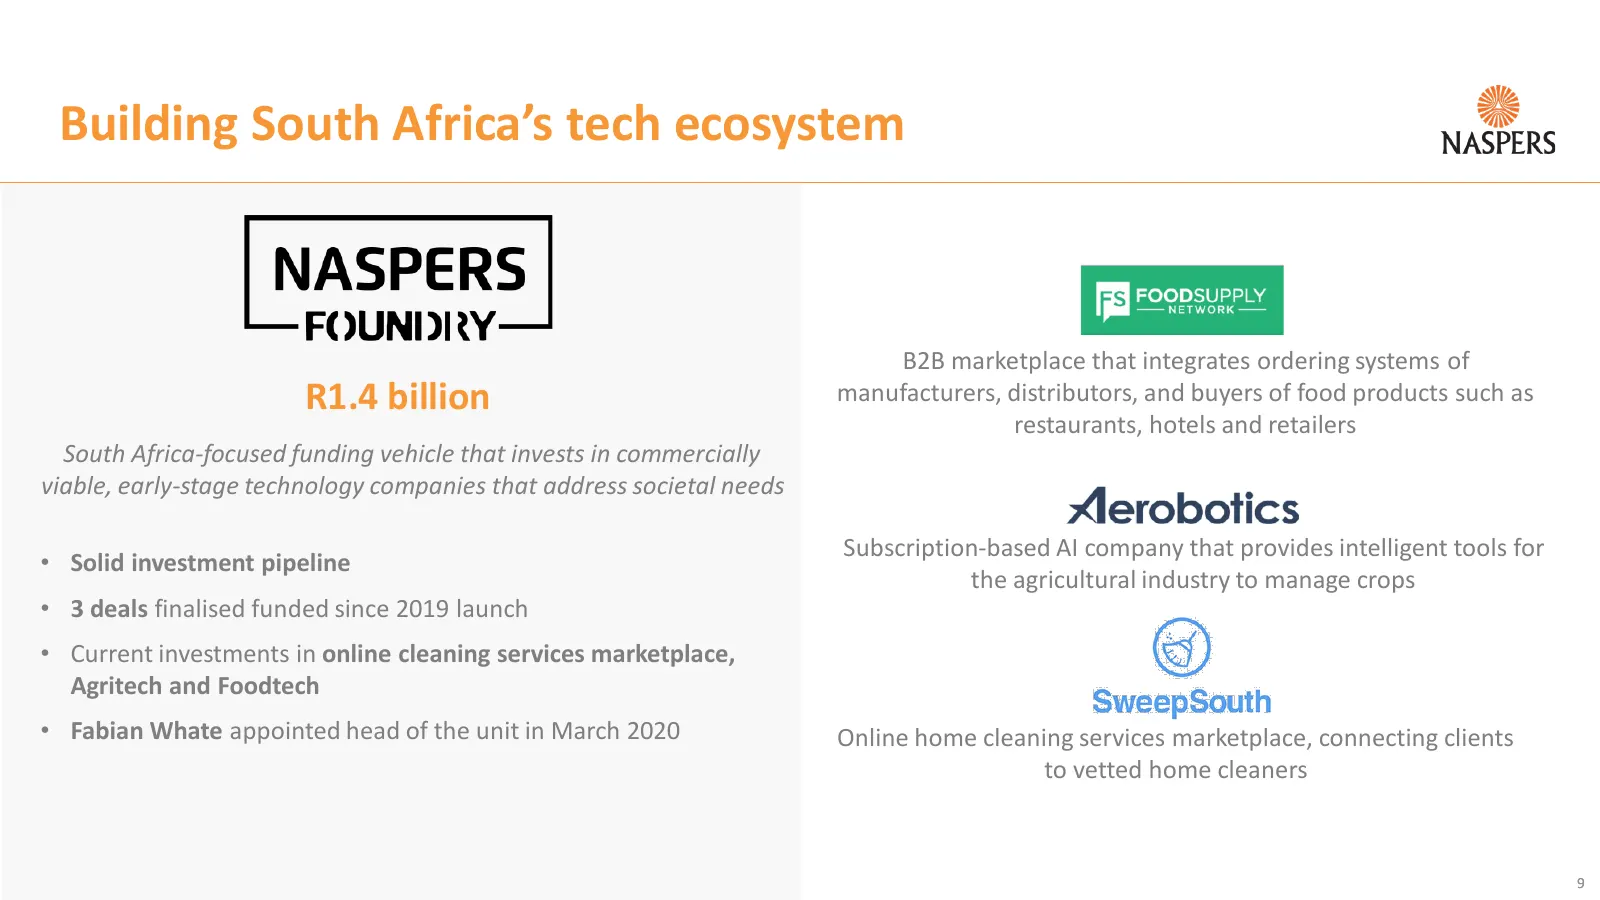
Slide 9: Building South Africa's tech ecosystem
Building South Africa’s tech ecosystem B2B marketplace that integrates ordering systems of R1.4 billion manufacturers, distributors, and buyers of food products such as restaurants, hotels and retailers South Africa-focused funding vehicle that invests in commercially viable, early-stage technology
Slide 10: Contributing to the growth of tech skills in South Africa
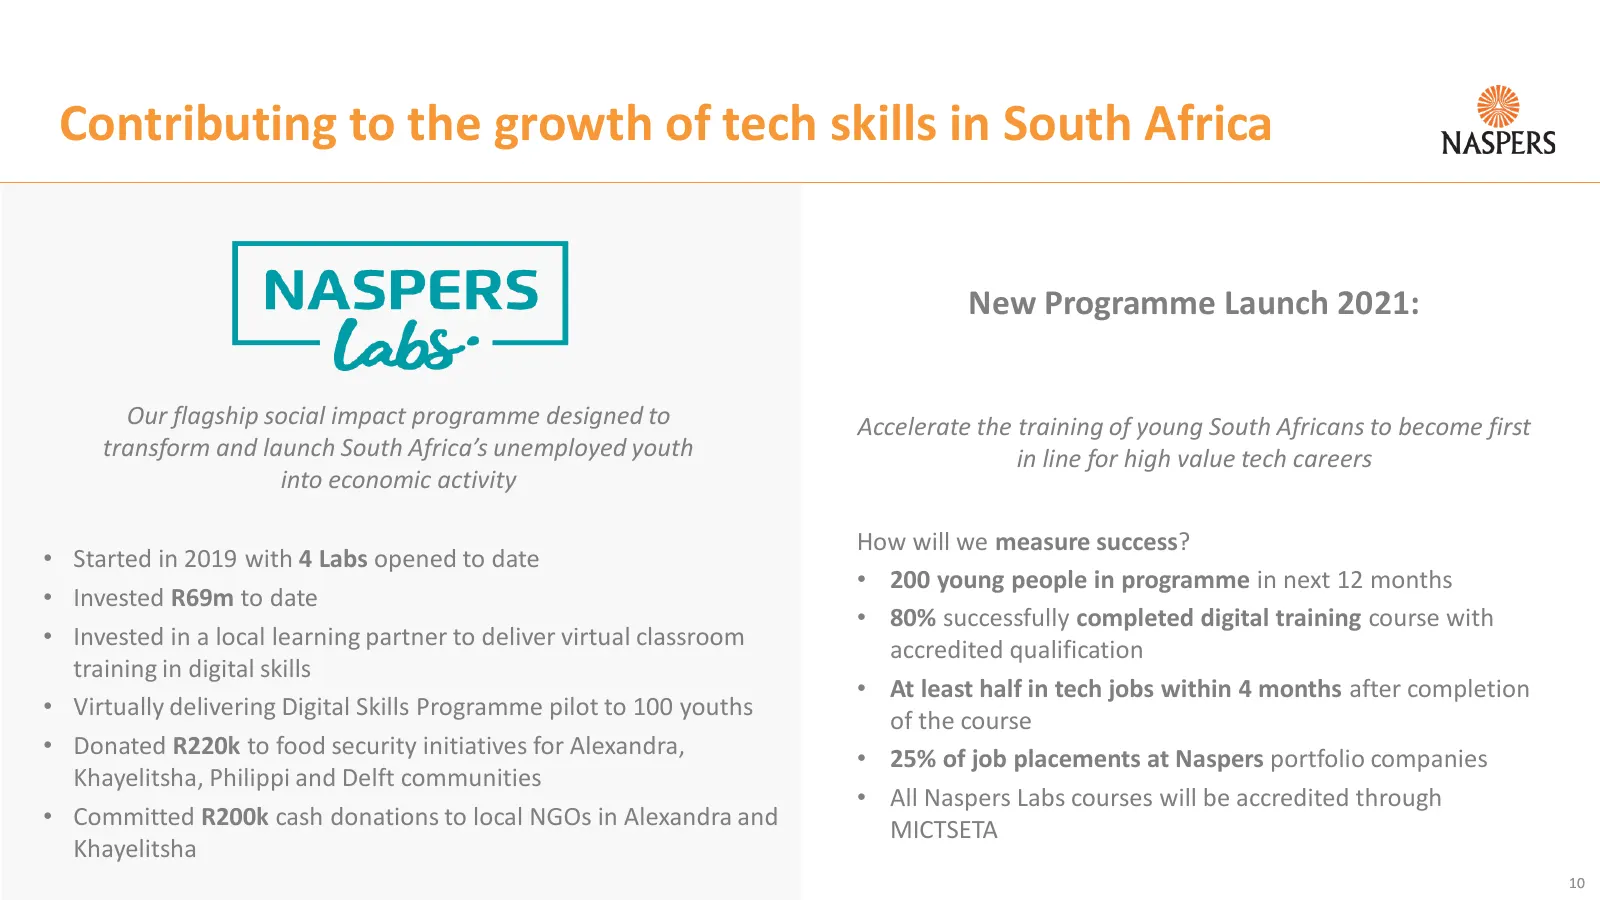
Contributing to the growth of tech skills in South Africa New Programme Launch 2021: Our flagship social impact programme designed to Accelerate the training of young South Africans to become first transform and launch South Africa’s unemployed youth in line for high value tech careers into economic
Slide 11: Supporting our people and South Africa during Covid-19
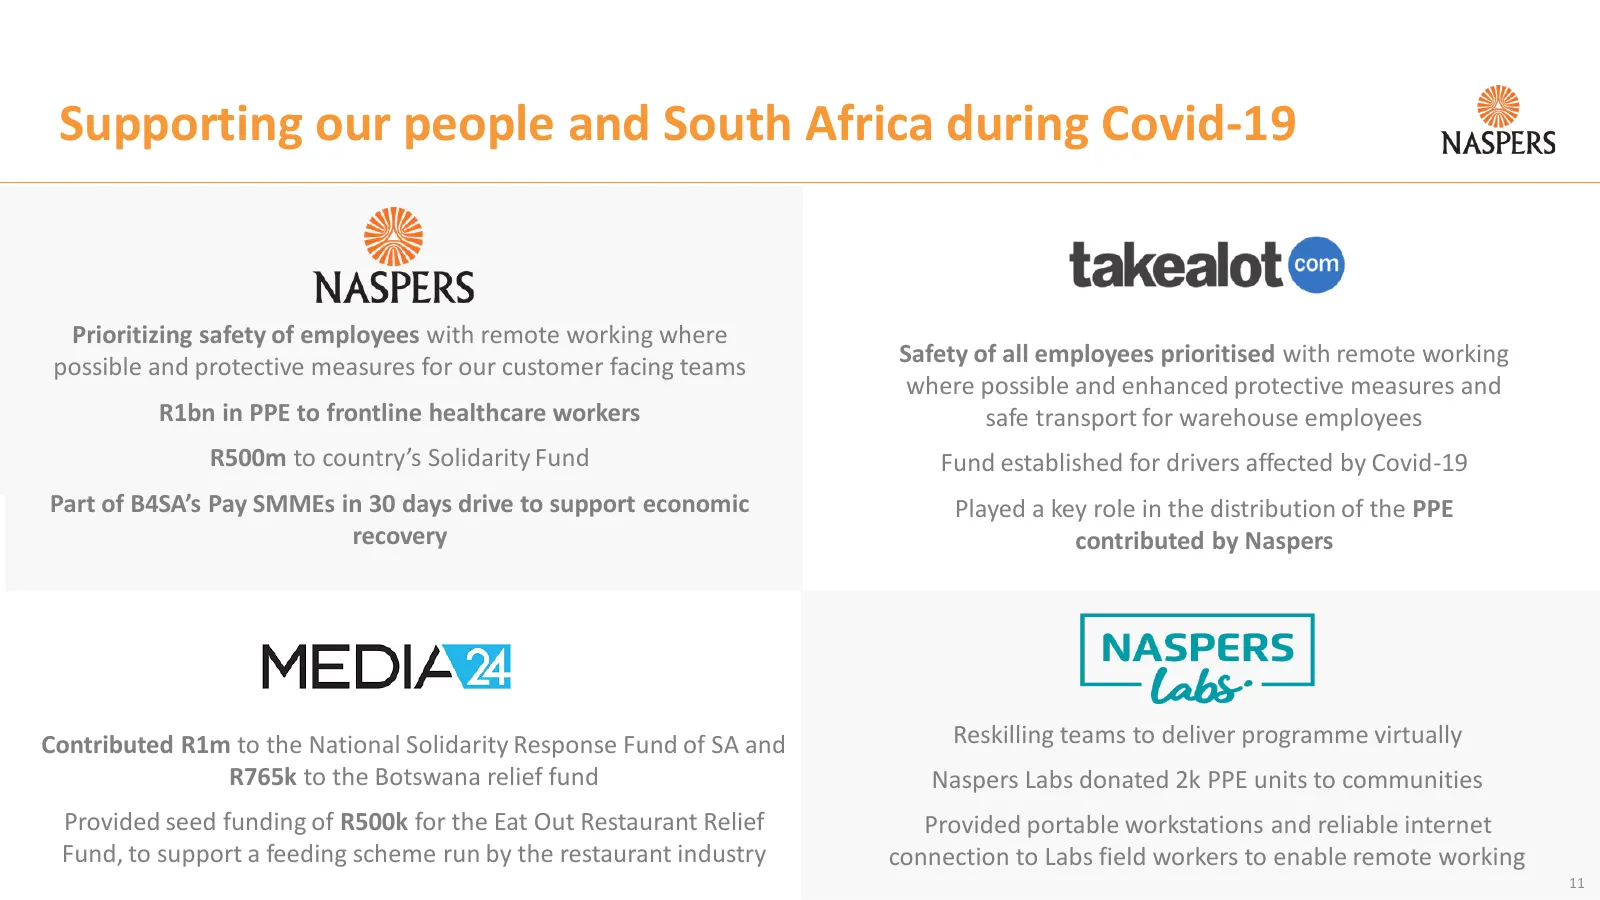
Supporting our people and South Africa during Covid-19 Prioritizing safety of employees with remote working where Safety of all employees prioritised with remote working possible and protective measures for our customer facing teams where possible and enhanced protective measures and R1bn in PPE to

Slide 12: Financial Review
FINANCIAL REVIEW NASPERS
Slide 13: Naspers Summary of Financials
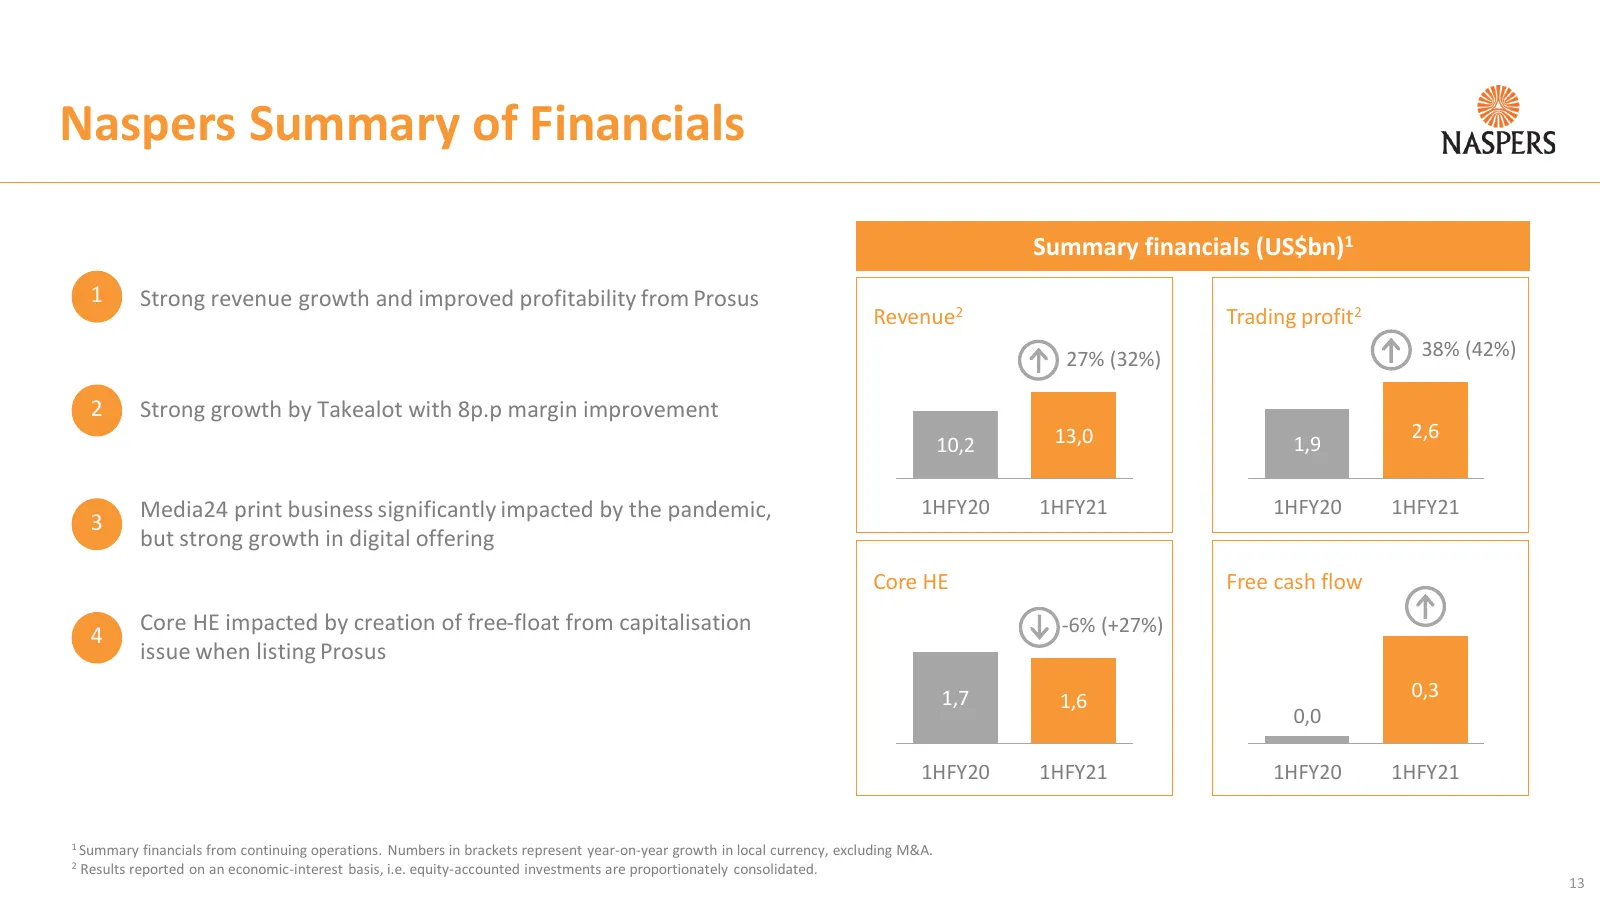
Naspers Summary of Financials Summary financials (US$bn)1 1 Strong revenue growth and improved profitability from Prosus Revenue2 Trading profit2 27% (32%) 38% (42%) 2 Strong growth by Takealot with 8p.p margin improvement 13,0 2,6 10,2 1,9 Media24 print business significantly impacted by the pandem
Slide 14: Composition of the Naspers Group
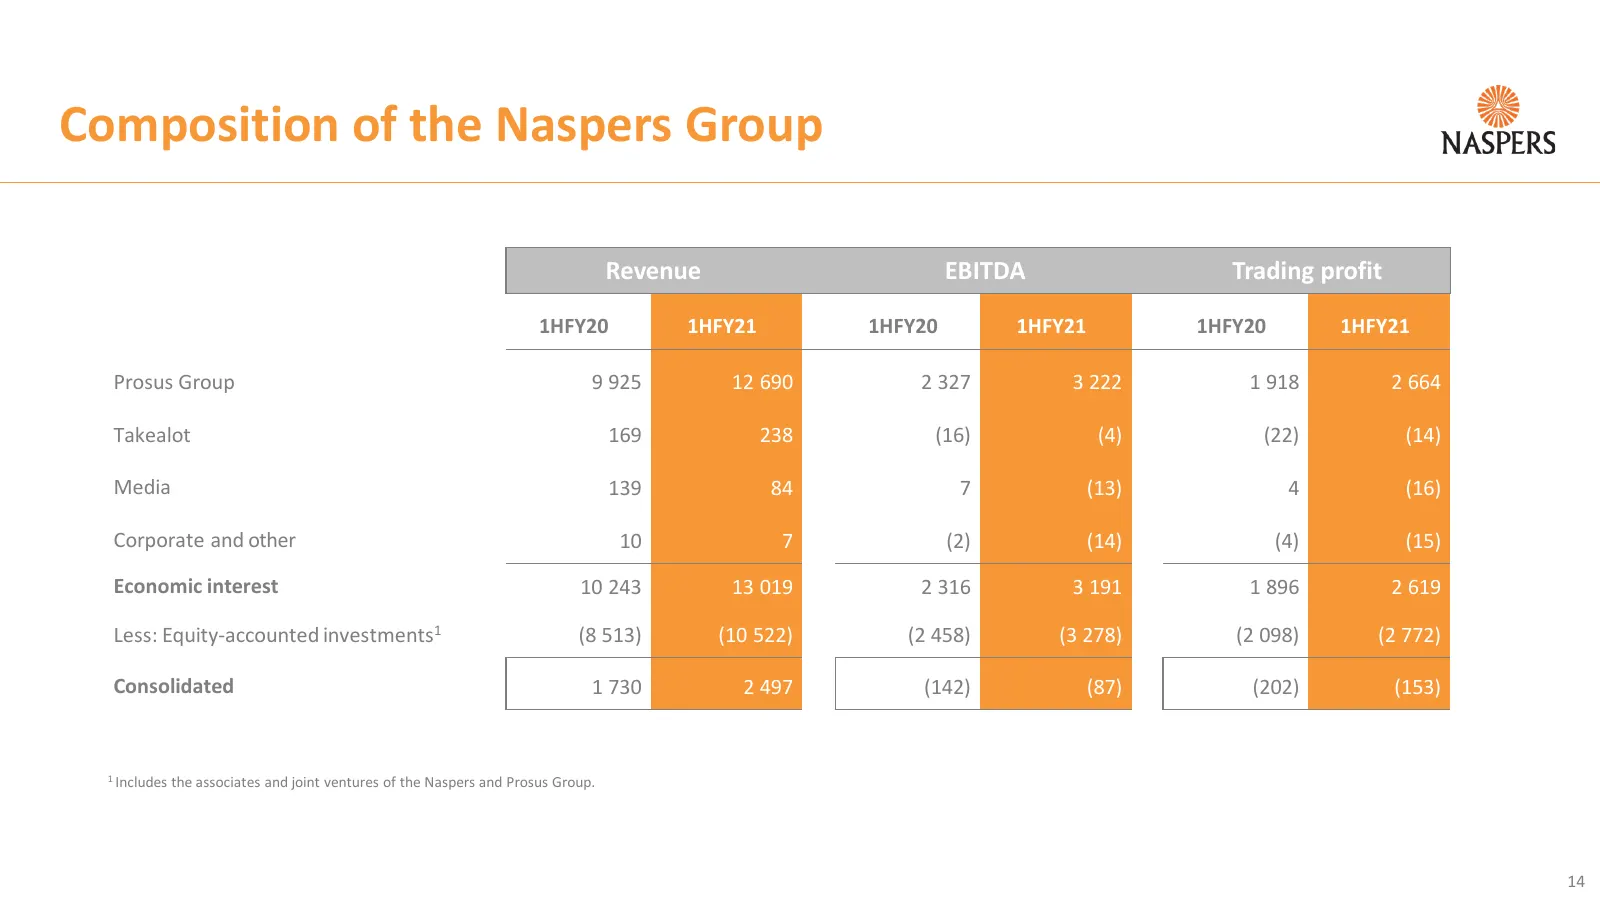
Composition of the Naspers Group Revenue EBITDA Trading profit 1HFY20 1HFY21 1HFY20 1HFY21 1HFY20 1HFY21 Prosus Group 9 925 12 690 2 327 3 222 1 918 2 664 Takealot 169 238 (16) (4) (22) (14) Media 139 84 7 (13) 4 (16) Corporate and other 10 7 (2) (14) (4) (15) Economic interest 10 243 13 019 2 316 3
Slide 15: Core headline earnings reconciliation
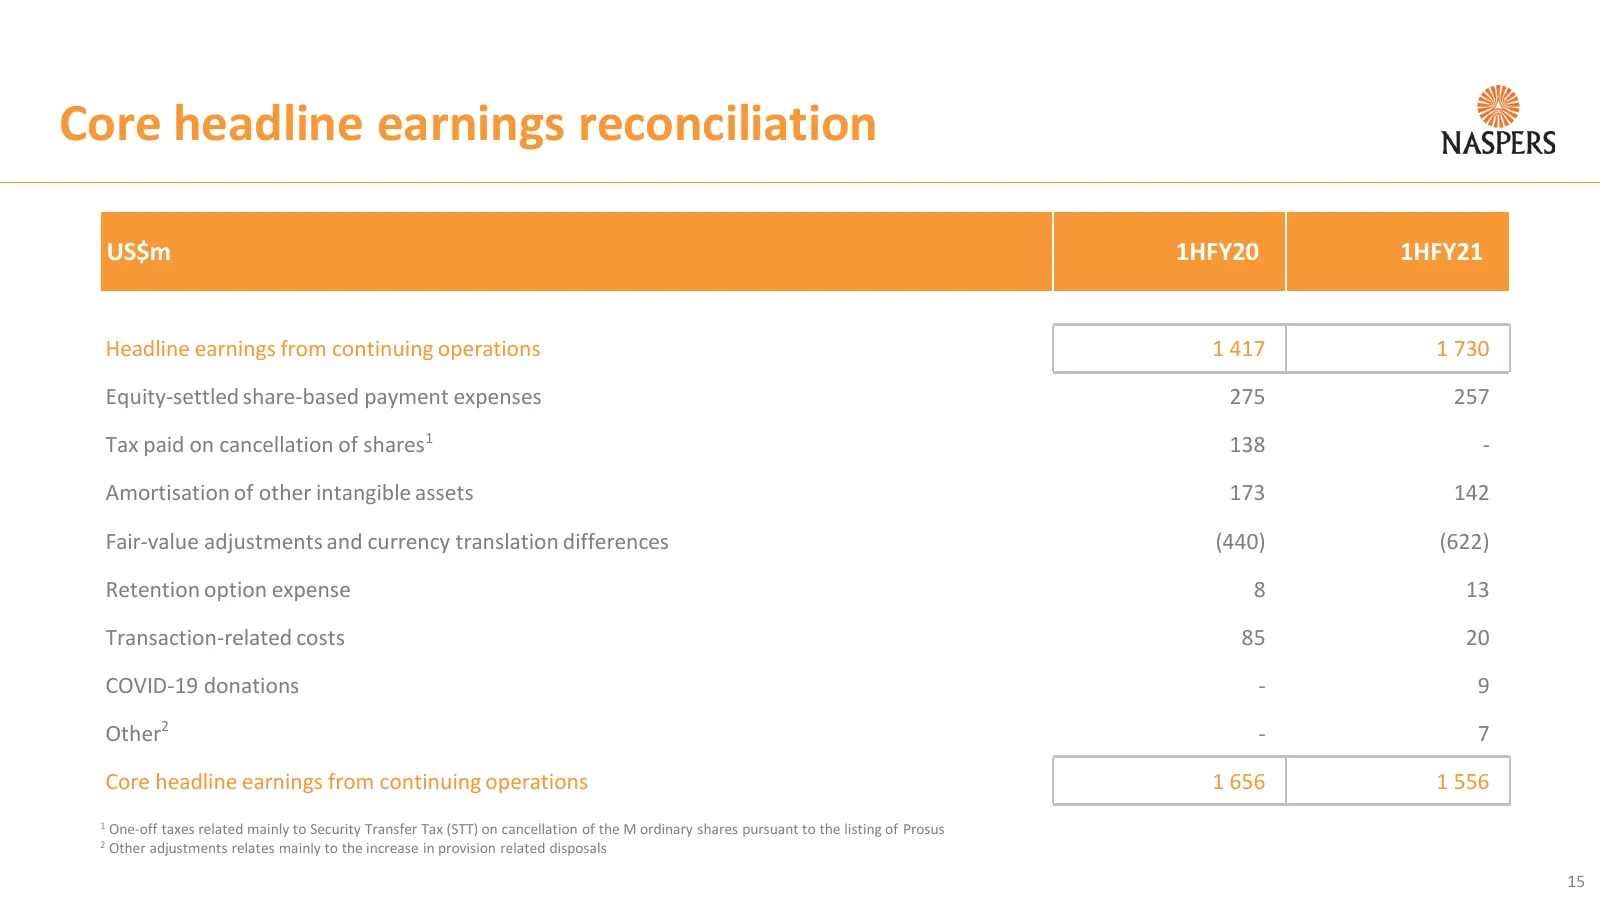
Core headline earnings reconciliation US$m 1HFY20 1HFY21 Headline earnings from continuing operations 1 417 1 730 Equity-settled share-based payment expenses 275 257 Tax paid on cancellation of shares1 138 - Amortisation of other intangible assets 173 142 Fair-value adjustments and currency translat
Slide 16: Net cash profile
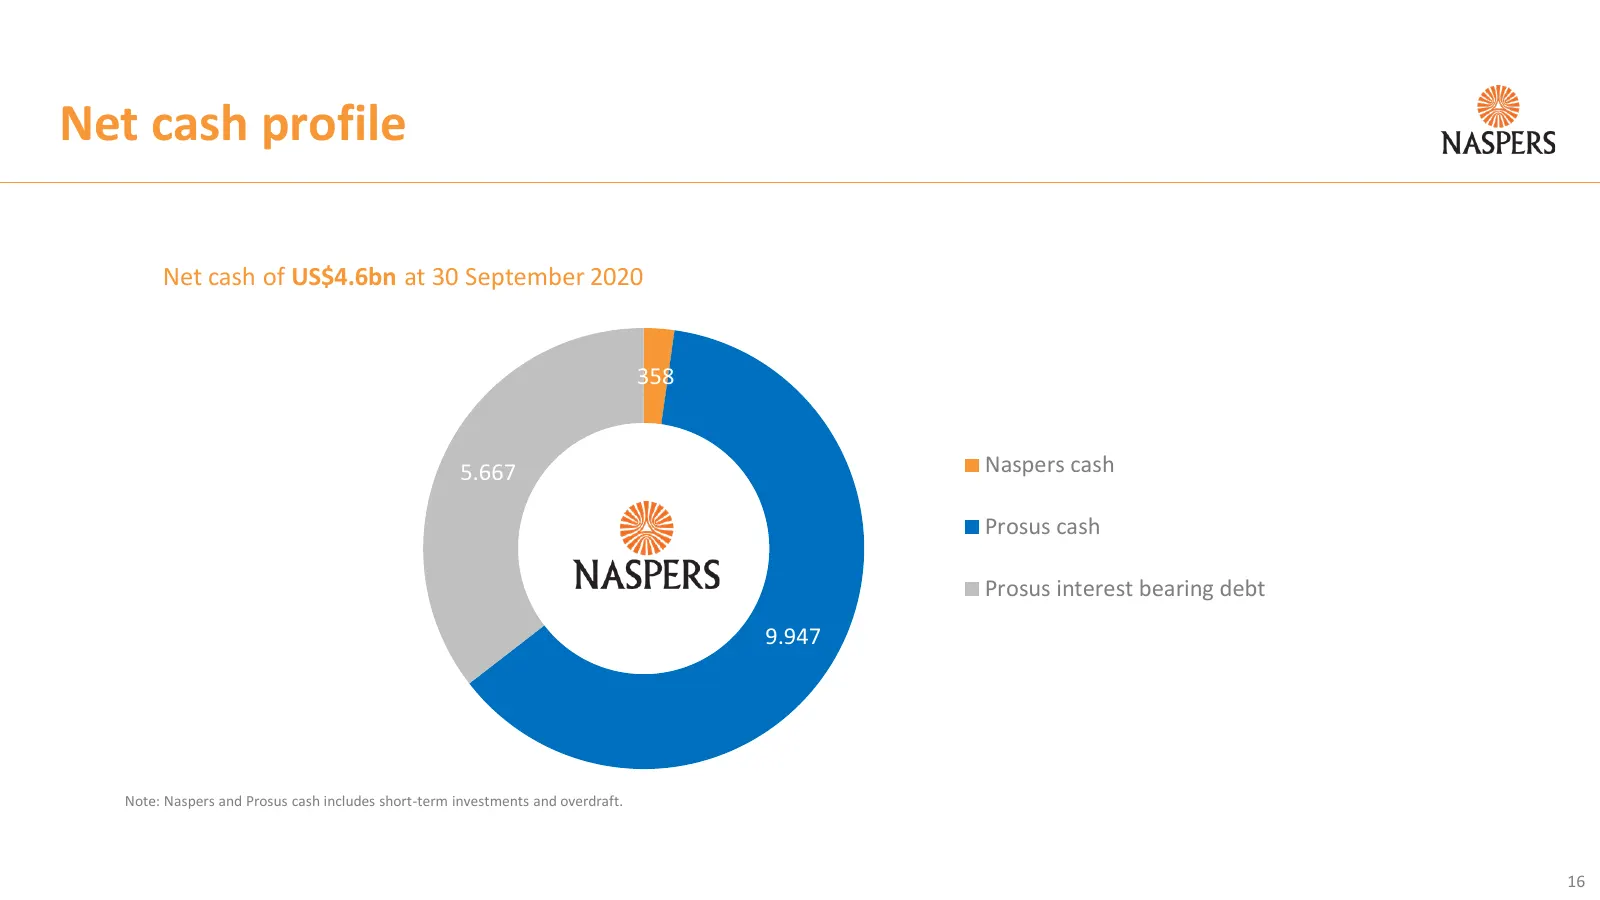
Net cash profile Net cash of US$4.6bn at 30 September 2020 358 5.667 Naspers cash Prosus cash Prosus interest bearing debt 9.947 Note: Naspers and Prosus cash includes short-term investments and overdraft. 16
Slide 17: Current assets and liabilities
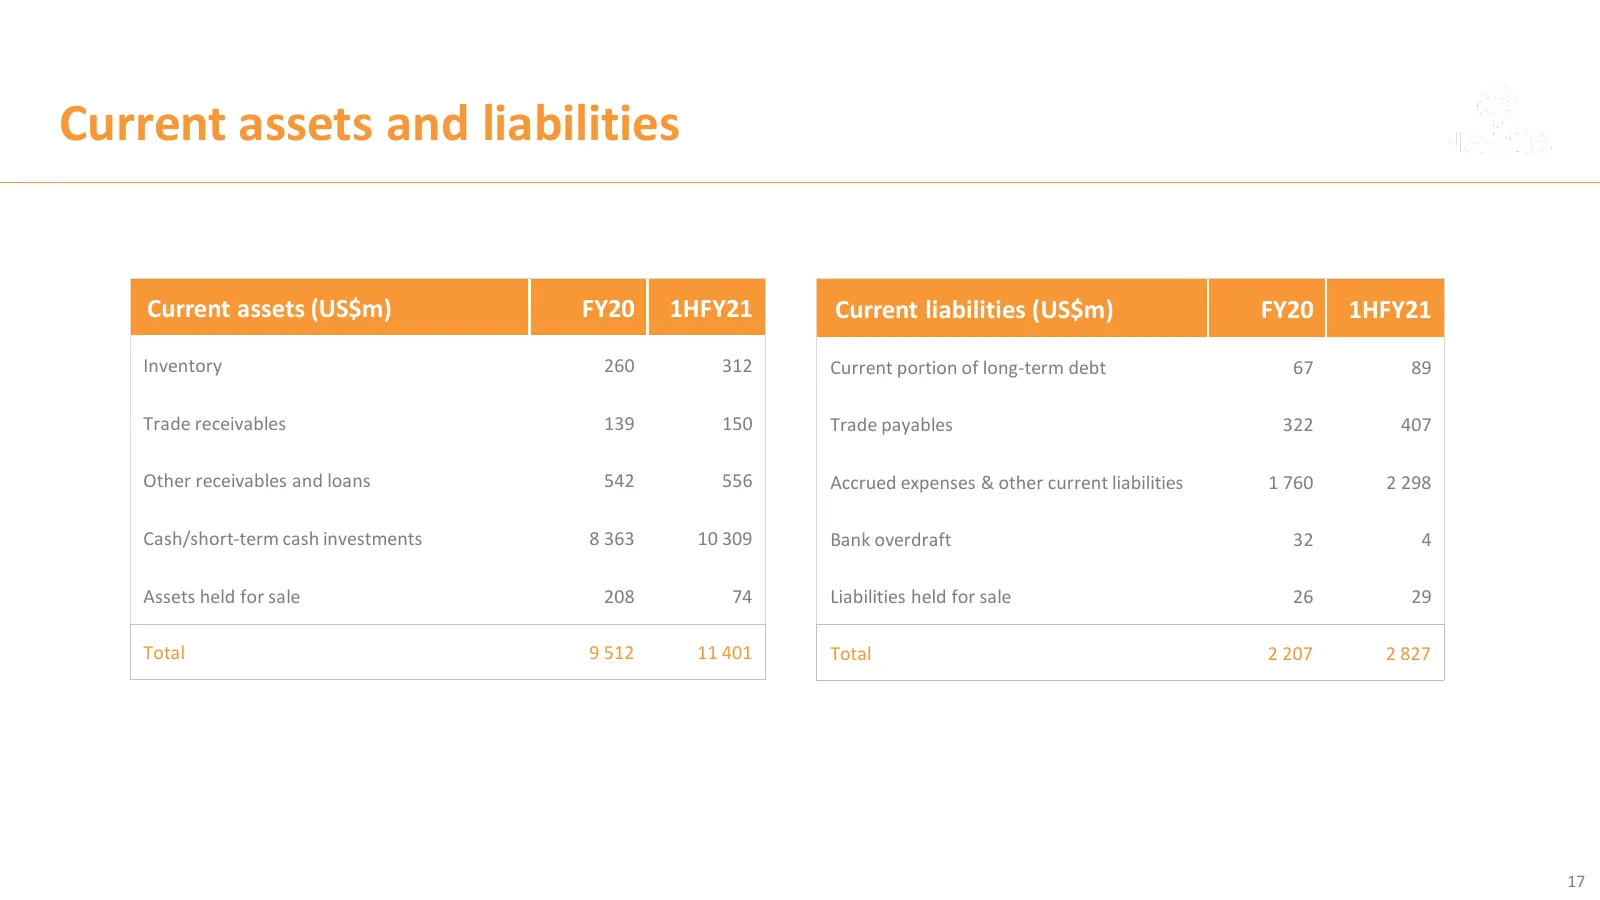
Current assets and liabilities Current assets (US$m) FY20 1HFY21 Current liabilities (US$m) FY20 1HFY21 Inventory 260 312 Current portion of long-term debt 67 89 Trade receivables 139 150 Trade payables 322 407 Other receivables and loans 542 556 Accrued expenses & other current liabilities 1 760 2
Slide 18: Glossary
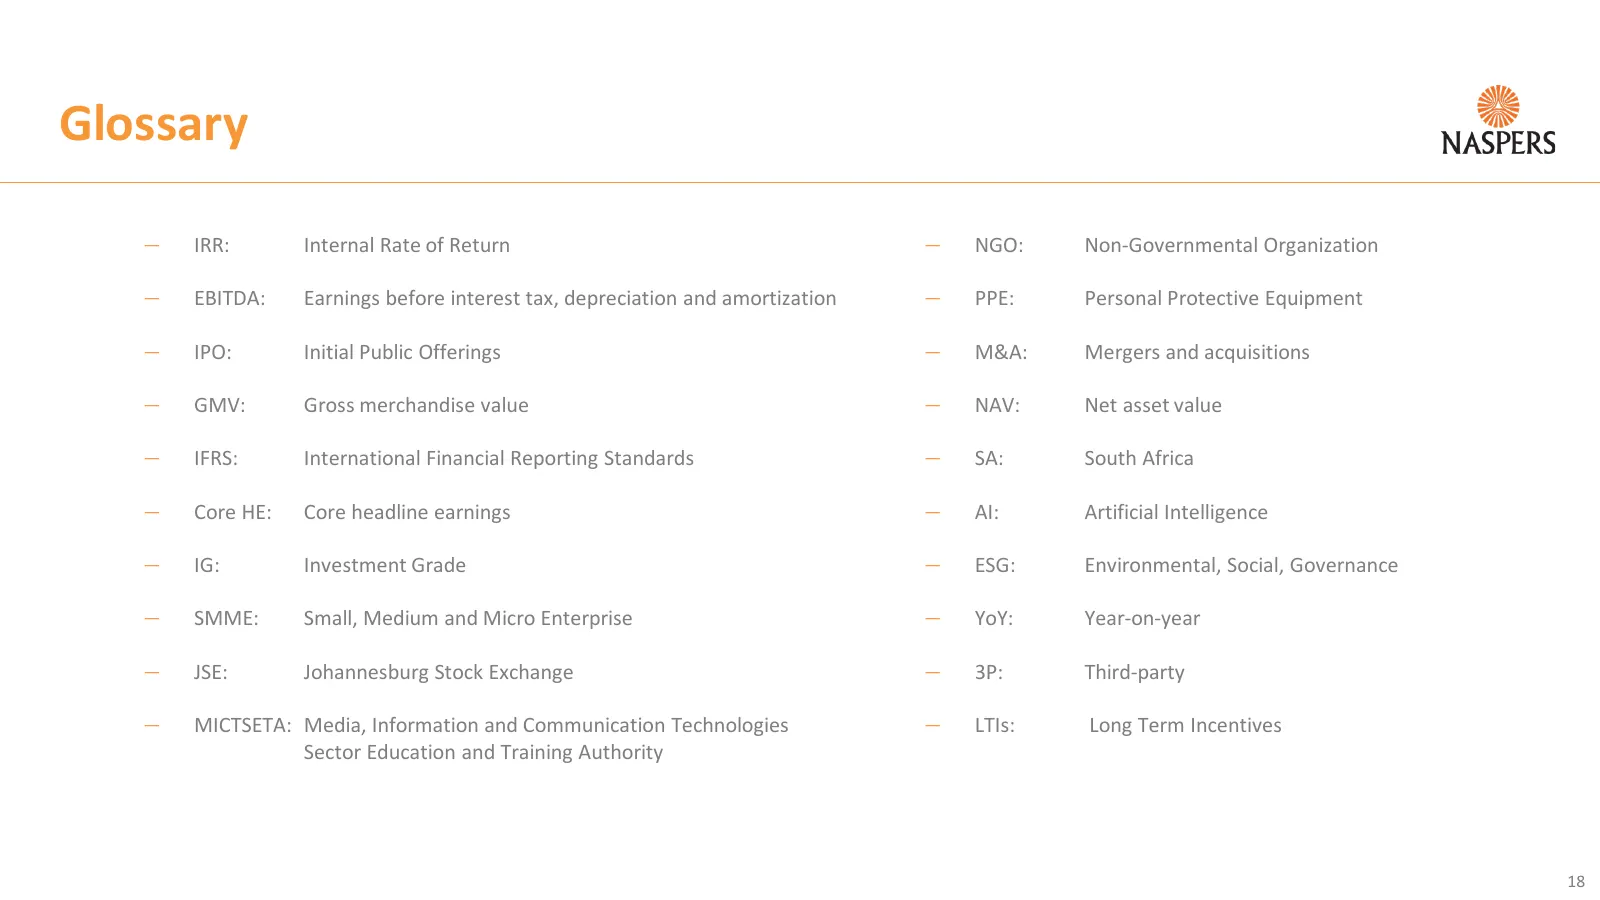
Glossary — IRR: Internal Rate of Return — NGO: Non-Governmental Organization — EBITDA: Earnings before interest tax, depreciation and amortization — PPE: Personal Protective Equipment — IPO: Initial Public Offerings — M&A: Mergers and acquisitions — GMV: Gross merchandise value — NAV: Net asset valu
Slide 19: Naspers Group portfolio
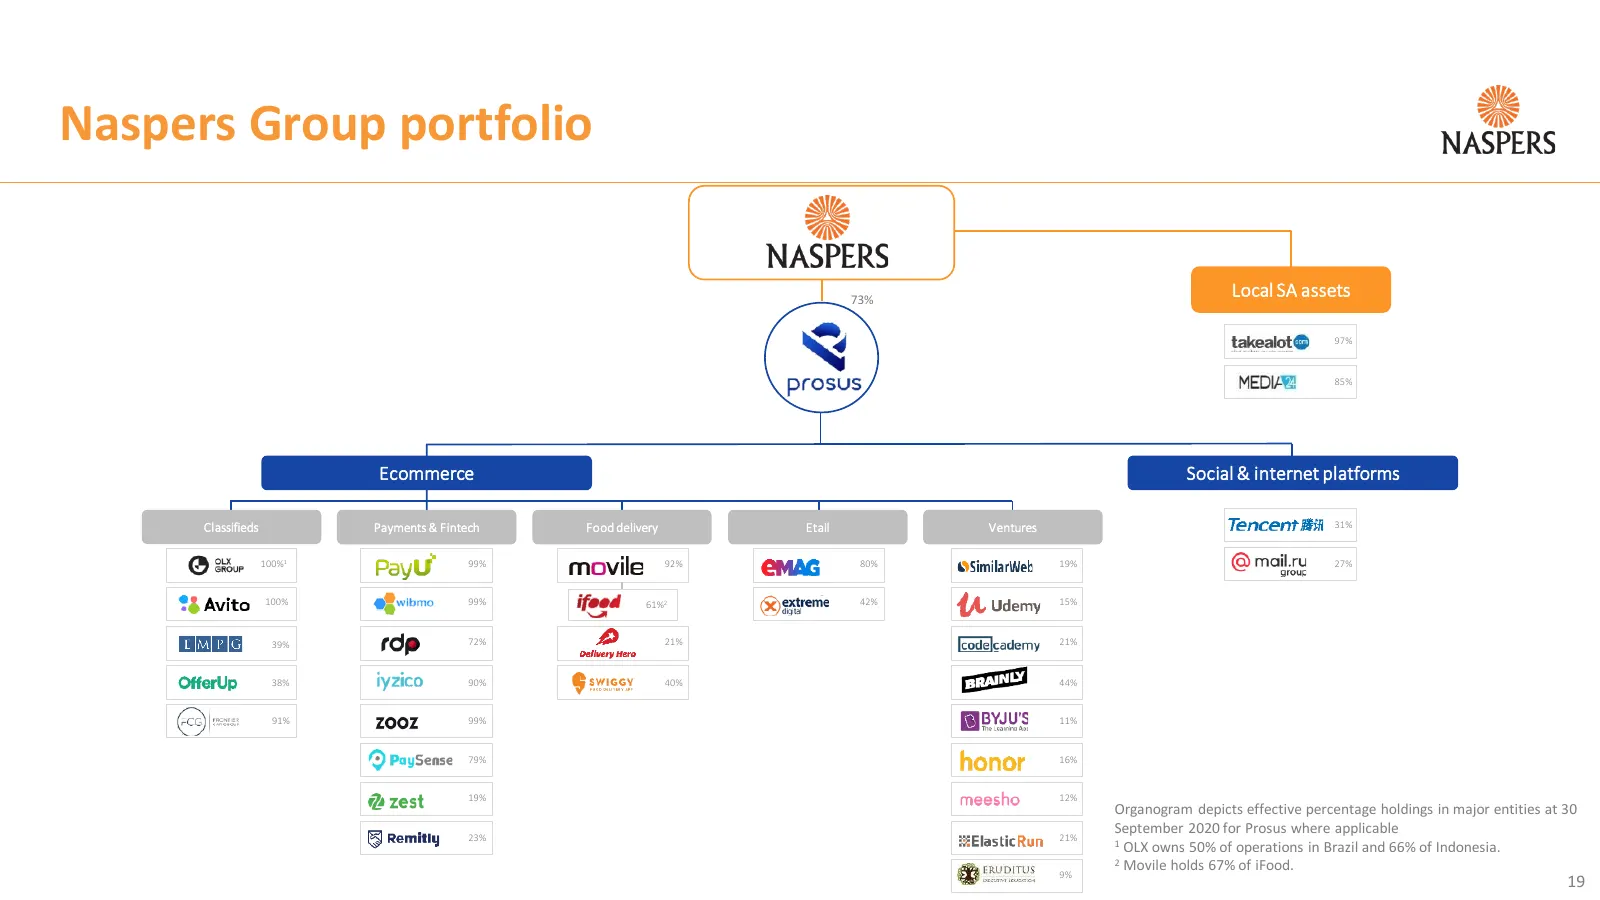
Naspers Group portfolio 73% Local SA assets 97% 85% Ecommerce Social & internet platforms Classifieds Payments & Fintech Food delivery Etail Ventures 31% 100%1 99% 92% 80% 19% 27% 100% 99% 61%2 42% 15% 39% 72% 21% 21% 38% 90% 40% 44% 91% 99% 11% 79% 16% 19% 12% Organogram depicts effective percentag
Slide 20: Contact us
Contact us Eoin Ryan (Head of Investor Relations) InvestorRelations@Naspers.com https://www.naspers.com/ 20
Source: Internet Archive copy of naspers.com
More decks from Naspers Limited Class N
 FY2026 Earnings Presentation60 slides · Jun 29, 2026
 FY2026 Earnings Presentation17 slides · Mar 31, 2026
 H1 2026 Earnings Presentation64 slides · Nov 24, 2025
 H1 FY26 Earnings Presentation17 slides · November 2025
 FY2025 Earnings Presentation51 slides · June 2025
 FY2025 Earnings Presentation17 slides · 2025