CMS Info Systems Ltd. · NSE:CMSINFO
CMS Info Systems — Q1 FY2025 Earnings Presentation
25 slides from CMS Info Systems's earnings presentation, September 2024

Slide 1: Earnings Presentation Q1'FY25
Earnings Presentation Q1’FY25 G R O W T H T H R O U G H T R A N S F O R M A T I O N
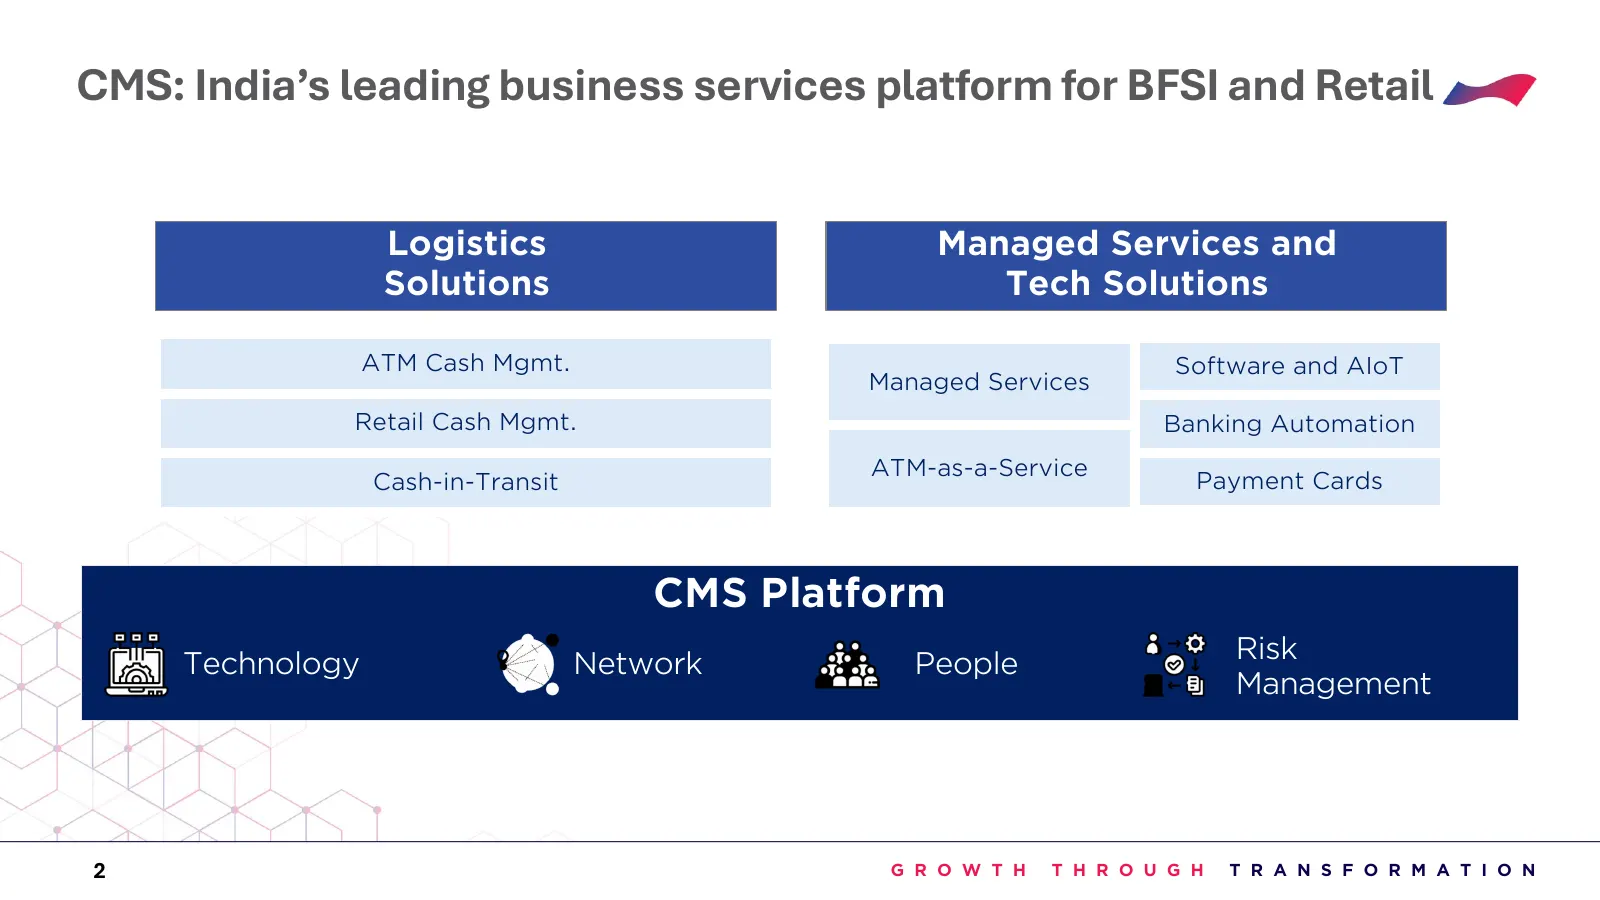
Slide 2: CMS: India's leading business services platform for BFSI and Retail
CMS: India’s leading business services platform for BFSI and Retail Logistics Managed Services and Solutions Tech Solutions ATM Cash Mgmt. Software and AIoT Managed Services Retail Cash Mgmt. Banking Automation ATM-as-a-Service Cash-in-Transit Payment Cards CMS Platform Technology Network People Ris
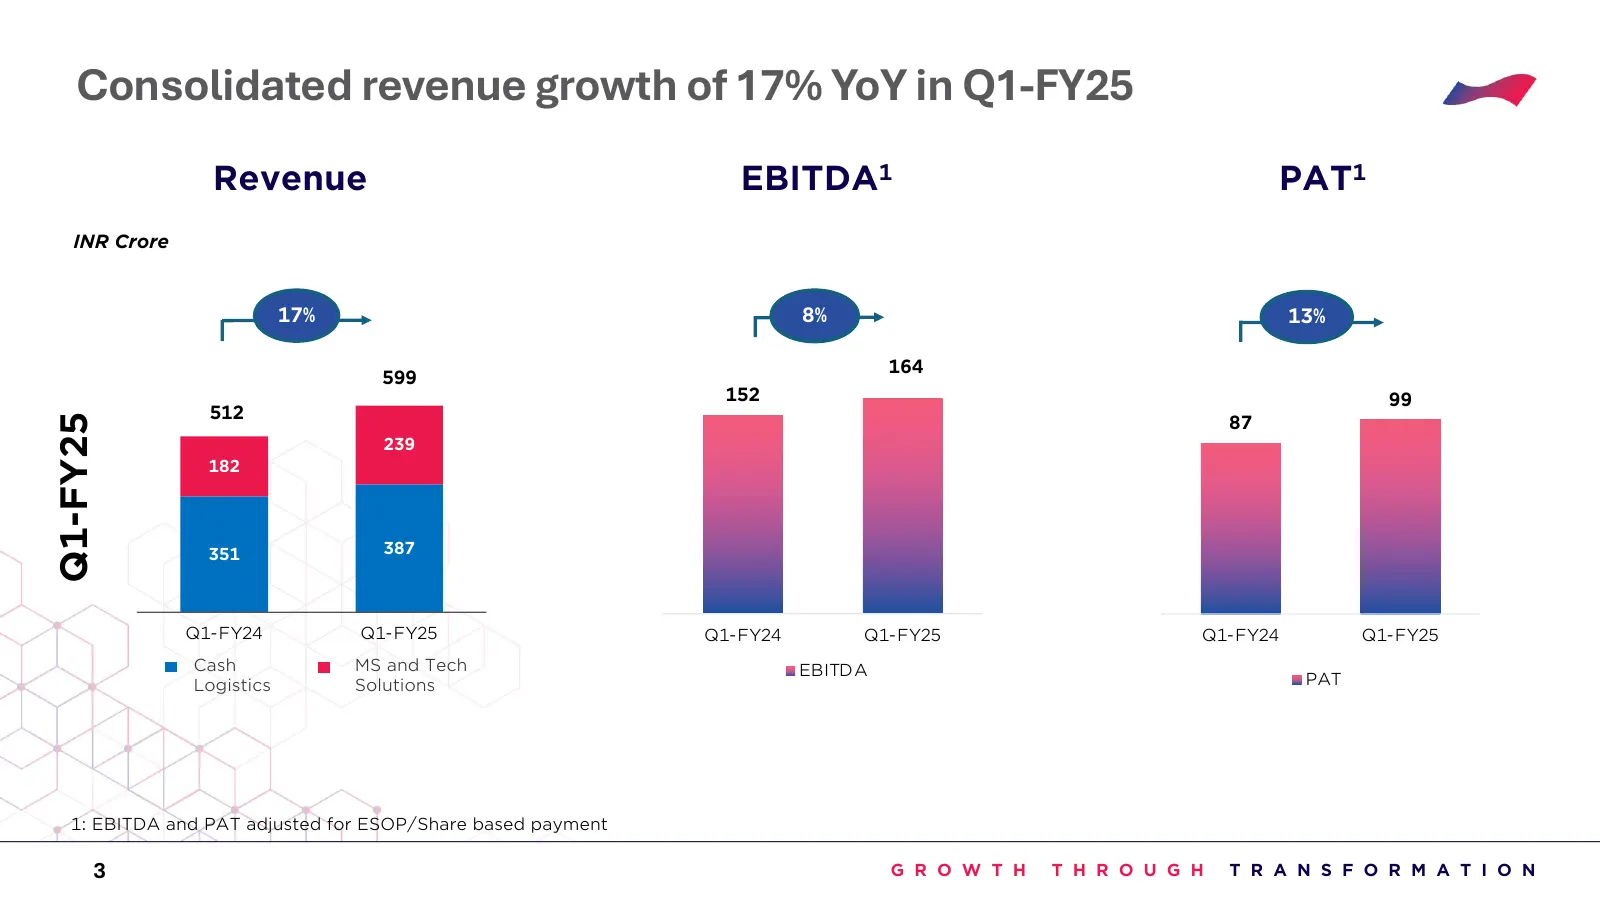
Slide 3: Consolidated revenue growth of 17% YoY in Q1-FY25
Consolidated revenue growth of 17% YoY in Q1-FY25 Revenue EBITDA1 PAT1 INR Crore 17% 8% 40% 13% 164 599 152 99 512 87 Q1-FY25 239 182 351 387 Q1-FY24 Q1-FY25 Q1-FY24 Q1-FY25 Q1-FY24 Q1-FY25 Cash MS and Tech EBITDA Logistics Solutions PAT 1: EBITDA and PAT adjusted for ESOP/Share based payment 3 G R
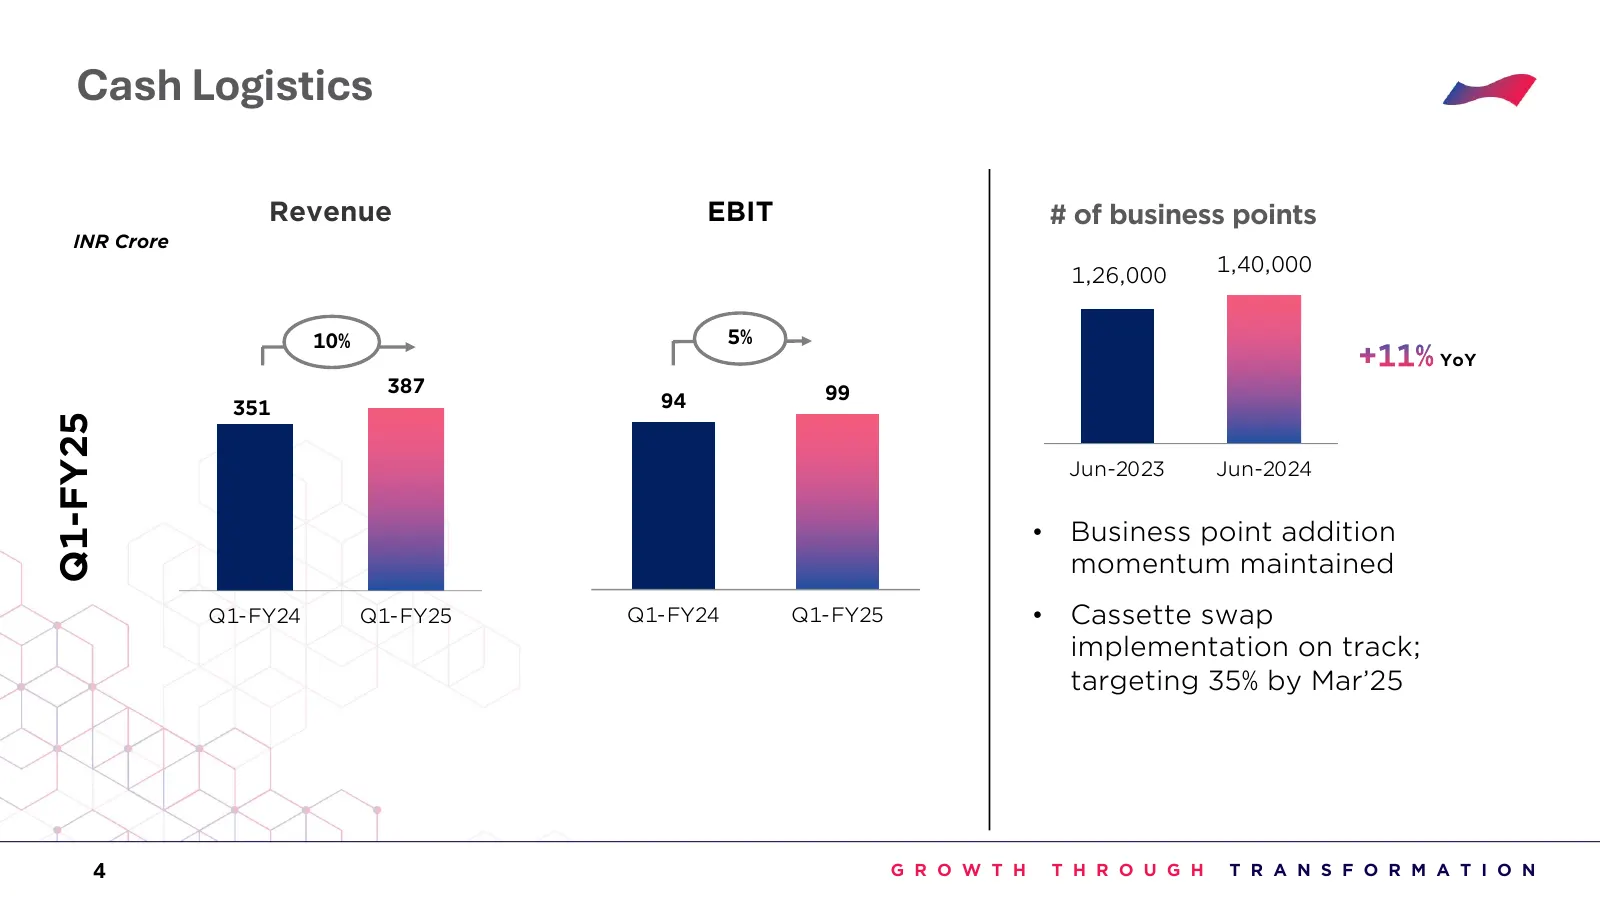
Slide 4: Cash Logistics
Cash Logistics Revenue EBIT # of business points INR Crore 1,40,000 1,26,000 10% 5% YoY 387 99 351 94 Q1-FY25 Jun-2023 Jun-2024 • Business point addition momentum maintained Q1-FY24 Q1-FY25 Q1-FY24 Q1-FY25 • Cassette swap implementation on track; targeting 35% by Mar’25 4 G R O W T H T H R O U G H T
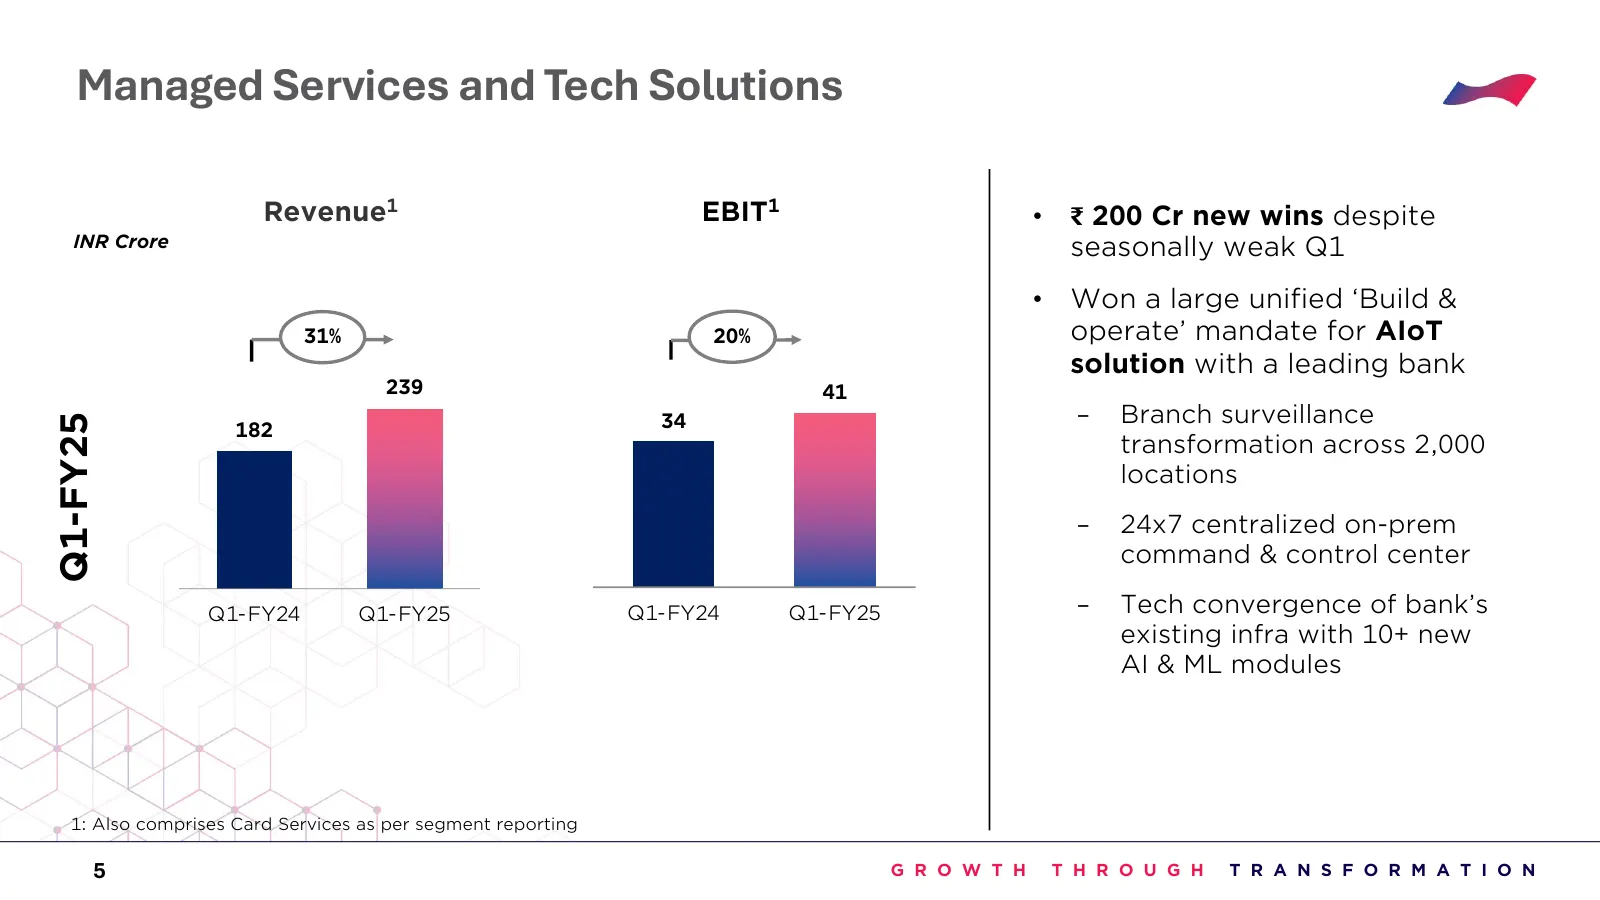
Slide 5: Managed Services and Tech Solutions
Managed Services and Tech Solutions Revenue1 EBIT1 • ₹ 200 Cr new wins despite INR Crore seasonally weak Q1 • Won a large unified ‘Build & 31% 20% operate’ mandate for AIoT solution with a leading bank 239 41 34 − Branch surveillance Q1-FY25 182 transformation across 2,000 locations − 24x7 centraliz
Slide 6: Track record of delivering high revenue and earnings growth
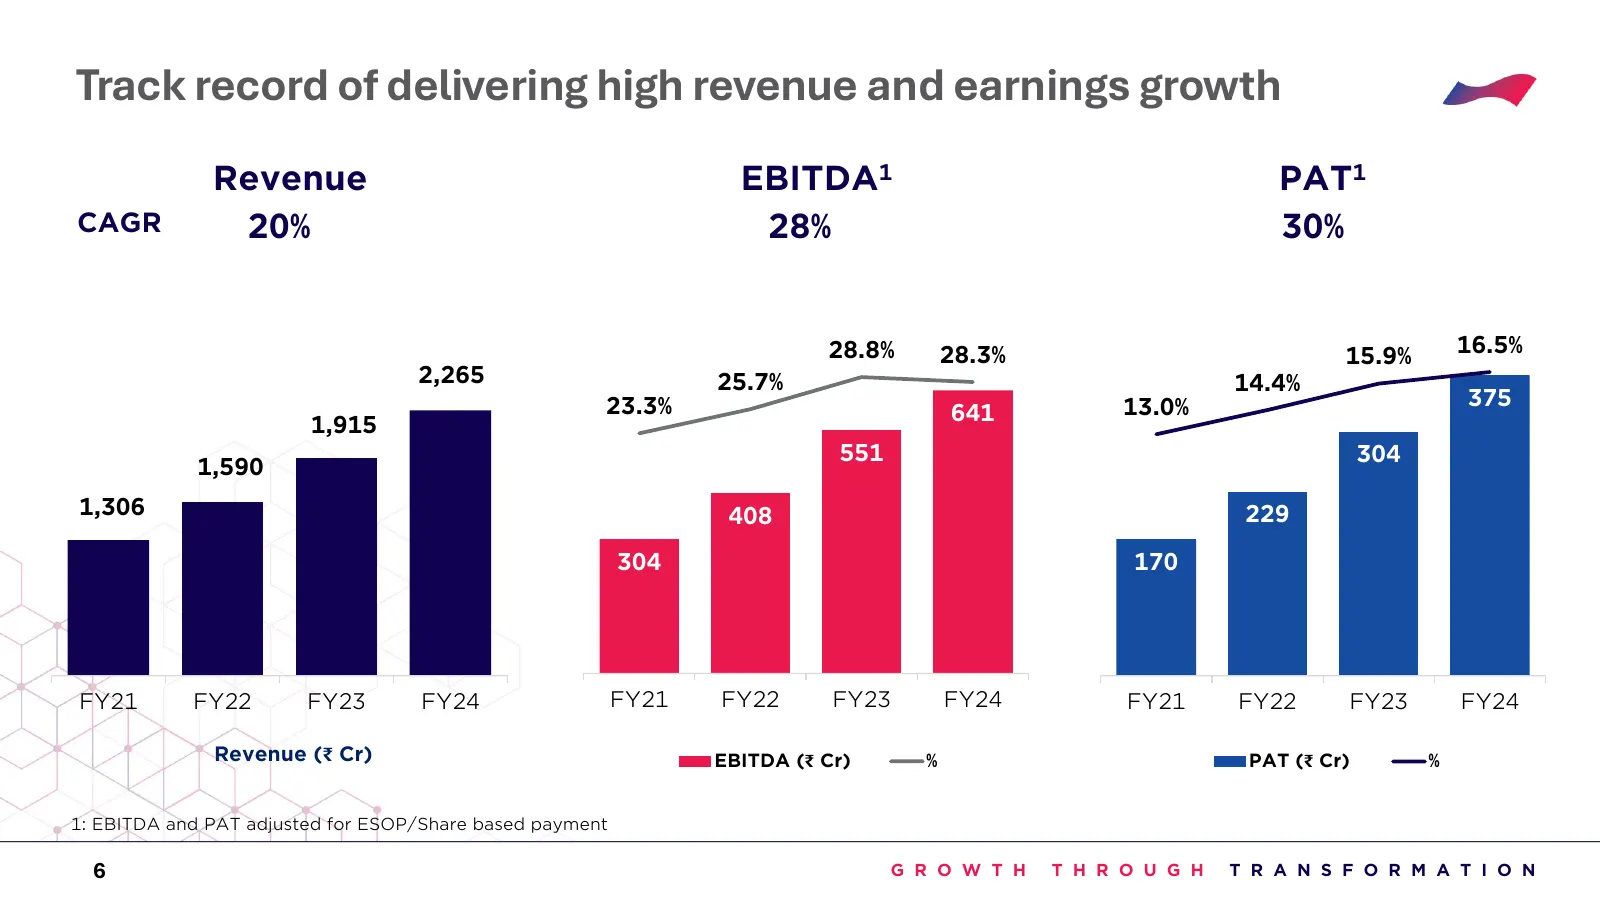
Track record of delivering high revenue and earnings growth Revenue EBITDA1 PAT1 CAGR 20% 28% 30% 28.8% 28.3% 400 15.9% 16.5% 700 30.0% 2,265 25.7% 14.4% 600 23.3% 350 13.0% 375 641 25.0% 1,915 300 500 551 304 1,590 20.0% 250 400 1,306 408 200 15.0% 229 300 150 304 10.0% 170 200 100 100 5.0% 50 0 0.
Slide 7: High cash flow generation with strong capital allocation discipline
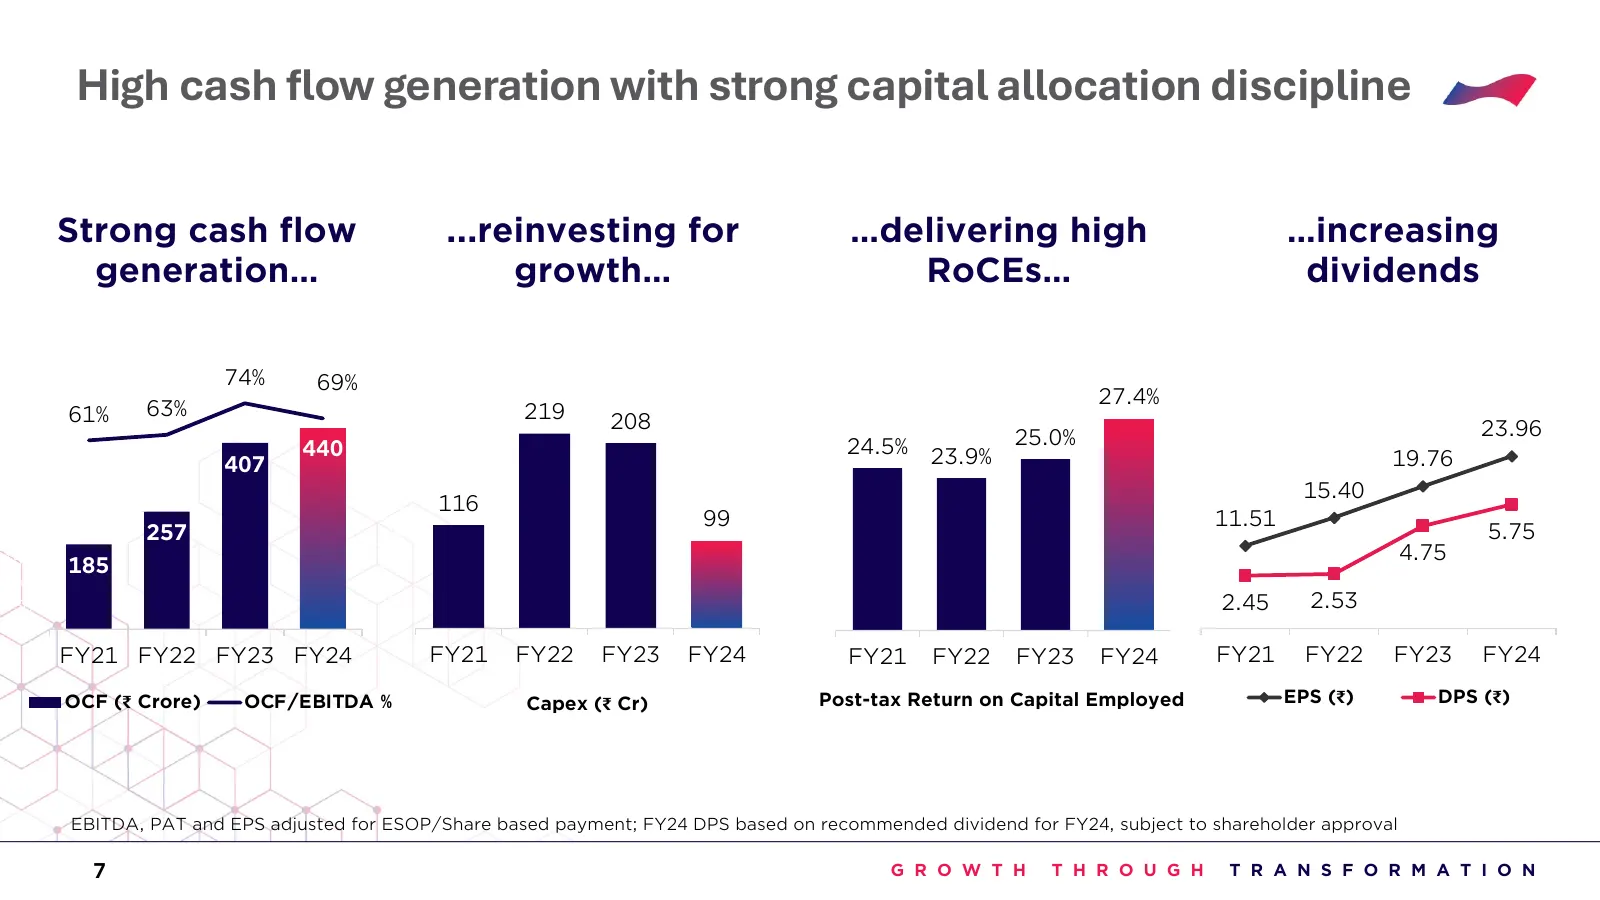
High cash flow generation with strong capital allocation discipline Strong cash flow ...reinvesting for …delivering high …increasing generation… growth… RoCEs… dividends 74% 69% 500 75% 250 27.4% 61% 63% 219 450 65% 208 27.0% 23.96 400 24.5% 25.0% 440 200 55% 25.0% 23.9% 19.76 350 407 300 45% 23.0%

Slide 8: Company Overview
Company Overview G R O W T H T H R O U G H T R A N S F O R M A T I O N
Slide 9: Our Solutions & Services
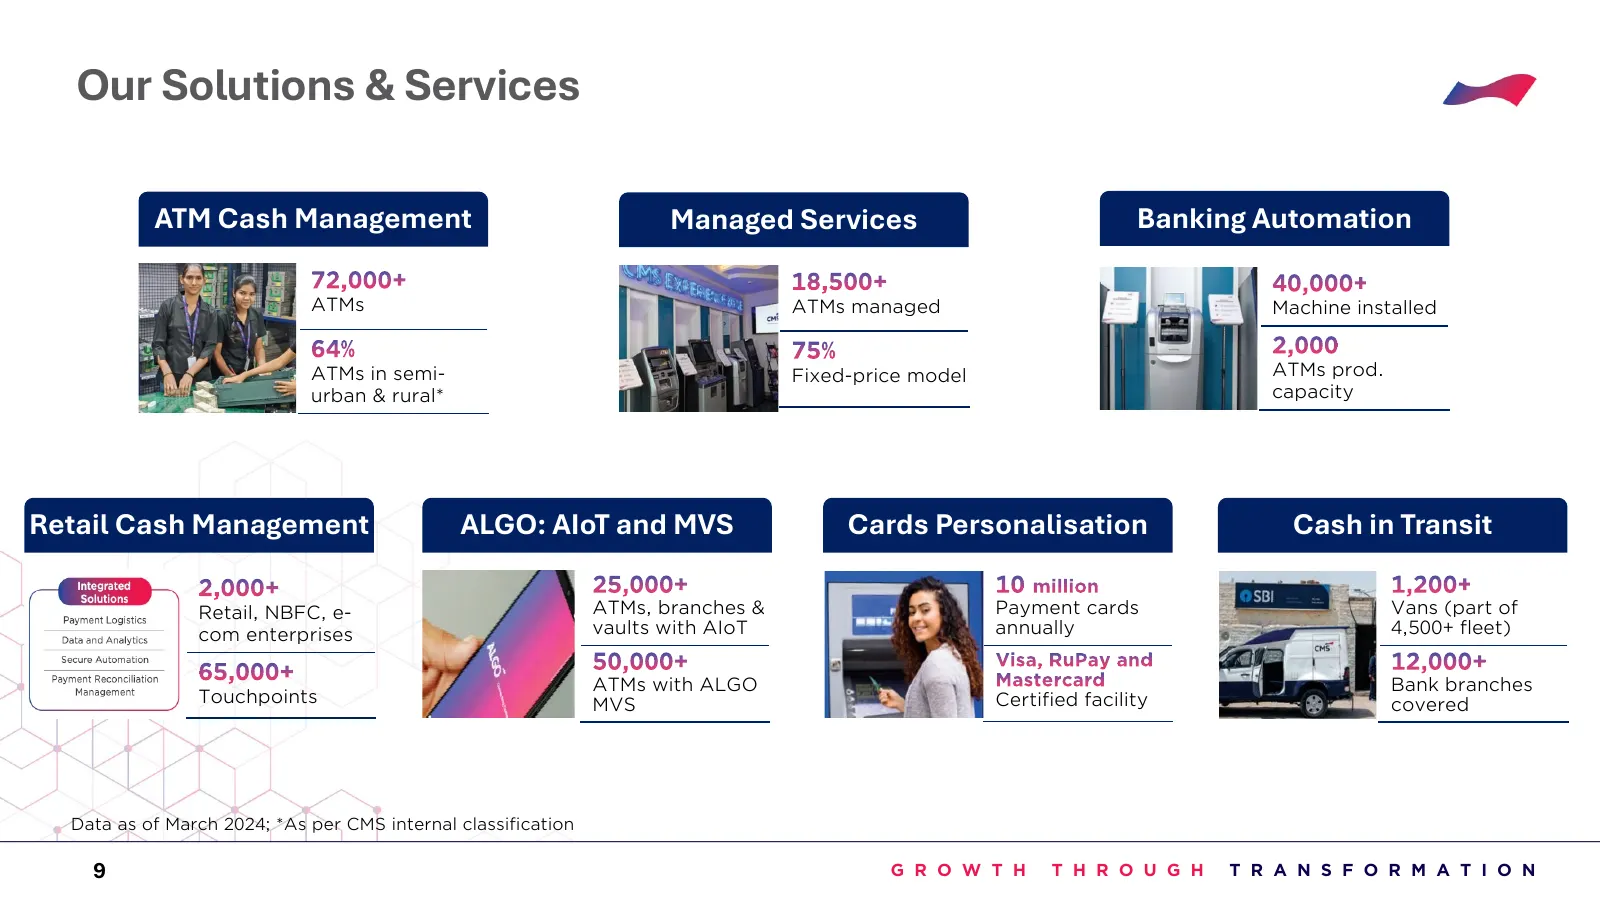
Our Solutions & Services ATM Cash Management Managed Services Banking Automation ATMs ATMs managed Machine installed ATMs in semi- Fixed-price model ATMs prod. urban & rural* capacity Retail Cash Management ALGO: AIoT and MVS Cards Personalisation Cash in Transit Retail, NBFC, e- ATMs, branches & Pa
Slide 10: Diverse board; Seasoned leadership
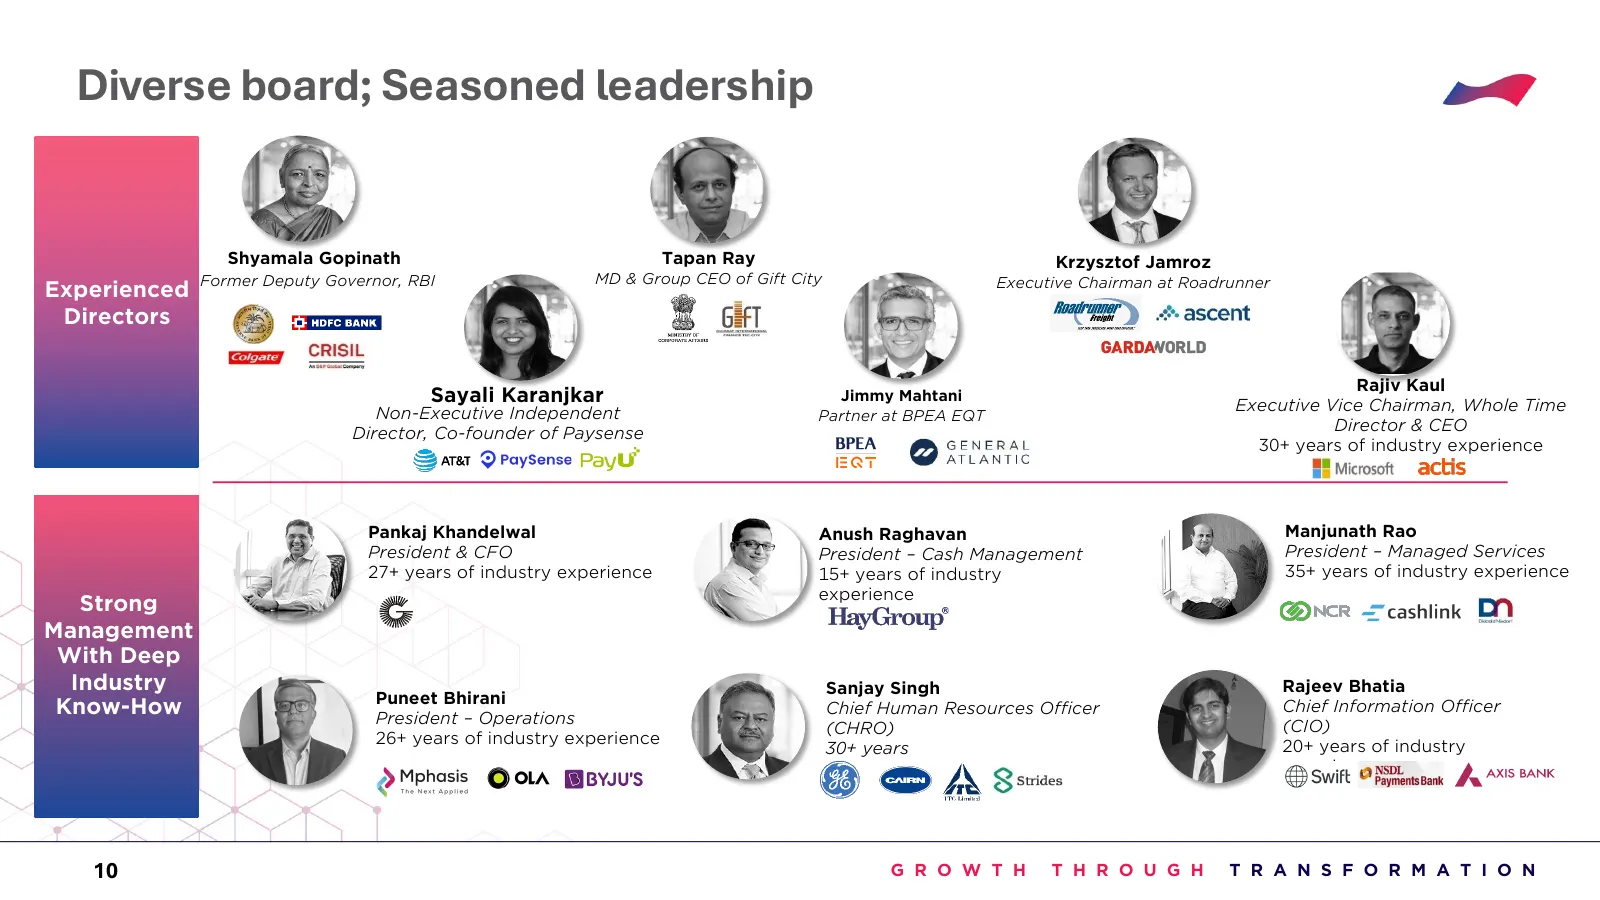
Diverse board; Seasoned leadership Shyamala Gopinath Tapan Ray Krzysztof Jamroz Former Deputy Governor, RBI MD & Group CEO of Gift City Executive Chairman at Roadrunner Experienced Directors Rajiv Kaul Sayali Karanjkar Jimmy Mahtani Executive Vice Chairman, Whole Time Non-Executive Independent Partn
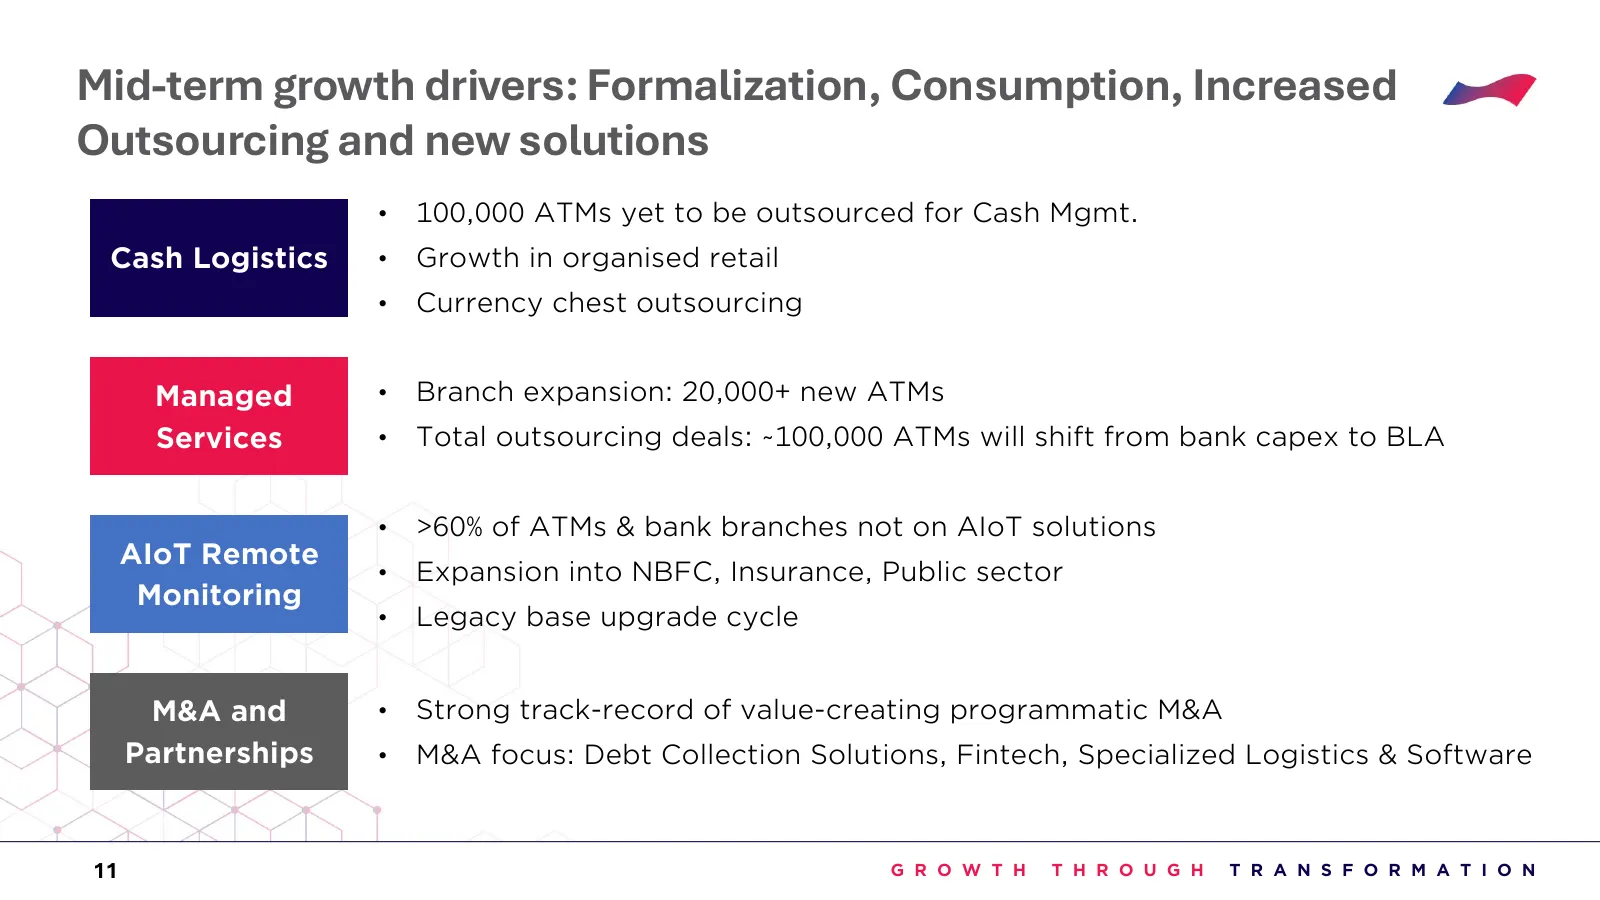
Slide 11: Mid-term growth drivers: Formalization, Consumption, Increased Outsourcing and new solutions
Mid-term growth drivers: Formalization, Consumption, Increased Outsourcing and new solutions • 100,000 ATMs yet to be outsourced for Cash Mgmt. Cash Logistics • Growth in organised retail • Currency chest outsourcing Managed • Branch expansion: 20,000+ new ATMs Services • Total outsourcing deals: ~1
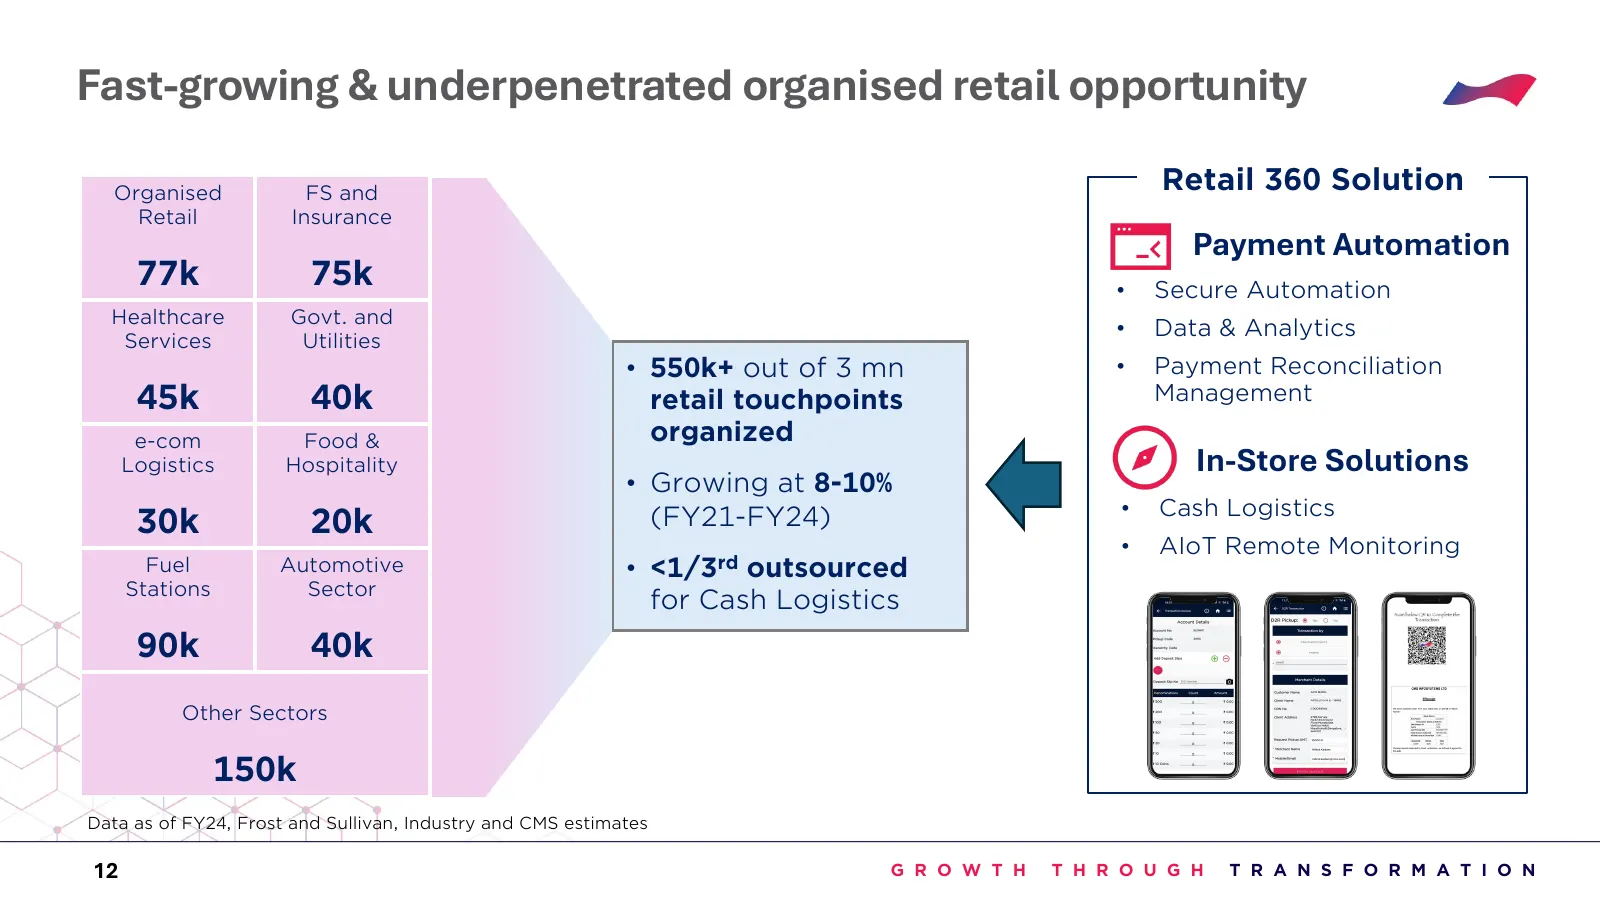
Slide 12: Fast-growing & underpenetrated organised retail opportunity
Fast-growing & underpenetrated organised retail opportunity Organised FS and Retail 360 Solution Retail Insurance Payment Automation 77k 75k • Secure Automation Healthcare Govt. and Services Utilities • Data & Analytics • 550k+ out of 3 mn • Payment Reconciliation 45k 40k retail touchpoints Manageme
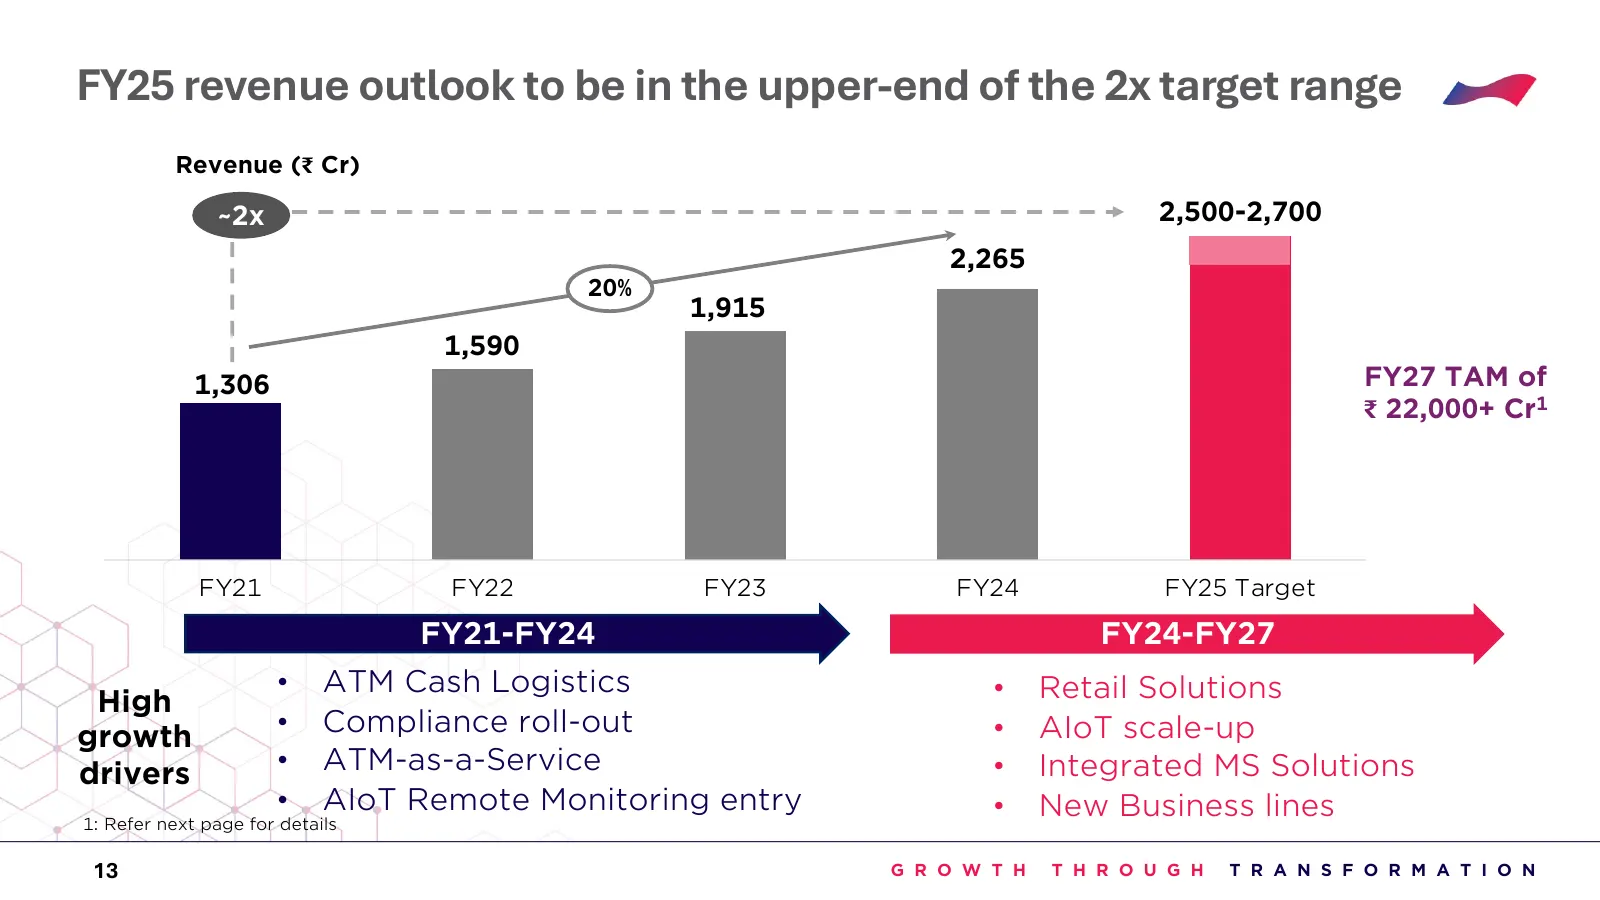
Slide 13: FY25 revenue outlook to be in the upper-end of the 2x target range
FY25 revenue outlook to be in the upper-end of the 2x target range Revenue (₹ Cr) 3,000 ~2x 2,500-2,700 2,500 2,265 20% 2,000 1,915 1,590 1,500 1,306 FY27 TAM of ₹ 22,000+ Cr1 1,000 500 0 FY21 FY22 FY23 FY24 FY25 Target FY21-FY24 FY24-FY27 • ATM Cash Logistics • Retail Solutions High growth • Compli
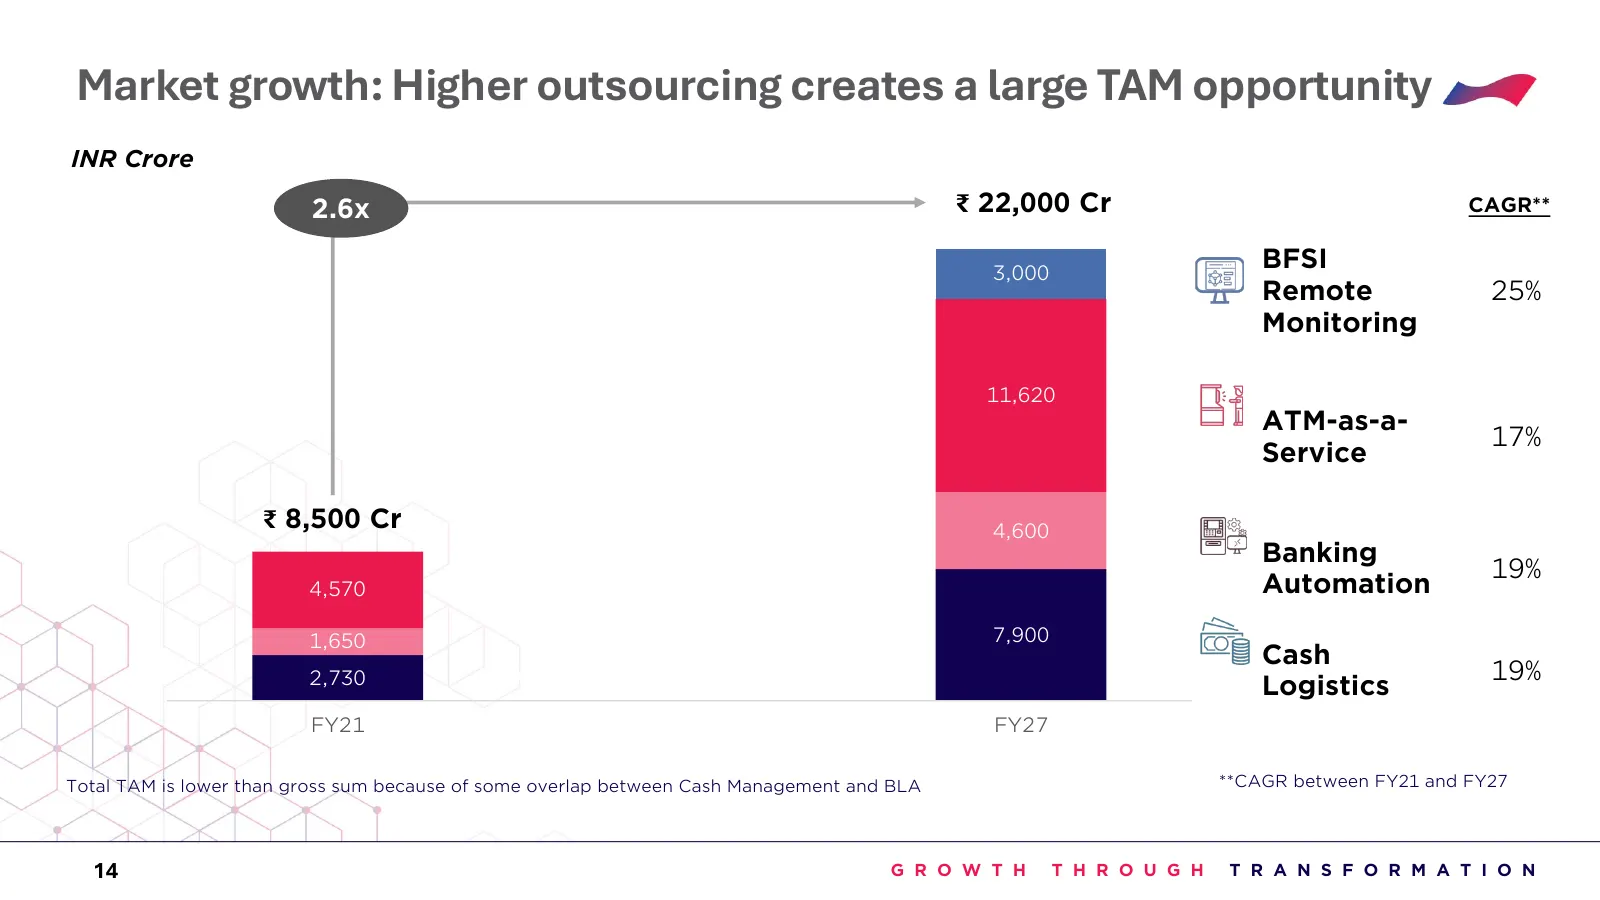
Slide 14: Market growth: Higher outsourcing creates a large TAM opportunity
Market growth: Higher outsourcing creates a large TAM opportunity INR Crore 2.6x ₹ 22,000 Cr CAGR** 3,000 BFSI Remote 25% Monitoring 11,620 ATM-as-a- 17% Service ₹ 8,500 Cr 4,600 6,200-6,500 Banking 19% 4,570 Automation 1,650 1,800-2,000 7,900 Cash 2,730 3,500-3,700 19% Logistics FY21 FY27 Total TAM
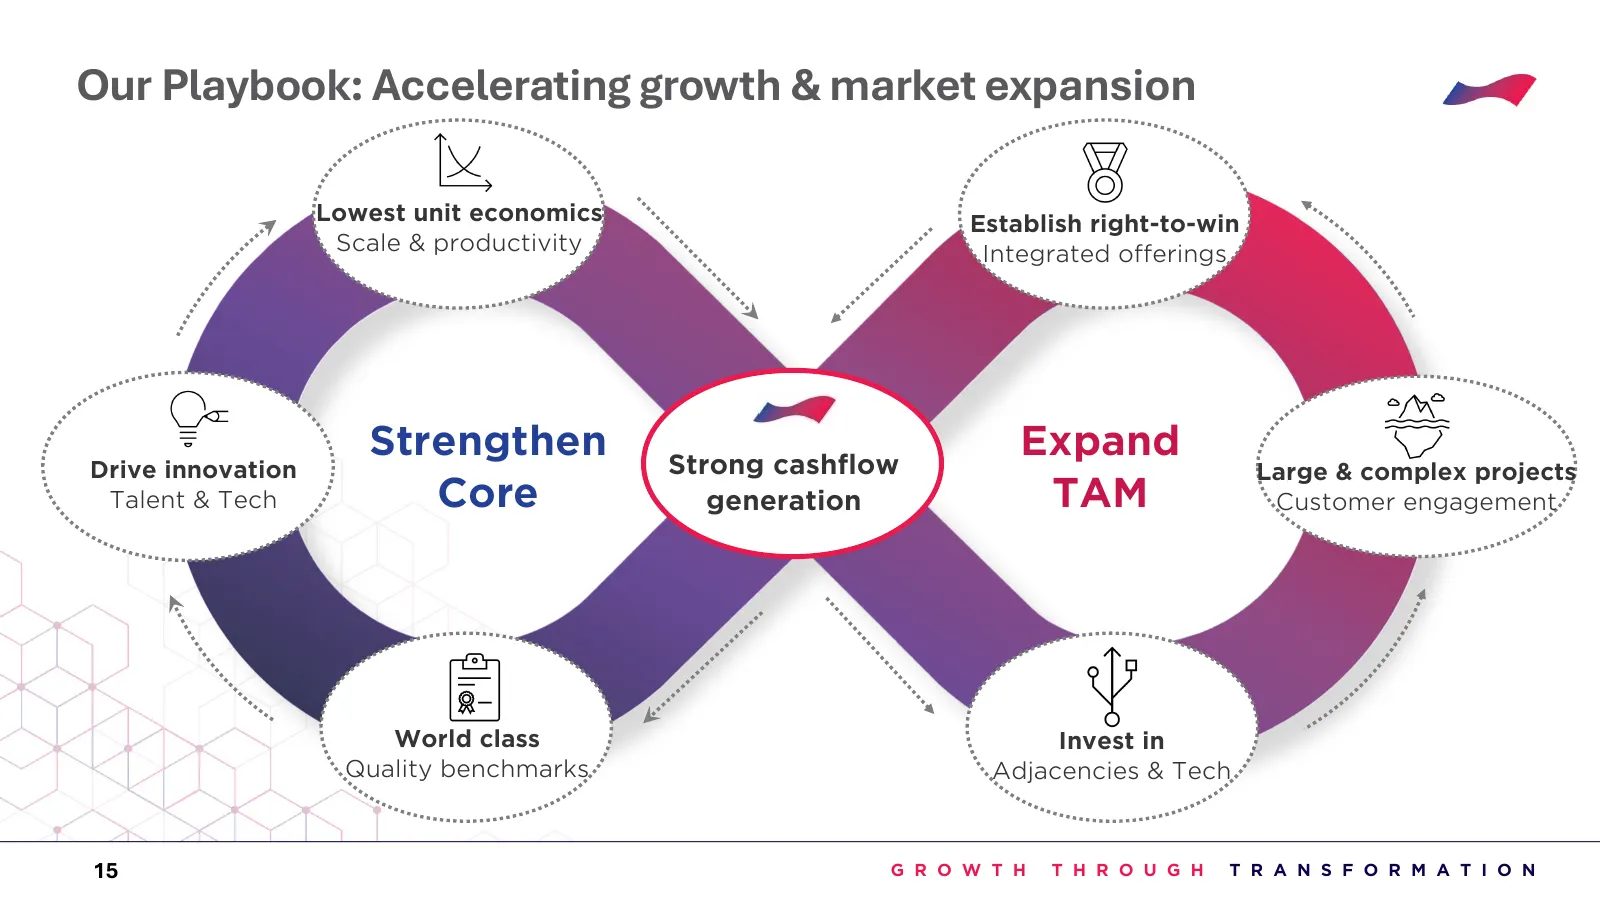
Slide 15: Our Playbook: Accelerating growth & market expansion
Our Playbook: Accelerating growth & market expansion Lowest unit economics Establish right-to-win Scale & productivity Integrated offerings Strengthen Strong cashflow Expand Drive innovation Large & complex projects Talent & Tech Core generation TAM Customer engagement World class Invest in Quality
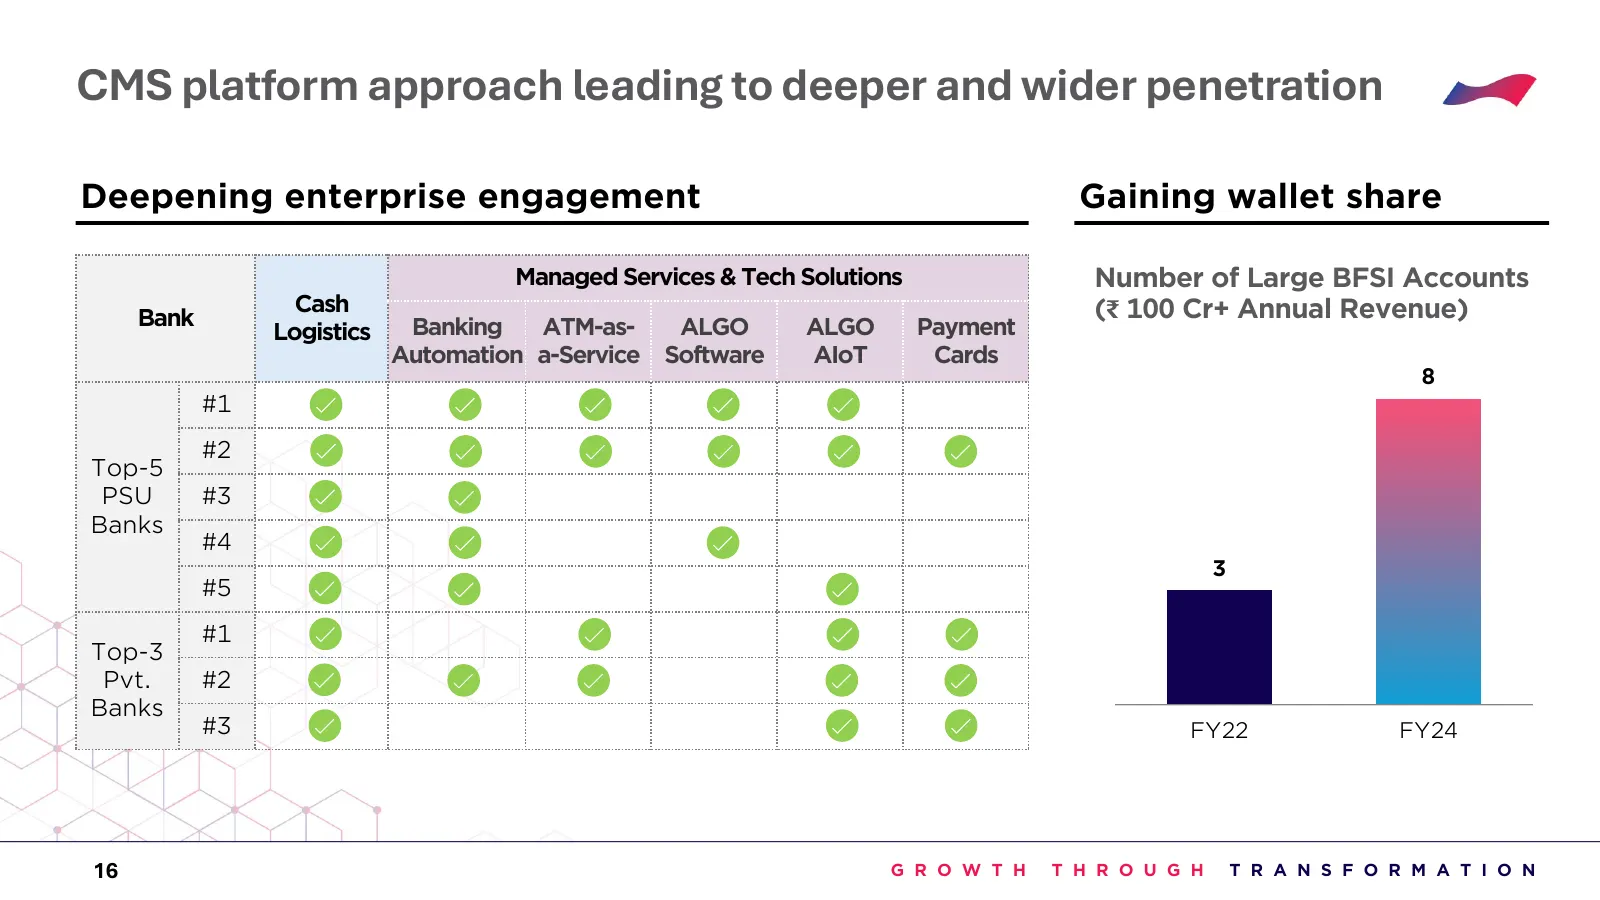
Slide 16: CMS platform approach leading to deeper and wider penetration
CMS platform approach leading to deeper and wider penetration Deepening enterprise engagement Gaining wallet share Managed Services & Tech Solutions Number of Large BFSI Accounts Cash (₹ 100 Cr+ Annual Revenue) Bank Banking ATM-as- ALGO ALGO Payment Logistics Automation a-Service Software AIoT Cards
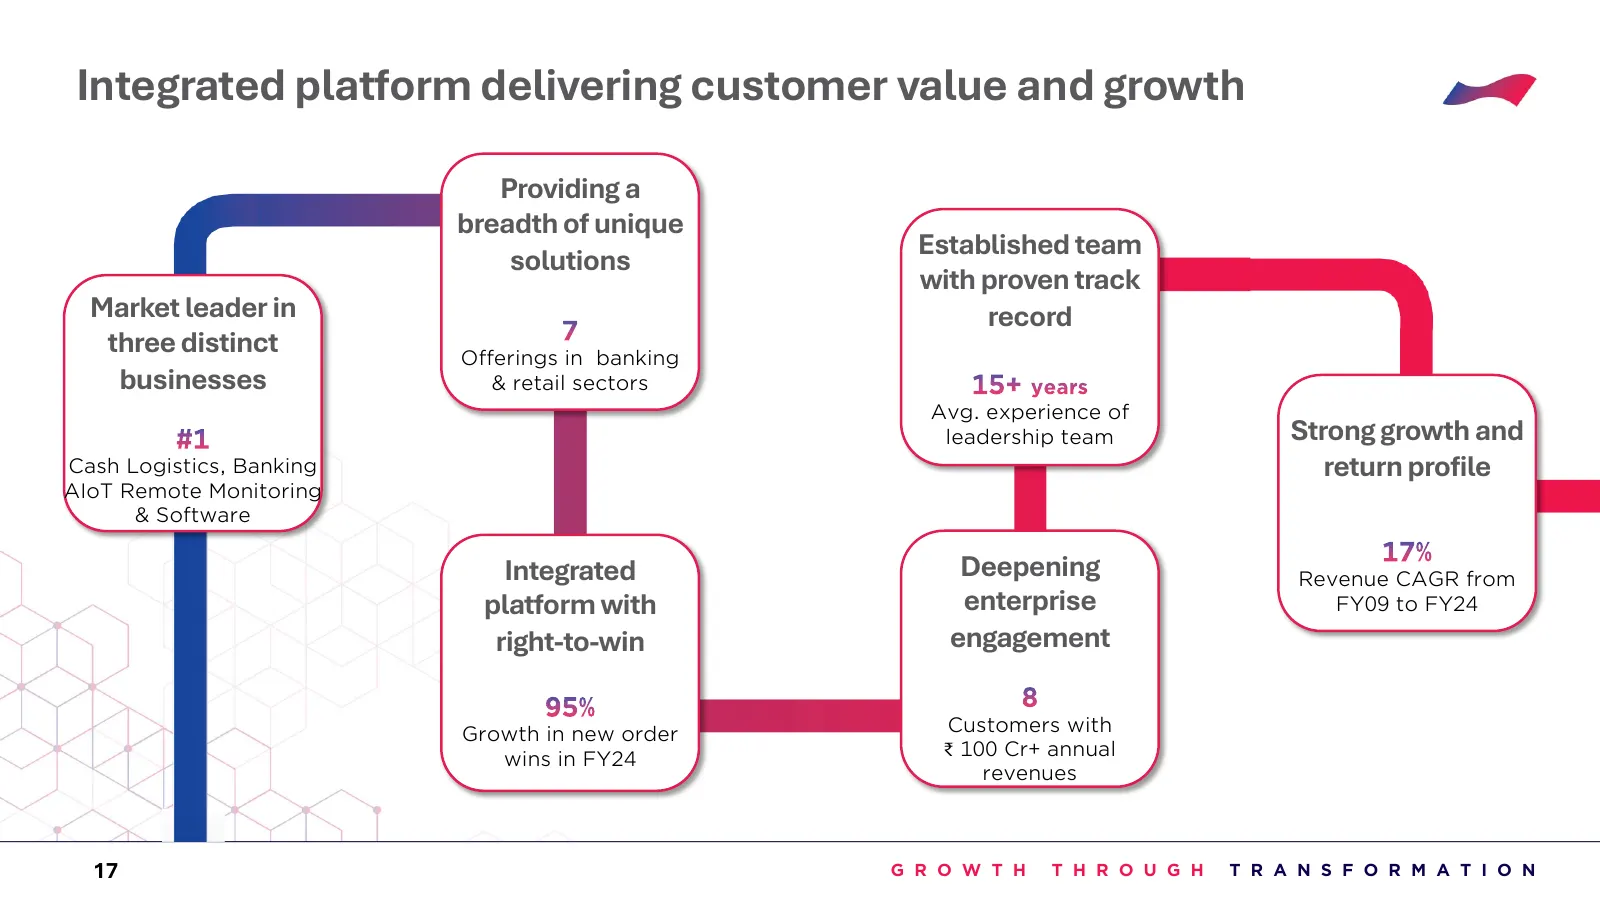
Slide 17: Integrated platform delivering customer value and growth
Integrated platform delivering customer value and growth Providing a breadth of unique Established team solutions with proven track Market leader in record three distinct Offerings in banking businesses & retail sectors Avg. experience of leadership team Strong growth and Cash Logistics, Banking ret

Slide 18: Annexures
Annexures G R O W T H T H R O U G H T R A N S F O R M A T I O N

Slide 19: Historical Financials
Historical Financials G R O W T H T H R O U G H T R A N S F O R M A T I O N
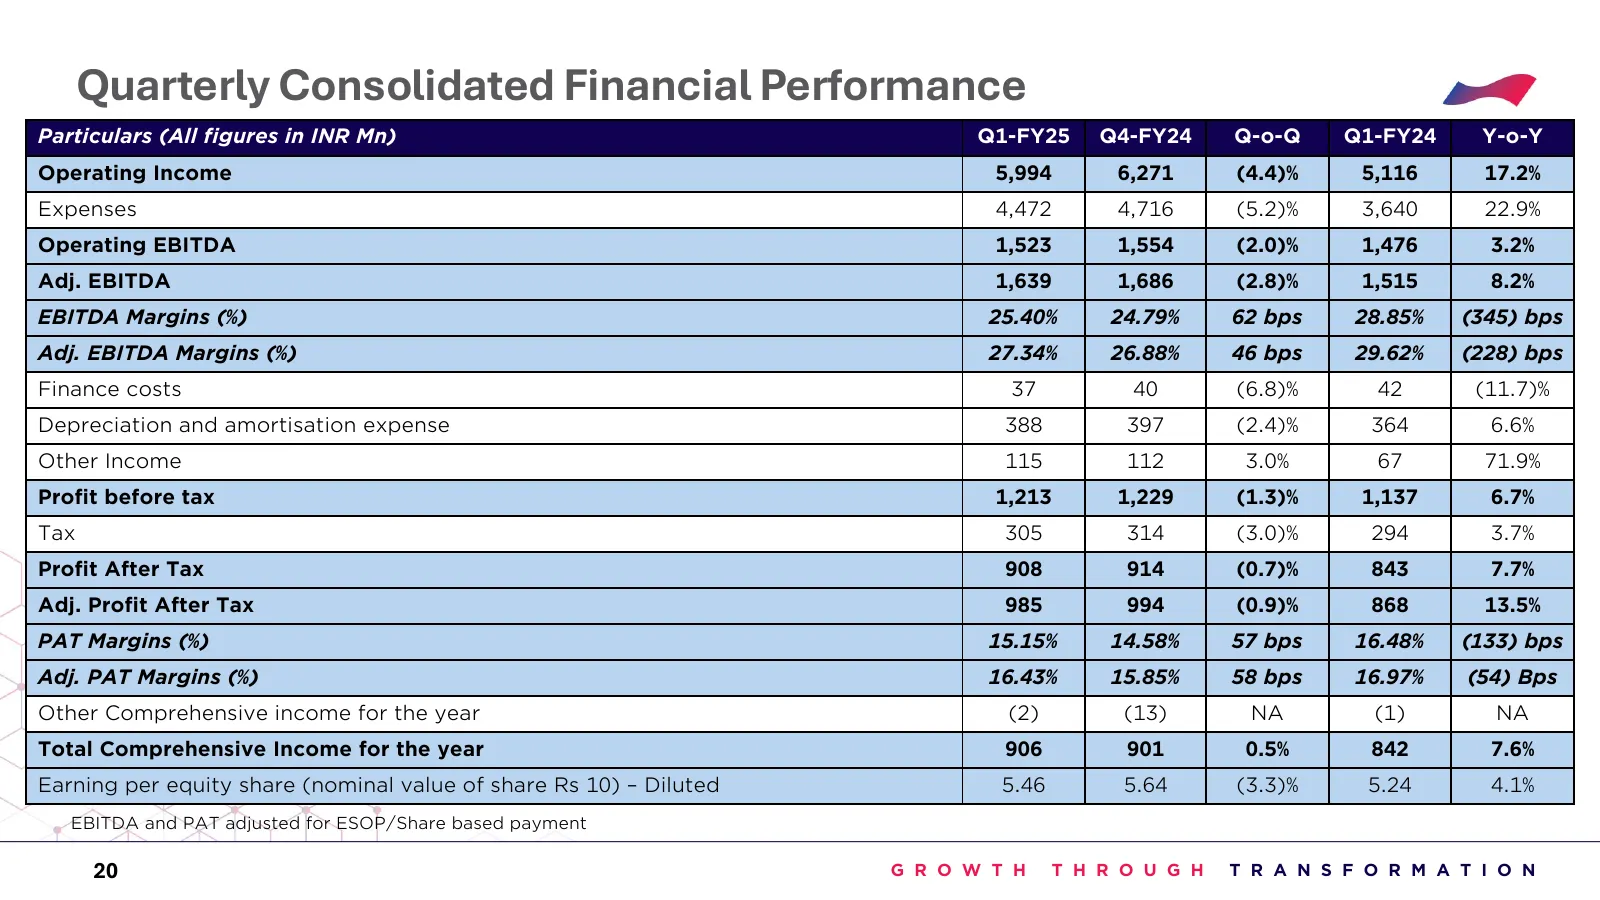
Slide 20: Quarterly Consolidated Financial Performance
Quarterly Consolidated Financial Performance Particulars (All figures in INR Mn) Q1-FY25 Q4-FY24 Q-o-Q Q1-FY24 Y-o-Y Operating Income 5,994 6,271 (4.4)% 5,116 17.2% Expenses 4,472 4,716 (5.2)% 3,640 22.9% Operating EBITDA 1,523 1,554 (2.0)% 1,476 3.2% Adj. EBITDA 1,639 1,686 (2.8)% 1,515 8.2% EBITDA
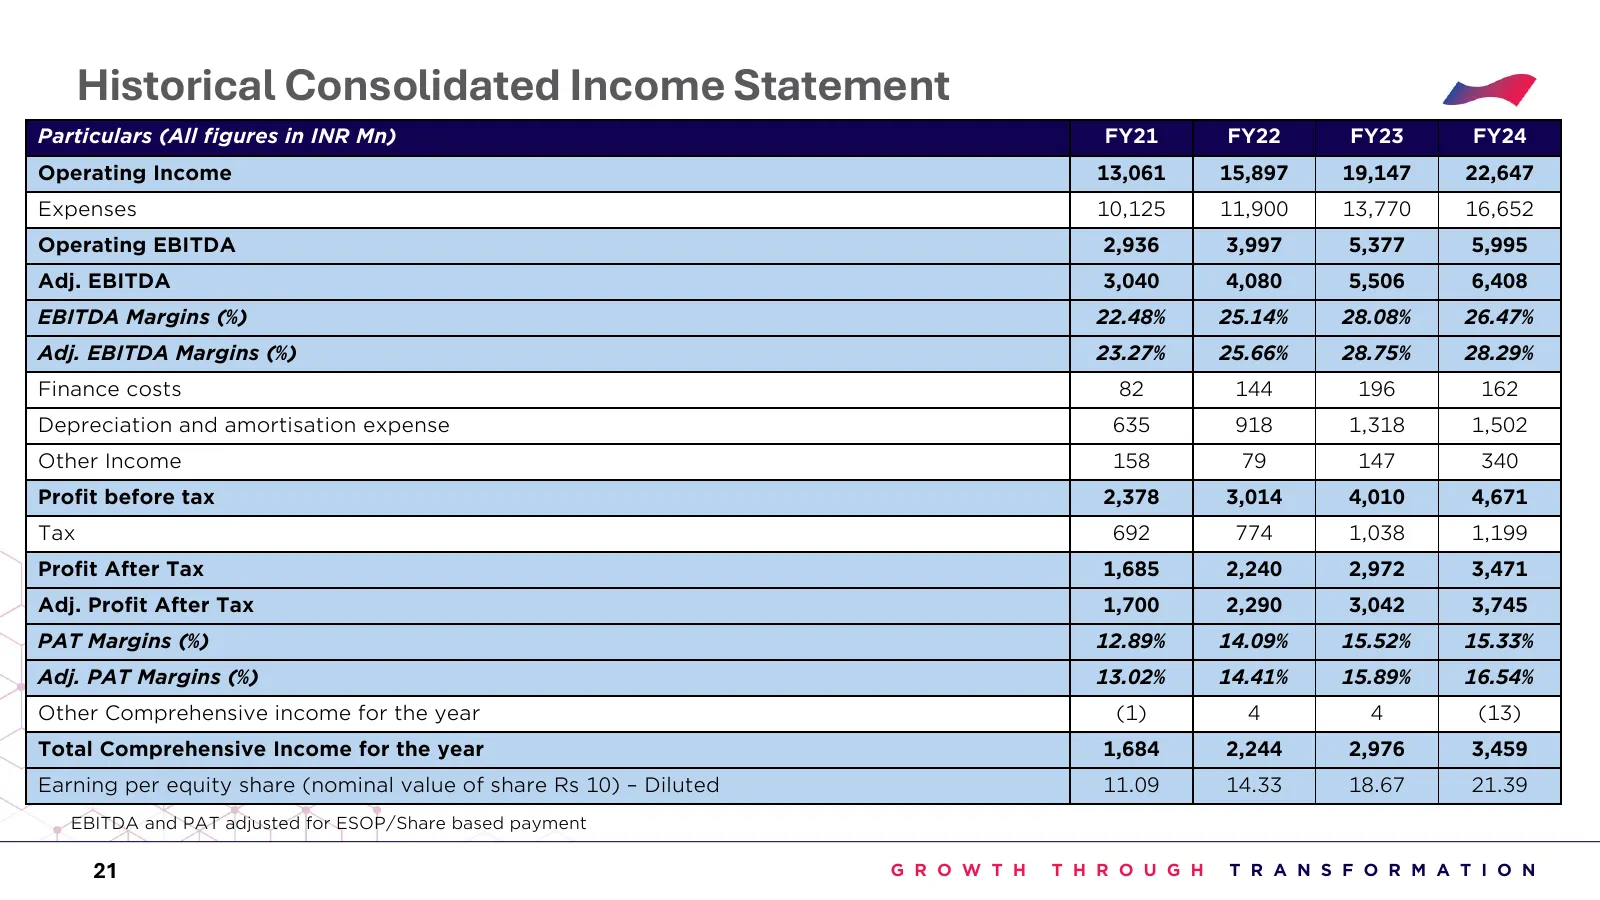
Slide 21: Historical Consolidated Income Statement
Historical Consolidated Income Statement Particulars (All figures in INR Mn) FY21 FY22 FY23 FY24 Operating Income 13,061 15,897 19,147 22,647 Expenses 10,125 11,900 13,770 16,652 Operating EBITDA 2,936 3,997 5,377 5,995 Adj. EBITDA 3,040 4,080 5,506 6,408 EBITDA Margins (%) 22.48% 25.14% 28.08% 26.4
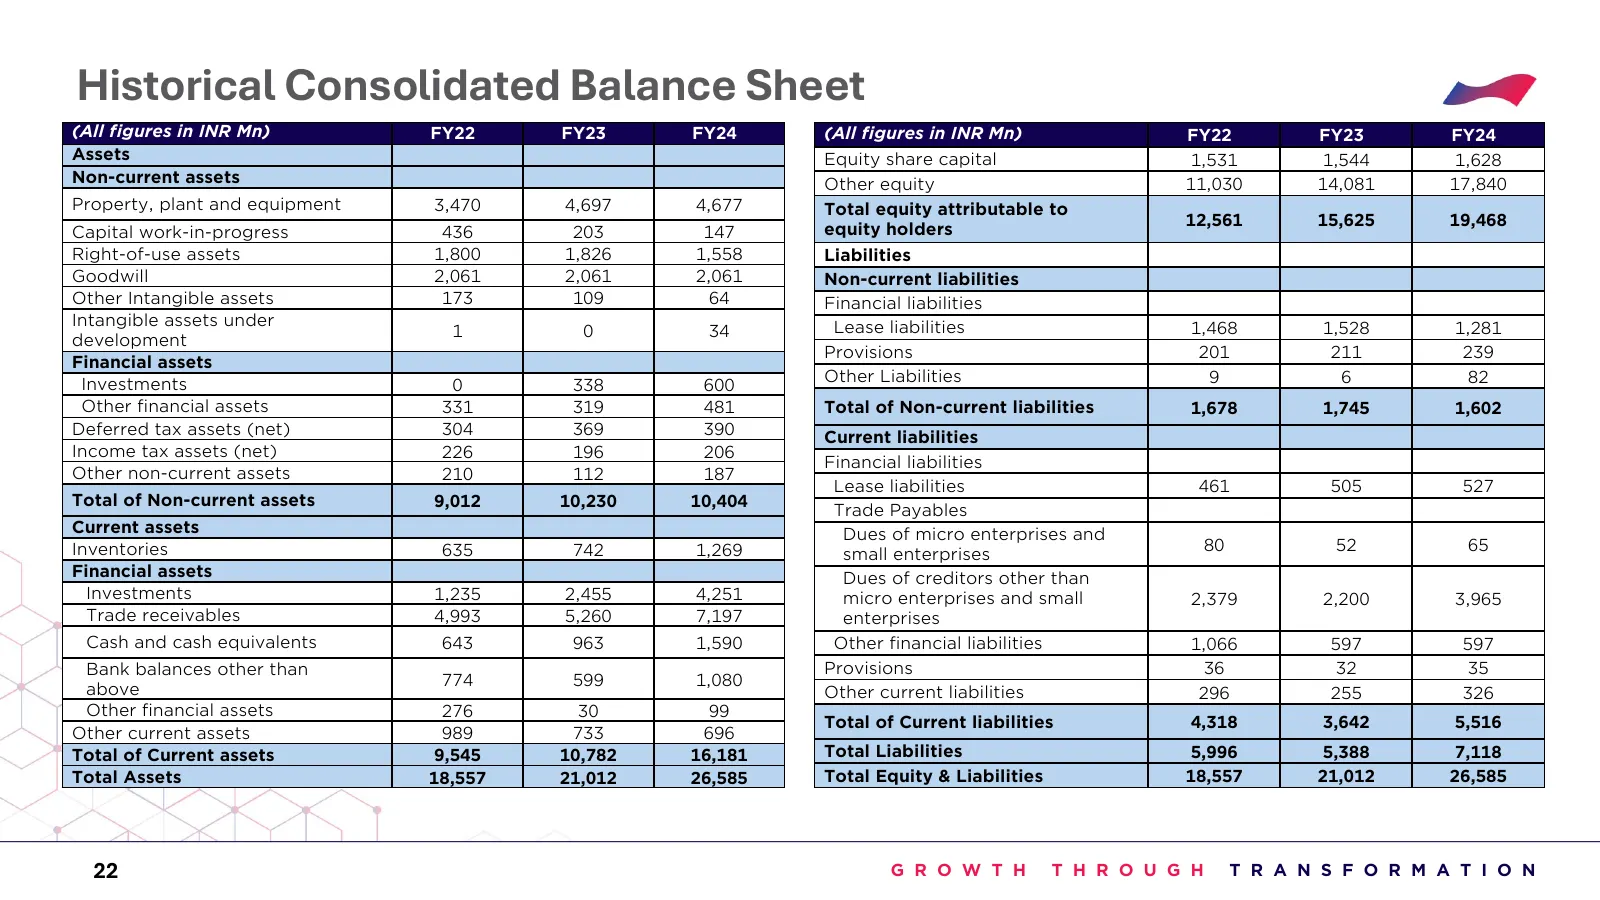
Slide 22: Historical Consolidated Balance Sheet
Historical Consolidated Balance Sheet (All figures in INR Mn) FY22 FY23 FY24 (All figures in INR Mn) FY22 FY23 FY24 Assets Equity share capital 1,531 1,544 1,628 Non-current assets Other equity 11,030 14,081 17,840 Property, plant and equipment 3,470 4,697 4,677 Total equity attributable to 12,561 1
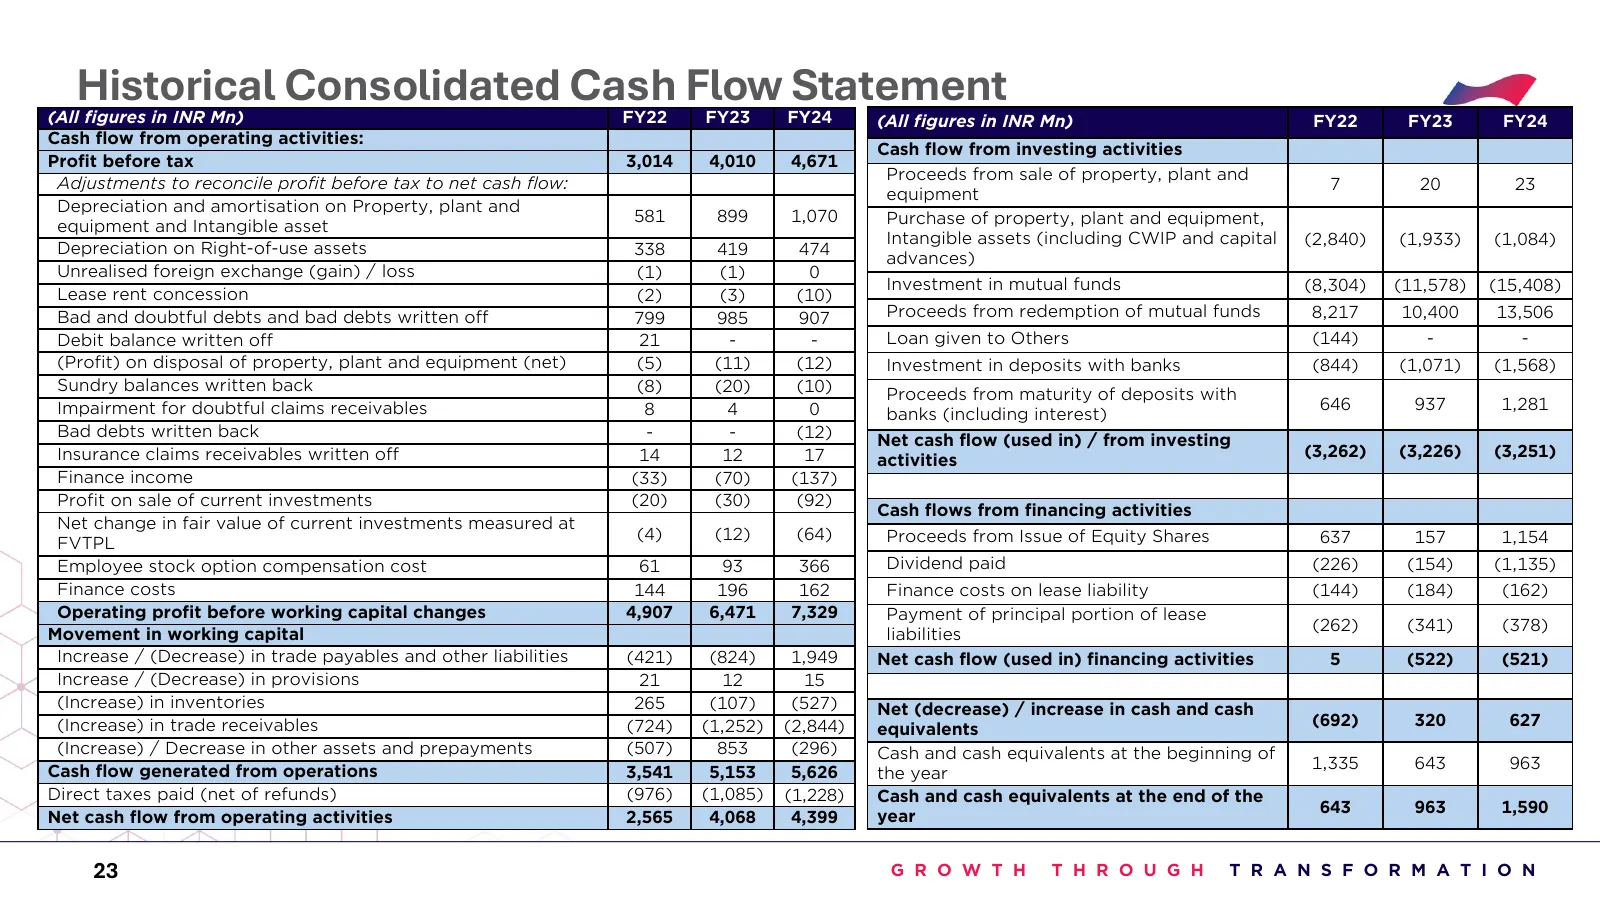
Slide 23: Historical Consolidated Cash Flow Statement
Historical Consolidated Cash Flow Statement (All figures in INR Mn) FY22 FY23 FY24 (All figures in INR Mn) FY22 FY23 FY24 Cash flow from operating activities: Cash flow from investing activities Profit before tax 3,014 4,010 4,671 Proceeds from sale of property, plant and Adjustments to reconcile pr
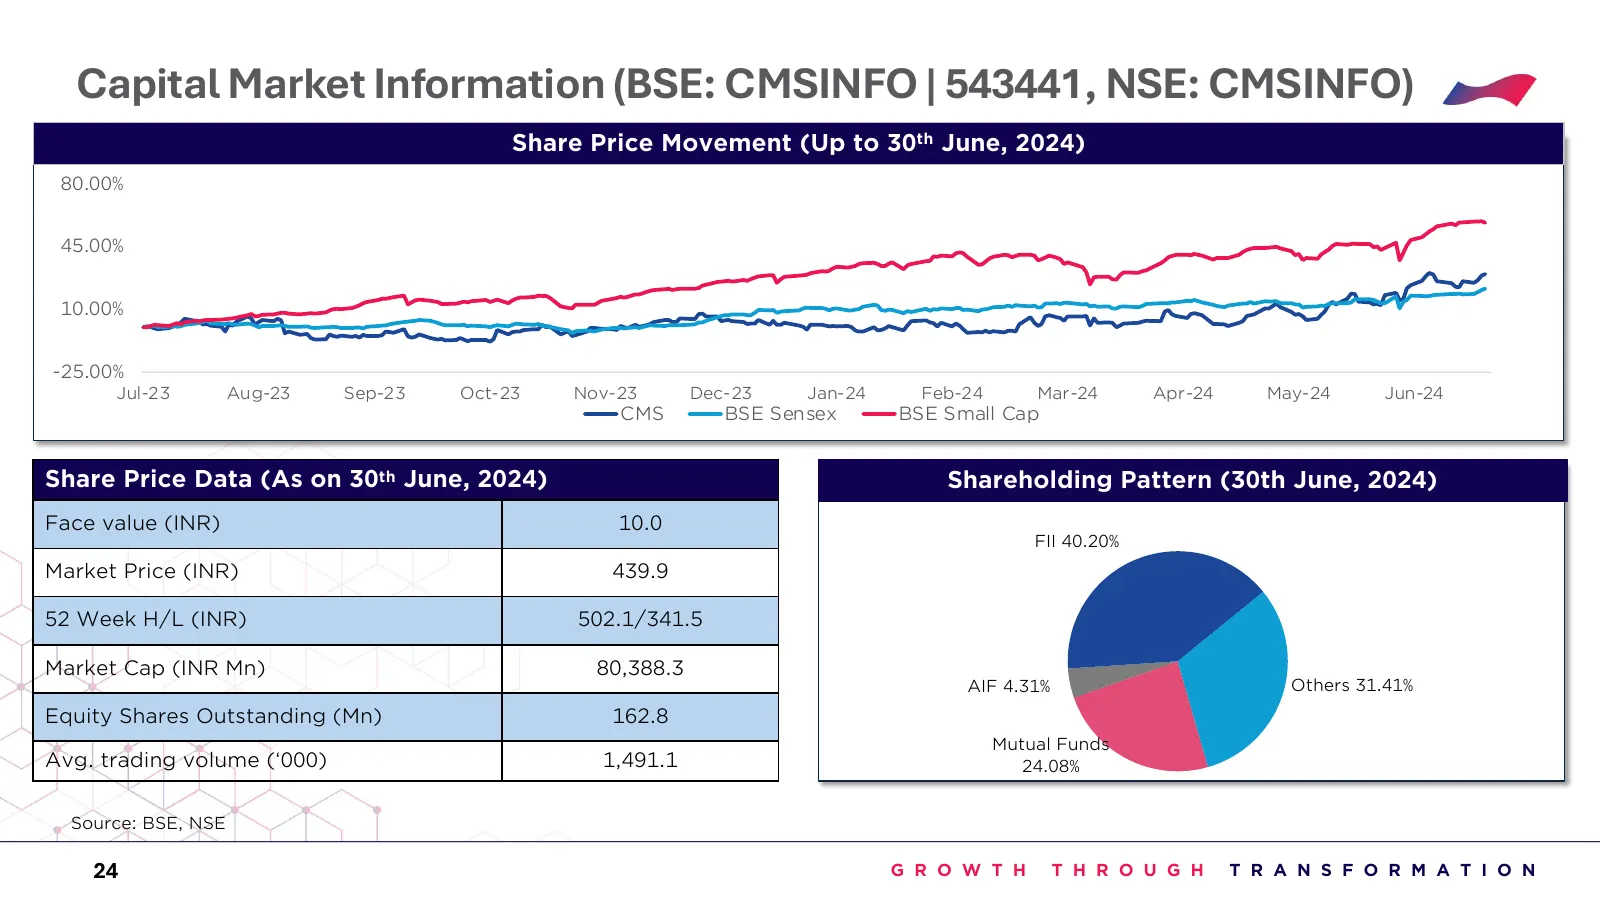
Slide 24: Capital Market Information (BSE: CMSINFO | 543441, NSE: CMSINFO)
Capital Market Information (BSE: CMSINFO | 543441, NSE: CMSINFO) Share Price Movement (Up to 30th June, 2024) 80.00% 45.00% 10.00% -25.00% Jul-23 Aug-23 Sep-23 Oct-23 Nov-23 Dec-23 Jan-24 Feb-24 Mar-24 Apr-24 May-24 Jun-24 CMS BSE Sensex BSE Small Cap Share Price Data (As on 30th June, 2024) Shareho

Slide 25: Safe Harbour Statement
Safe Harbour Statement No representation or warranty, express or implied, is made as to, and no reliance should be placed on the fairness, accuracy, completeness or correctness of the information or opinions contained in this presentation. Such information and opinions are in all events not current
Source: Internet Archive copy of cms.com
More decks from CMS Info Systems Ltd.
 Q2 FY27 Earnings Presentation27 slides · Nov 13, 2026
 Q2 FY27 Earnings Presentation28 slides · Nov 13, 2026
 Q1 FY27 Earnings Presentation24 slides · Aug 11, 2026
 Q1 FY2027 Earnings Presentation23 slides · Aug 10, 2026
 Q1 FY27 Earnings Presentation23 slides · Aug 10, 2026
 Q4 FY2026 Earnings Presentation30 slides · May 14, 2026