Entegra Financial — Investor Presentation (May 2018)
48 slides from Entegra Financial's investor presentation, May 18, 2018
Slide 1: May 2018 Investor Presentation
May, 2018 Investor Presentation
Slide 2: Forward Looking Statements
The discussions included in this document may contain “forward - looking statements” within the meaning of the Private Securities Litigation Reform Act of 1995 , including Section 21 E of the Securities Exchange Act of 1934 and Section 27 A of the Securities Act of 1933 . Such statements involve kno
Slide 3: Non-GAAP / Financial Basis
Statements included in this document include non - GAAP financial measures and should be read along with the accompanying tables in Appendix A to our quarterly earnings release, which provide a reconciliation of non - GAAP financial measures to GAAP financial measures . This document discusses finan
Slide 4: Who We Are
Who We Are 4
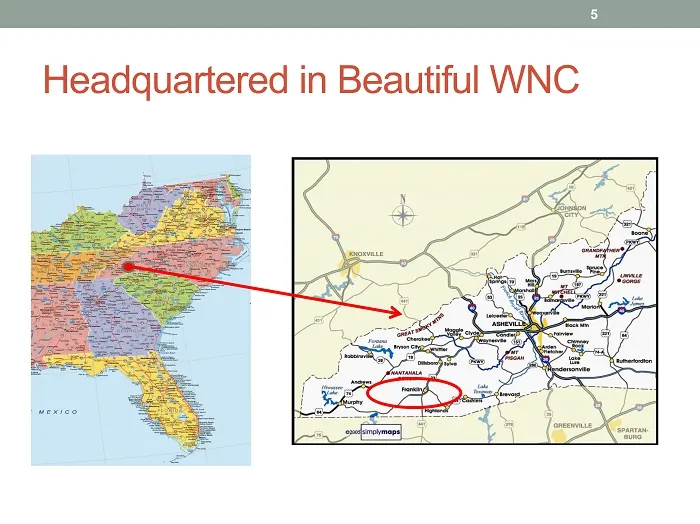
Slide 5: Headquartered in Beautiful WNC
Headquartered in Beautiful WNC 5
Slide 6: Years of History … And Counting
96 Years of History … And Counting 6
Slide 7: What's In A Name? Integrity
What’s In A Name? Integrity (Noun) “the quality of being honest and having strong moral principles ; moral uprightness . ” 7
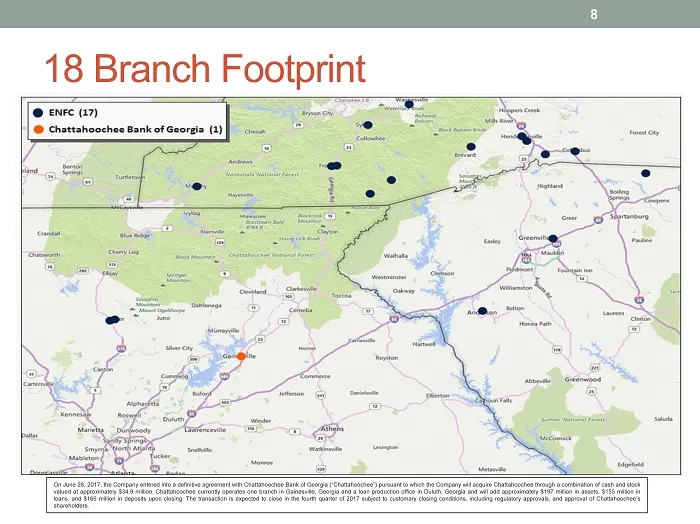
Slide 8: Branch Footprint
18 Branch Footprint 8 On June 26 , 2017 , the Company entered into a definitive agreement with Chattahoochee Bank of Georgia (“Chattahoochee”) pursuant to which the Company will acquire Chattahoochee through a combination of cash and stock valued at approximately $ 34 . 9 million . Chattahoochee cur
Slide 9: #5 NC Community Bank
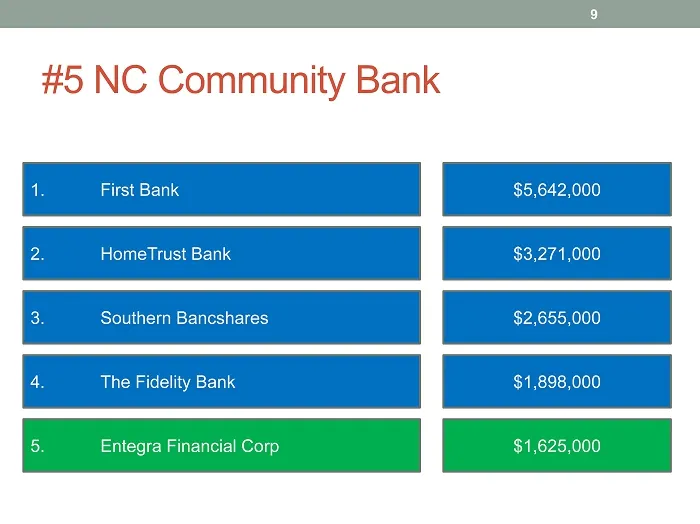
#5 NC Community Bank 9 1 . First Bank $5,642,000 2 . HomeTrust Bank $3,271,000 3 . Southern Bancshares $2,655,000 4 . The Fidelity Bank $1,898,000 5 . Entegra Financial Corp $1,625,000
Slide 10: Major Employers
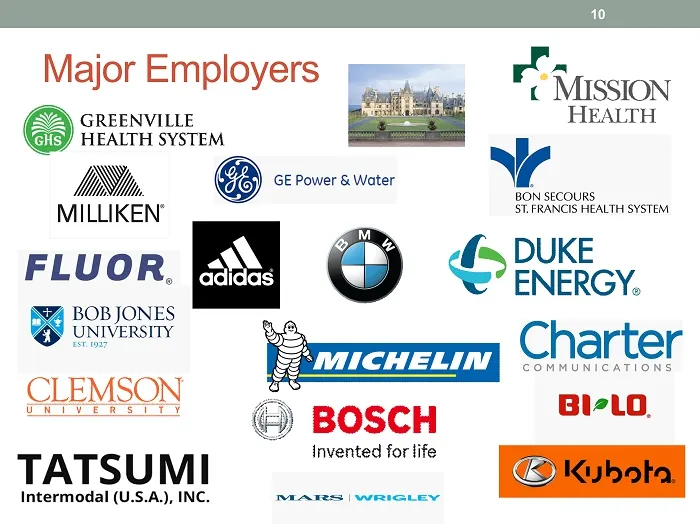
Major Employers mes re t MISSION @ GREENVILLE : HEALTH HEALTH “eo Un —W\\p, GE Power & Water an MILLIKEN" SP rRANGS HEALTH sysreM Me DUKE thi re) CO Nicy. BOB JONES a Charter CLEMSON SS a =" ©) BOSCH TATSU M I invented for life Intermodal (U.S.A.), INC. MARES | WRIGLEY
Slide 11: Focused on Technology
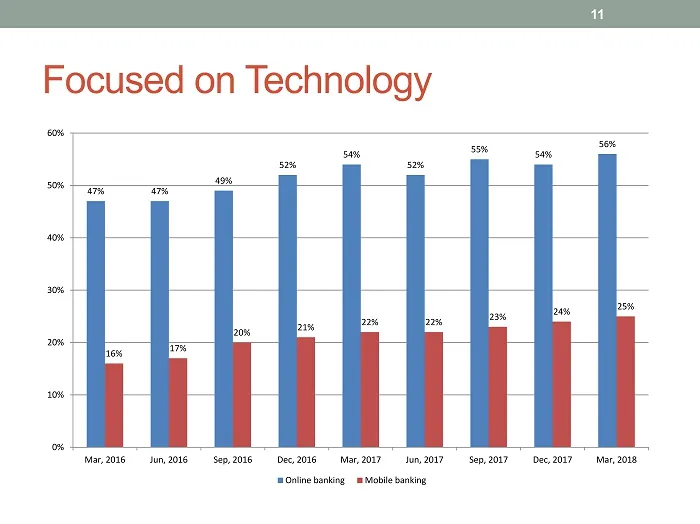
Focused on Technology 11 47% 47% 49% 52% 54% 52% 55% 54% 56% 16% 17% 20% 21% 22% 22% 23% 24% 25% 0% 10% 20% 30% 40% 50% 60% Mar, 2016 Jun, 2016 Sep, 2016 Dec, 2016 Mar, 2017 Jun, 2017 Sep, 2017 Dec, 2017 Mar, 2018 Online banking Mobile banking
Slide 12: Experienced Executive Team
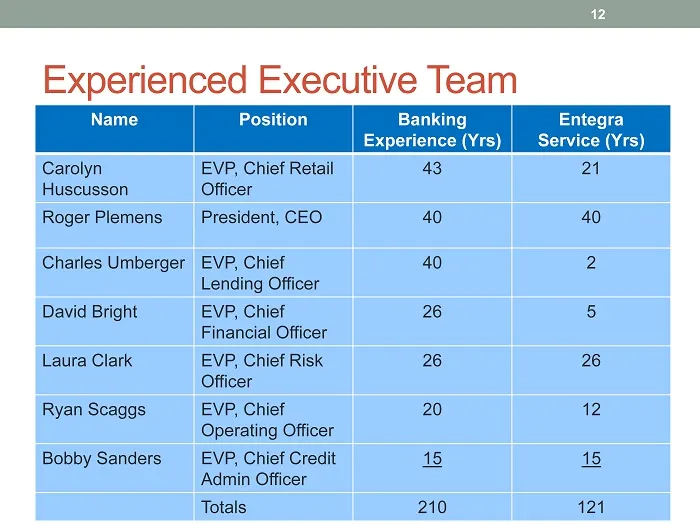
Experienced Executive Team Name Position Banking Experience ( Yrs ) Entegra Service ( Yrs ) Carolyn Huscusson EVP, Chief Retail Officer 43 21 Roger Plemens President, CEO 40 40 Charles Umberger EVP, Chief Lending Officer 40 2 David Bright EVP, Chief Financial Officer 26 5 Laura Clark EVP, Chief Risk
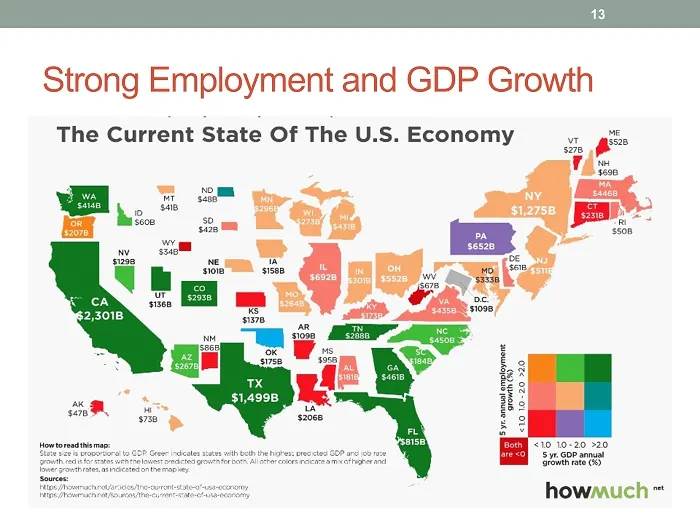
Slide 13: Strong Employment and GDP Growth
Strong Employment and GDP Growth 13
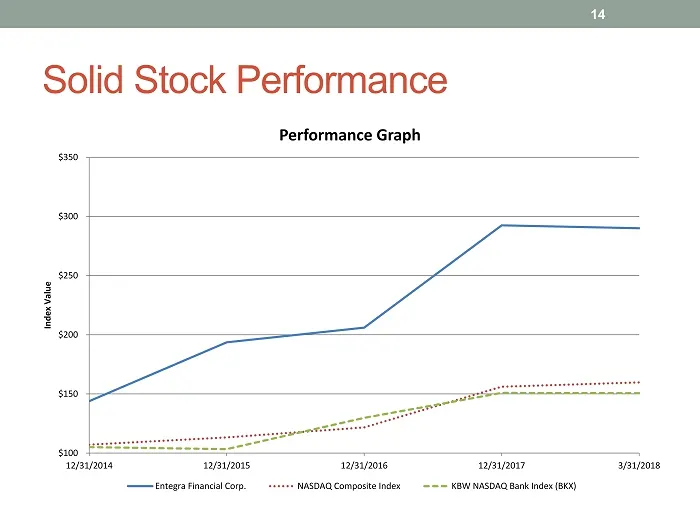
Slide 14: Solid Stock Performance
Solid Stock Performance 14 $100 $150 $200 $250 $300 $350 12/31/2014 12/31/2015 12/31/2016 12/31/2017 3/31/2018 Index Value Performance Graph Entegra Financial Corp. NASDAQ Composite Index KBW NASDAQ Bank Index (BKX)
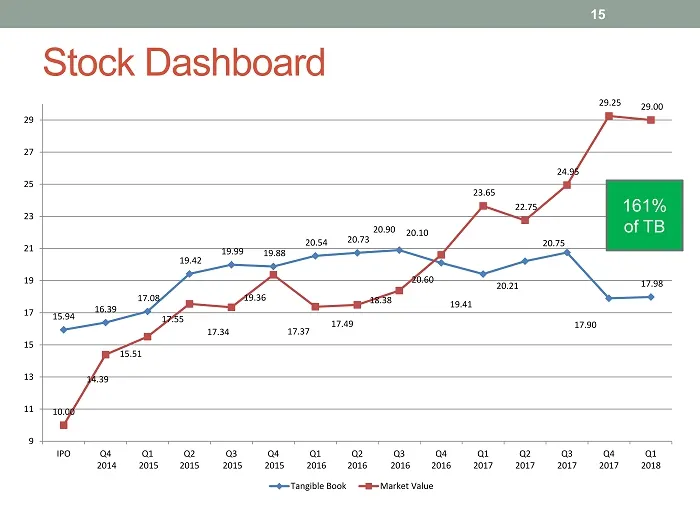
Slide 15: Stock Dashboard
Stock Dashboard 15 15.94 16.39 17.08 19.42 19.99 19.88 20.54 20.73 20.90 20.10 19.41 20.21 20.75 17.90 17.98 10.00 14.39 15.51 17.55 17.34 19.36 17.37 17.49 18.38 20.60 23.65 22.75 24.95 29.25 29.00 9 11 13 15 17 19 21 23 25 27 29 IPO Q4 2014 Q1 2015 Q2 2015 Q3 2015 Q4 2015 Q1 2016 Q2 2016 Q3 2016 Q
Slide 16: Research Coverage
Research Coverage SANDLER KY” FIG ber uw Partners O'NEILL + PARTNERS H HOVDE sz COMPASS POINT GROUP AYN RESEARCH & TRADING, LLC
Slide 17: Strategy Summary
Strategy Summary 17
Slide 18: Continued Execution of Strategic Plan
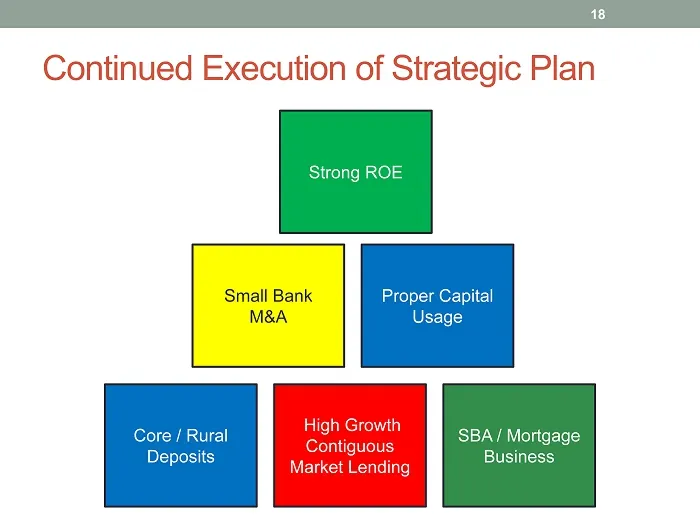
Continued Execution of Strategic Plan Strong ROE 18 Core / Rural Deposits High Growth Contiguous Market Lending SBA / Mortgage Business Small Bank M&A Proper Capital Usage Strong ROE
Slide 19: Diverse Footprint
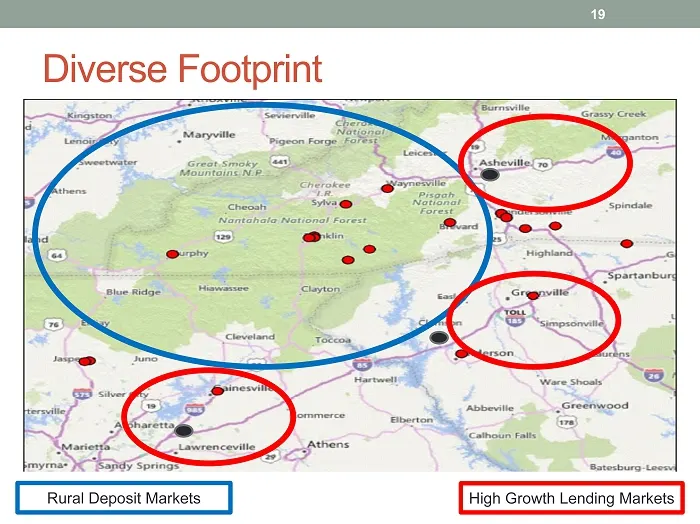
Diverse Footprint 19 Rural Deposit Markets High Growth Lending Markets
Slide 20: Proper Capital Usage
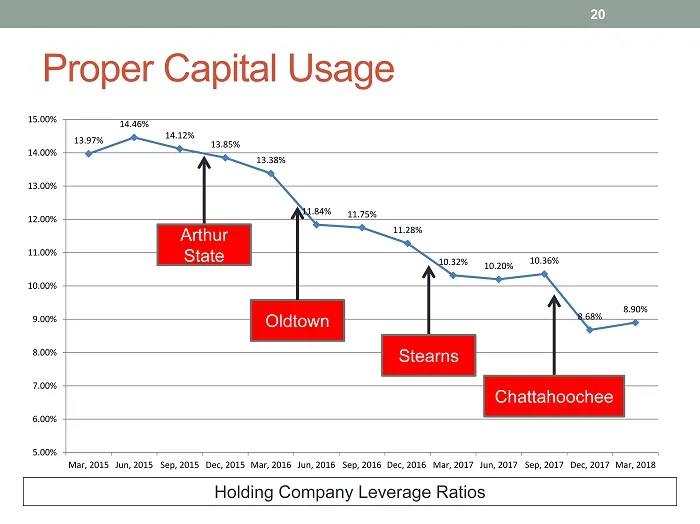
Proper Capital Usage Holding Company Leverage Ratios 20 13.97% 14.46% 14.12% 13.85% 13.38% 11.84% 11.75% 11.28% 10.32% 10.20% 10.36% 8.68% 8.90% 5.00% 6.00% 7.00% 8.00% 9.00% 10.00% 11.00% 12.00% 13.00% 14.00% 15.00% Mar, 2015 Jun, 2015 Sep, 2015 Dec, 2015 Mar, 2016 Jun, 2016 Sep, 2016 Dec, 2016 Mar
Slide 21: ROTE Targets (Core)
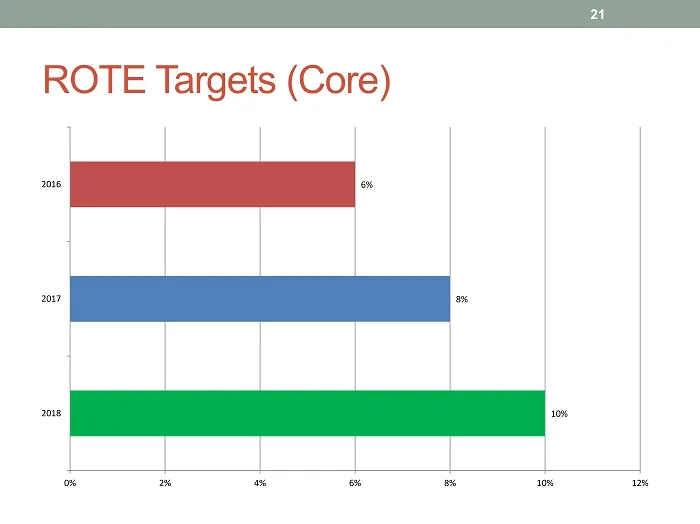
ROTE Targets (Core) 21 10% 8% 6% 0% 2% 4% 6% 8% 10% 12% 2018 2017 2016
Slide 22: Financial Overview
Financial Overview 22
Slide 23: Bank Capital Ratios
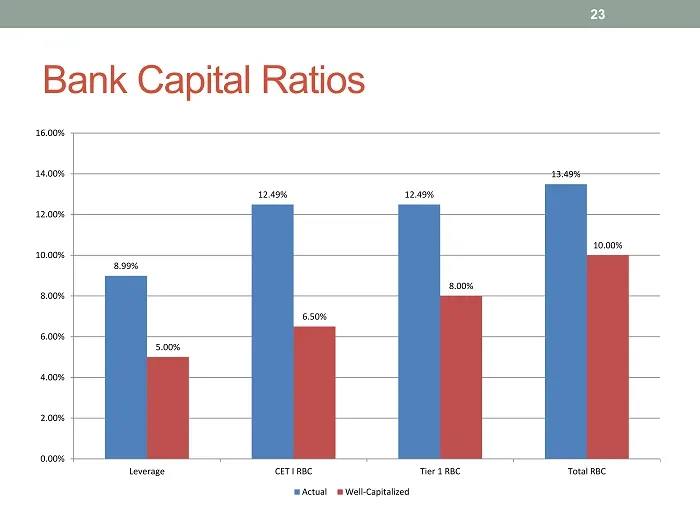
Bank Capital Ratios 23 8.99% 12.49% 12.49% 13.49% 5.00% 6.50% 8.00% 10.00% 0.00% 2.00% 4.00% 6.00% 8.00% 10.00% 12.00% 14.00% 16.00% Leverage CET I RBC Tier 1 RBC Total RBC Actual Well-Capitalized
Slide 24: Steady Asset Growth
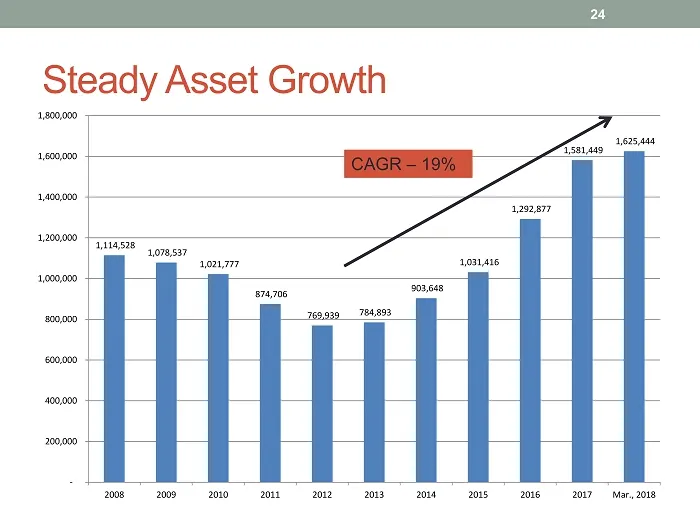
Steady Asset Growth 24 1,114,528 1,078,537 1,021,777 874,706 769,939 784,893 903,648 1,031,416 1,292,877 1,581,449 1,625,444 - 200,000 400,000 600,000 800,000 1,000,000 1,200,000 1,400,000 1,600,000 1,800,000 2008 2009 2010 2011 2012 2013 2014 2015 2016 2017 Mar., 2018 CAGR – 19%
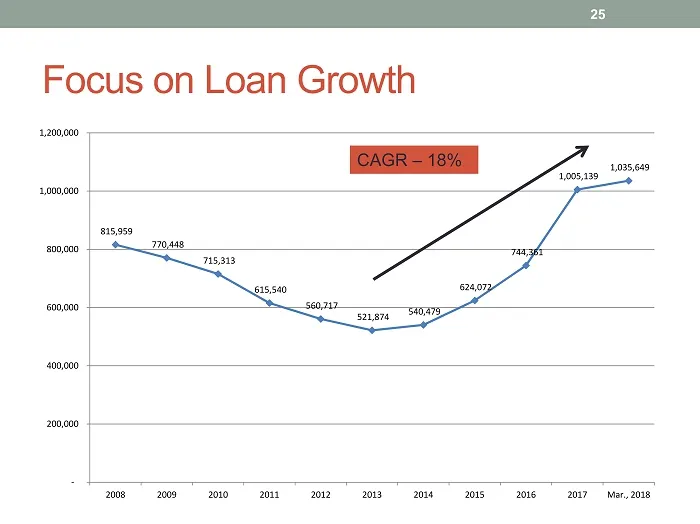
Slide 25: Focus on Loan Growth
815,959 770,448 715,313 615,540 560,717 521,874 540,479 624,072 744,361 1,005,139 1,035,649 - 200,000 400,000 600,000 800,000 1,000,000 1,200,000 2008 2009 2010 2011 2012 2013 2014 2015 2016 2017 Mar., 2018 Focus on Loan Growth CAGR – 18% 25
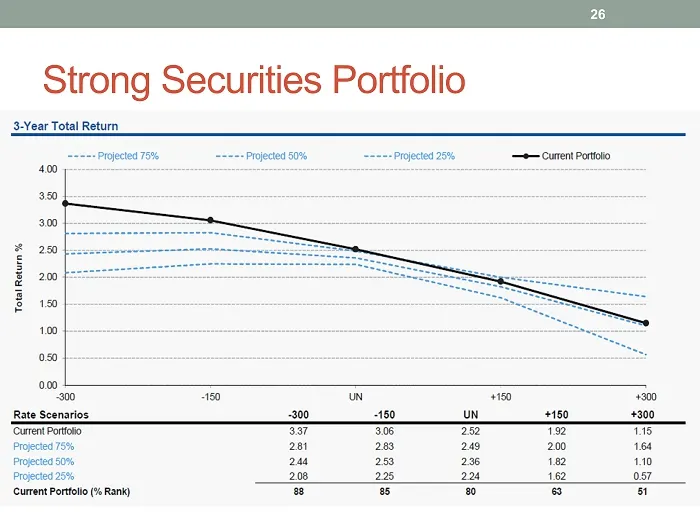
Slide 26: Strong Securities Portfolio
Strong Securities Portfolio 26
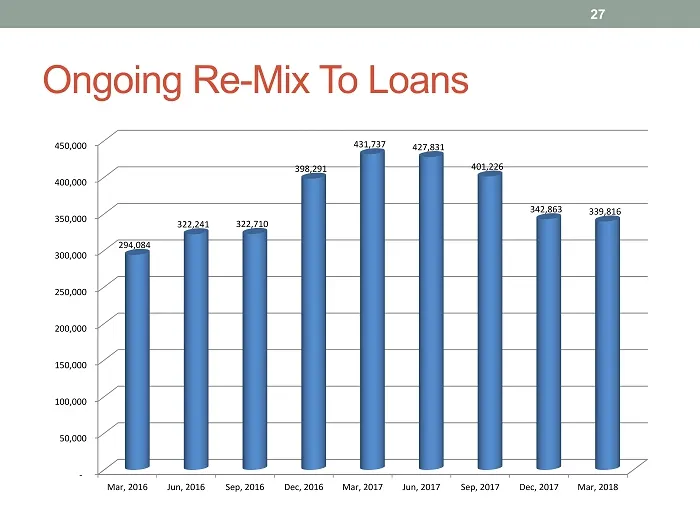
Slide 27: Ongoing Re-Mix To Loans
Ongoing Re - Mix To Loans 27 - 50,000 100,000 150,000 200,000 250,000 300,000 350,000 400,000 450,000 Mar, 2016 Jun, 2016 Sep, 2016 Dec, 2016 Mar, 2017 Jun, 2017 Sep, 2017 Dec, 2017 Mar, 2018 294,084 322,241 322,710 398,291 431,737 427,831 401,226 342,863 339,816
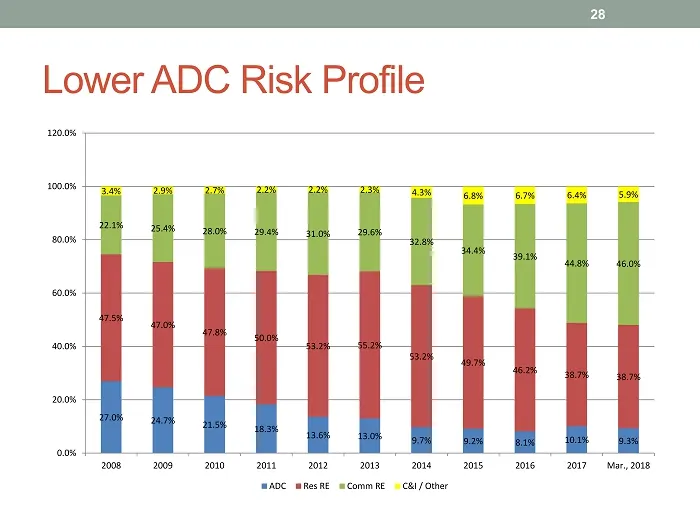
Slide 28: Lower ADC Risk Profile
Lower ADC Risk Profile 28 27.0% 24.7% 21.5% 18.3% 13.6% 13.0% 9.7% 9.2% 8.1% 10.1% 9.3% 47.5% 47.0% 47.8% 50.0% 53.2% 55.2% 53.2% 49.7% 46.2% 38.7% 38.7% 22.1% 25.4% 28.0% 29.4% 31.0% 29.6% 32.8% 34.4% 39.1% 44.8% 46.0% 3.4% 2.9% 2.7% 2.2% 2.2% 2.3% 4.3% 6.8% 6.7% 6.4% 5.9% 0.0% 20.0% 40.0% 60.0% 80
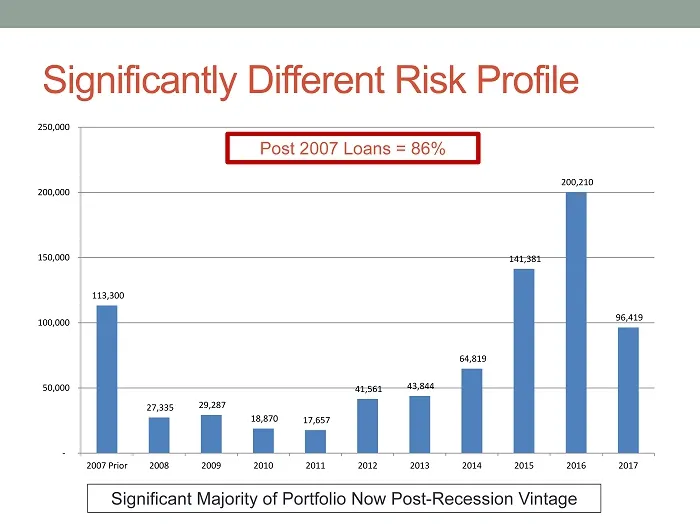
Slide 29: Significantly Different Risk Profile
113,300 27,335 29,287 18,870 17,657 41,561 43,844 64,819 141,381 200,210 96,419 - 50,000 100,000 150,000 200,000 250,000 2007 Prior 2008 2009 2010 2011 2012 2013 2014 2015 2016 2017 Significantly Different Risk Profile Significant Majority of Portfolio Now Post - Recession Vintage Post 2007 Loans =
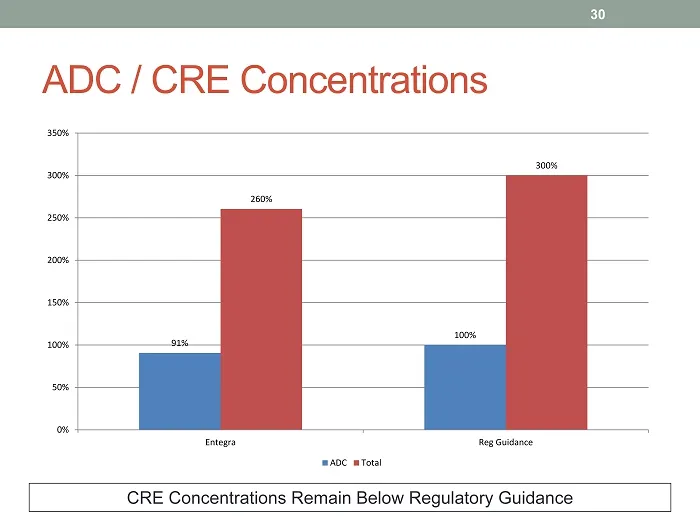
Slide 30: ADC / CRE Concentrations
ADC / CRE Concentrations CRE Concentrations Remain Below Regulatory Guidance 30 91% 100% 260% 300% 0% 50% 100% 150% 200% 250% 300% 350% Entegra Reg Guidance ADC Total
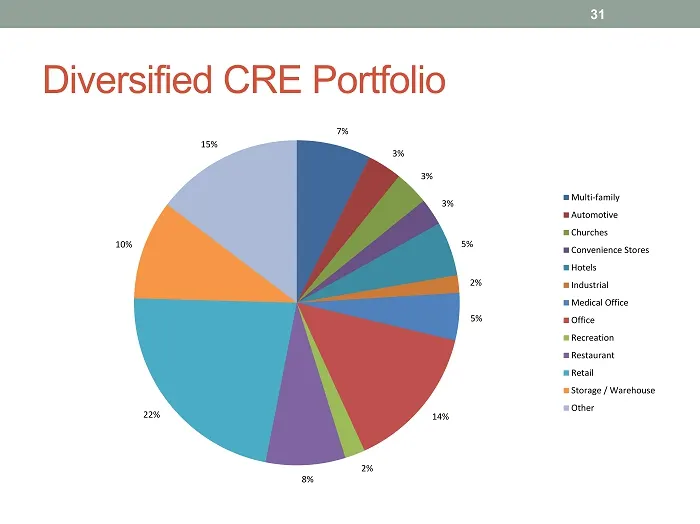
Slide 31: Diversified CRE Portfolio
Diversified CRE Portfolio 31 7% 3% 3% 3% 5% 2% 5% 14% 2% 8% 22% 10% 15% Multi-family Automotive Churches Convenience Stores Hotels Industrial Medical Office Office Recreation Restaurant Retail Storage / Warehouse Other
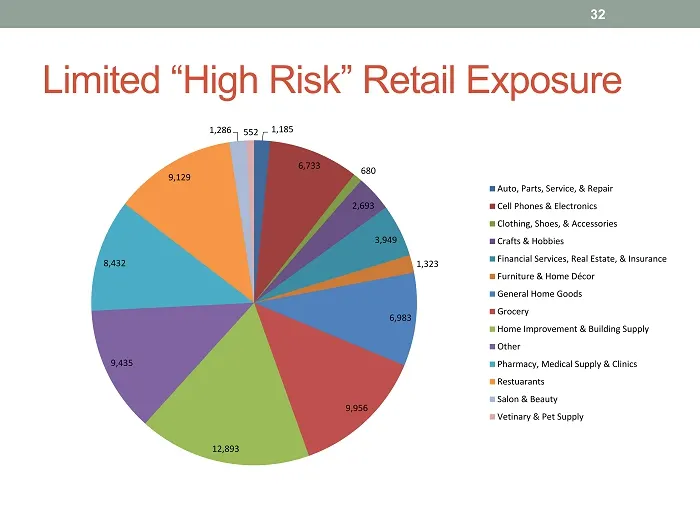
Slide 32: Limited High Risk Retail Exposure
Limited “High Risk” Retail Exposure 32 1,185 6,733 680 2,693 3,949 1,323 6,983 9,956 12,893 9,435 8,432 9,129 1,286 552 Auto, Parts, Service, & Repair Cell Phones & Electronics Clothing, Shoes, & Accessories Crafts & Hobbies Financial Services, Real Estate, & Insurance Furniture & Home Décor General
Slide 33: New Markets Driving Loan Growth
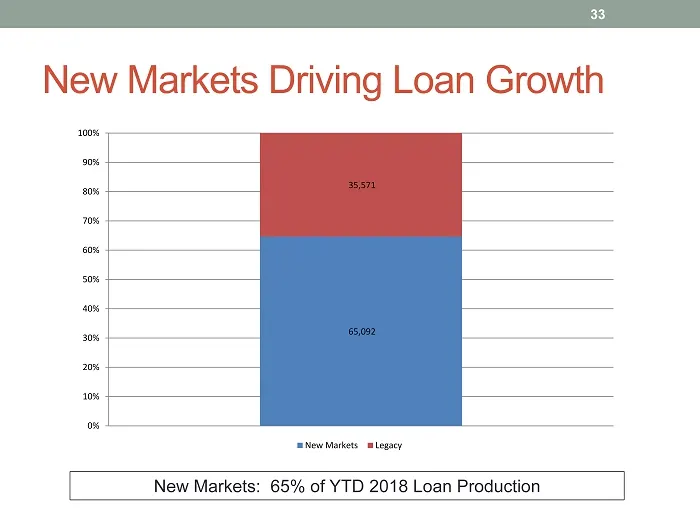
New Markets Driving Loan Growth 33 New Markets: 65% of YTD 2018 Loan Production 65,092 35,571 0% 10% 20% 30% 40% 50% 60% 70% 80% 90% 100% New Markets Legacy
Slide 34: Top Lending Relationships
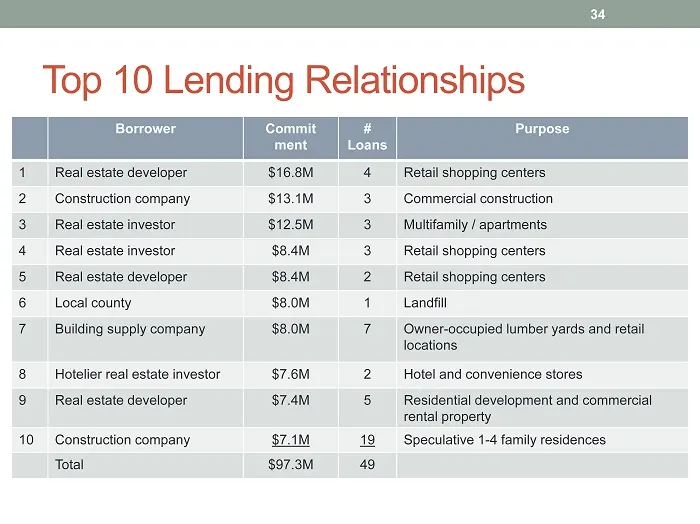
Top 10 Lending Relationships 34 Borrower Commit ment # Loans Purpose 1 Real estate developer $16.8M 4 Retail shopping centers 2 Construction company $13.1M 3 Commercial construction 3 Real estate investor $12.5M 3 Multifamily / apartments 4 Real estate investor $8.4M 3 Retail shopping centers 5 Real
Slide 35: Focus on Core Deposits
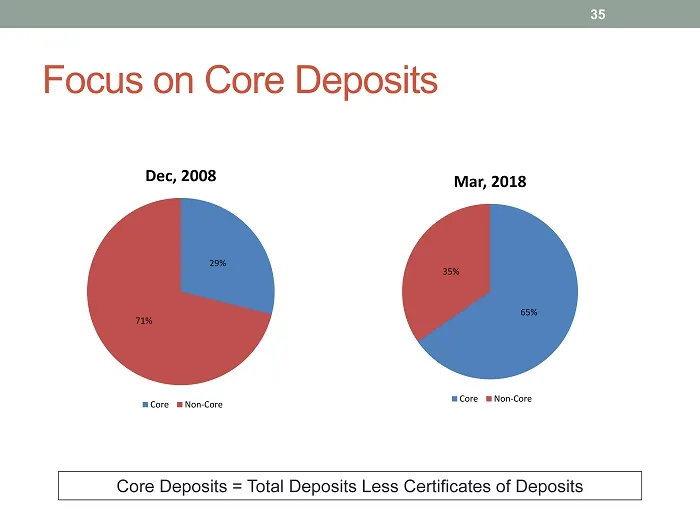
Focus on Core Deposits Core Deposits = Total Deposits Less Certificates of Deposits 29% 71% Dec, 2008 Core Non-Core 35 65% 35% Mar, 2018 Core Non-Core
Slide 36: Core Deposit Benefits
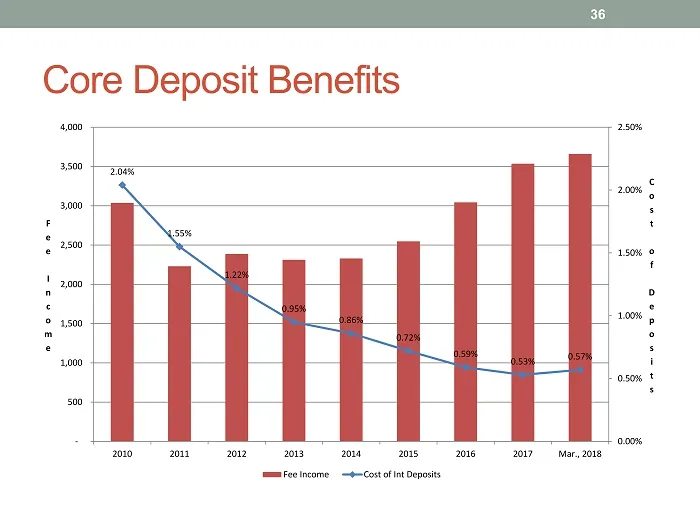
Core Deposit Benefits 36 2.04% 1.55% 1.22% 0.95% 0.86% 0.72% 0.59% 0.53% 0.57% 0.00% 0.50% 1.00% 1.50% 2.00% 2.50% - 500 1,000 1,500 2,000 2,500 3,000 3,500 4,000 2010 2011 2012 2013 2014 2015 2016 2017 Mar., 2018 C o s t o f D e p o s i t s F e e I n c o m e Fee Income Cost of Int Deposits
Slide 37: Earnings Performance
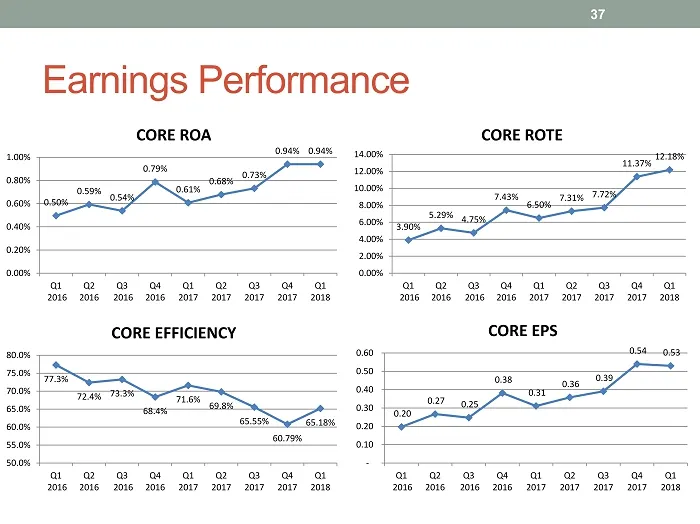
Earnings Performance 37 0.50% 0.59% 0.54% 0.79% 0.61% 0.68% 0.73% 0.94% 0.94% 0.00% 0.20% 0.40% 0.60% 0.80% 1.00% Q1 2016 Q2 2016 Q3 2016 Q4 2016 Q1 2017 Q2 2017 Q3 2017 Q4 2017 Q1 2018 CORE ROA 77.3% 72.4% 73.3% 68.4% 71.6% 69.8% 65.55% 60.79% 65.18% 50.0% 55.0% 60.0% 65.0% 70.0% 75.0% 80.0% Q1 201
Slide 38: Bigger or Better?
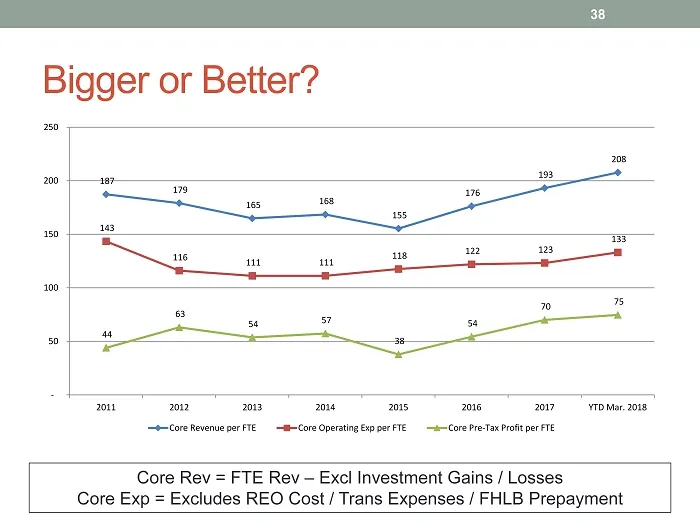
Bigger or Better? Core Rev = FTE Rev – Excl Investment Gains / Losses Core Exp = Excludes REO Cost / Trans Expenses / FHLB Prepayment 38 187 179 165 168 155 176 193 208 143 116 111 111 118 122 123 133 44 63 54 57 38 54 70 75 - 50 100 150 200 250 2011 2012 2013 2014 2015 2016 2017 YTD Mar. 2018 Core
Slide 39: Margin Income Driving Higher Earnings
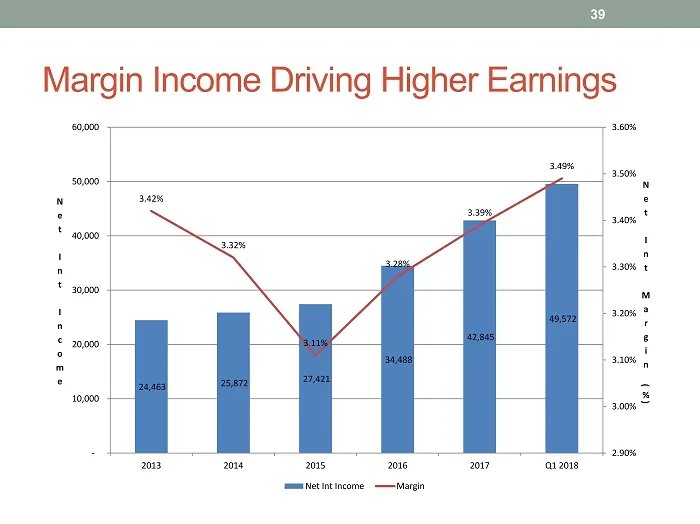
Margin Income Driving Higher Earnings 39 24,463 25,872 27,421 34,488 42,845 49,572 3.42% 3.32% 3.11% 3.28% 3.39% 3.49% 2.90% 3.00% 3.10% 3.20% 3.30% 3.40% 3.50% 3.60% - 10,000 20,000 30,000 40,000 50,000 60,000 2013 2014 2015 2016 2017 Q1 2018 N e t I n t M a r g i n ( % ) N e t I n t I n c o m e Ne
Slide 40: Problem Assets Are Shrinking
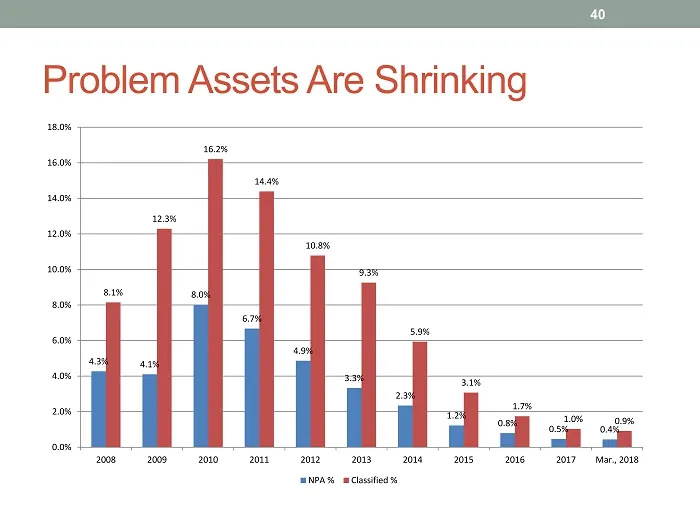
Problem Assets Are Shrinking 40 4.3% 4.1% 8.0% 6.7% 4.9% 3.3% 2.3% 1.2% 0.8% 0.5% 0.4% 8.1% 12.3% 16.2% 14.4% 10.8% 9.3% 5.9% 3.1% 1.7% 1.0% 0.9% 0.0% 2.0% 4.0% 6.0% 8.0% 10.0% 12.0% 14.0% 16.0% 18.0% 2008 2009 2010 2011 2012 2013 2014 2015 2016 2017 Mar., 2018 NPA % Classified %
Slide 41: Re-focused on SBA
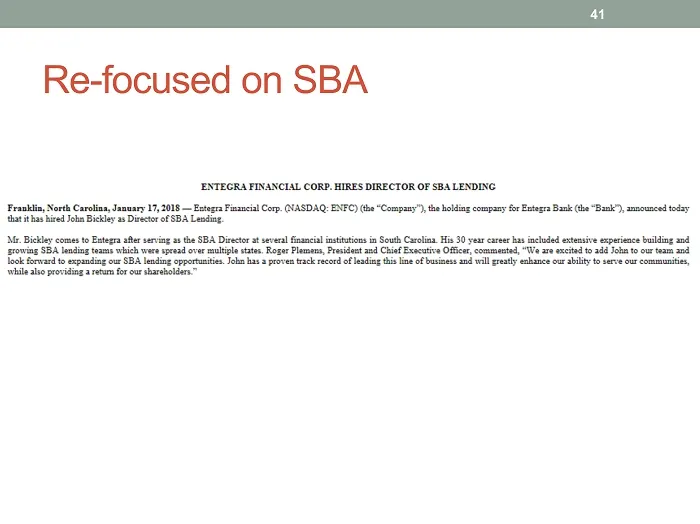
ee Re-focused on SBA ENTEGRA FINANCIAL CORD, HIRES DIRECTOR OF SBA LENDING. Franka, North Carolina, January 17,2018 — Estgra Finacial Corp. NASDAQ: ENFC) (he “Company”? th oding company fr Bara Bank (he “Bank, announced today ‘taitha hited Joka Bickley as Detor of SBA Lending. Me Bickley comes to Es
Slide 42: Neutral Interest Rate Risk Position
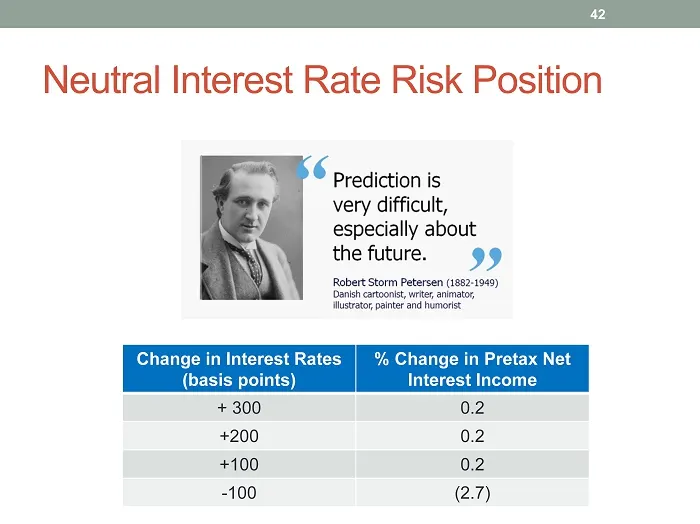
Neutral Interest Rate Risk Position 42 Change in Interest Rates (basis points) % Change in Pretax Net Interest Income + 300 0.2 +200 0.2 +100 0.2 - 100 (2.7)
Slide 43: NOL Protection Plan Limits 5% Investors
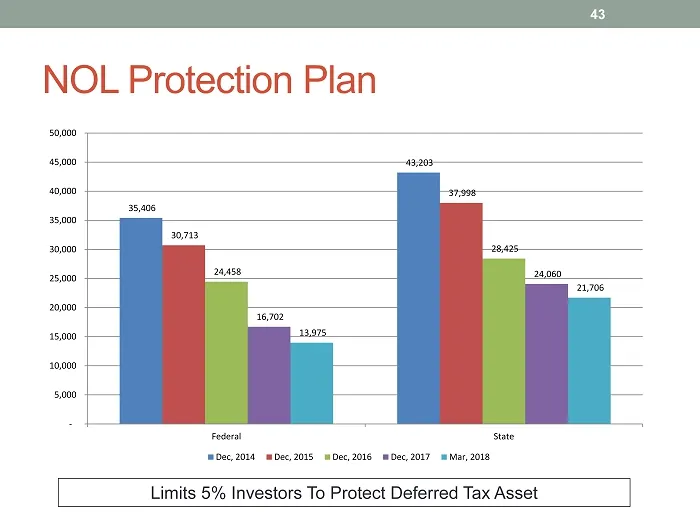
NOL Protection Plan Limits 5% Investors To Protect Deferred Tax Asset 43 35,406 43,203 30,713 37,998 24,458 28,425 16,702 24,060 13,975 21,706 - 5,000 10,000 15,000 20,000 25,000 30,000 35,000 40,000 45,000 50,000 Federal State Dec, 2014 Dec, 2015 Dec, 2016 Dec, 2017 Mar, 2018
Slide 44: Summary
Summary 44
Slide 45: Summary
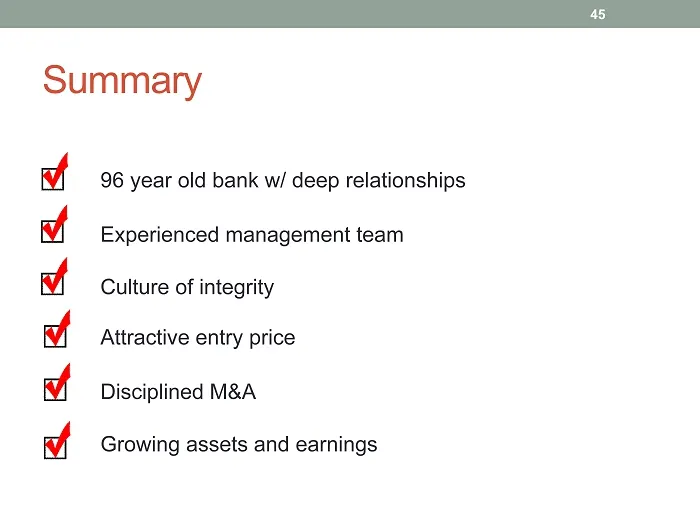
Summary 96 year o ld bank w/ deep relationships Experienced management team Culture of integrity Attractive entry price Disciplined M&A Growing assets and earnings 45
Slide 46: Summary
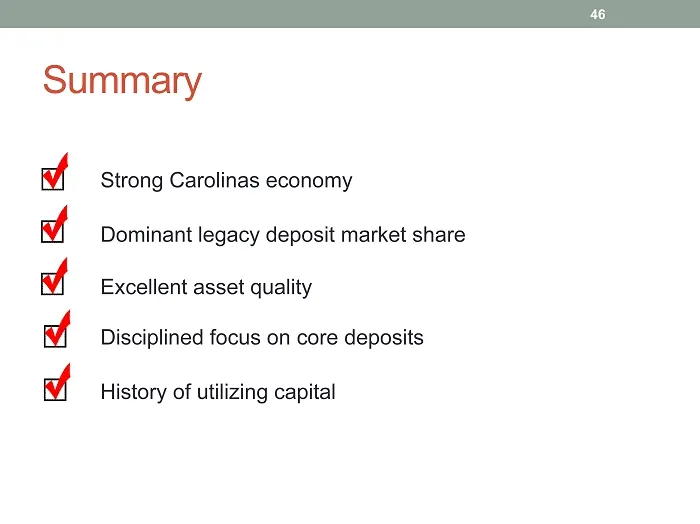
Summary Strong Carolinas economy Dominant legacy deposit market share Excellent asset quality Disciplined focus on core deposits History of utilizing capital 46
Slide 47: GAAP Appendix
GAAP Appendix 47
Slide 48: GAAP Ratios
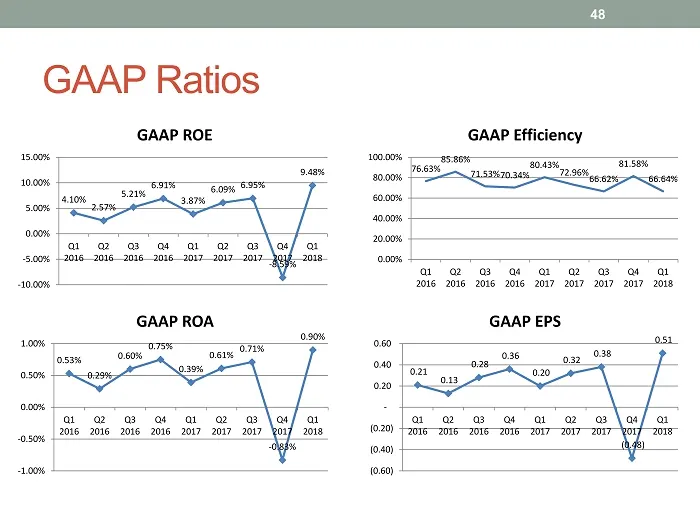
48 GAAP Ratios 4.10% 2.57% 5.21% 6.91% 3.87% 6.09% 6.95% - 8.59% 9.48% -10.00% -5.00% 0.00% 5.00% 10.00% 15.00% Q1 2016 Q2 2016 Q3 2016 Q4 2016 Q1 2017 Q2 2017 Q3 2017 Q4 2017 Q1 2018 GAAP ROE 76.63% 85.86% 71.53% 70.34% 80.43% 72.96% 66.62% 81.58% 66.64% 0.00% 20.00% 40.00% 60.00% 80.00% 100.00% Q1
Source: SEC EDGAR · 8-K filed May 18, 2018
More decks from Entegra Financial Corp
 Merger or Acquisition (February 2019)21 slides · Feb 6, 2019
 Q4 2018 Earnings Presentation17 slides · Jan 24, 2019
 Merger or Acquisition (January 2019)25 slides · Jan 16, 2019
 Q3 2018 Earnings Presentation14 slides · Oct 18, 2018
 Investor Presentation (September 2018)48 slides · Sep 17, 2018
 Q2 2018 Earnings Presentation10 slides · Jul 19, 2018