Entegra Financial — Q2 2018 Earnings Presentation
10 slides from Entegra Financial's earnings presentation, Jul 19, 2018
Slide 1: Entegra Financial Corp. Second Quarter 2018 Earnings Call
ENTEGRA FINANCIAL CORP. Second Quarter 2018 Earnings Call July 20, 2018
Slide 2: Forward-Looking Statements
The discussions included in this document may contain “forward - looking statements” within the meaning of the Private Securities Litigation Reform Act of 1995 , including Section 21 E of the Securities Exchange Act of 1934 and Section 27 A of the Securities Act of 1933 . Such statements involve kno
Slide 3: Non-GAAP / Financial Basis
Statements included in this document include non - GAAP financial measures and should be read along with the accompanying tables in Appendix A to our quarterly earnings release furnished to the SEC as of the date hereof , which provide a reconciliation of non - GAAP financial measures to GAAP financ
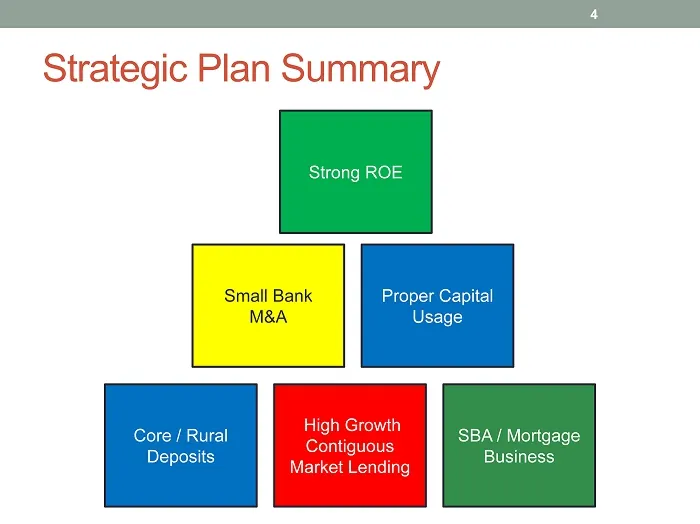
Slide 4: Strategic Plan Summary
Strategic Plan Summary Strong ROE 4 Core / Rural Deposits High Growth Contiguous Market Lending SBA / Mortgage Business Small Bank M&A Proper Capital Usage Strong ROE
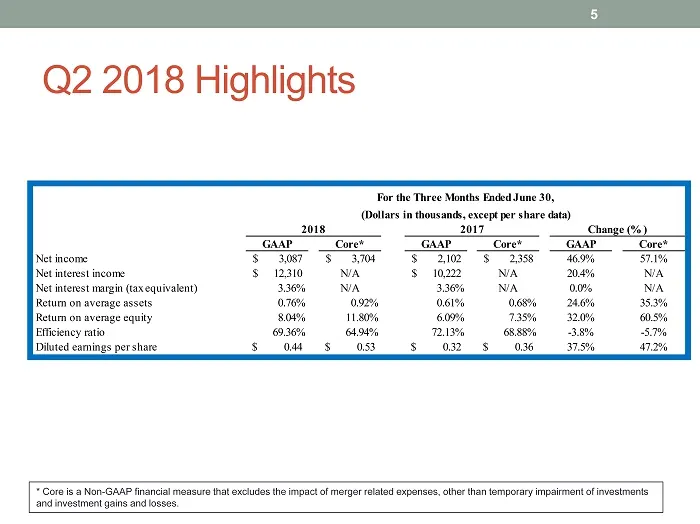
Slide 5: Q2 2018 Highlights
Q2 2018 Highlights 5 GAAP Core* GAAP Core* GAAP Core* Net income 3,087$ 3,704$ 2,102$ 2,358$ 46.9% 57.1% Net interest income 12,310$ N/A 10,222$ N/A 20.4% N/A Net interest margin (tax equivalent) 3.36% N/A 3.36% N/A 0.0% N/A Return on average assets 0.76% 0.92% 0.61% 0.68% 24.6% 35.3% Return on aver
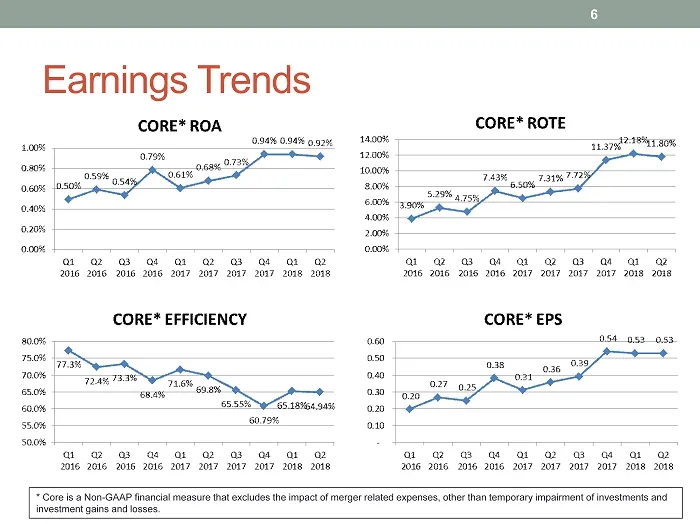
Slide 6: Earnings Trends
Earnings Trends 6 * Core is a Non - GAAP financial measure that excludes the impact of merger related expenses, other than temporary impairment of i nvestments and investment gains and losses.
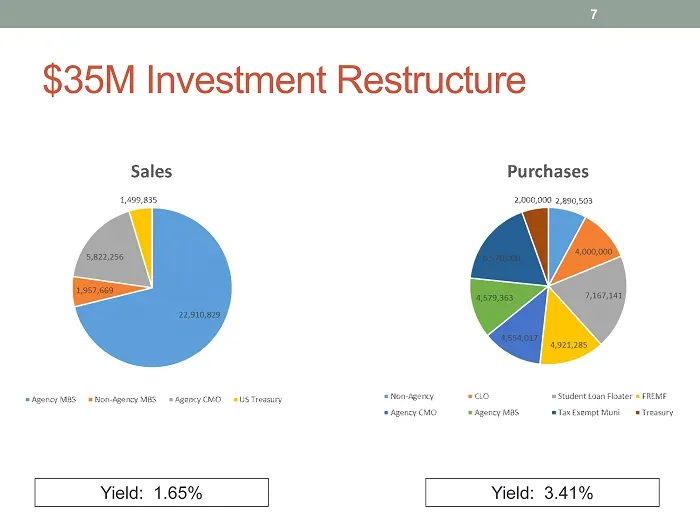
Slide 7: $35M Investment Restructure
$35M Investment Restructure 7 Yield: 1.65% Yield: 3.41%
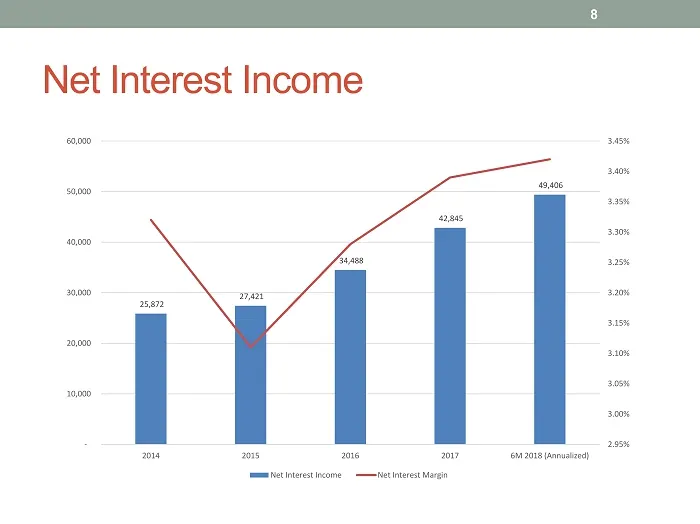
Slide 8: Net Interest Income and Net Interest Margin
Net Interest Income 8 25,872 27,421 34,488 42,845 49,406 2.95% 3.00% 3.05% 3.10% 3.15% 3.20% 3.25% 3.30% 3.35% 3.40% 3.45% - 10,000 20,000 30,000 40,000 50,000 60,000 2014 2015 2016 2017 6M 2018 (Annualized) Net Interest Income Net Interest Margin
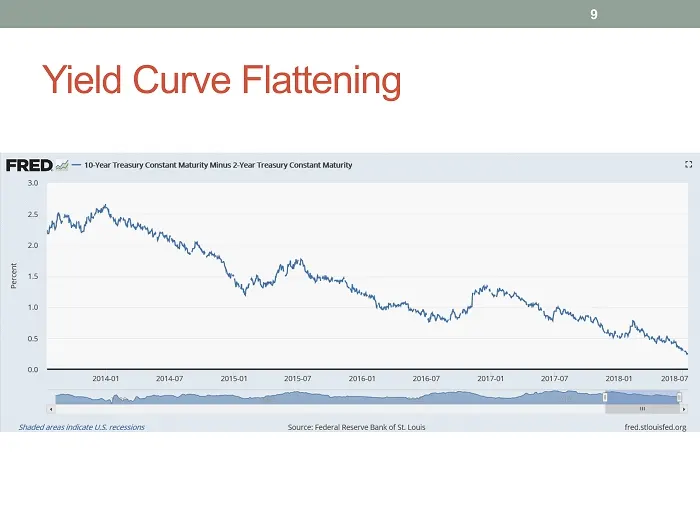
Slide 9: Yield Curve Flattening
a: Yield Curve Flattening
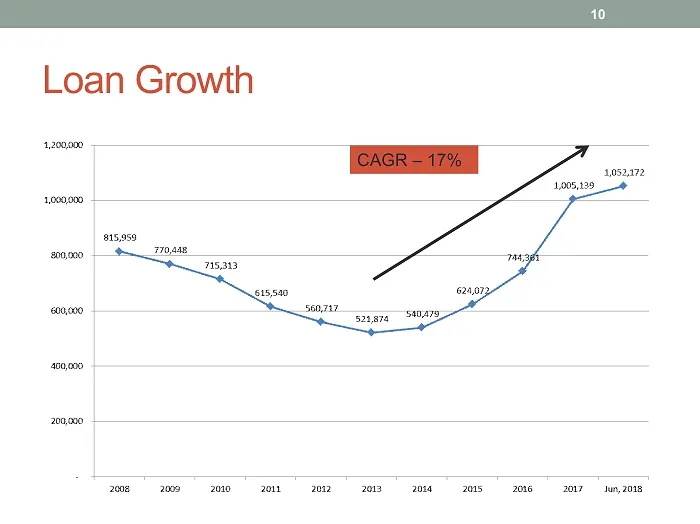
Slide 10: Loan Growth
Loan Growth [CAGR=17% | 1.032.172 11005,138 2,000.00 815,959 sop 70888 115313 00.000 zoe amo aaa 2202012 ads 20272018
Source: SEC EDGAR · 8-K filed Jul 19, 2018
More decks from Entegra Financial Corp
 Merger or Acquisition (February 2019)21 slides · Feb 6, 2019
 Q4 2018 Earnings Presentation17 slides · Jan 24, 2019
 Merger or Acquisition (January 2019)25 slides · Jan 16, 2019
 Q3 2018 Earnings Presentation14 slides · Oct 18, 2018
 Investor Presentation (September 2018)48 slides · Sep 17, 2018
 Investor Presentation (May 2018)48 slides · May 18, 2018