Entegra Financial — Q3 2018 Earnings Presentation
14 slides from Entegra Financial's earnings presentation, Oct 18, 2018
Slide 1: Entegra Financial Corp. Third Quarter 2018 Earnings Call
ENTEGRA FINANCIAL CORP. Third Quarter 2018 Earnings Call October 18, 2018
Slide 2: Forward-Looking Statements
The discussions included in this document may contain “forward - looking statements” within the meaning of the Private Securities Litigation Reform Act of 1995 , including Section 21 E of the Securities Exchange Act of 1934 and Section 27 A of the Securities Act of 1933 . Such statements involve kno
Slide 3: Non-GAAP / Financial Basis
Statements included in this press release include non - GAAP financial measures and should be read along with the accompanying tables in Appendix A, which provide a reconciliation of non - GAAP financial measures to GAAP financial measures . This press release and the accompanying tables discuss fin
Slide 4: Strategic Plan Summary
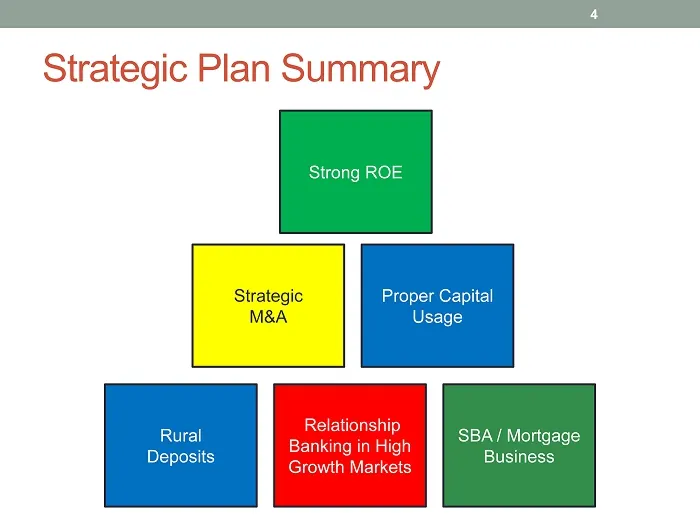
Strategic Plan Summary Strong ROE 4 Rural Deposits Relationship Banking in High Growth Markets SBA / Mortgage Business Strategic M&A Proper Capital Usage Strong ROE
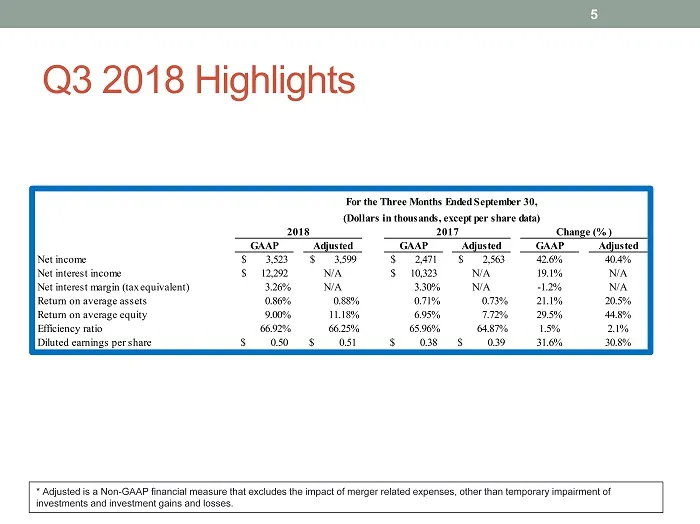
Slide 5: Q3 2018 Highlights
Q3 2018 Highlights 5 * Adjusted is a Non - GAAP financial measure that excludes the impact of merger related expenses, other than temporary impairment of investments and investment gains and losses. GAAP Adjusted GAAP Adjusted GAAP Adjusted Net income 3,523$ 3,599$ 2,471$ 2,563$ 42.6% 40.4% Net inte
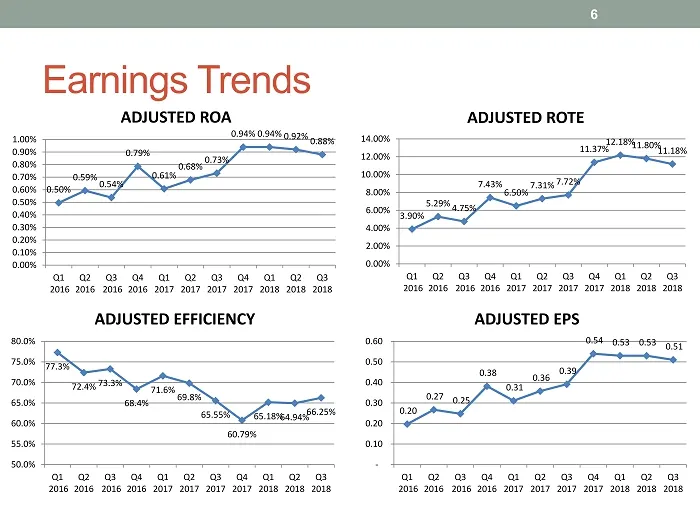
Slide 6: Earnings Trends
Earnings Trends 6 77.3% 72.4% 73.3% 68.4% 71.6% 69.8% 65.55% 60.79% 65.18% 64.94% 66.25% 50.0% 55.0% 60.0% 65.0% 70.0% 75.0% 80.0% Q1 2016 Q2 2016 Q3 2016 Q4 2016 Q1 2017 Q2 2017 Q3 2017 Q4 2017 Q1 2018 Q2 2018 Q3 2018 ADJUSTED EFFICIENCY 3.90% 5.29% 4.75% 7.43% 6.50% 7.31% 7.72% 11.37% 12.18% 11.80
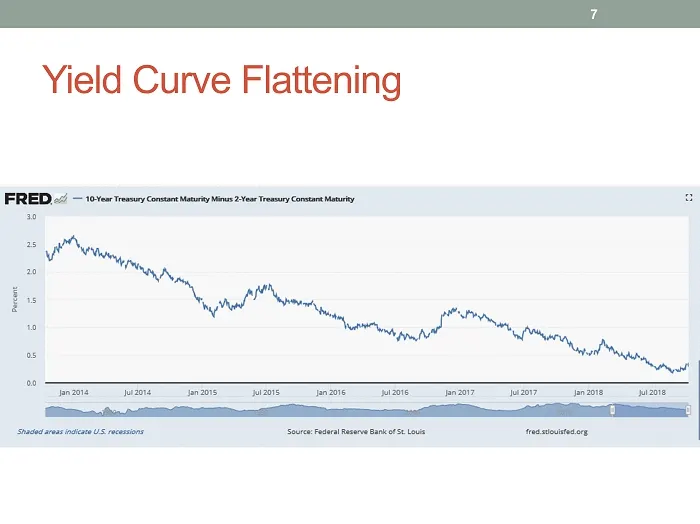
Slide 7: Yield Curve Flattening
Yield Curve Flattening FRED 0/ — 10 trmryConsart Maney Virus 2:0 Tear Contant Matiy
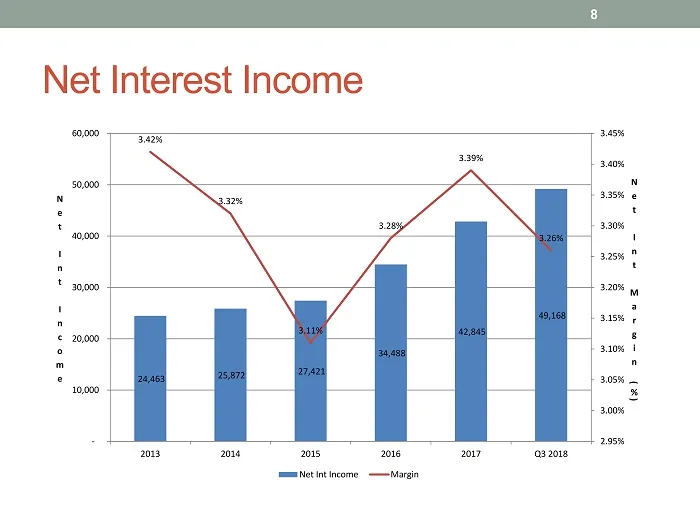
Slide 8: Net Interest Income
Net Interest Income 8 24,463 25,872 27,421 34,488 42,845 49,168 3.42% 3.32% 3.11% 3.28% 3.39% 3.26% 2.95% 3.00% 3.05% 3.10% 3.15% 3.20% 3.25% 3.30% 3.35% 3.40% 3.45% - 10,000 20,000 30,000 40,000 50,000 60,000 2013 2014 2015 2016 2017 Q3 2018 N e t I n t M a r g i n ( % ) N e t I n t I n c o m e Net
Slide 9: Noninterest Income
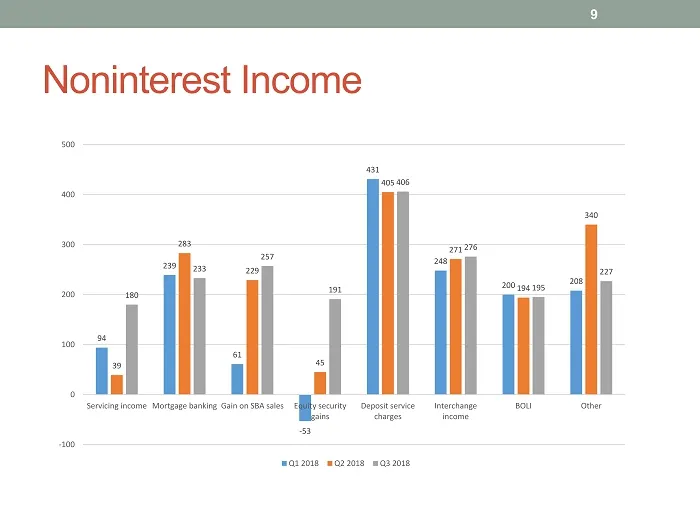
Noninterest Income 9 94 239 61 - 53 431 248 200 208 39 283 229 45 405 271 194 340 180 233 257 191 406 276 195 227 -100 0 100 200 300 400 500 Servicing income Mortgage banking Gain on SBA sales Equity security gains Deposit service charges Interchange income BOLI Other Q1 2018 Q2 2018 Q3 2018
Slide 10: Noninterest Expense
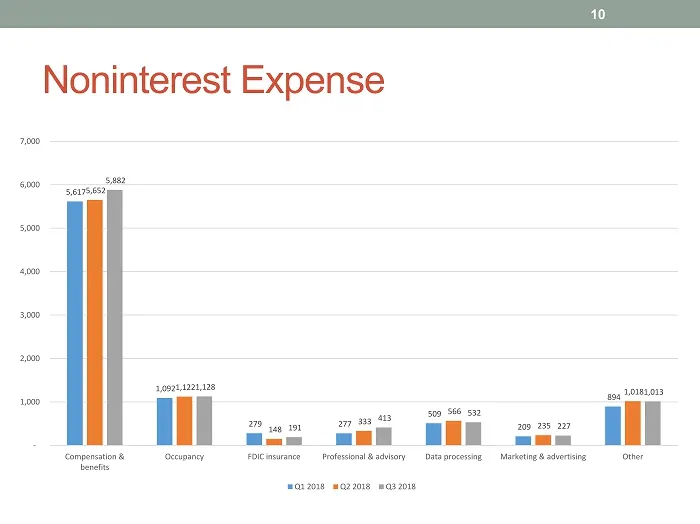
Noninterest Expense 10 5,617 1,092 279 277 509 209 894 5,652 1,122 148 333 566 235 1,018 5,882 1,128 191 413 532 227 1,013 - 1,000 2,000 3,000 4,000 5,000 6,000 7,000 Compensation & benefits Occupancy FDIC insurance Professional & advisory Data processing Marketing & advertising Other Q1 2018 Q2 201
Slide 11: Asset Quality Dashboard
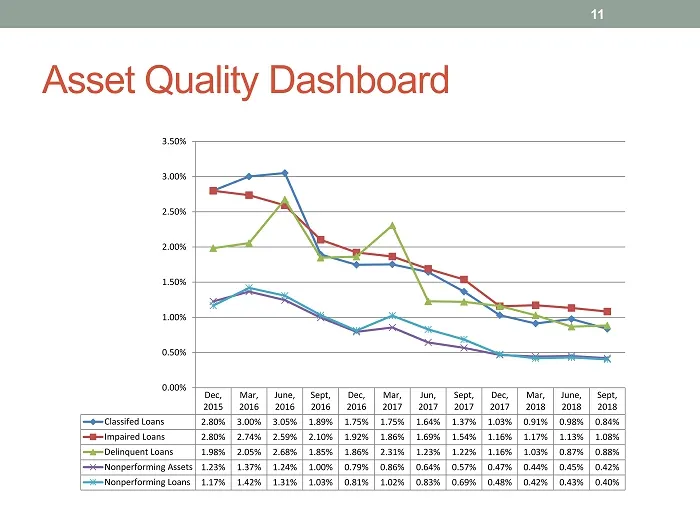
Asset Quality Dashboard 11 Dec, 2015 Mar, 2016 June, 2016 Sept, 2016 Dec, 2016 Mar, 2017 Jun, 2017 Sept, 2017 Dec, 2017 Mar, 2018 June, 2018 Sept, 2018 Classifed Loans 2.80% 3.00% 3.05% 1.89% 1.75% 1.75% 1.64% 1.37% 1.03% 0.91% 0.98% 0.84% Impaired Loans 2.80% 2.74% 2.59% 2.10% 1.92% 1.86% 1.69% 1.5
Slide 12: Organic Loan Growth
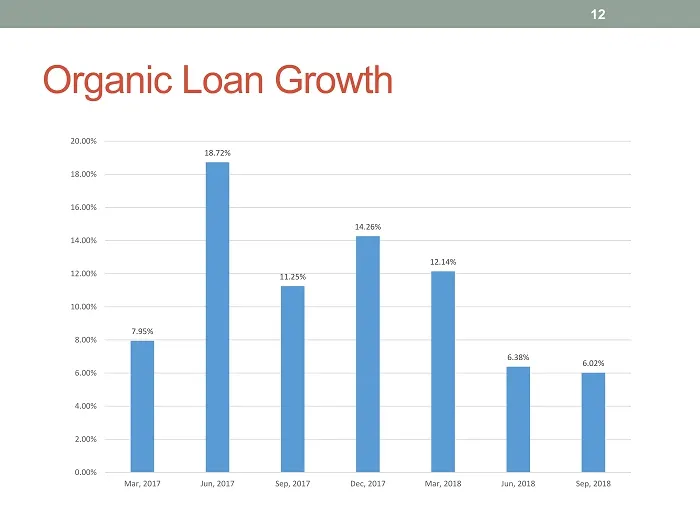
Organic Loan Growth 12 7.95% 18.72% 11.25% 14.26% 12.14% 6.38% 6.02% 0.00% 2.00% 4.00% 6.00% 8.00% 10.00% 12.00% 14.00% 16.00% 18.00% 20.00% Mar, 2017 Jun, 2017 Sep, 2017 Dec, 2017 Mar, 2018 Jun, 2018 Sep, 2018
Slide 13: Deposit Betas
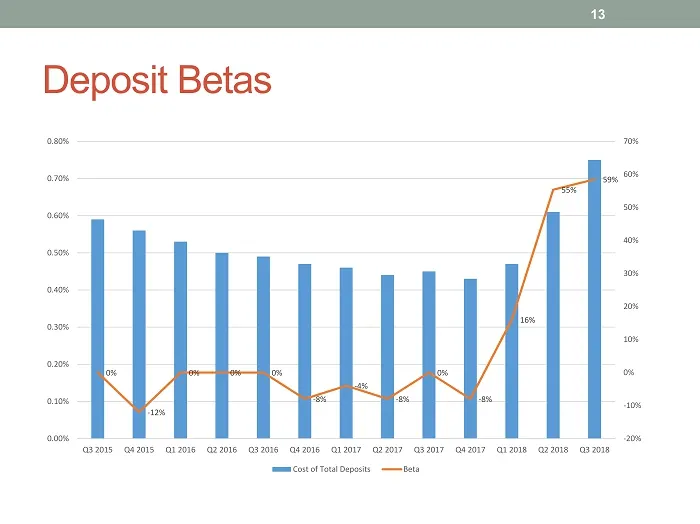
Deposit Betas 13 0% - 12% 0% 0% 0% - 8% - 4% - 8% 0% - 8% 16% 55% 59% -20% -10% 0% 10% 20% 30% 40% 50% 60% 70% 0.00% 0.10% 0.20% 0.30% 0.40% 0.50% 0.60% 0.70% 0.80% Q3 2015 Q4 2015 Q1 2016 Q2 2016 Q3 2016 Q4 2016 Q1 2017 Q2 2017 Q3 2017 Q4 2017 Q1 2018 Q2 2018 Q3 2018 Cost of Total Deposits Beta
Slide 14: Organic Deposit Growth
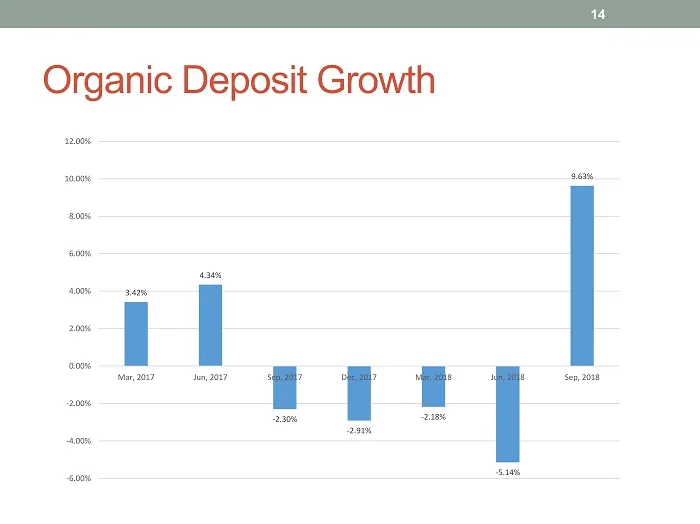
Organic Deposit Growth 14 3.42% 4.34% - 2.30% - 2.91% - 2.18% - 5.14% 9.63% -6.00% -4.00% -2.00% 0.00% 2.00% 4.00% 6.00% 8.00% 10.00% 12.00% Mar, 2017 Jun, 2017 Sep, 2017 Dec, 2017 Mar, 2018 Jun, 2018 Sep, 2018
Source: SEC EDGAR · 8-K filed Oct 18, 2018
More decks from Entegra Financial Corp
 Merger or Acquisition (February 2019)21 slides · Feb 6, 2019
 Q4 2018 Earnings Presentation17 slides · Jan 24, 2019
 Merger or Acquisition (January 2019)25 slides · Jan 16, 2019
 Investor Presentation (September 2018)48 slides · Sep 17, 2018
 Q2 2018 Earnings Presentation10 slides · Jul 19, 2018
 Investor Presentation (May 2018)48 slides · May 18, 2018