Naspers Limited Class N · JSE:NPN
Naspers Limited Class N — H1 FY2017 Earnings Presentation
51 slides from Naspers Limited Class N's earnings presentation, November 2016

Slide 1: Analyst Booklet – detailed financials
Analyst Booklet – detailed financials For the year six months ended 30 September 2016
Slide 2: Important information
Important information This presentation contains forward-looking statements as defined in the United States Private Securities Litigation Reform Act of 1995. Words such as “believe”, “anticipate”, “intend”, “seek”, “will”, “plan”, “could”, “may”, “endeavour” and similar expressions are intended to i

Slide 3: Financials
FINANCIALS
Slide 4: Synopsis of financials
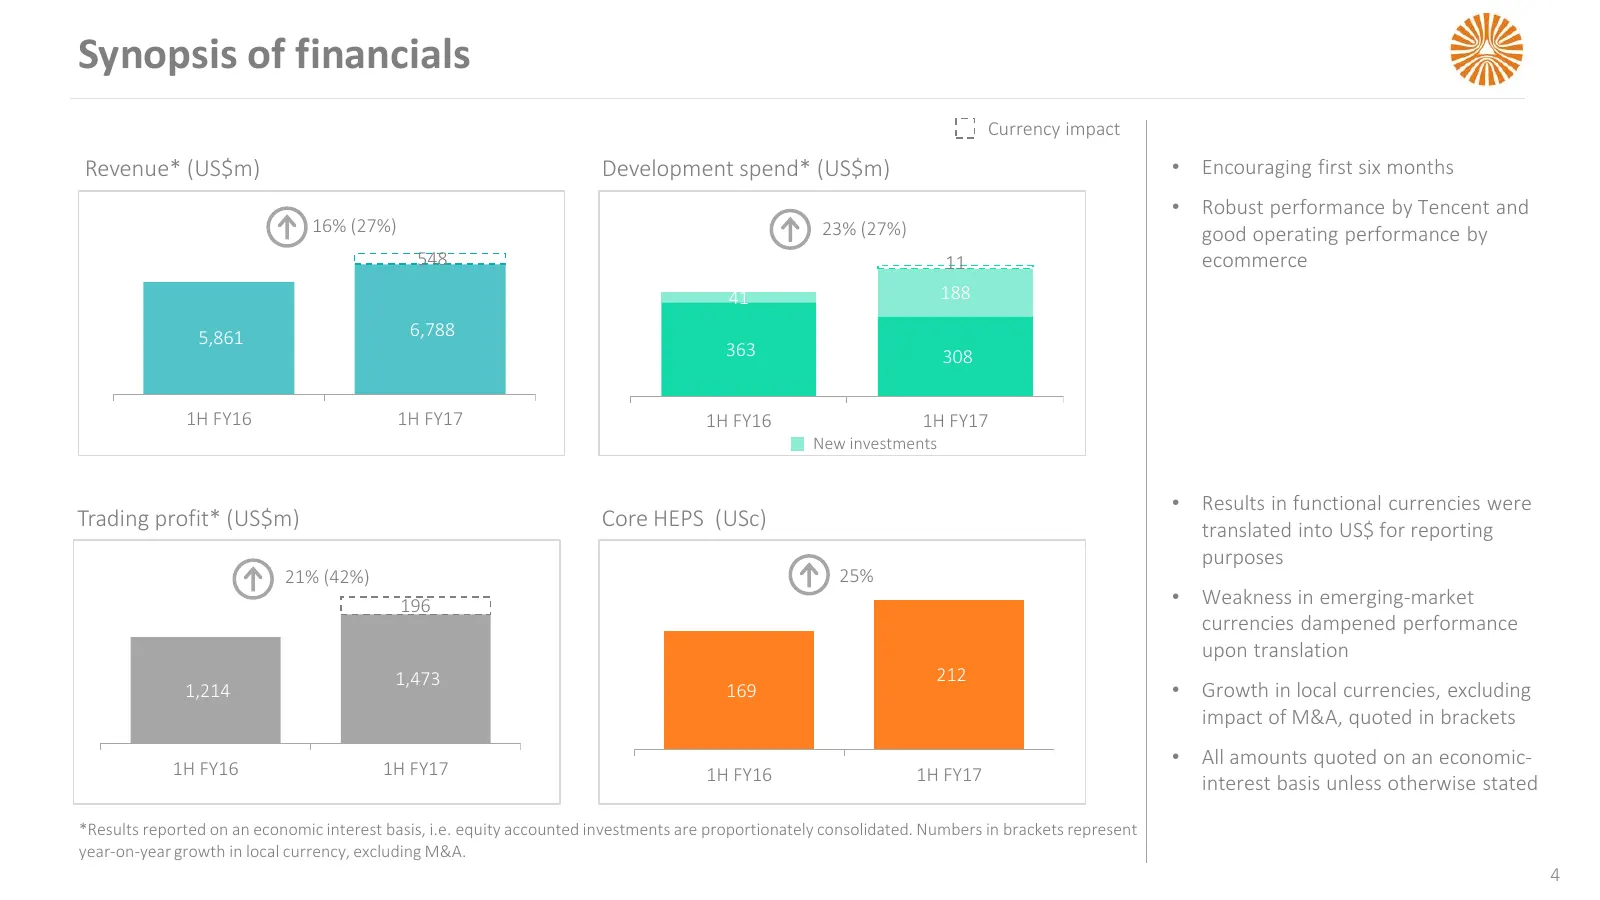
Synopsis of financials Currency impact Revenue* (US$m) Development spend* (US$m) • Encouraging first six months • Robust performance by Tencent and 16% (27%) 23% (27%) good operating performance by 548 11 ecommerce 41 188 5,861 6,788 363 308 1H FY16 1H FY17 1H FY16 1H FY17 New investments • Results
Slide 5: Revenue: Tencent and ecommerce drives acceleration in growth rate
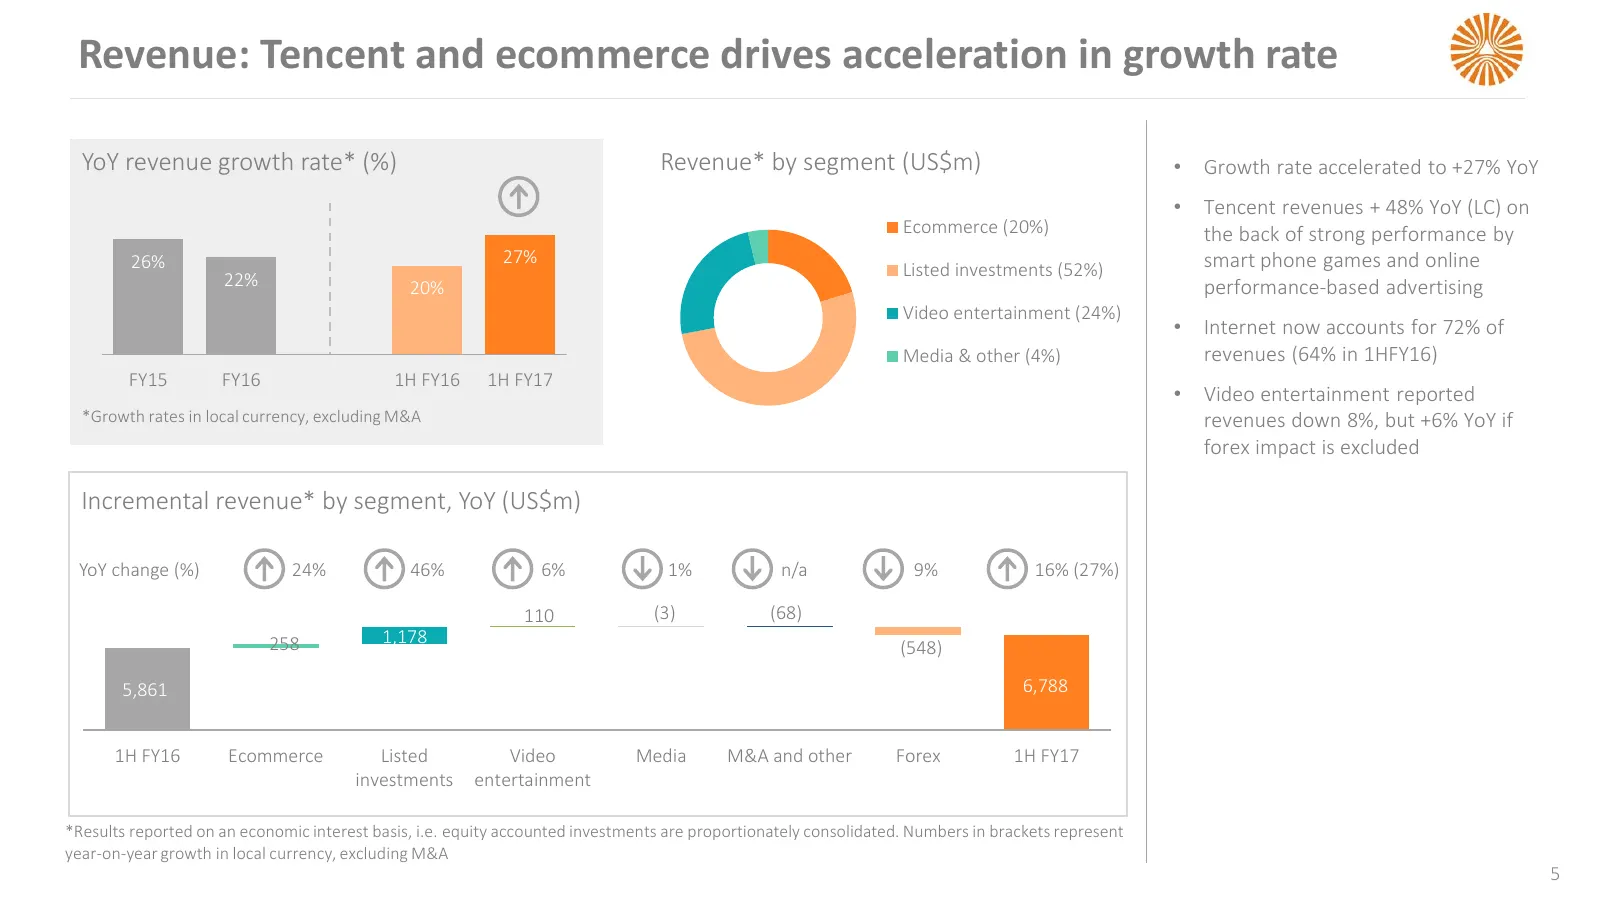
Revenue: Tencent and ecommerce drives acceleration in growth rate YoY revenue growth rate* (%) Revenue* by segment (US$m) • Growth rate accelerated to +27% YoY • Tencent revenues + 48% YoY (LC) on Ecommerce (20%) the back of strong performance by 26% 27% smart phone games and online 22% Listed inves
Slide 6: Revenue: YoY growth ahead of 3yr CAGR
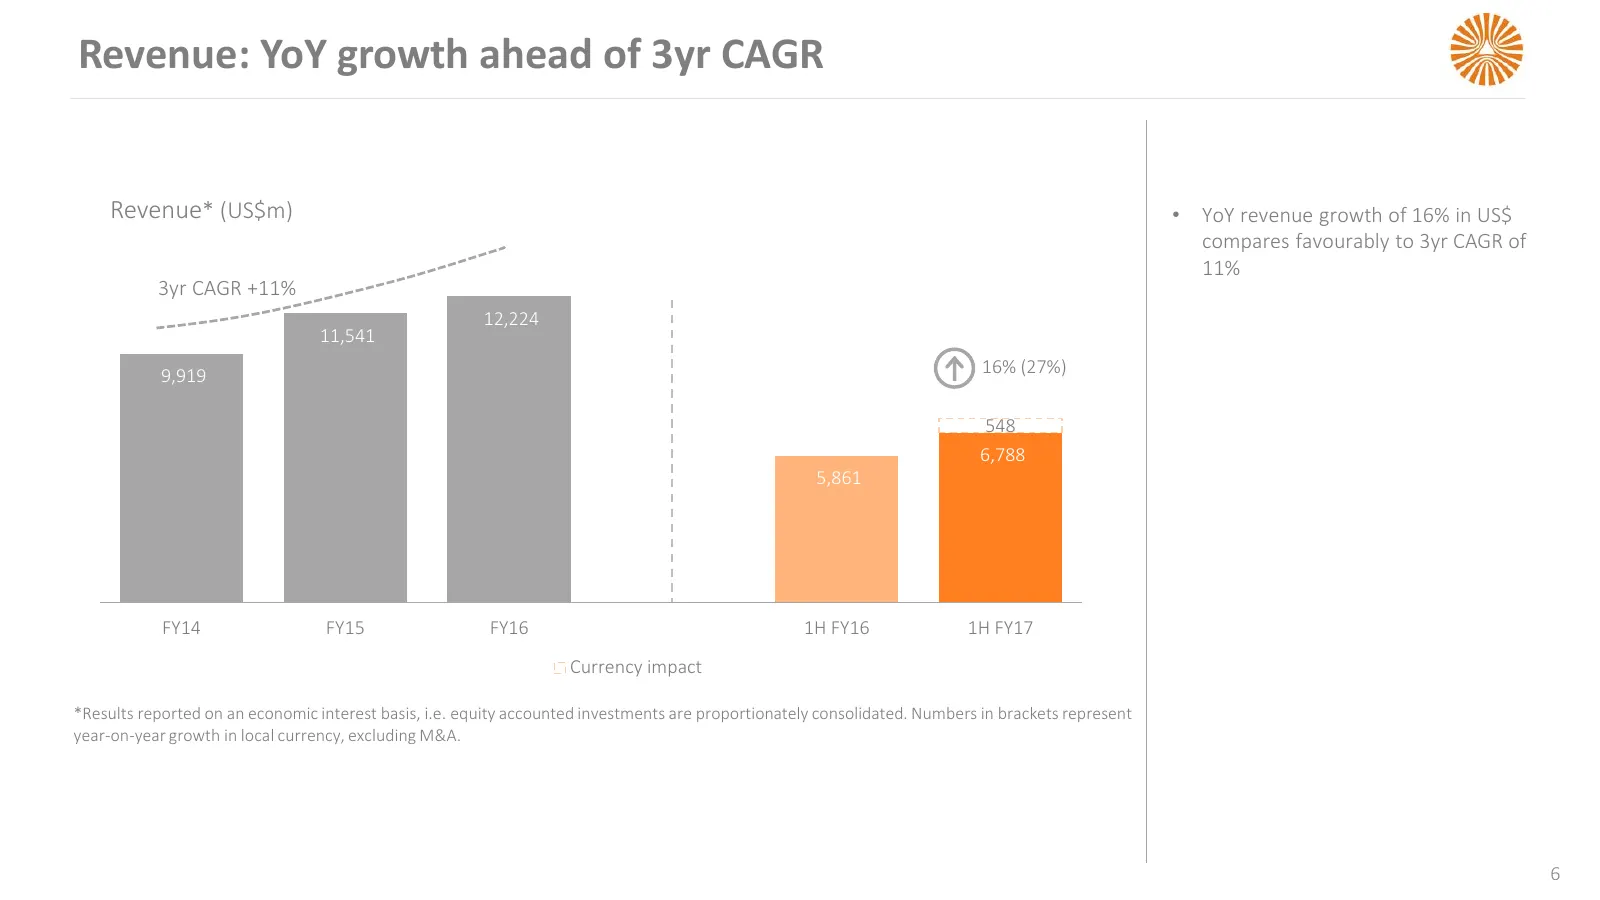
Revenue: YoY growth ahead of 3yr CAGR Revenue* (US$m) • YoY revenue growth of 16% in US$ compares favourably to 3yr CAGR of 11% 3yr CAGR +11% 12,224 11,541 9,919 16% (27%) 548 6,788 5,861 FY14 FY15 FY16 1H FY16 1H FY17 Currency impact *Results reported on an economic interest basis, i.e. equity acco
Slide 7: Diversified business mix – ongoing shift
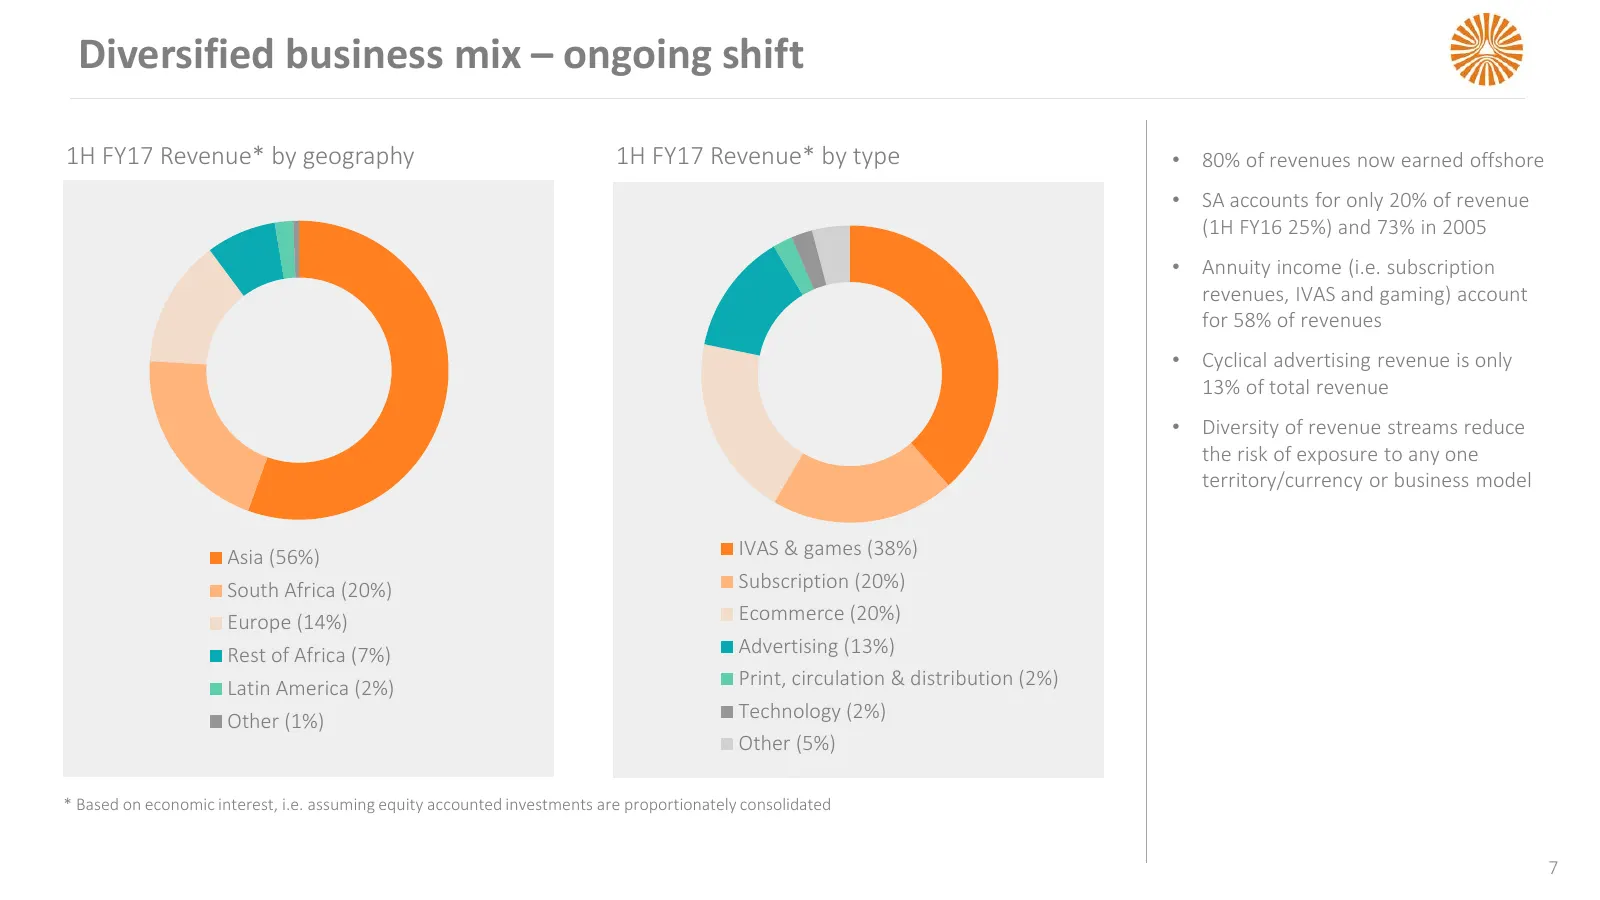
Diversified business mix – ongoing shift 1H FY17 Revenue* by geography 1H FY17 Revenue* by type • 80% of revenues now earned offshore • SA accounts for only 20% of revenue (1H FY16 25%) and 73% in 2005 • Annuity income (i.e. subscription revenues, IVAS and gaming) account for 58% of revenues • Cycli
Slide 8: Development spend on an economic interest basis
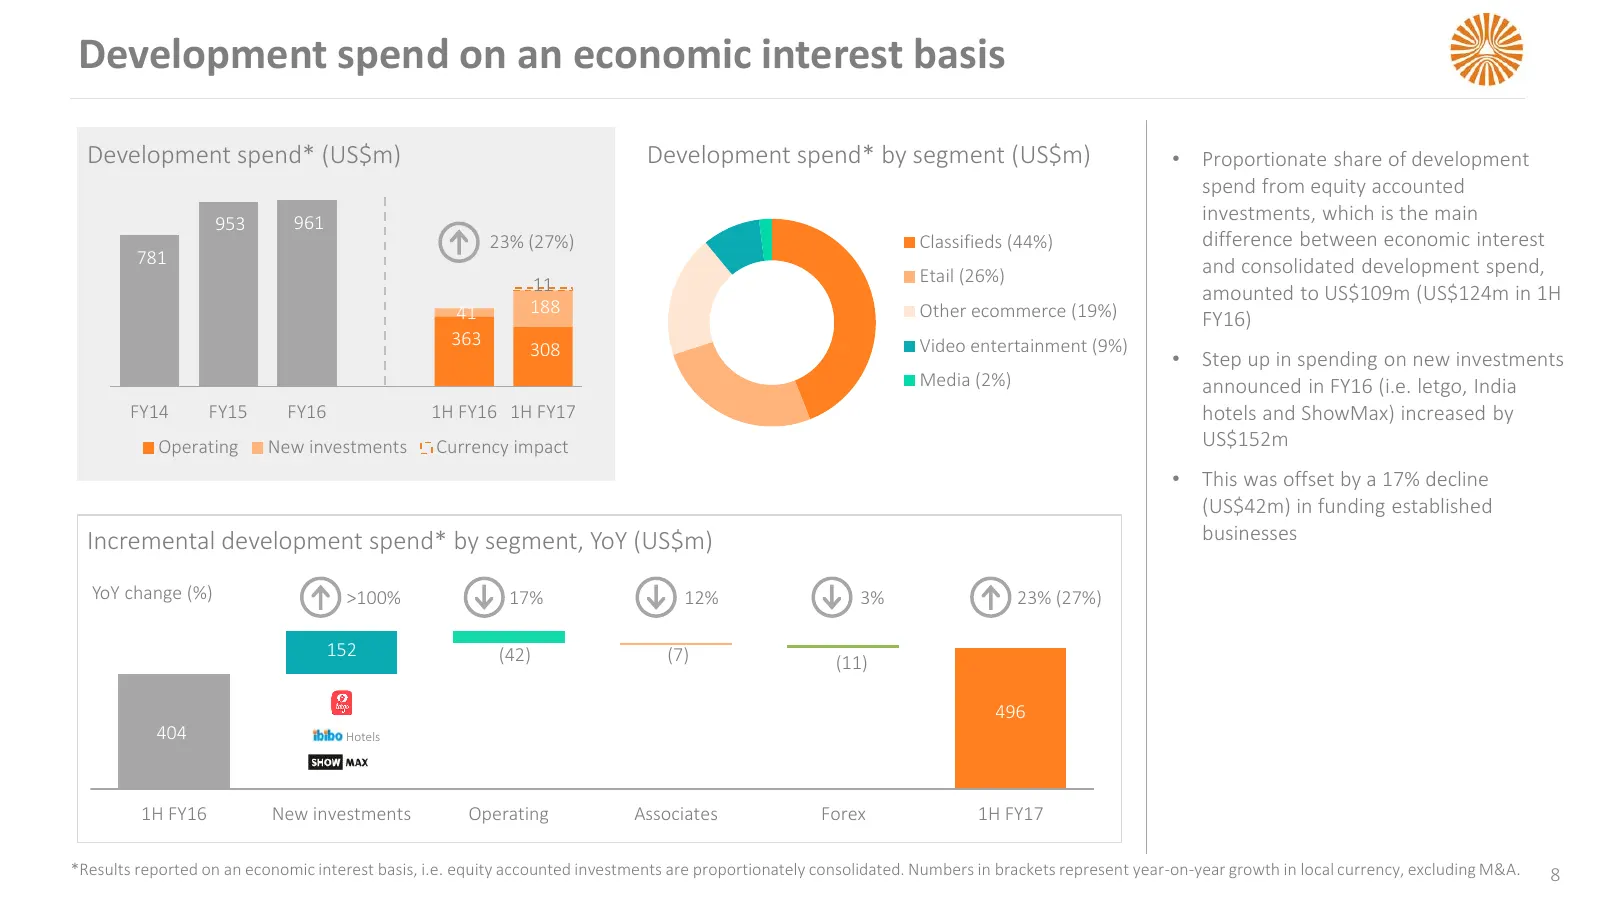
Development spend on an economic interest basis Development spend* (US$m) Development spend* by segment (US$m) • Proportionate share of development spend from equity accounted 953 961 investments, which is the main 23% (27%) Classifieds (44%) difference between economic interest 781 and consolidated
Slide 9: Consolidated development spend
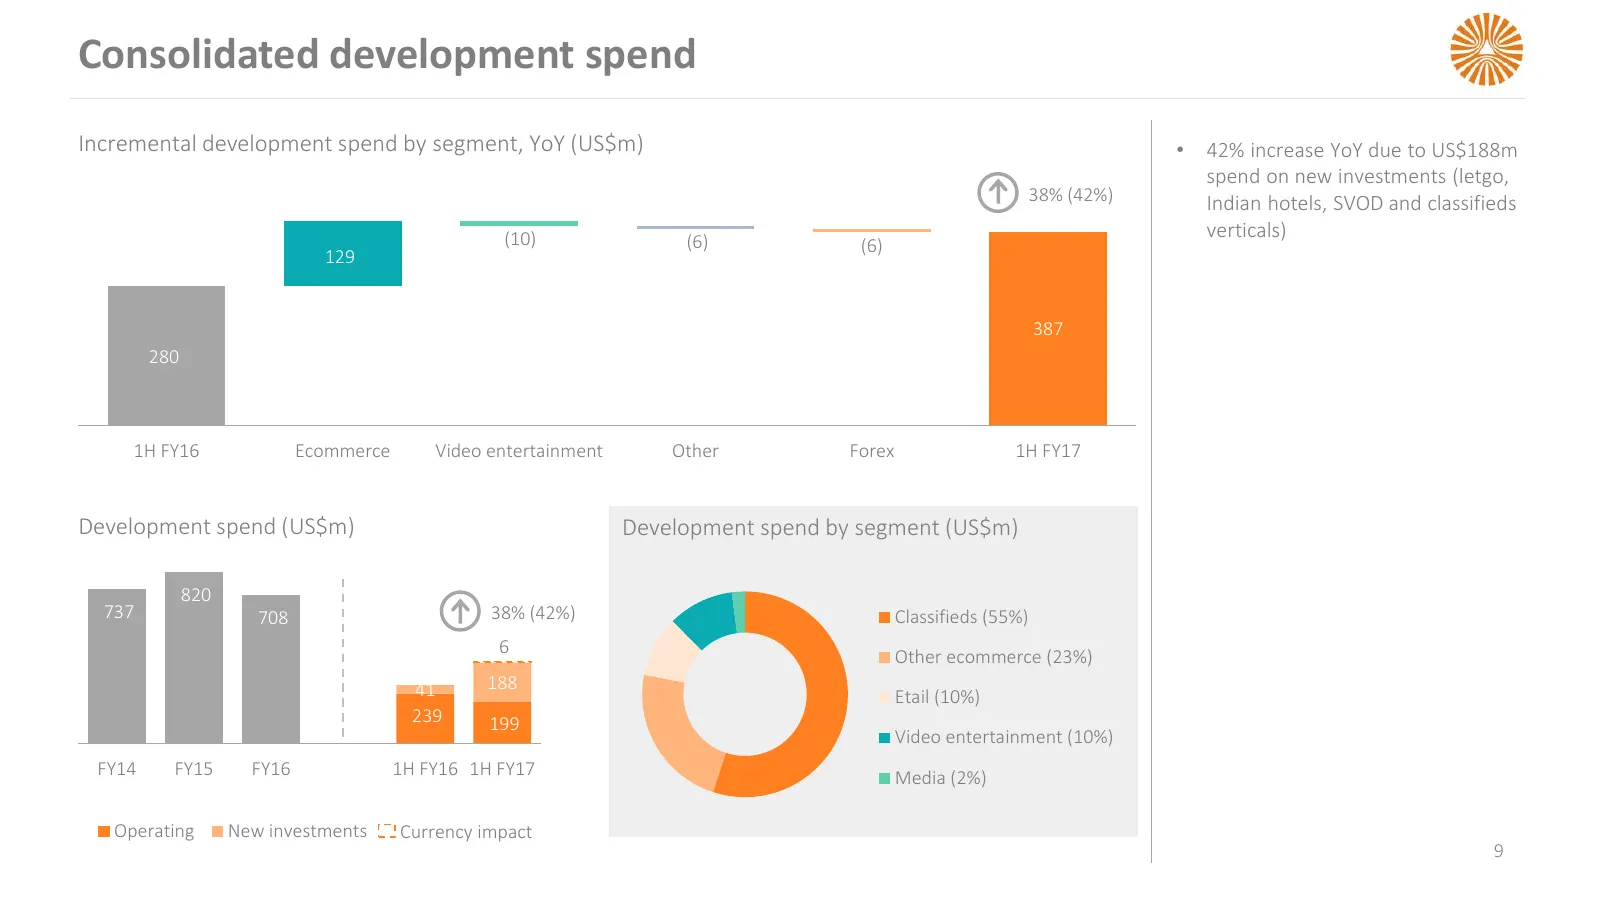
Consolidated development spend Incremental development spend by segment, YoY (US$m) • 42% increase YoY due to US$188m spend on new investments (letgo, 38% (42%) Indian hotels, SVOD and classifieds (10) verticals) (6) (6) 129 387 280 1H FY16 Ecommerce Video entertainment Other Forex 1H FY17 Developme
Slide 10: Trading profit on an economic interest basis
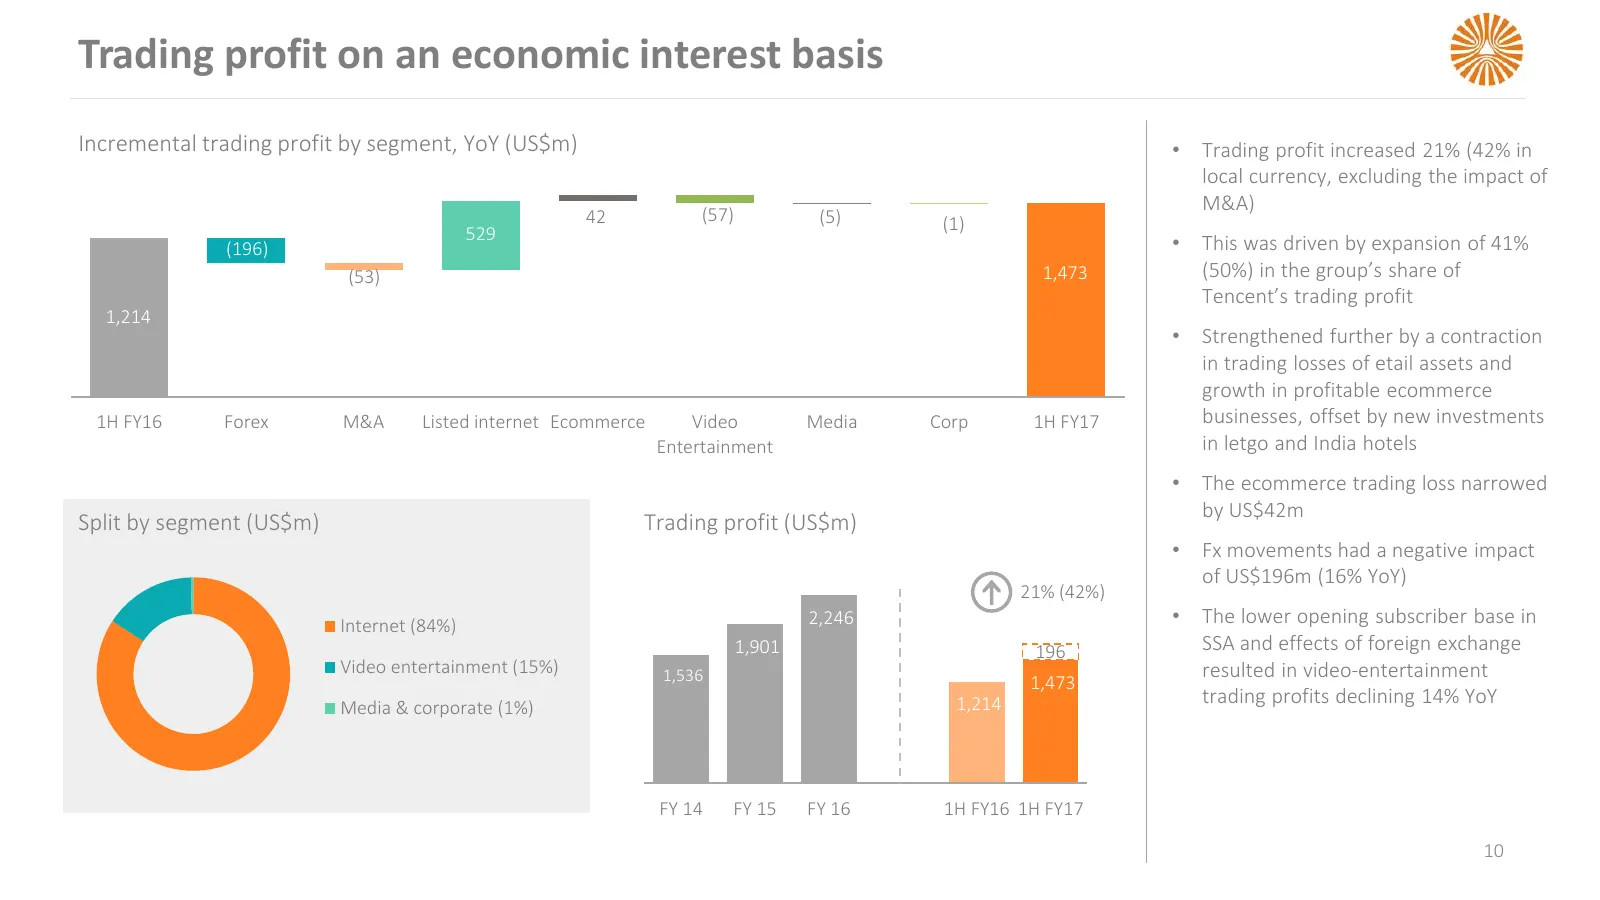
Trading profit on an economic interest basis Incremental trading profit by segment, YoY (US$m) • Trading profit increased 21% (42% in local currency, excluding the impact of (57) M&A) 42 (5) (1) 529 (196) • This was driven by expansion of 41% (53) 1,473 (50%) in the group’s share of Tencent’s tradin
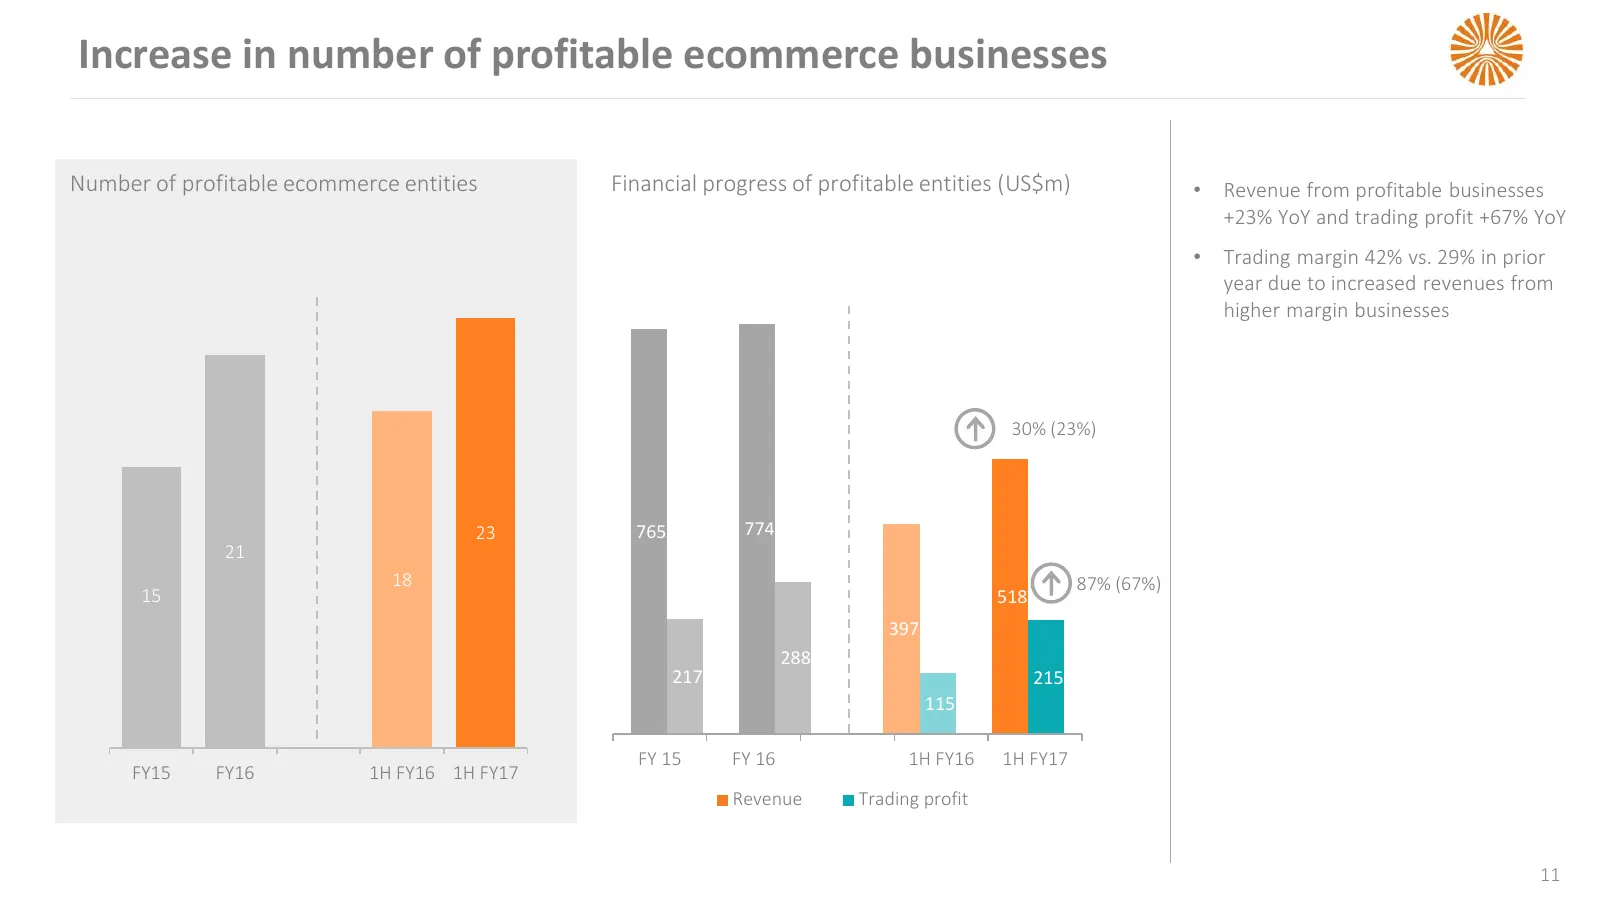
Slide 11: Increase in number of profitable ecommerce businesses
Increase in number of profitable ecommerce businesses Number of profitable ecommerce entities Financial progress of profitable entities (US$m) • Revenue from profitable businesses +23% YoY and trading profit +67% YoY 1 2 3 4 5 6 7 8 9 10 11 12 13 14 • Trading margin 42% vs. 29% in prior year due to
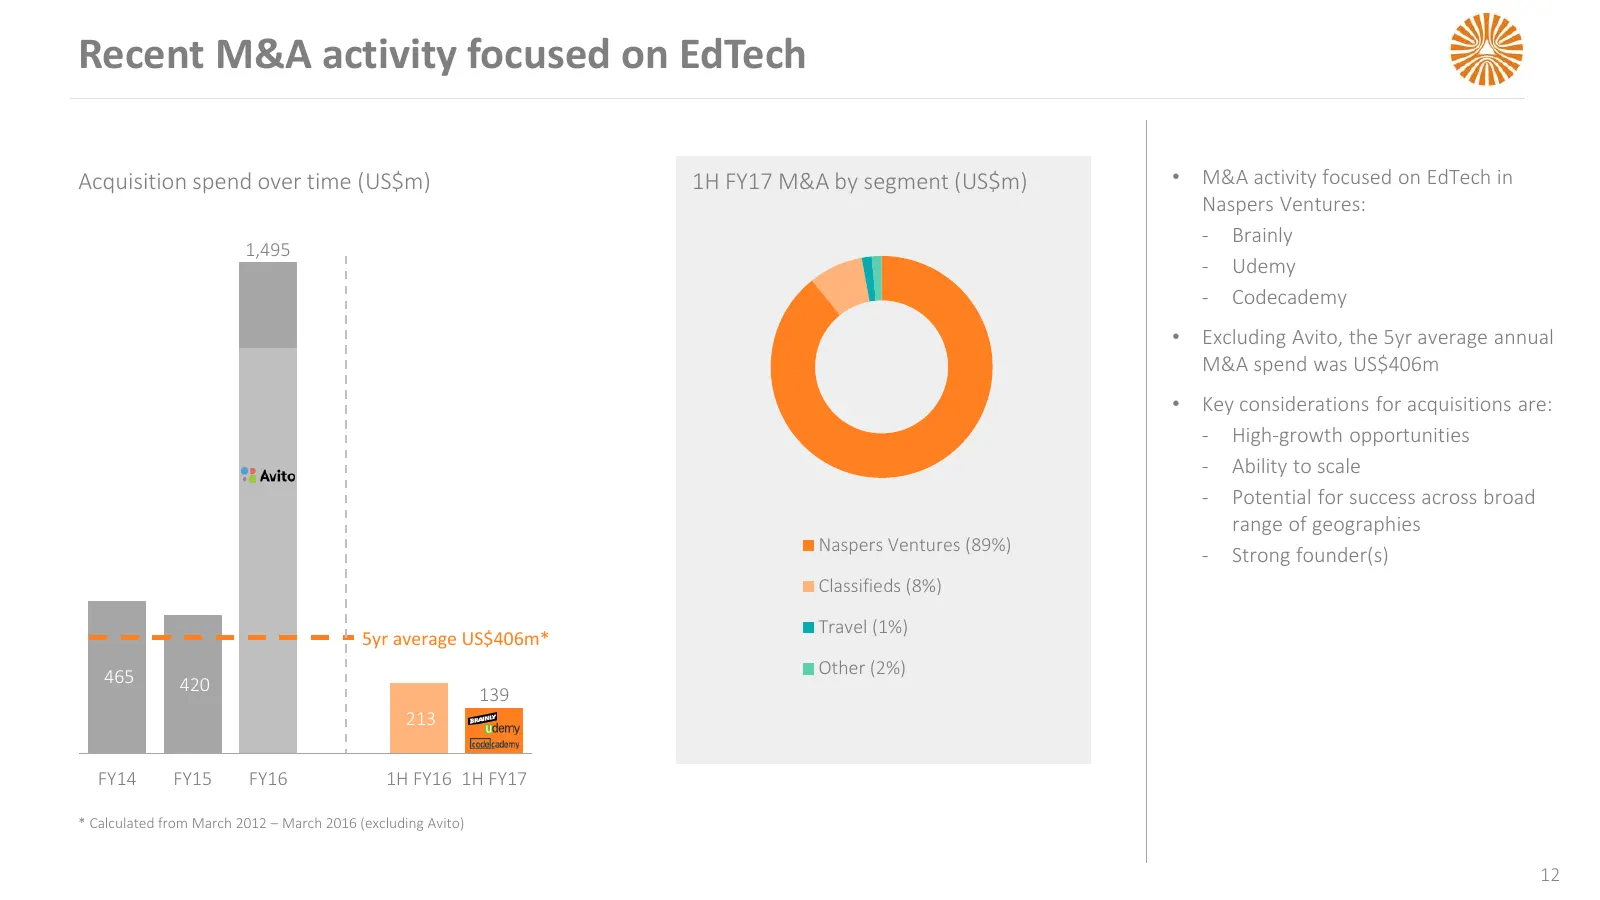
Slide 12: Recent M&A activity focused on EdTech
Recent M&A activity focused on EdTech Acquisition spend over time (US$m) 1H FY17 M&A by segment (US$m) • M&A activity focused on EdTech in Naspers Ventures: ‐ Brainly 1,495 Other ‐ Udemy Other ‐ Codecademy • Excluding Avito, the 5yr average annual M&A spend was US$406m • Key considerations for acqui
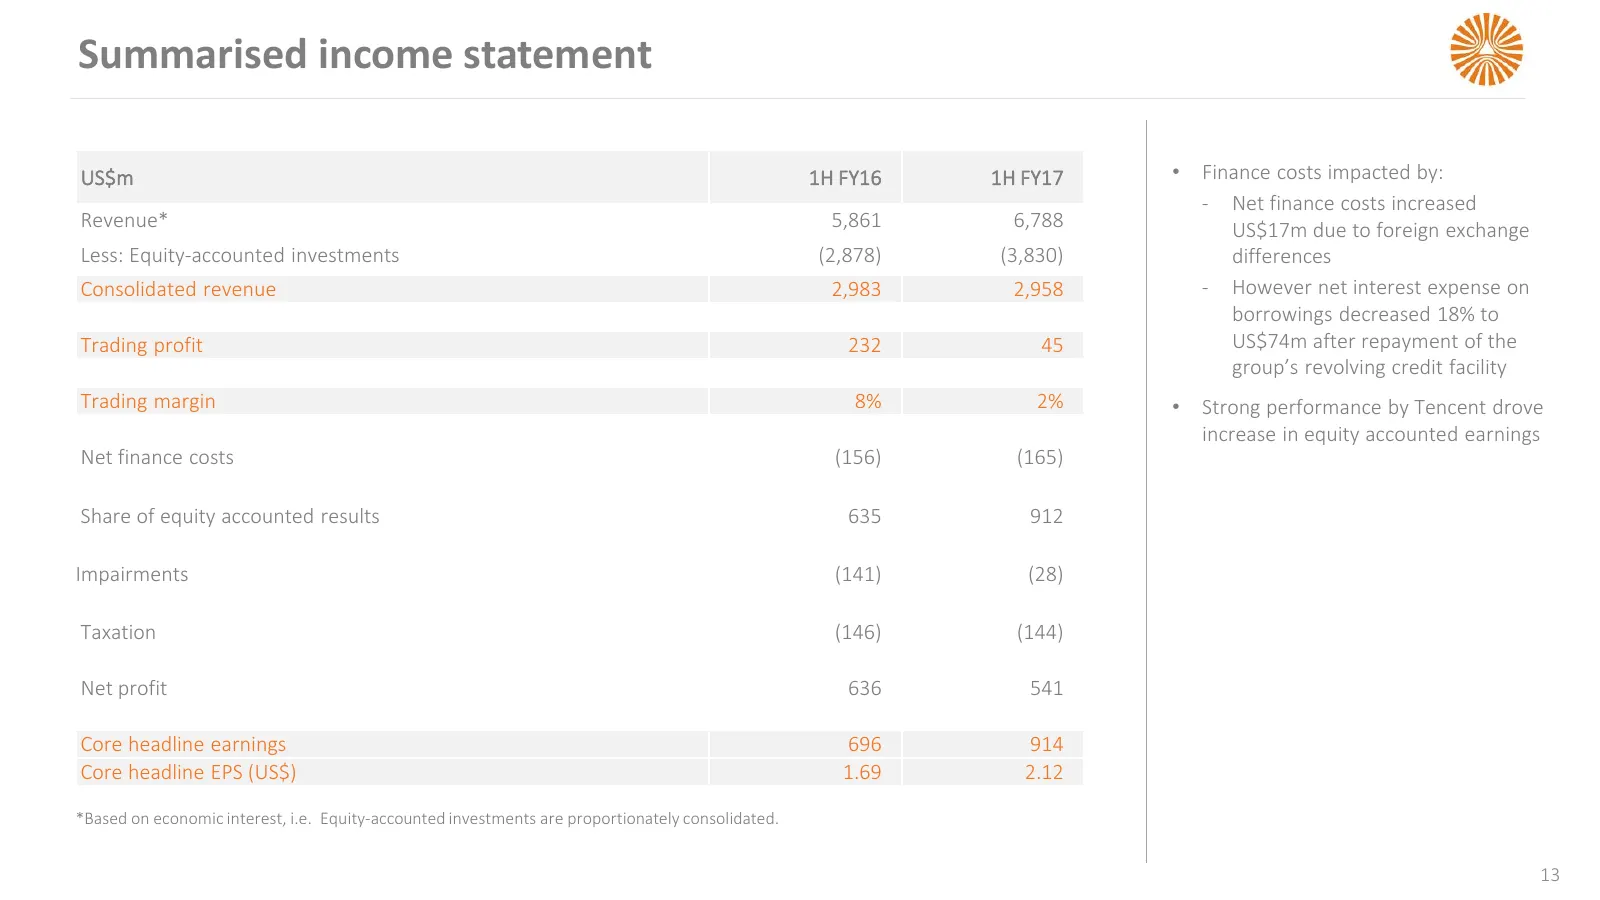
Slide 13: Summarised income statement
Summarised income statement US$m 1H FY16 1H FY17 • Finance costs impacted by: ‐ Net finance costs increased Revenue* 5,861 6,788 US$17m due to foreign exchange Less: Equity-accounted investments (2,878) (3,830) differences Consolidated revenue 2,983 2,958 ‐ However net interest expense on borrowings
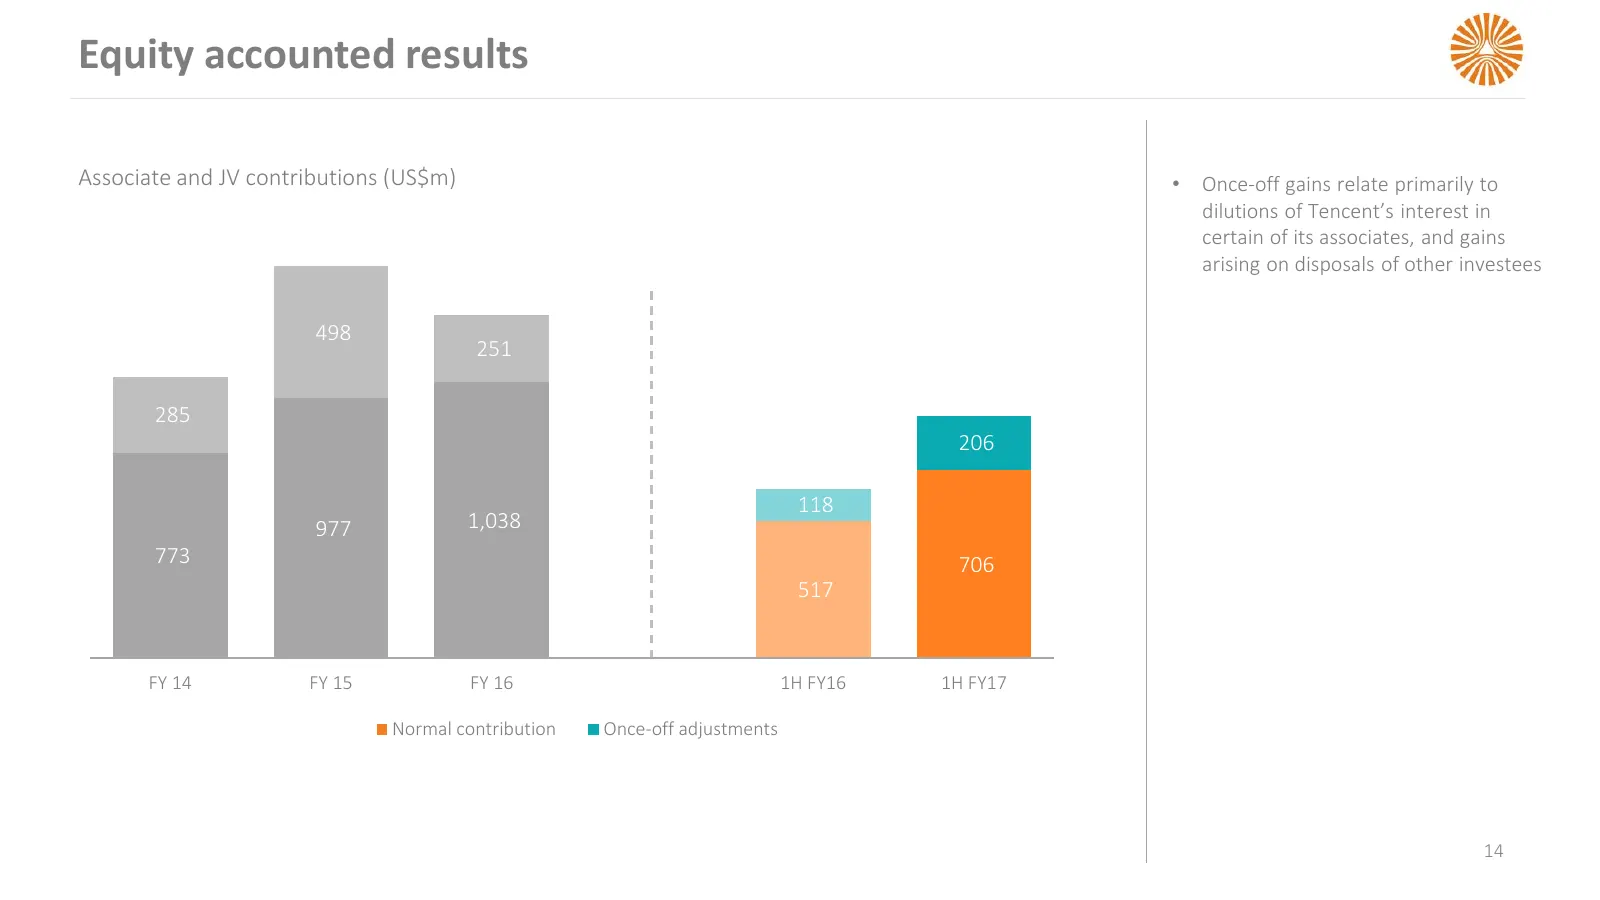
Slide 14: Equity accounted results
Equity accounted results Associate and JV contributions (US$m) • Once-off gains relate primarily to dilutions of Tencent’s interest in certain of its associates, and gains arising on disposals of other investees 498 251 285 206 118 977 1,038 773 706 517 FY 14 FY 15 FY 16 1H FY16 1H FY17 Normal contr
Slide 15: Contribution by associated and joint ventures
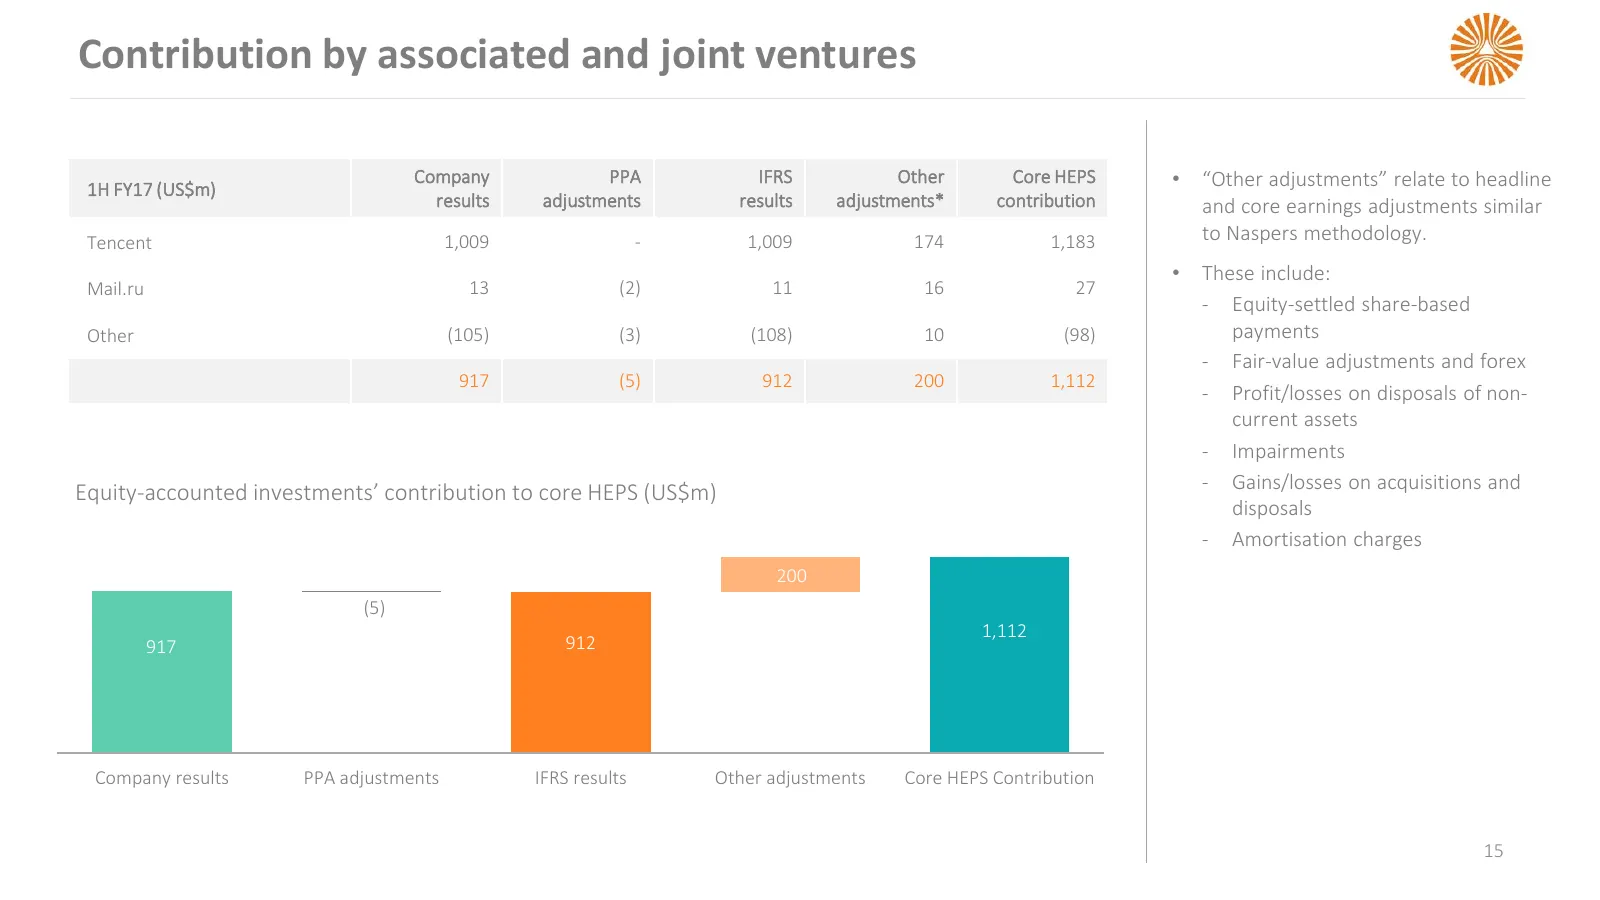
Contribution by associated and joint ventures 1H FY17 (US$m) Company PPA IFRS Other Core HEPS • “Other adjustments” relate to headline results adjustments results adjustments* contribution and core earnings adjustments similar Tencent 1,009 - 1,009 174 1,183 to Naspers methodology. • These include:
Slide 16: Net finance costs
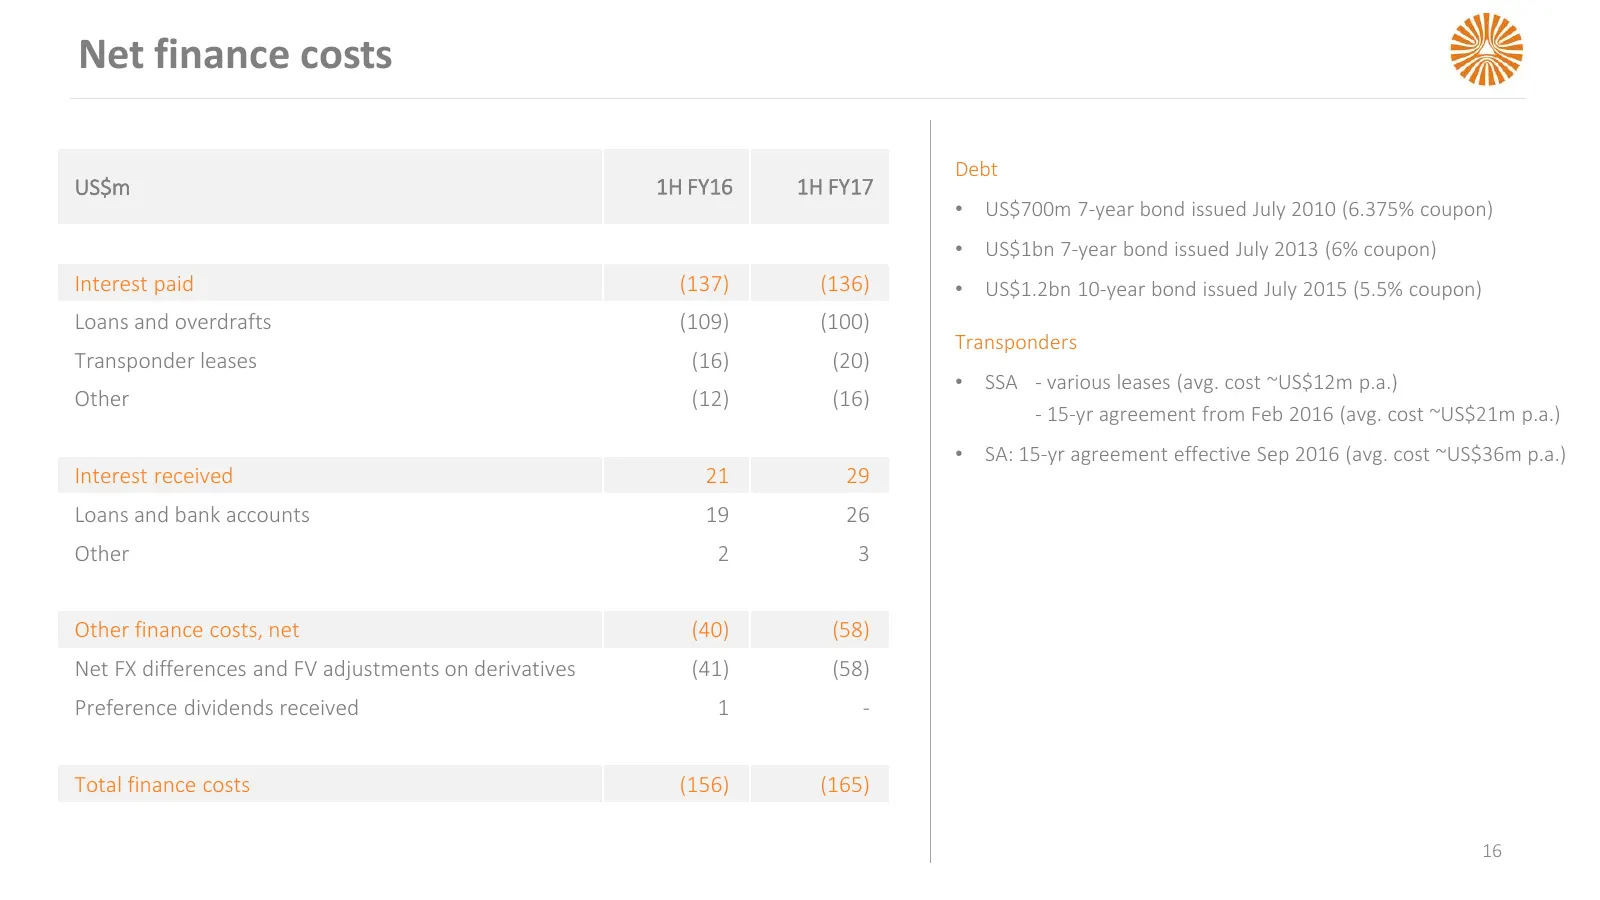
Net finance costs Debt US$m 1H FY16 1H FY17 • US$700m 7-year bond issued July 2010 (6.375% coupon) • US$1bn 7-year bond issued July 2013 (6% coupon) Interest paid (137) (136) • US$1.2bn 10-year bond issued July 2015 (5.5% coupon) Loans and overdrafts (109) (100) Transponders Transponder leases (16)
Slide 17: Core headline earnings trend
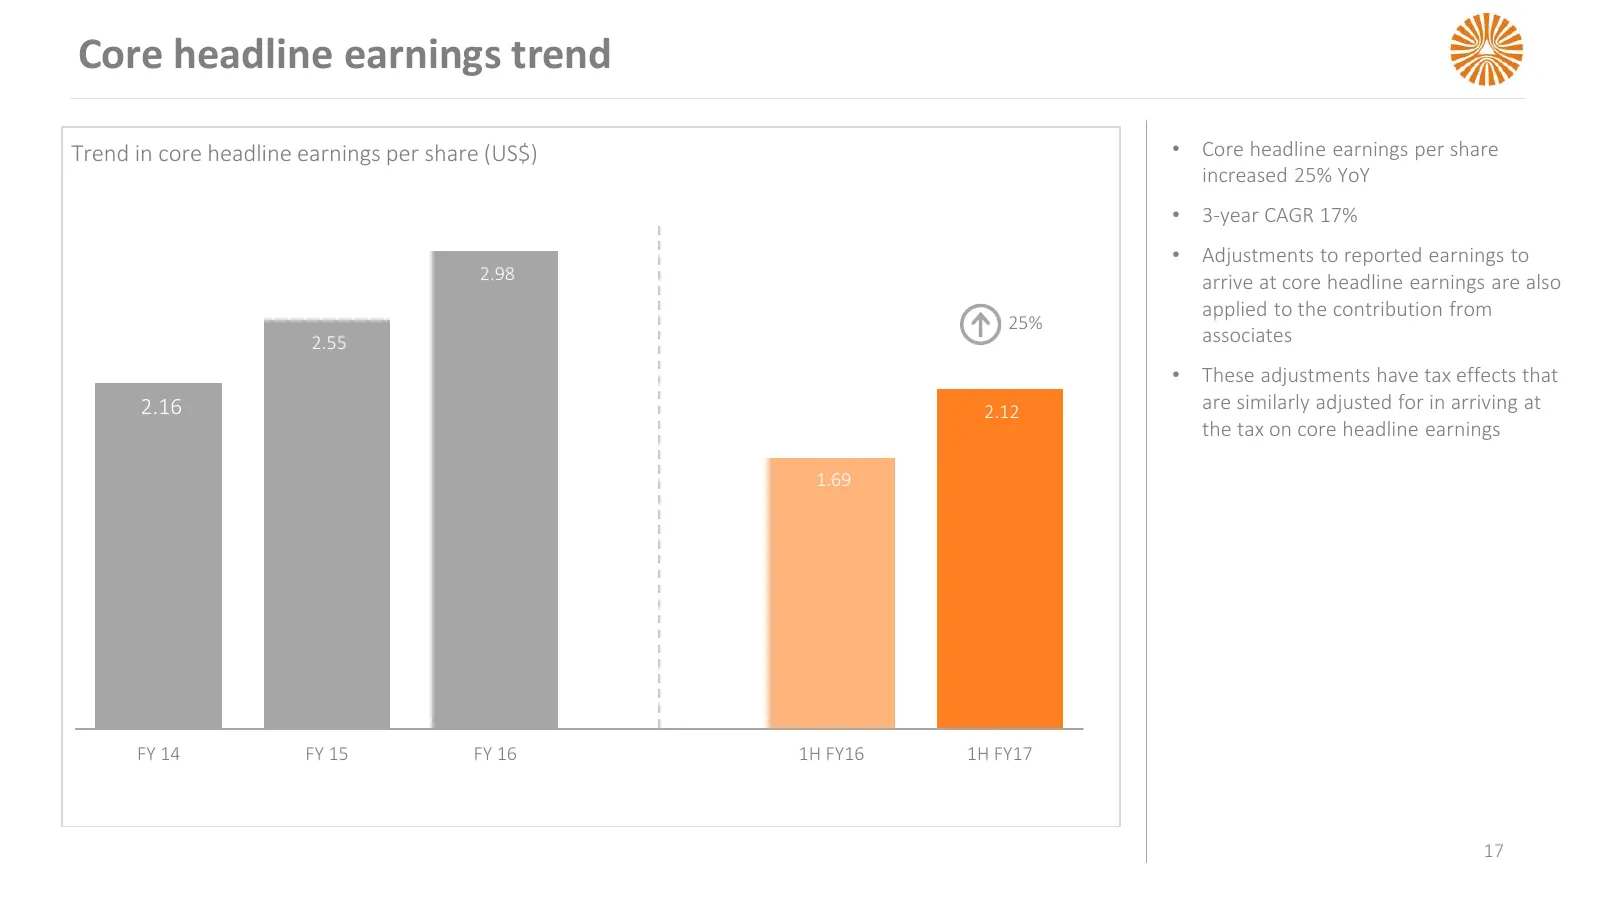
Core headline earnings trend Trend in core headline earnings per share (US$) • Core headline earnings per share increased 25% YoY • 3-year CAGR 17% • Adjustments to reported earnings to 2.98 arrive at core headline earnings are also applied to the contribution from 25% 2.55 associates • These adjust
Slide 18: Core headline earnings reconciliation
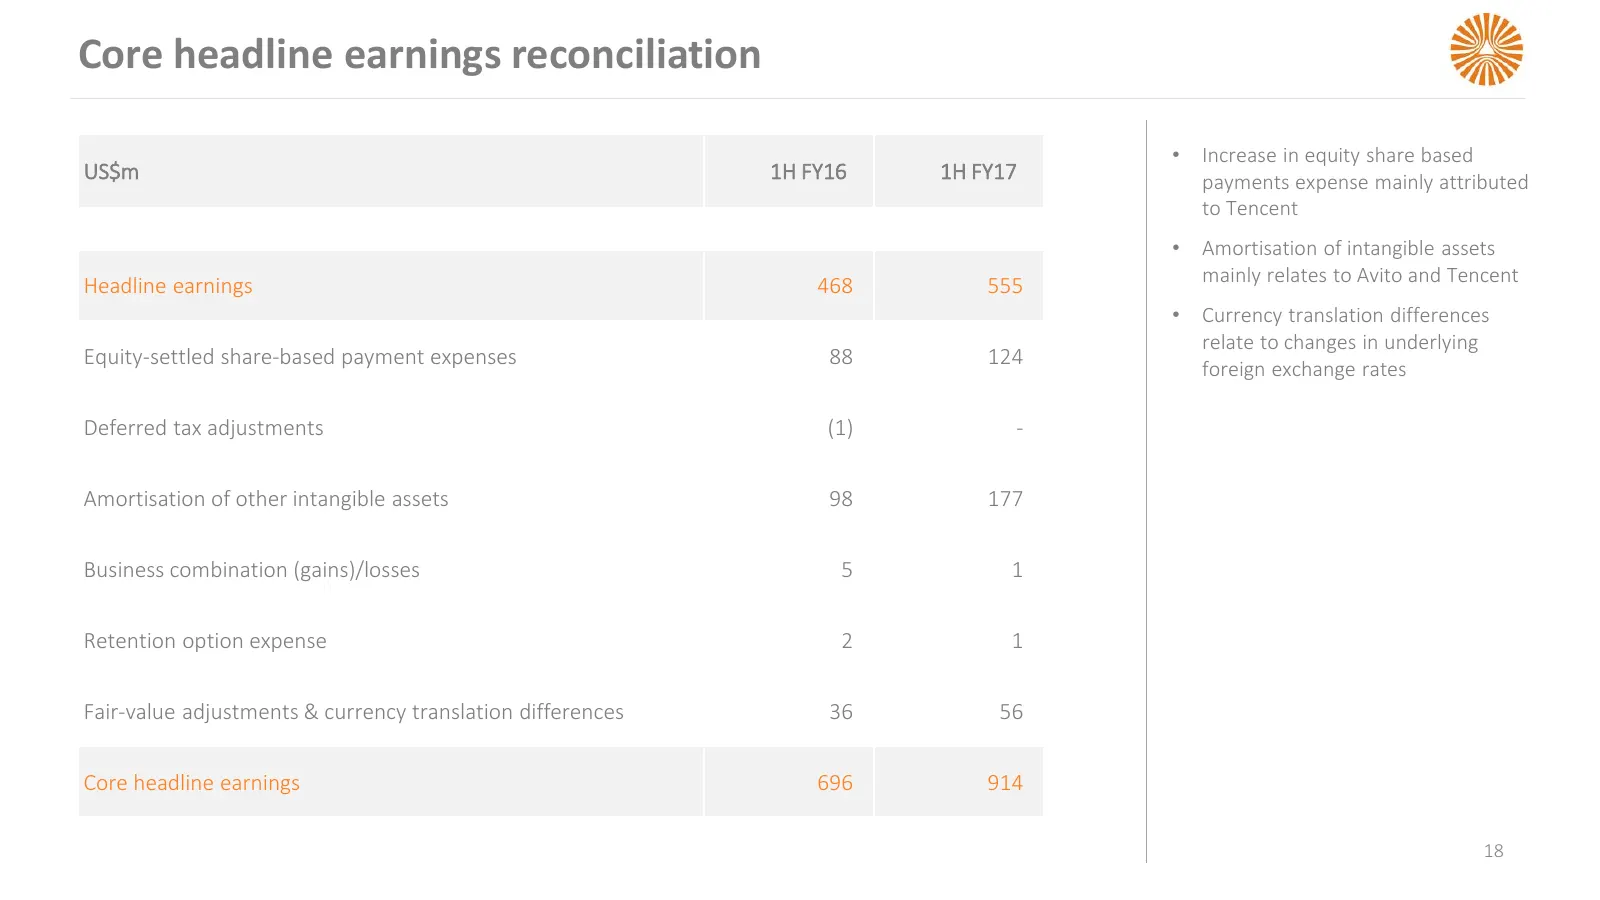
Core headline earnings reconciliation • Increase in equity share based US$m 1H FY16 1H FY17 payments expense mainly attributed to Tencent • Amortisation of intangible assets Headline earnings 468 555 mainly relates to Avito and Tencent • Currency translation differences relate to changes in underlyi
Slide 19: Balance sheet strong
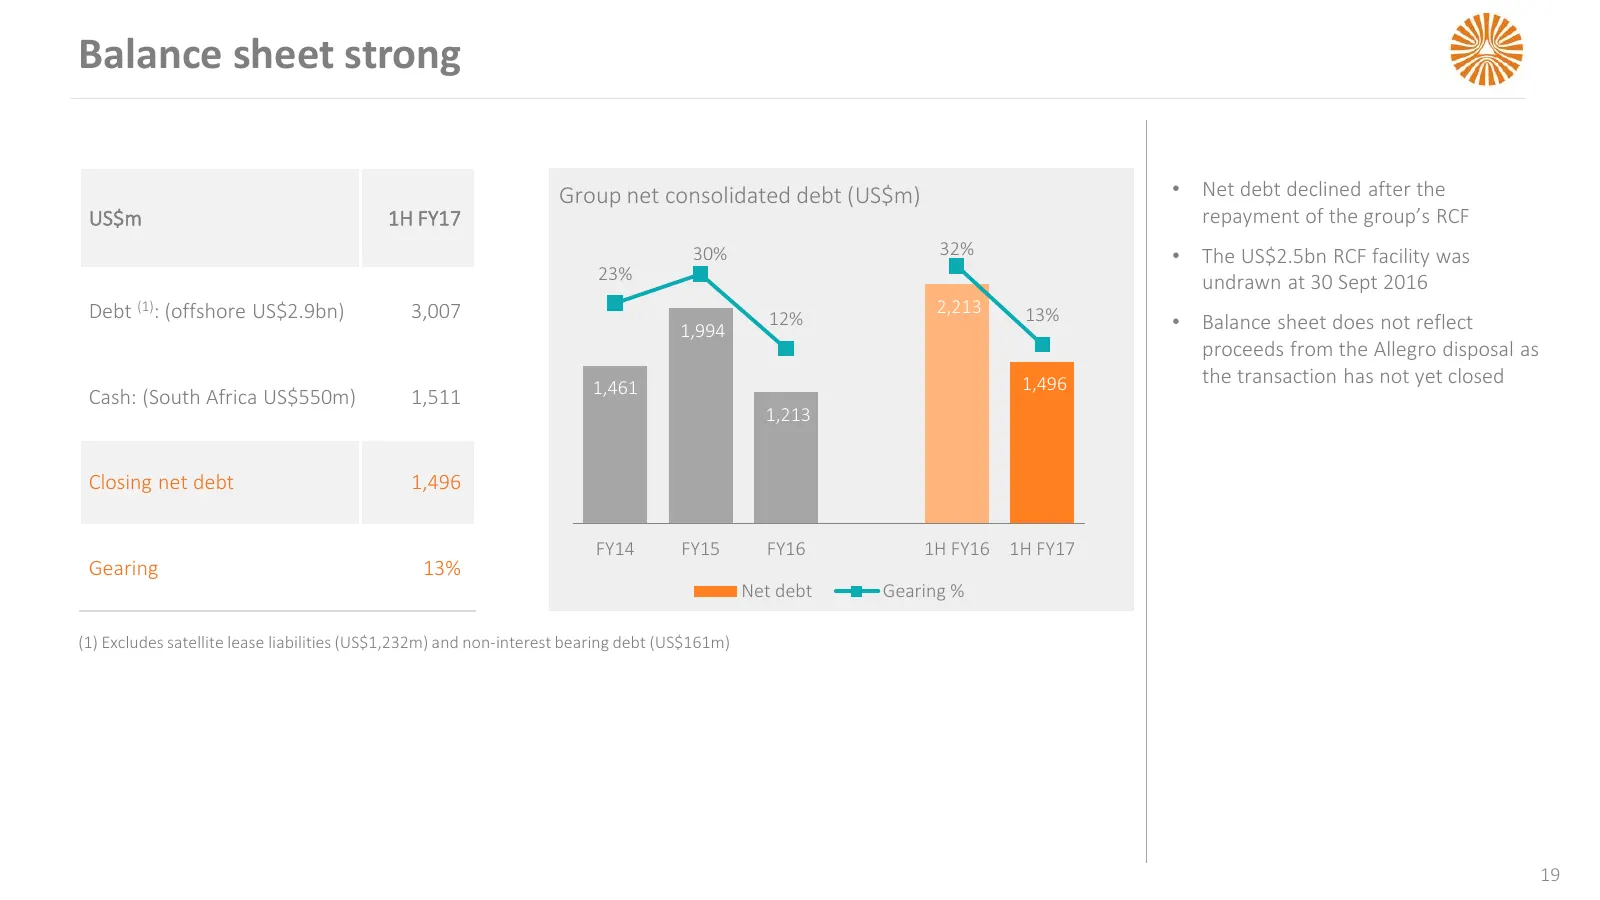
Balance sheet strong Group net consolidated debt (US$m) • Net debt declined after the US$m 1H FY17 repayment of the group’s RCF 30% 32% • The US$2.5bn RCF facility was 23% 30% undrawn at 30 Sept 2016 Debt (1): (offshore US$2.9bn) 3,007 2,213 13% 1,994 12% 20% • Balance sheet does not reflect 10% pro
Slide 20: Debt maturity profile and debt position
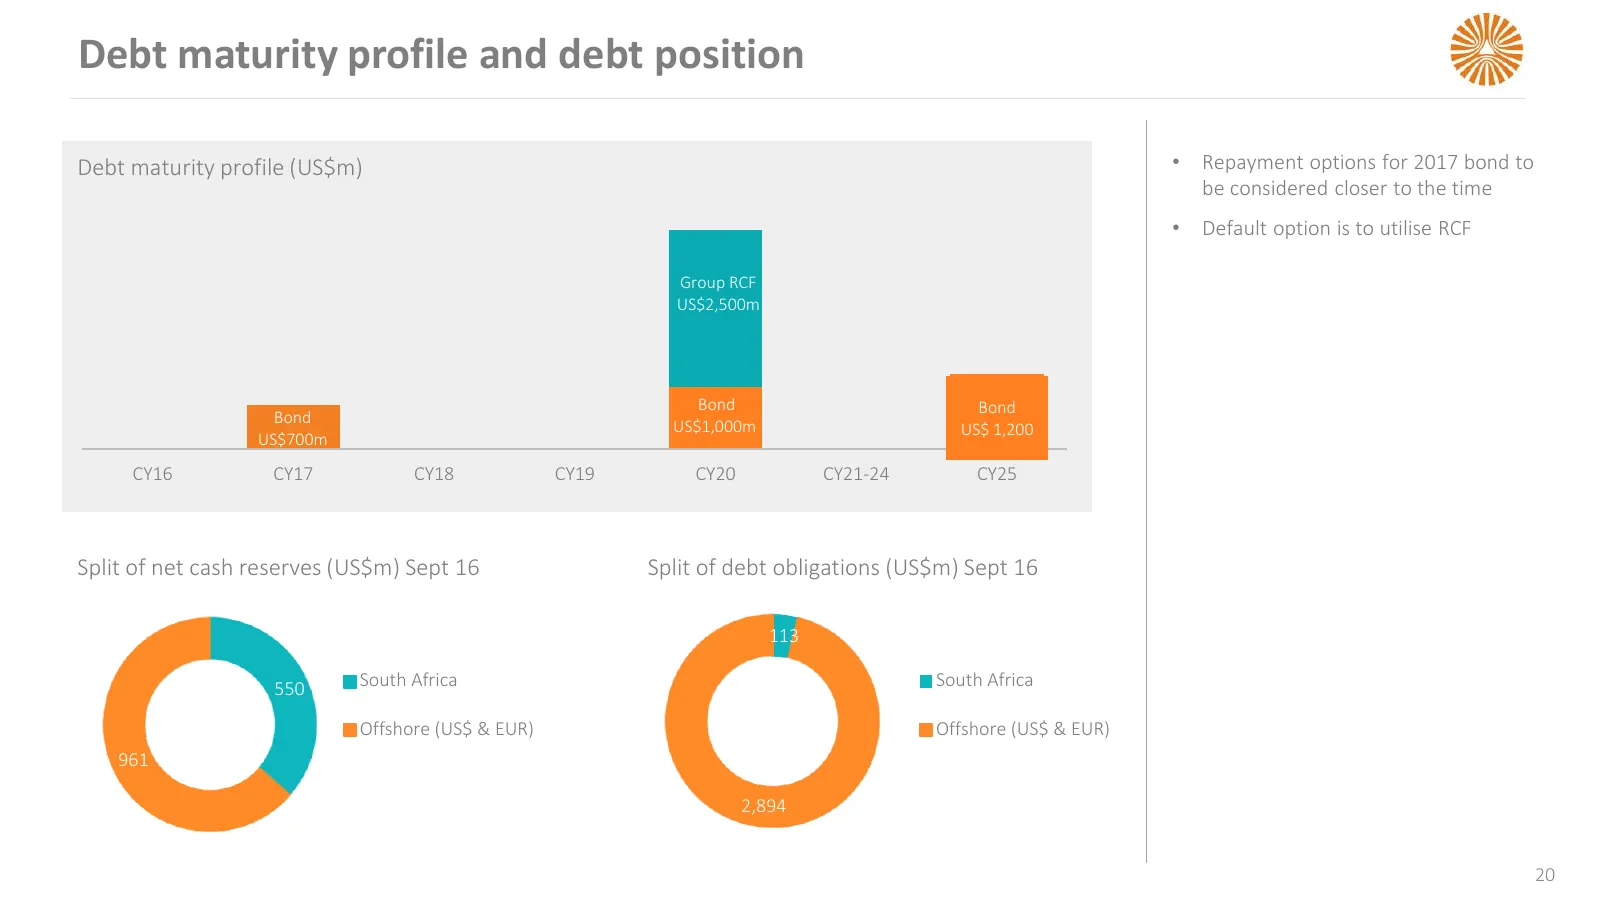
Debt maturity profile and debt position Debt maturity profile (US$m) • Repayment options for 2017 bond to be considered closer to the time • Default option is to utilise RCF Group RCF US$2,500m Bond Bond Bond US$1,000m US$ 1,200 US$700m CY16 CY17 CY18 CY19 CY20 CY21-24 CY25 Split of net cash reserve
Slide 21: Current assets and liabilities
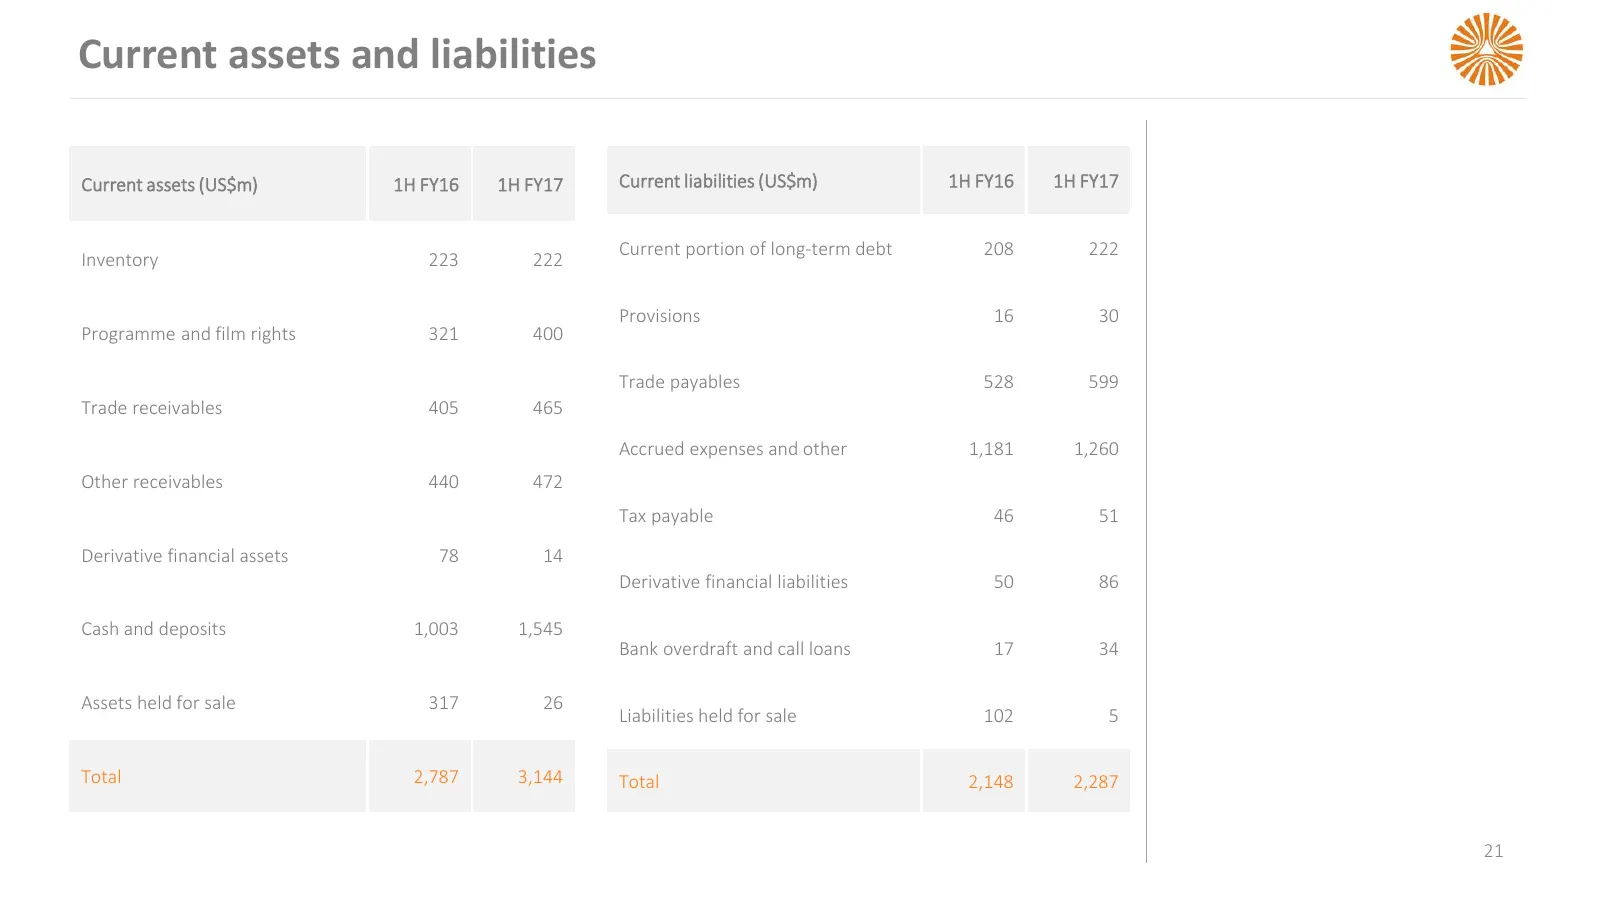
Current assets and liabilities Current assets (US$m) 1H FY16 1H FY17 Current liabilities (US$m) 1H FY16 1H FY17 Current portion of long-term debt 208 222 Inventory 223 222 Provisions 16 30 Programme and film rights 321 400 Trade payables 528 599 Trade receivables 405 465 Accrued expenses and other 1
Slide 22: Free cash flow
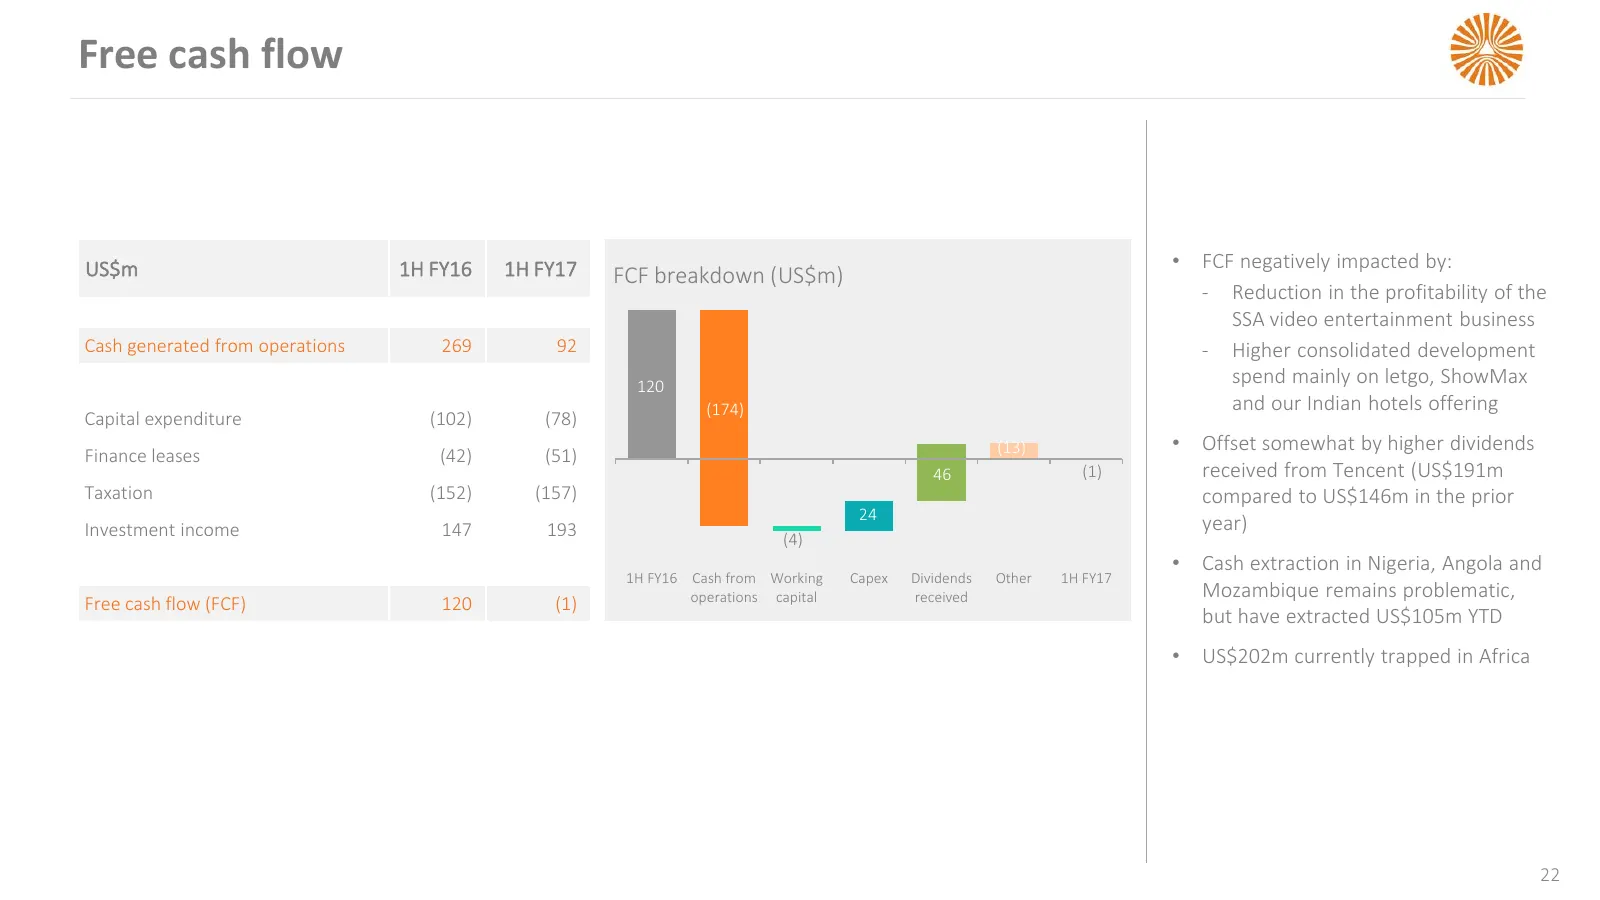
Free cash flow US$m 1H FY16 1H FY17 • FCF negatively impacted by: FCF breakdown (US$m) ‐ Reduction in the profitability of the SSA video entertainment business Cash generated from operations 269 92 ‐ Higher consolidated development 120 spend mainly on letgo, ShowMax (174) and our Indian hotels offer
Slide 23: Capital expenditure
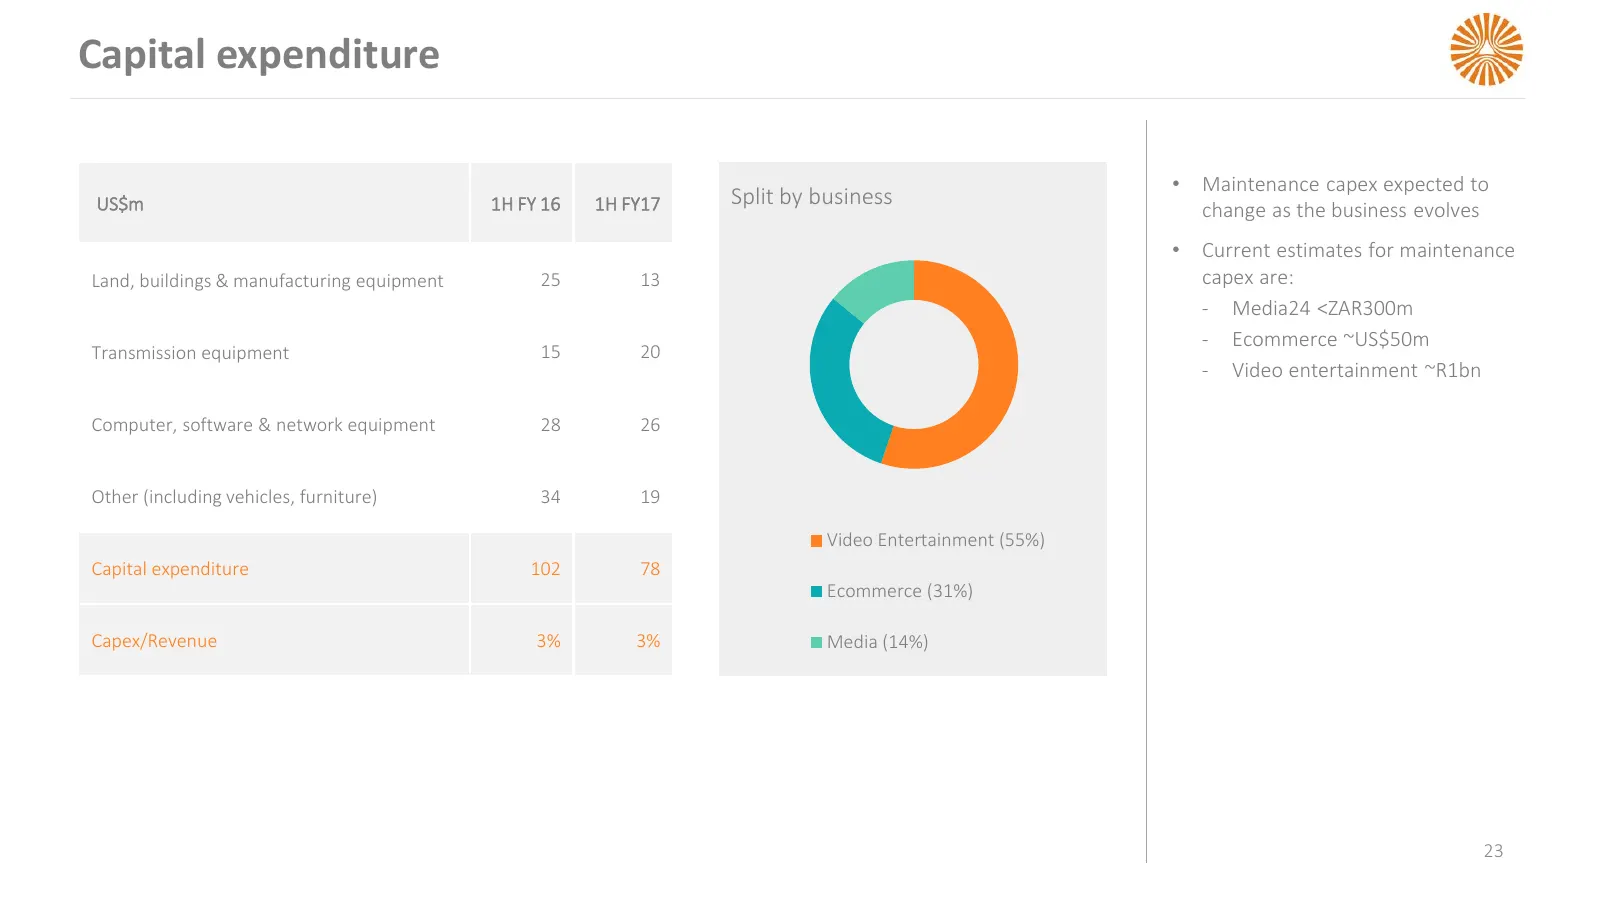
Capital expenditure • Maintenance capex expected to US$m 1H FY 16 1H FY17 Split by business change as the business evolves • Current estimates for maintenance Land, buildings & manufacturing equipment 25 13 capex are: ‐ Media24 <ZAR300m ‐ Ecommerce ~US$50m Transmission equipment 15 20 ‐ Video entert
Slide 24: FX exposure: hedging
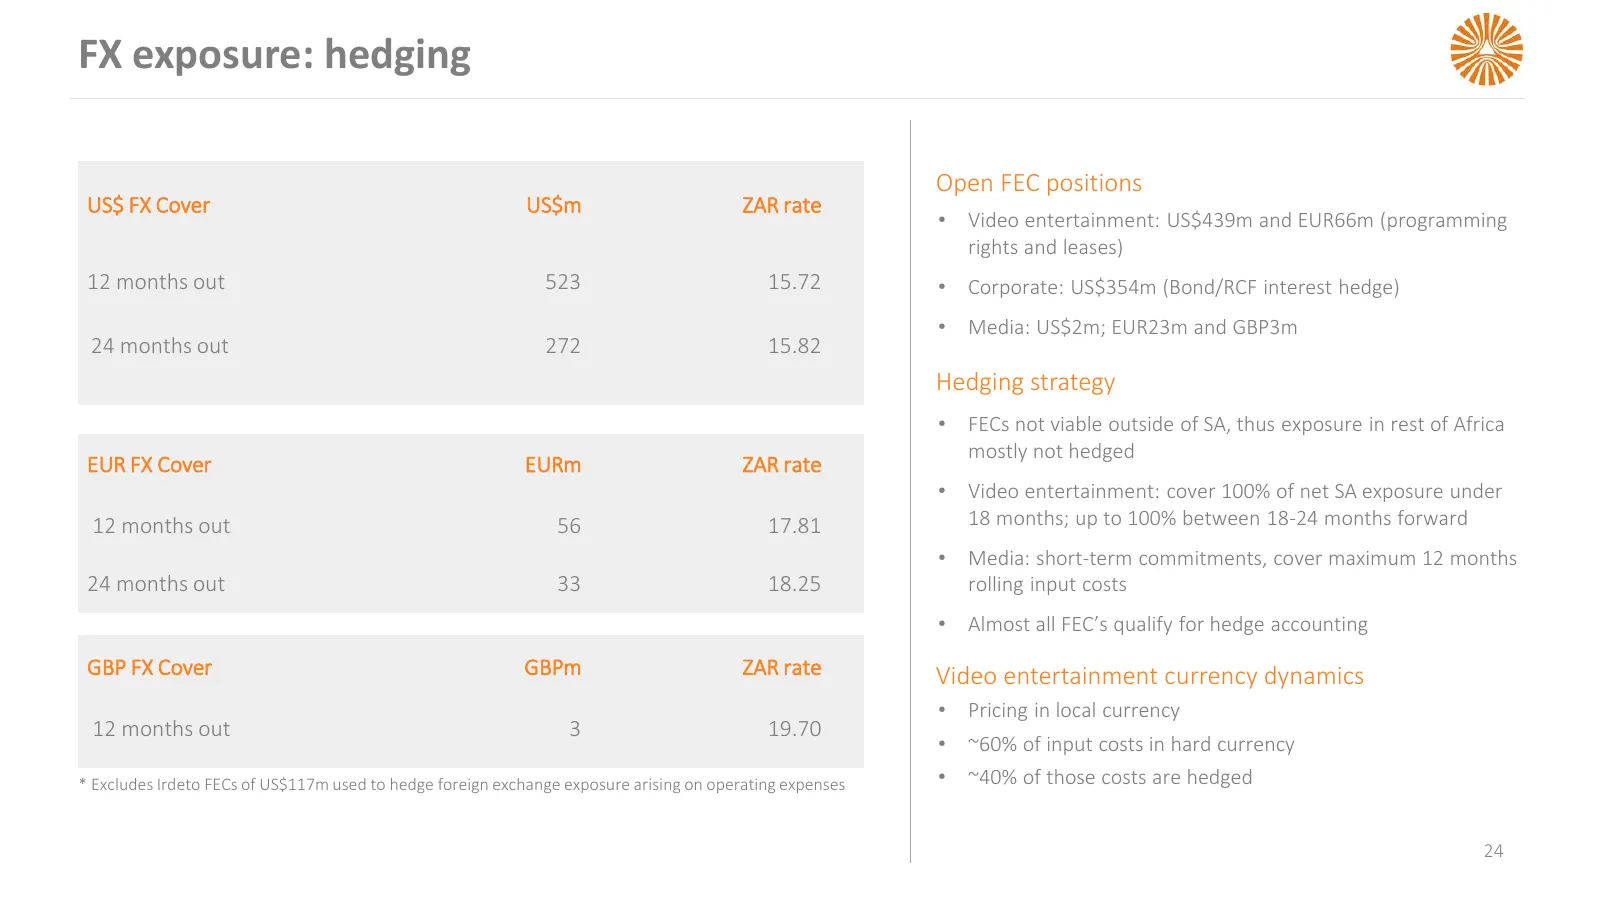
FX exposure: hedging Open FEC positions US$ FX Cover US$m ZAR rate • Video entertainment: US$439m and EUR66m (programming rights and leases) 12 months out 523 15.72 • Corporate: US$354m (Bond/RCF interest hedge) • Media: US$2m; EUR23m and GBP3m 24 months out 272 15.82 Hedging strategy • FECs not via

Slide 25: Internet
INTERNET
Slide 26: Ecommerce: continues to scale
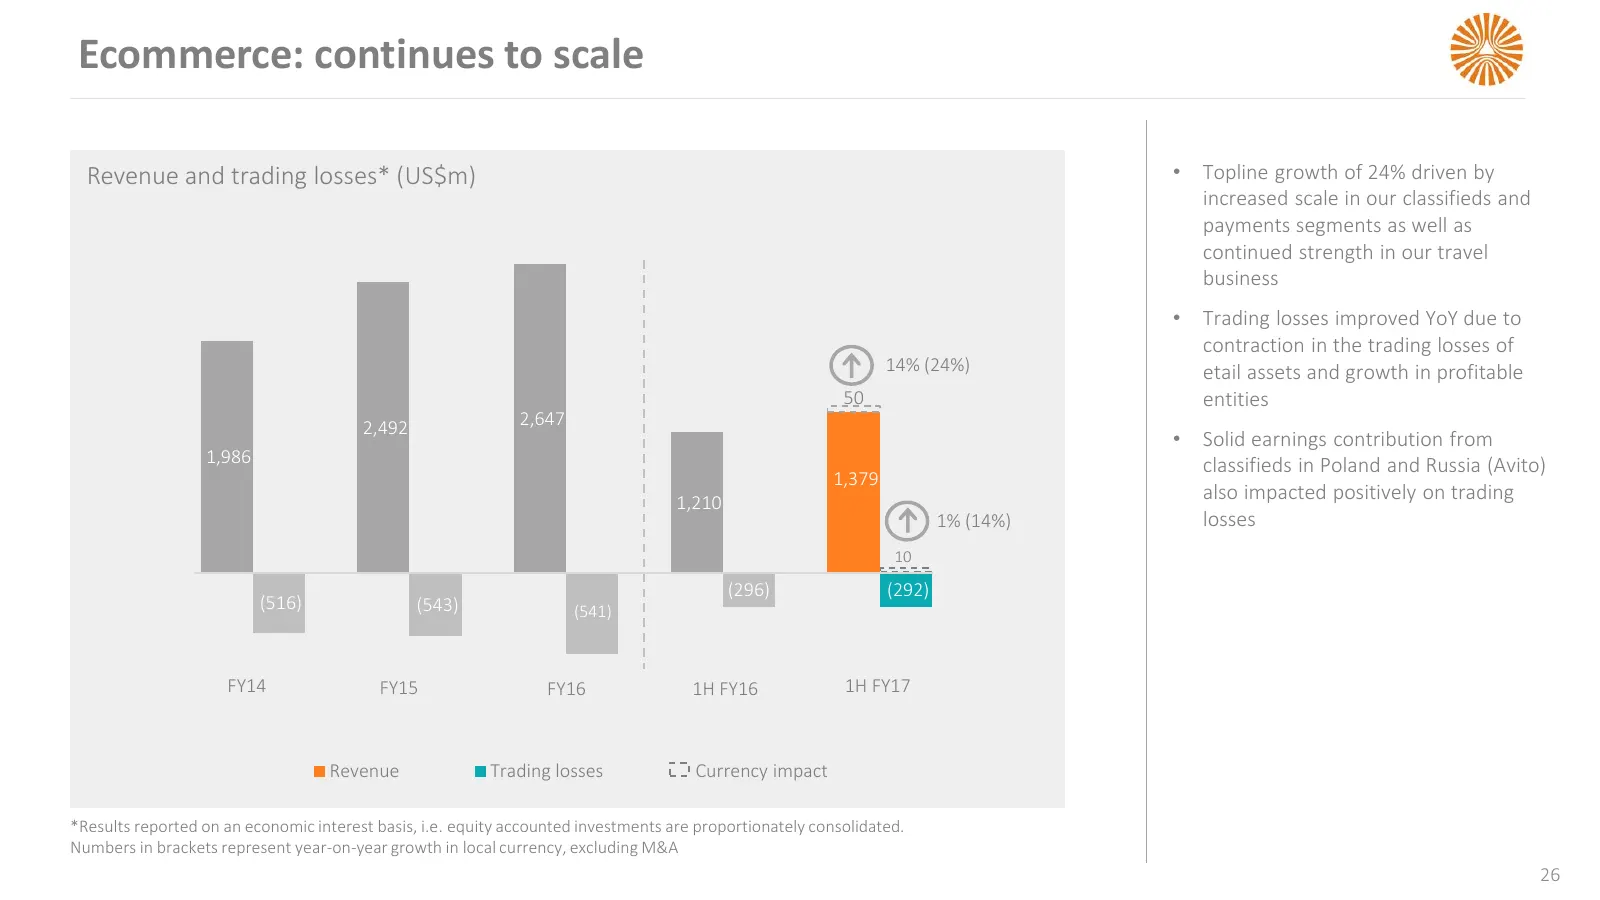
Ecommerce: continues to scale Revenue and trading losses* (US$m) • Topline growth of 24% driven by increased scale in our classifieds and payments segments as well as continued strength in our travel business • Trading losses improved YoY due to contraction in the trading losses of 14% (24%) etail a
Slide 27: Ecommerce: continues to grow rapidly
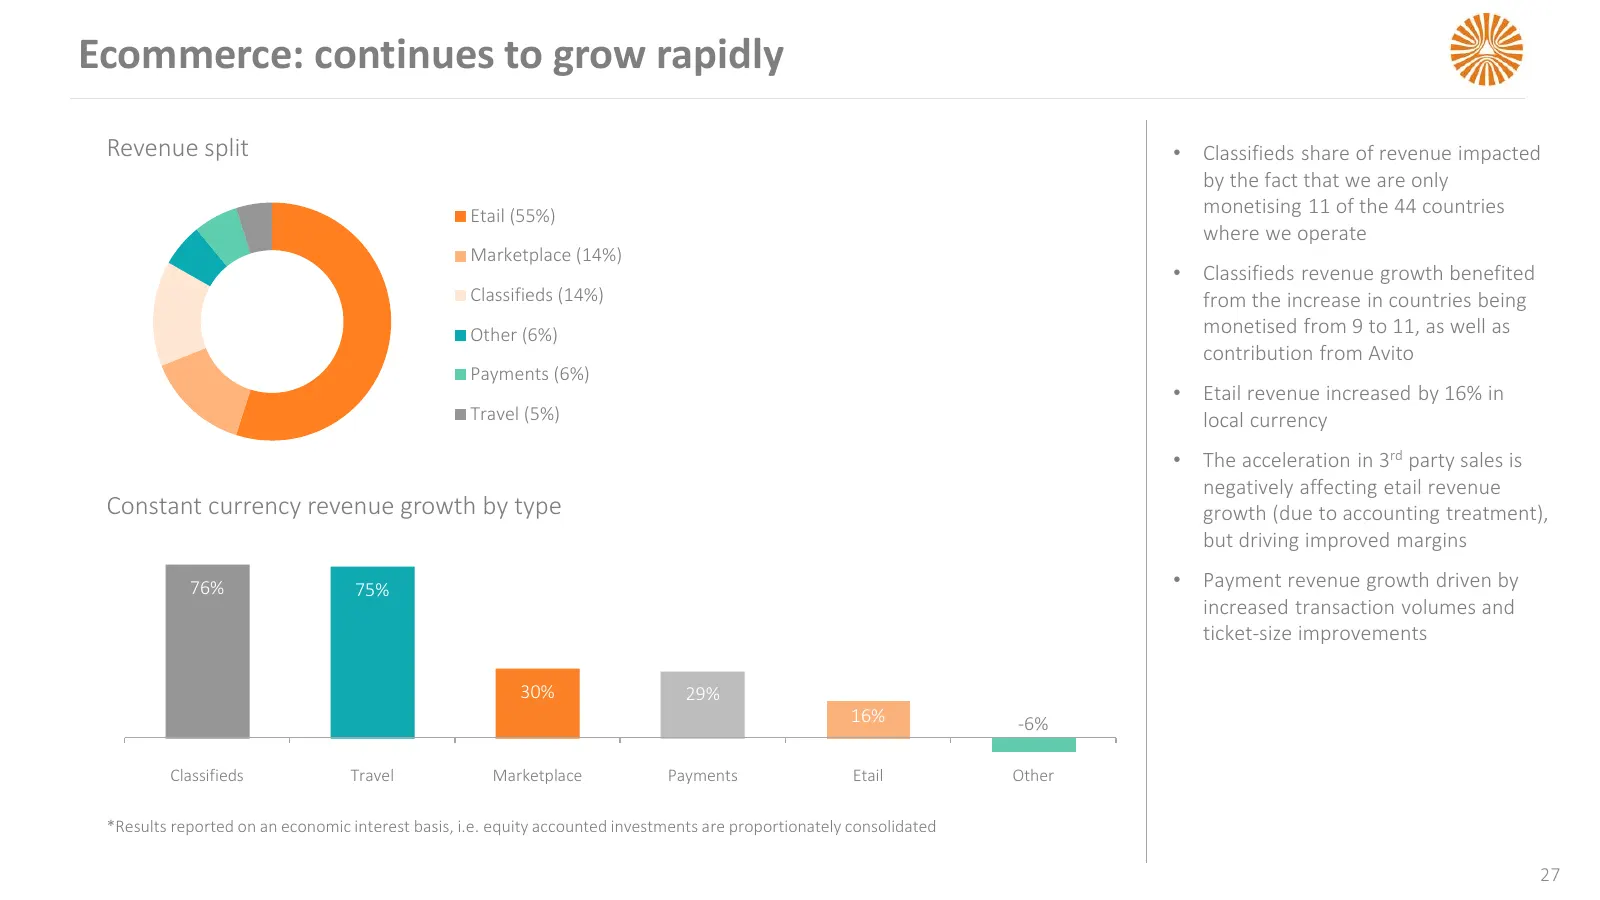
Ecommerce: continues to grow rapidly Revenue split • Classifieds share of revenue impacted by the fact that we are only Etail (55%) monetising 11 of the 44 countries where we operate Marketplace (14%) • Classifieds revenue growth benefited Classifieds (14%) from the increase in countries being Other
Slide 28: B2C: benefiting from steady increase in online penetration
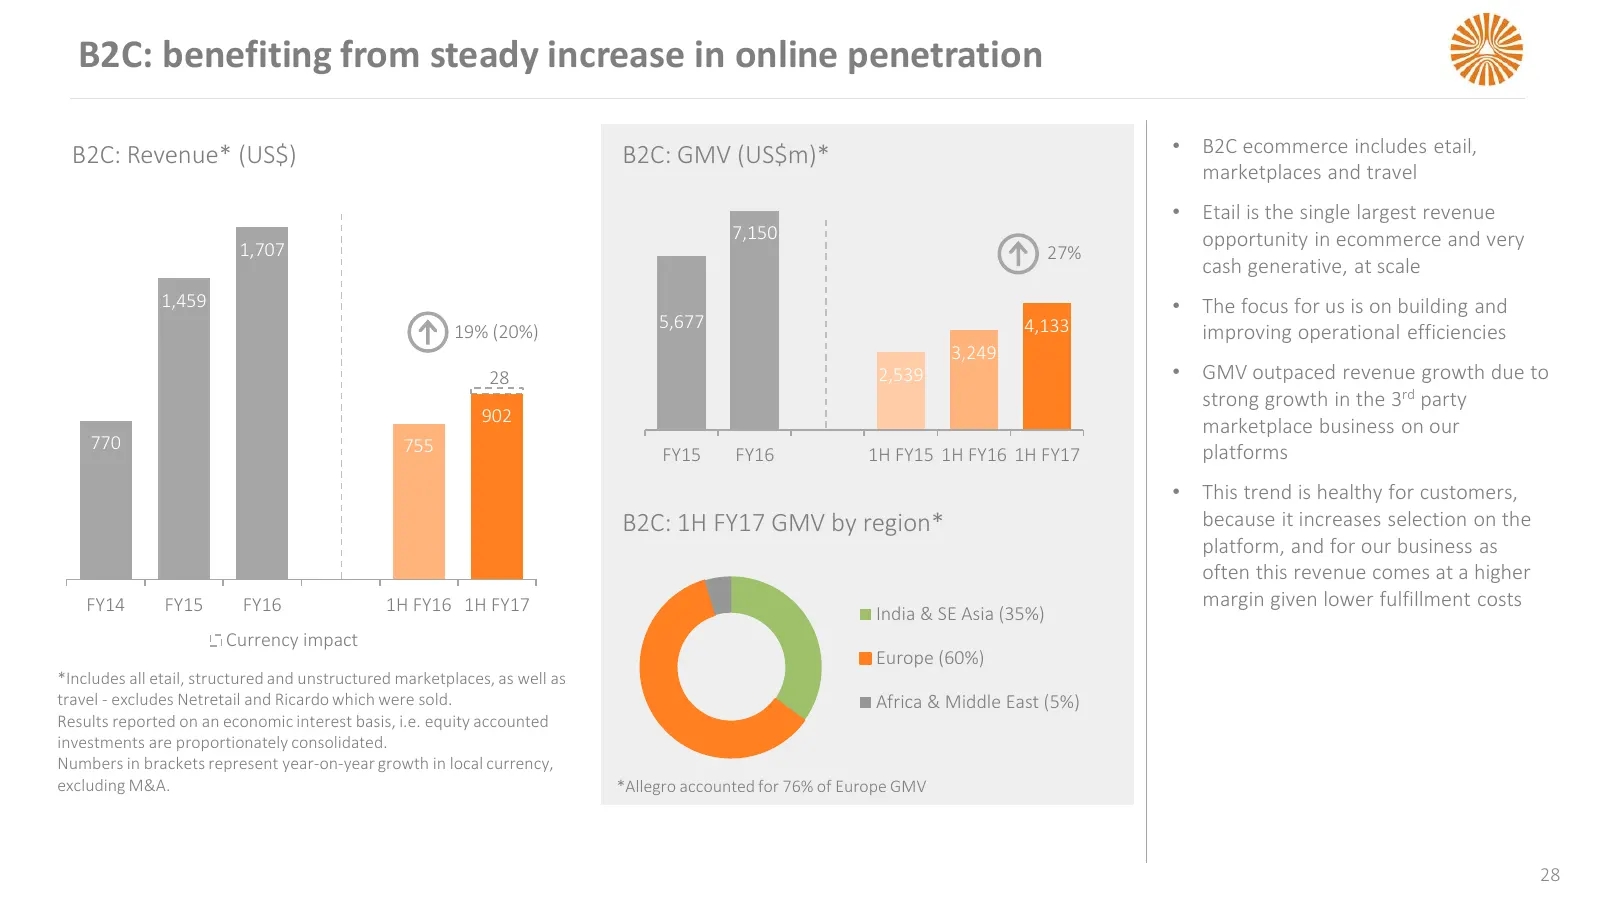
B2C: benefiting from steady increase in online penetration B2C: Revenue* (US$) B2C: GMV (US$m)* • B2C ecommerce includes etail, marketplaces and travel • Etail is the single largest revenue 7,150 opportunity in ecommerce and very 1,707 27% cash generative, at scale 1,459 • The focus for us is on bui
Slide 29: Allegro: disposal to realise value for shareholders
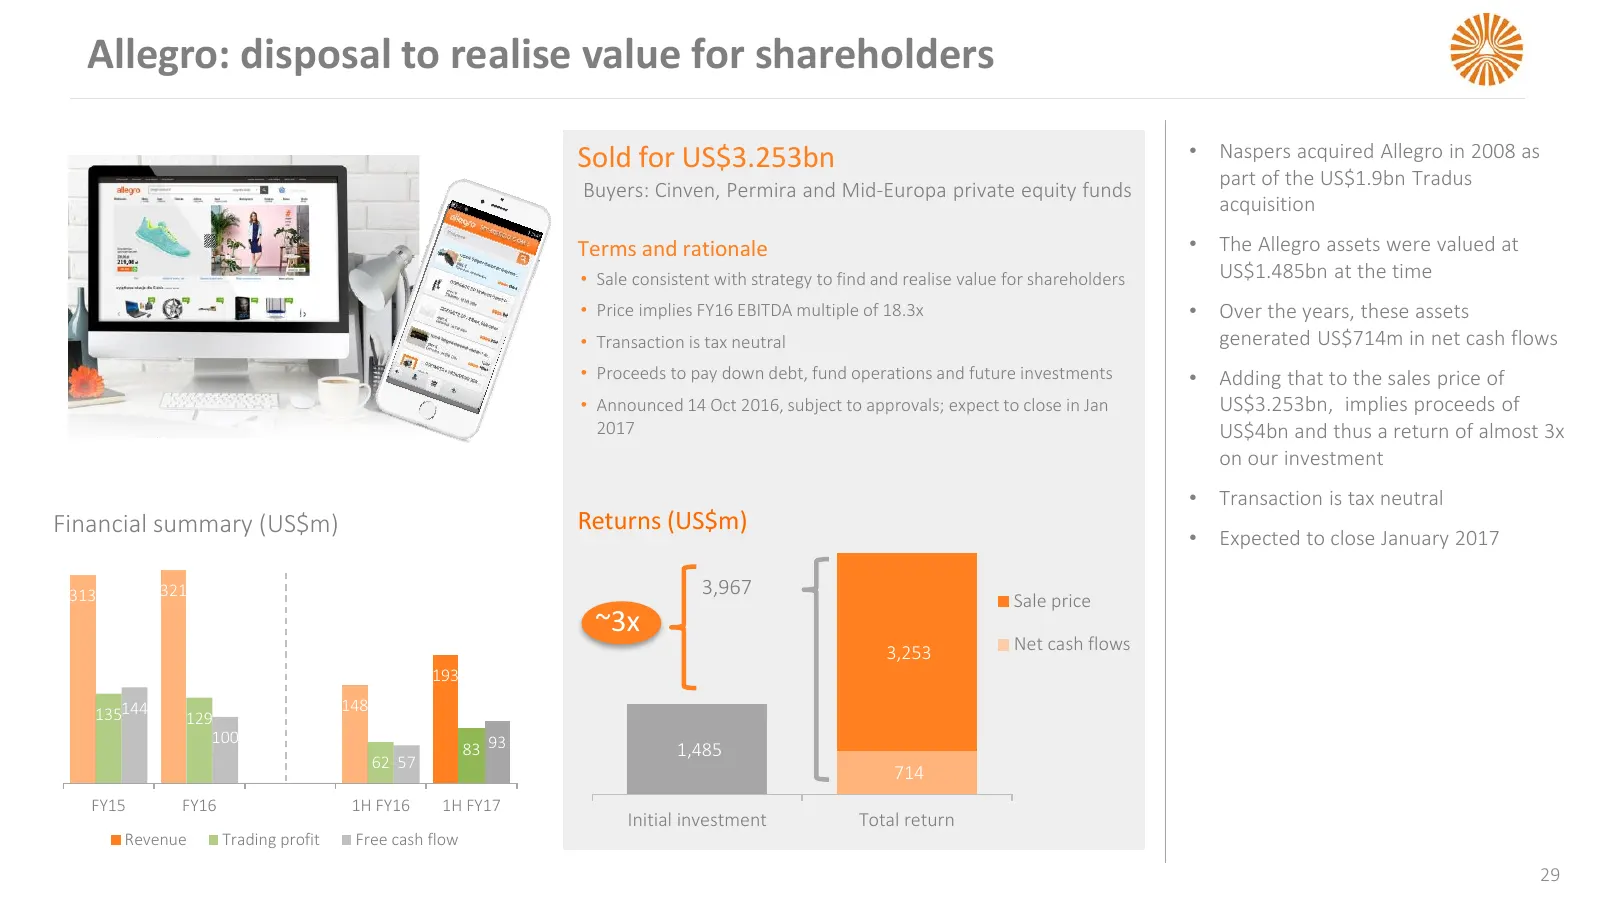
Allegro: disposal to realise value for shareholders Sold for US$3.253bn • Naspers acquired Allegro in 2008 as part of the US$1.9bn Tradus Buyers: Cinven, Permira and Mid-Europa private equity funds acquisition Terms and rationale • The Allegro assets were valued at • Sale consistent with strategy to
Slide 30: Flipkart: competitive market, still early days for India B2C
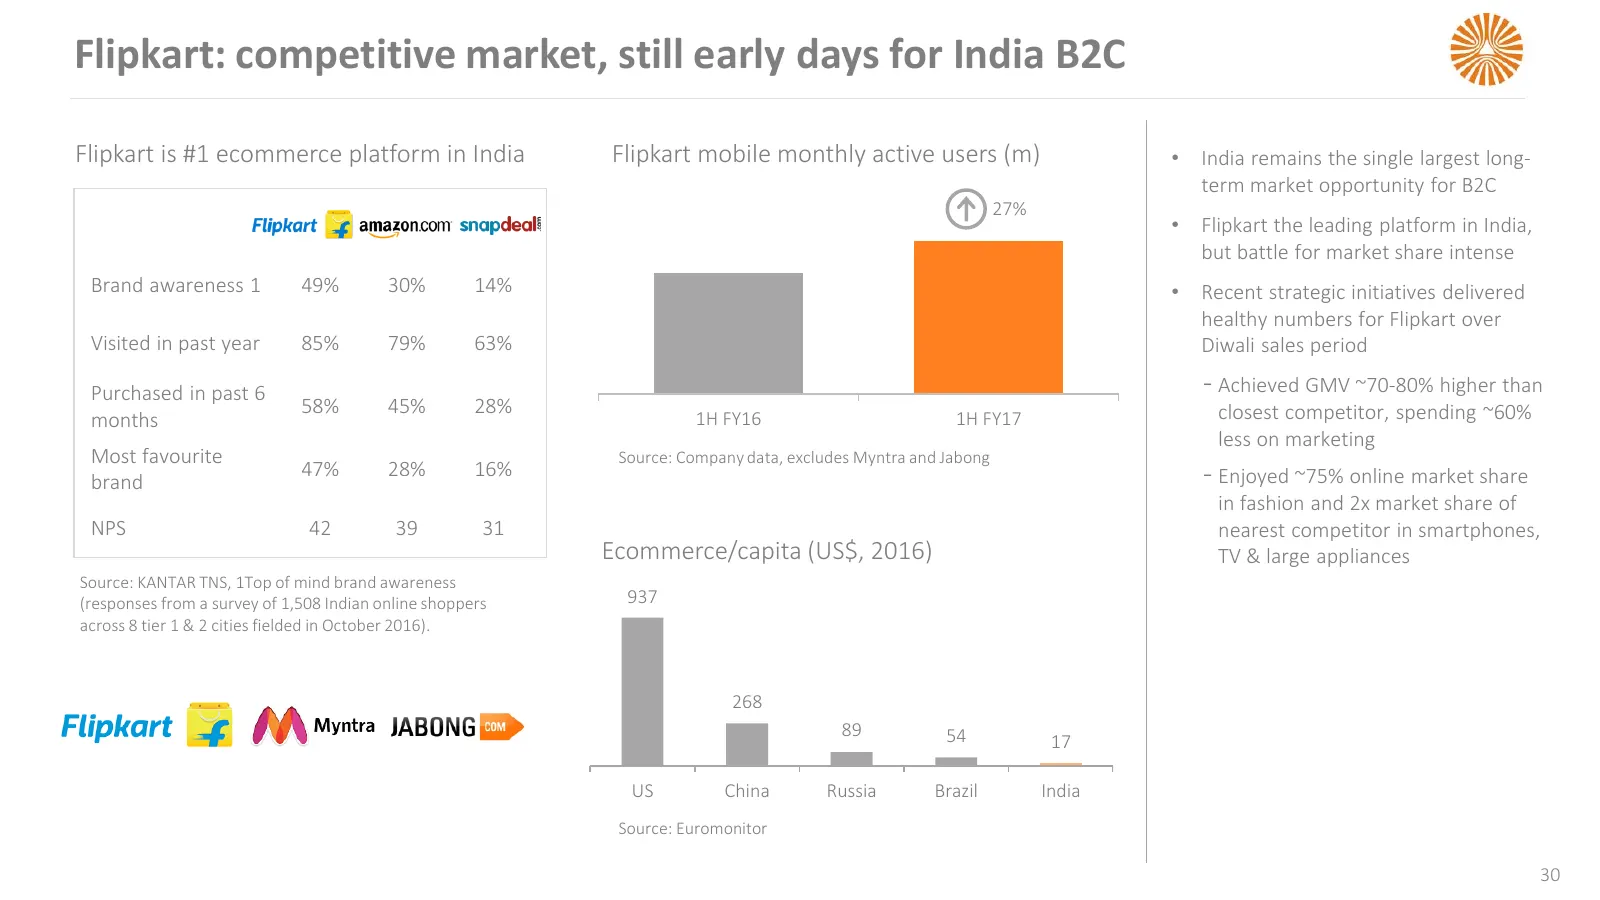
Flipkart: competitive market, still early days for India B2C Flipkart is #1 ecommerce platform in India Flipkart mobile monthly active users (m) • India remains the single largest long- term market opportunity for B2C 27% • Flipkart the leading platform in India, but battle for market share intense
Slide 31: Classifieds: global footprint for the OLX Group
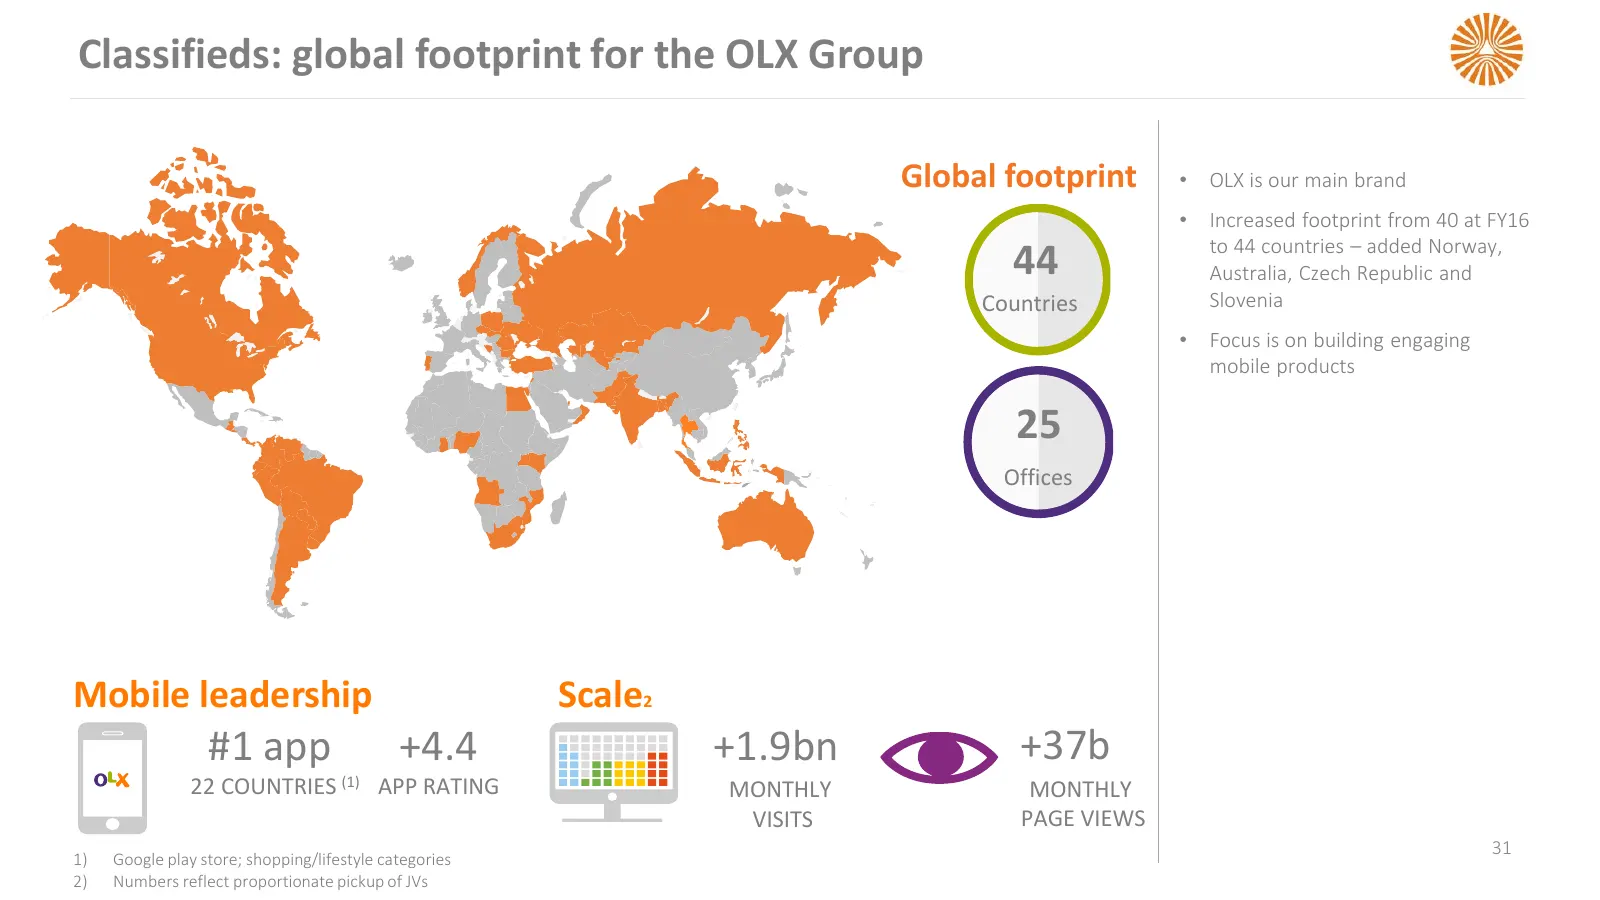
Classifieds: global footprint for the OLX Group Global footprint • OLX is our main brand • Increased footprint from 40 at FY16 to 44 countries – added Norway, 44 Australia, Czech Republic and Countries Slovenia • Focus is on building engaging mobile products 25 Offices Mobile leadership Scale2 #1 ap
Slide 32: Classifieds: top line growth while managing profitability
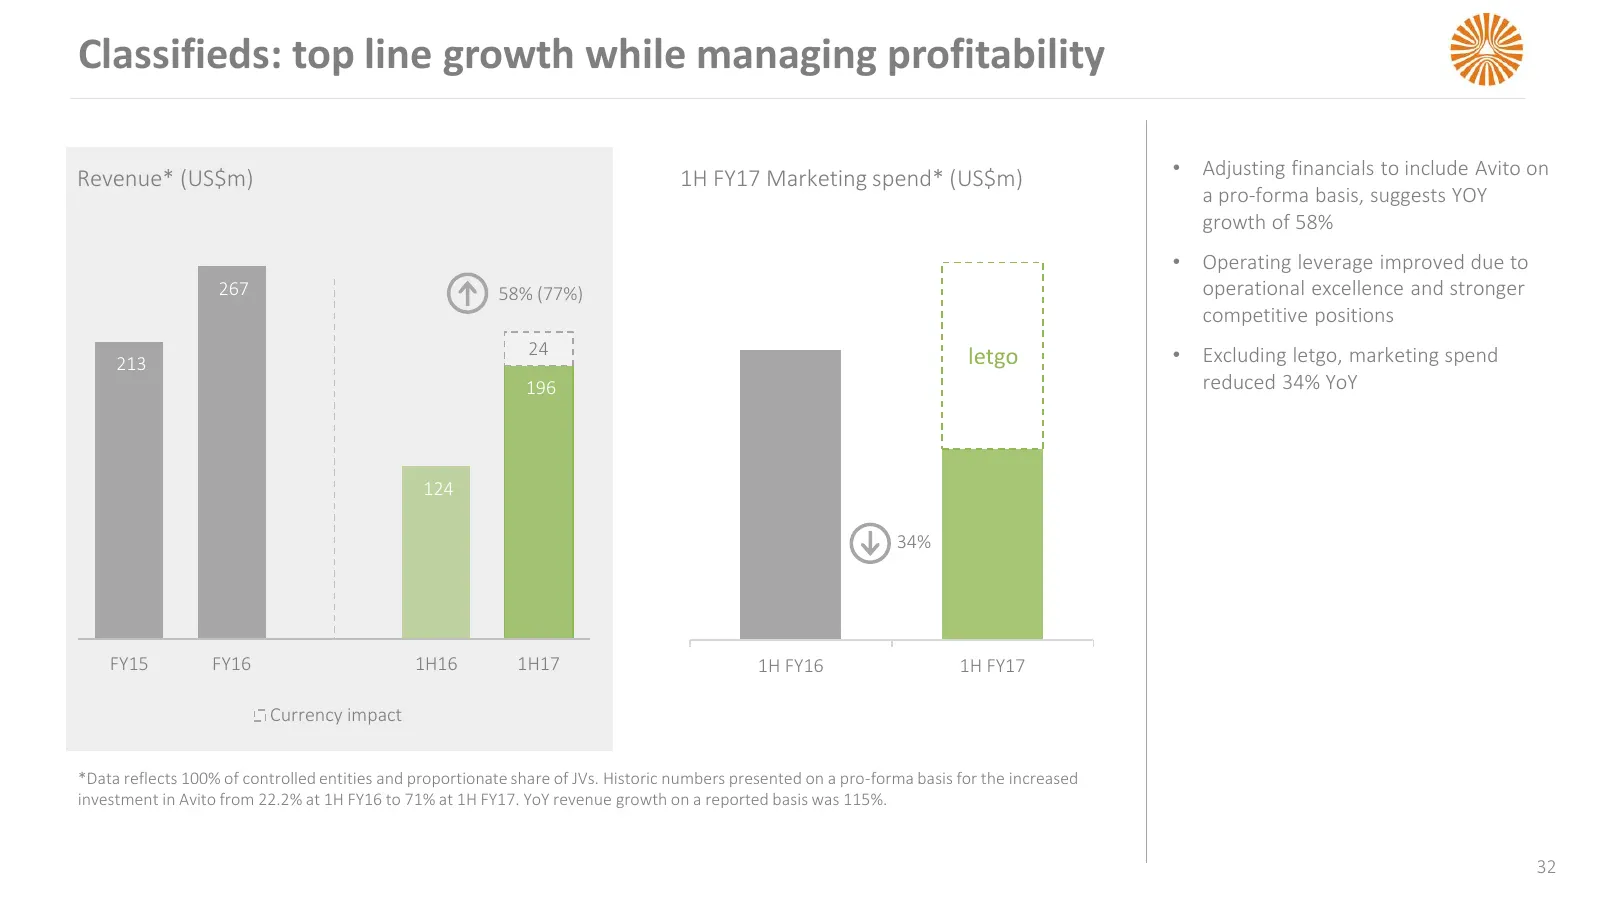
Classifieds: top line growth while managing profitability Revenue* (US$m) 1H FY17 Marketing spend* (US$m) • Adjusting financials to include Avito on a pro-forma basis, suggests YOY growth of 58% • Operating leverage improved due to 267 58% (77%) operational excellence and stronger competitive positi
Slide 33: Classifieds: continue to monetise and extend current positions
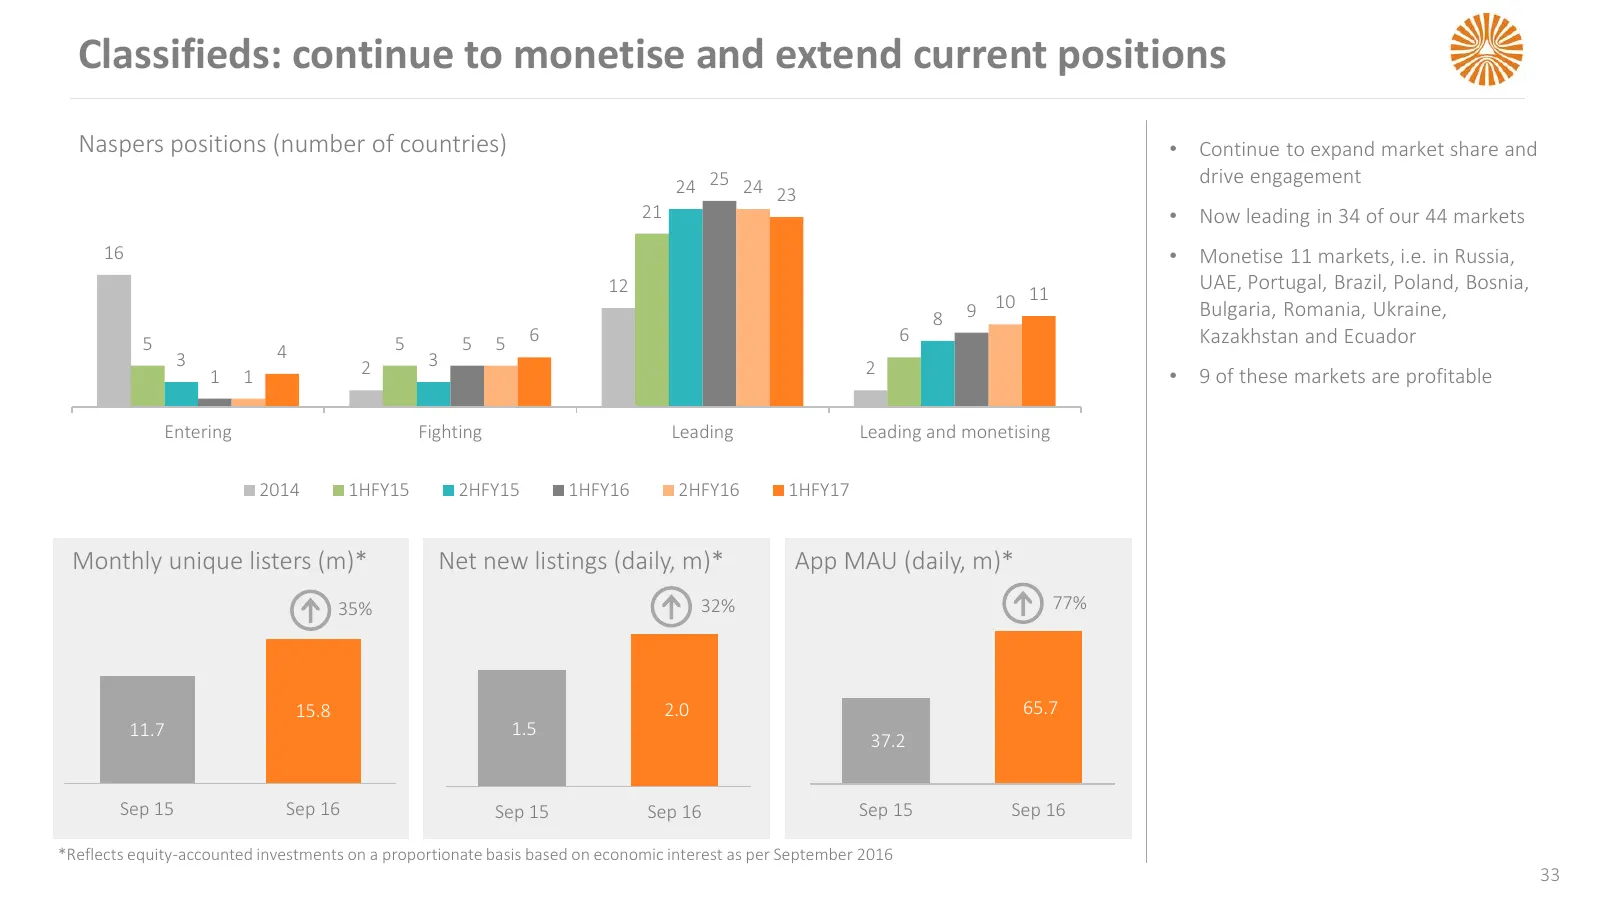
Classifieds: continue to monetise and extend current positions Naspers positions (number of countries) • Continue to expand market share and 24 25 24 drive engagement 23 21 • Now leading in 34 of our 44 markets 16 • Monetise 11 markets, i.e. in Russia, 12 11 UAE, Portugal, Brazil, Poland, Bosnia, 8
Slide 34: Classifieds: C2C trade drives our business
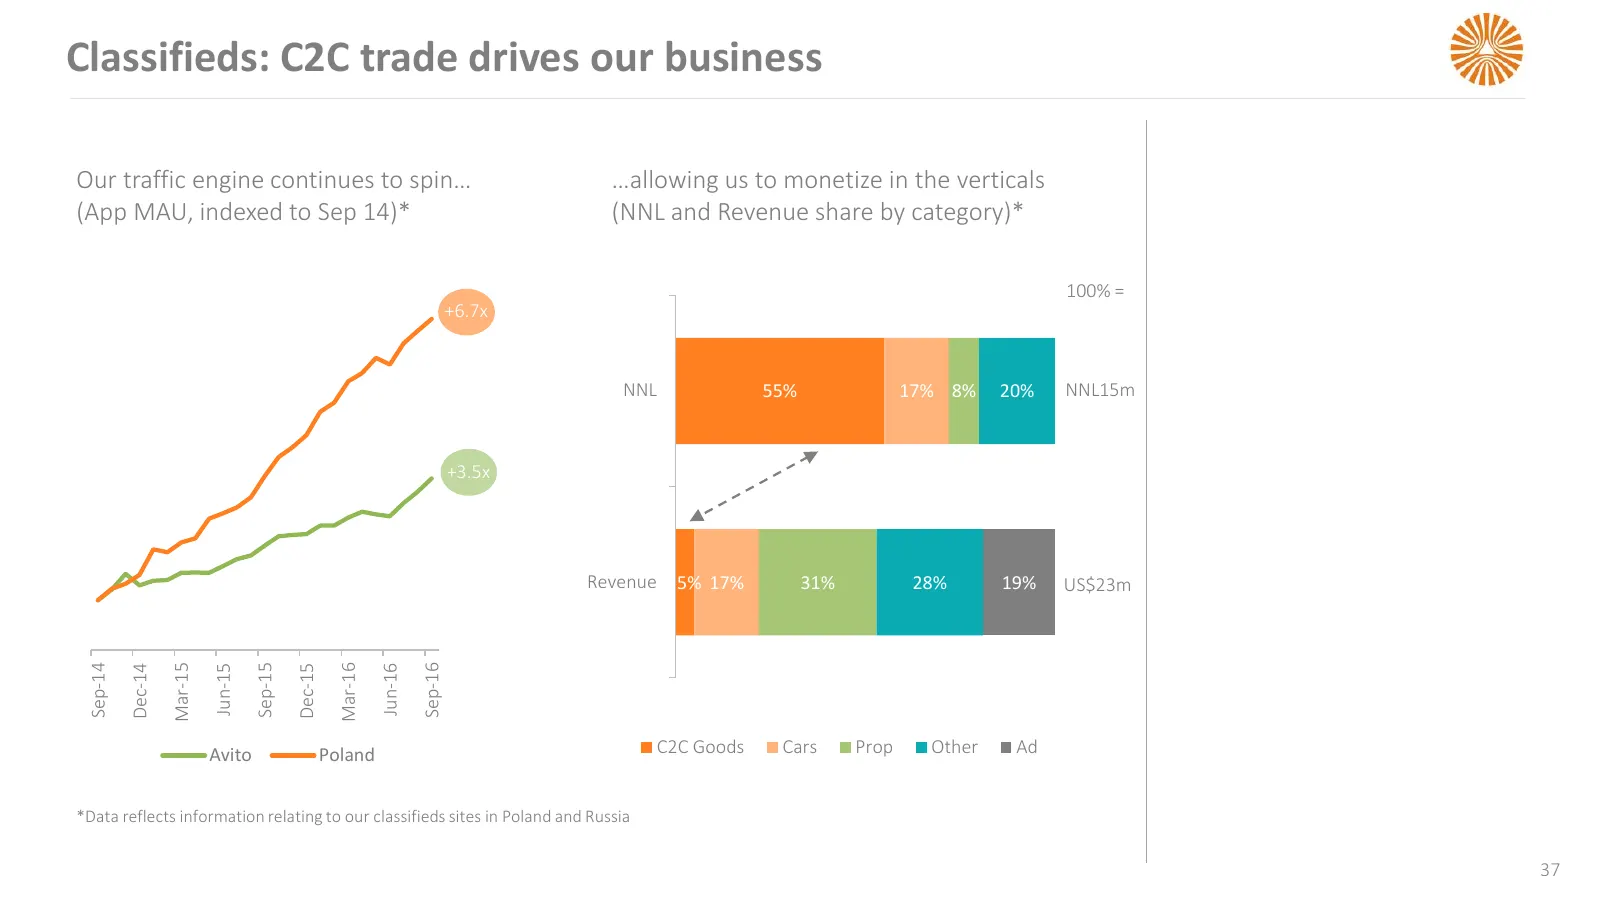
Classifieds: C2C trade drives our business Our traffic engine continues to spin… …allowing us to monetize in the verticals (App MAU, indexed to Sep 14)* (NNL and Revenue share by category)* 100% = +6.7x NNL 55% 17% 8% 20% NNL15m +3.5x Revenue 5% 17% 31% 28% 19% US$23m Sep-14 Mar-15 Sep-15 Mar-16 Sep
Slide 35: Classifieds: ramping monetisation in Russia
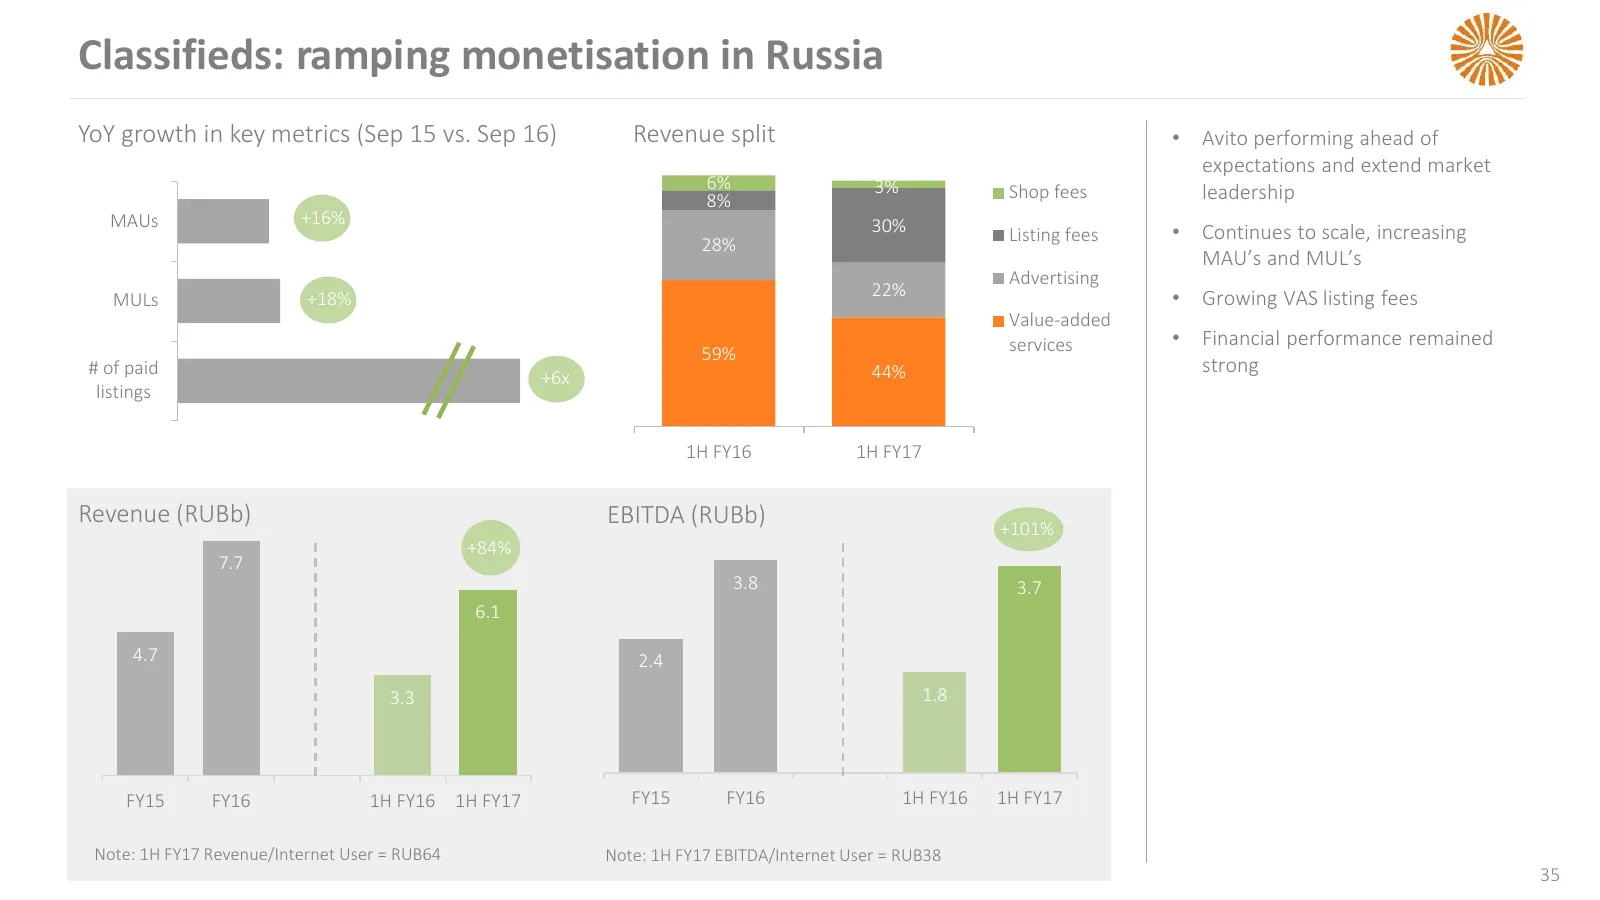
Classifieds: ramping monetisation in Russia YoY growth in key metrics (Sep 15 vs. Sep 16) Revenue split • Avito performing ahead of expectations and extend market 6% 3% Shop fees leadership 8% MAUs +16% 30% Listing fees • Continues to scale, increasing 28% MAU’s and MUL’s Advertising +18% 22% • Grow
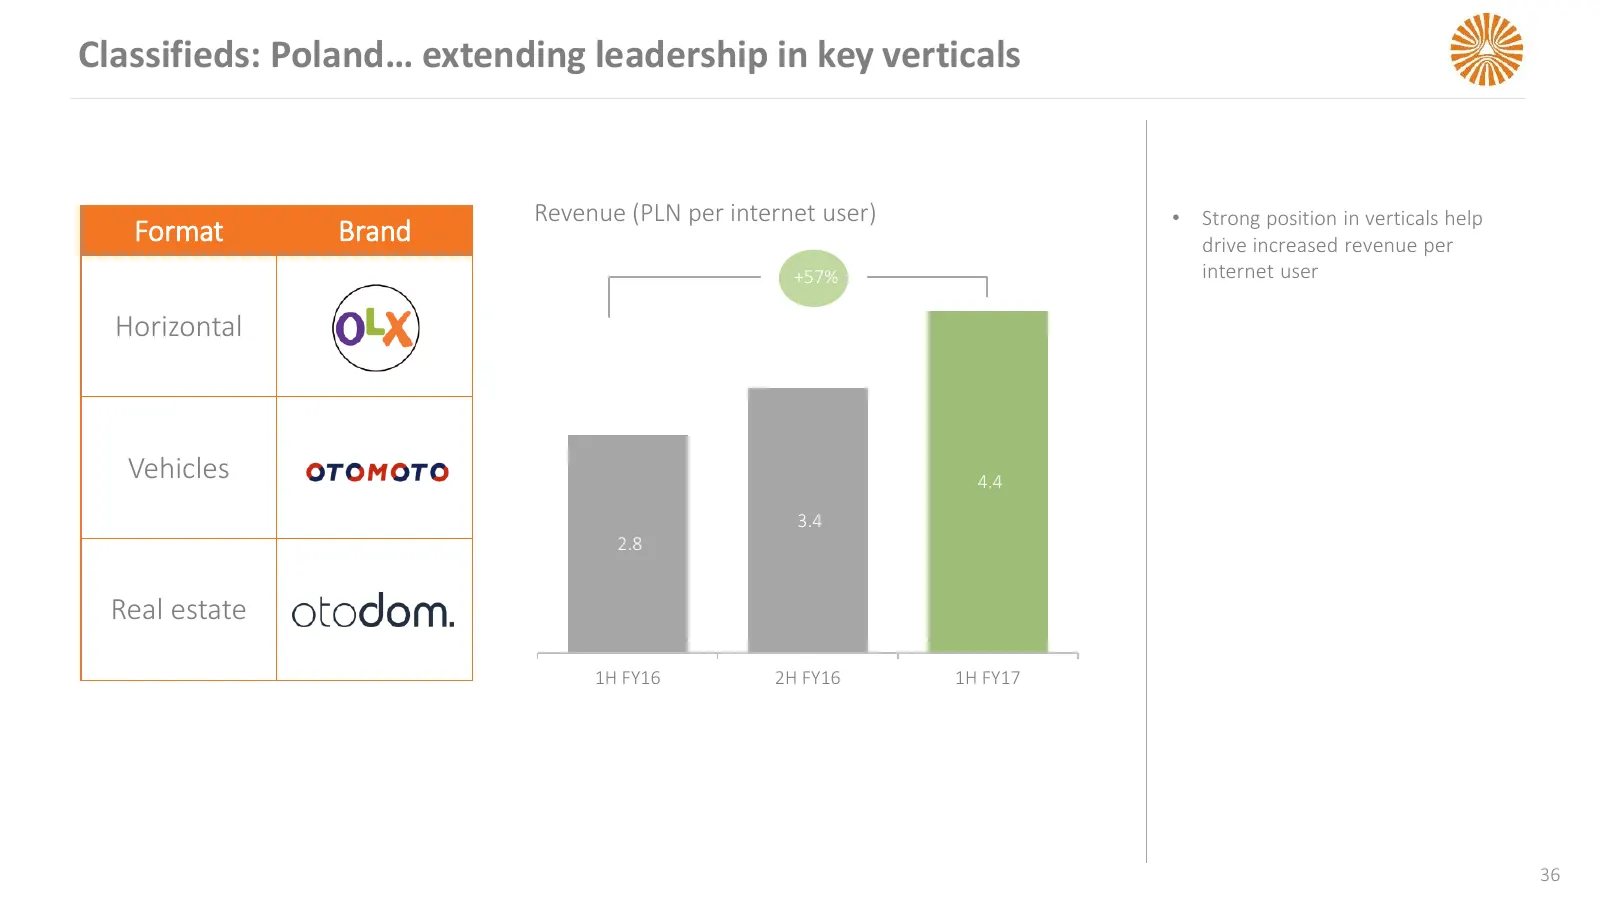
Slide 36: Classifieds: Poland… extending leadership in key verticals
Classifieds: Poland… extending leadership in key verticals Revenue (PLN per internet user) • Strong position in verticals help Format Brand drive increased revenue per +57% internet user Horizontal Vehicles 4.4 3.4 2.8 Real estate 1H FY16 2H FY16 1H FY17 36
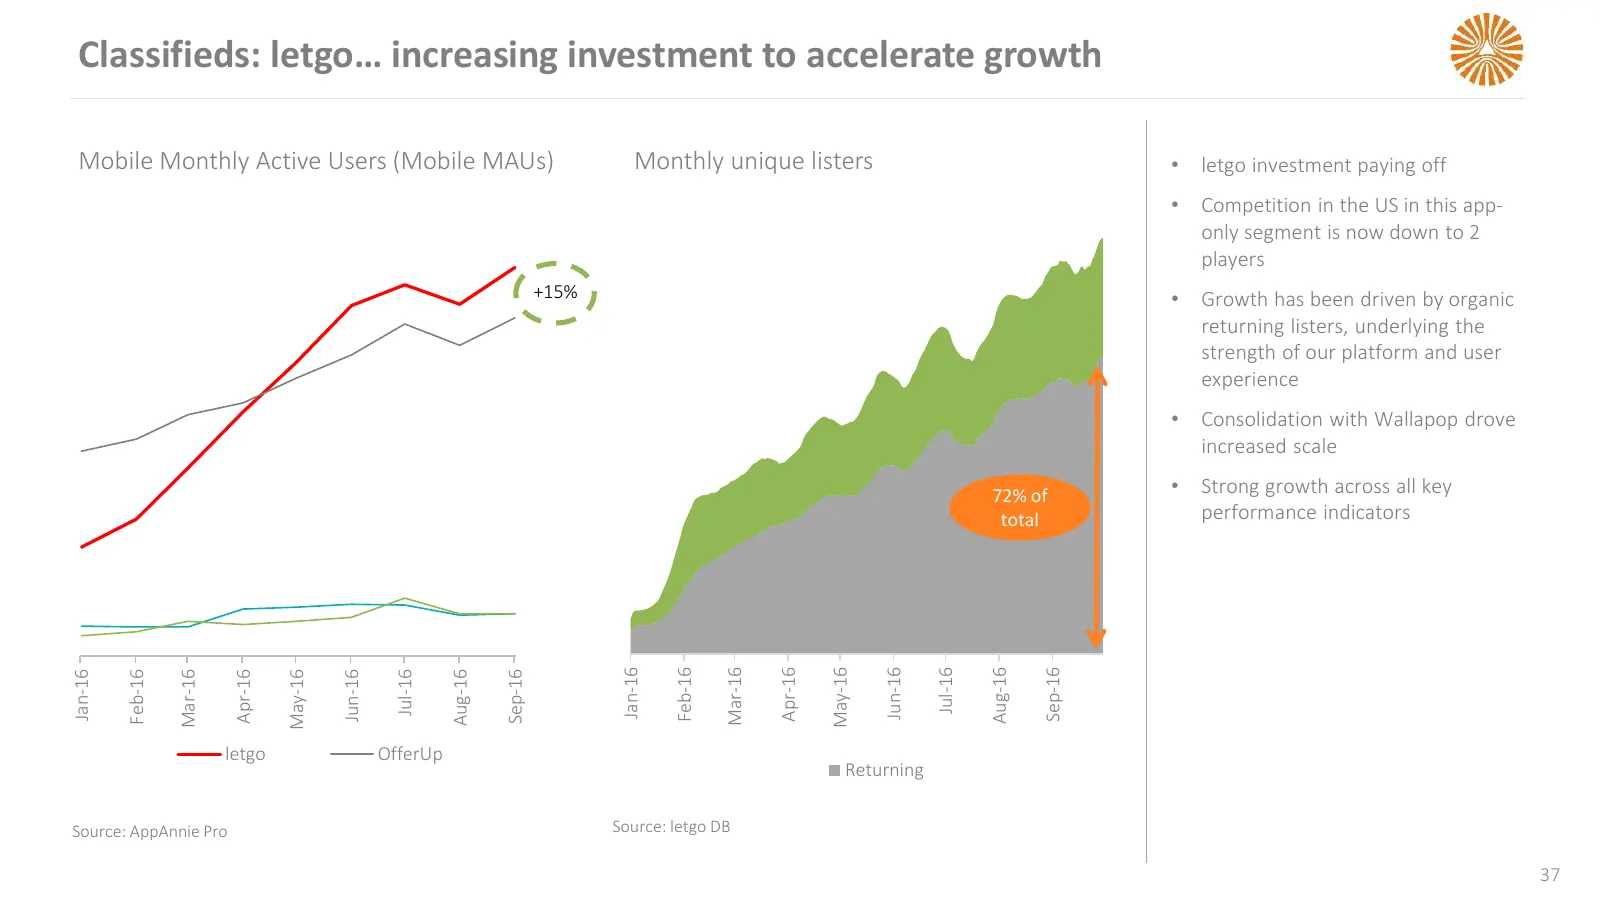
Slide 37: Classifieds: letgo… increasing investment to accelerate growth
Classifieds: letgo… increasing investment to accelerate growth Mobile Monthly Active Users (Mobile MAUs) Monthly unique listers • letgo investment paying off • Competition in the US in this app- only segment is now down to 2 players +15% • Growth has been driven by organic returning listers, underly
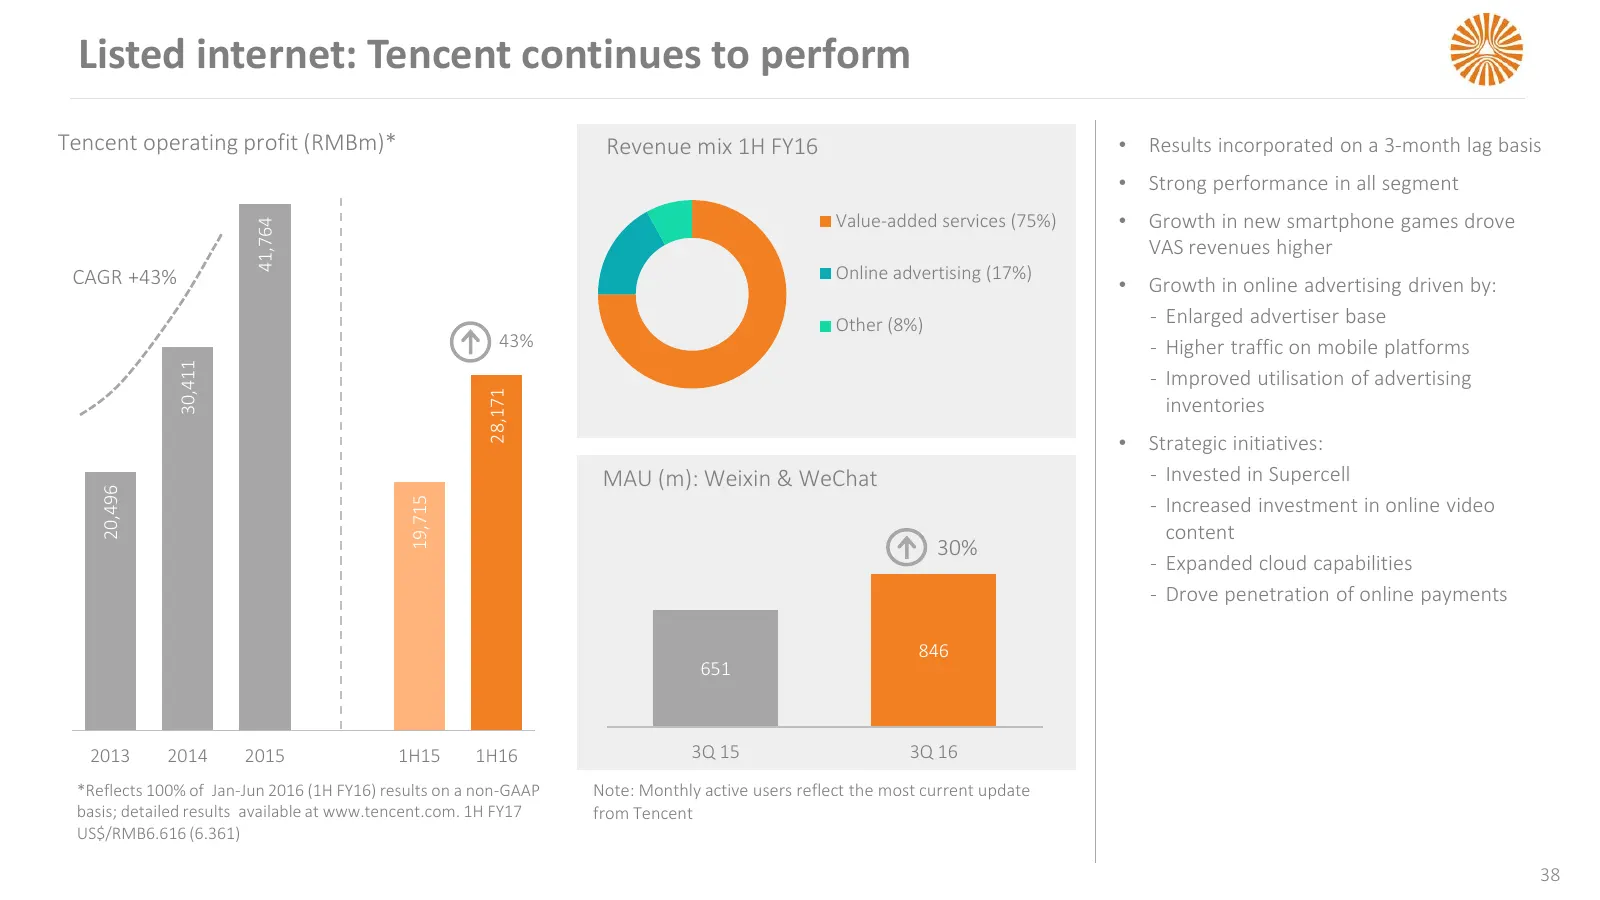
Slide 38: Listed internet: Tencent continues to perform
Listed internet: Tencent continues to perform Tencent operating profit (RMBm)* Revenue mix 1H FY16 • Results incorporated on a 3-month lag basis • Strong performance in all segment Value-added services (75%) • Growth in new smartphone games drove 41,764 VAS revenues higher CAGR +43% Online advertisi
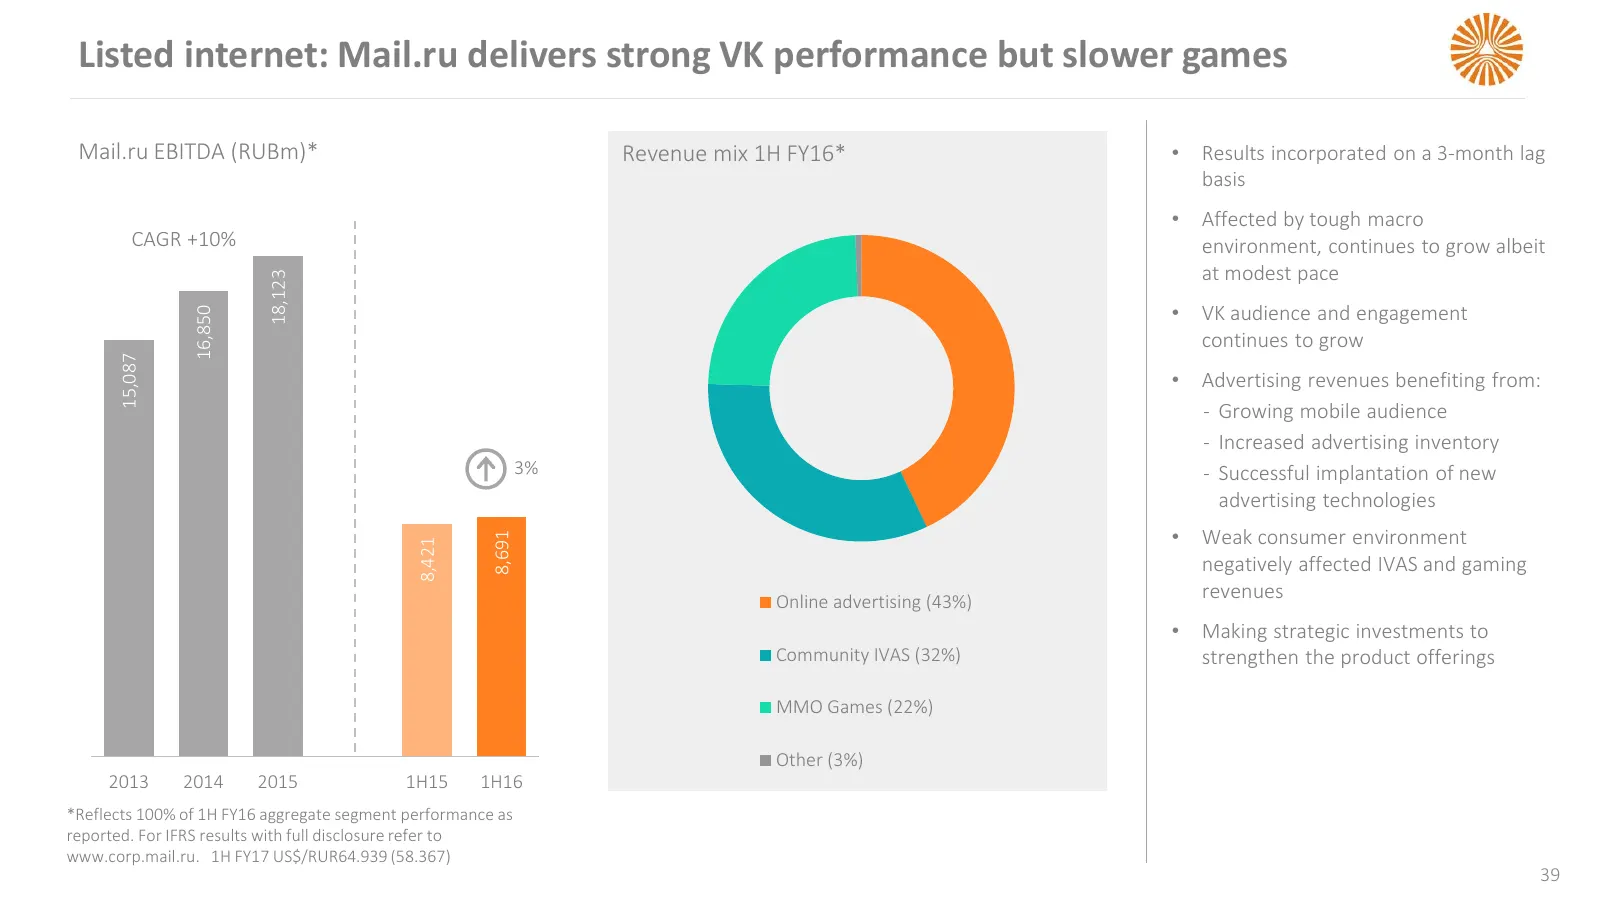
Slide 39: Listed internet: Mail.ru delivers strong VK performance but slower games
Listed internet: Mail.ru delivers strong VK performance but slower games Mail.ru EBITDA (RUBm)* Revenue mix 1H FY16* • Results incorporated on a 3-month lag basis • Affected by tough macro CAGR +10% environment, continues to grow albeit 18,123 at modest pace • VK audience and engagement 16,850 conti

Slide 40: Video Entertainment
VIDEO ENTERTAINMENT
Slide 41: VE: solid subscriber growth, changing mix
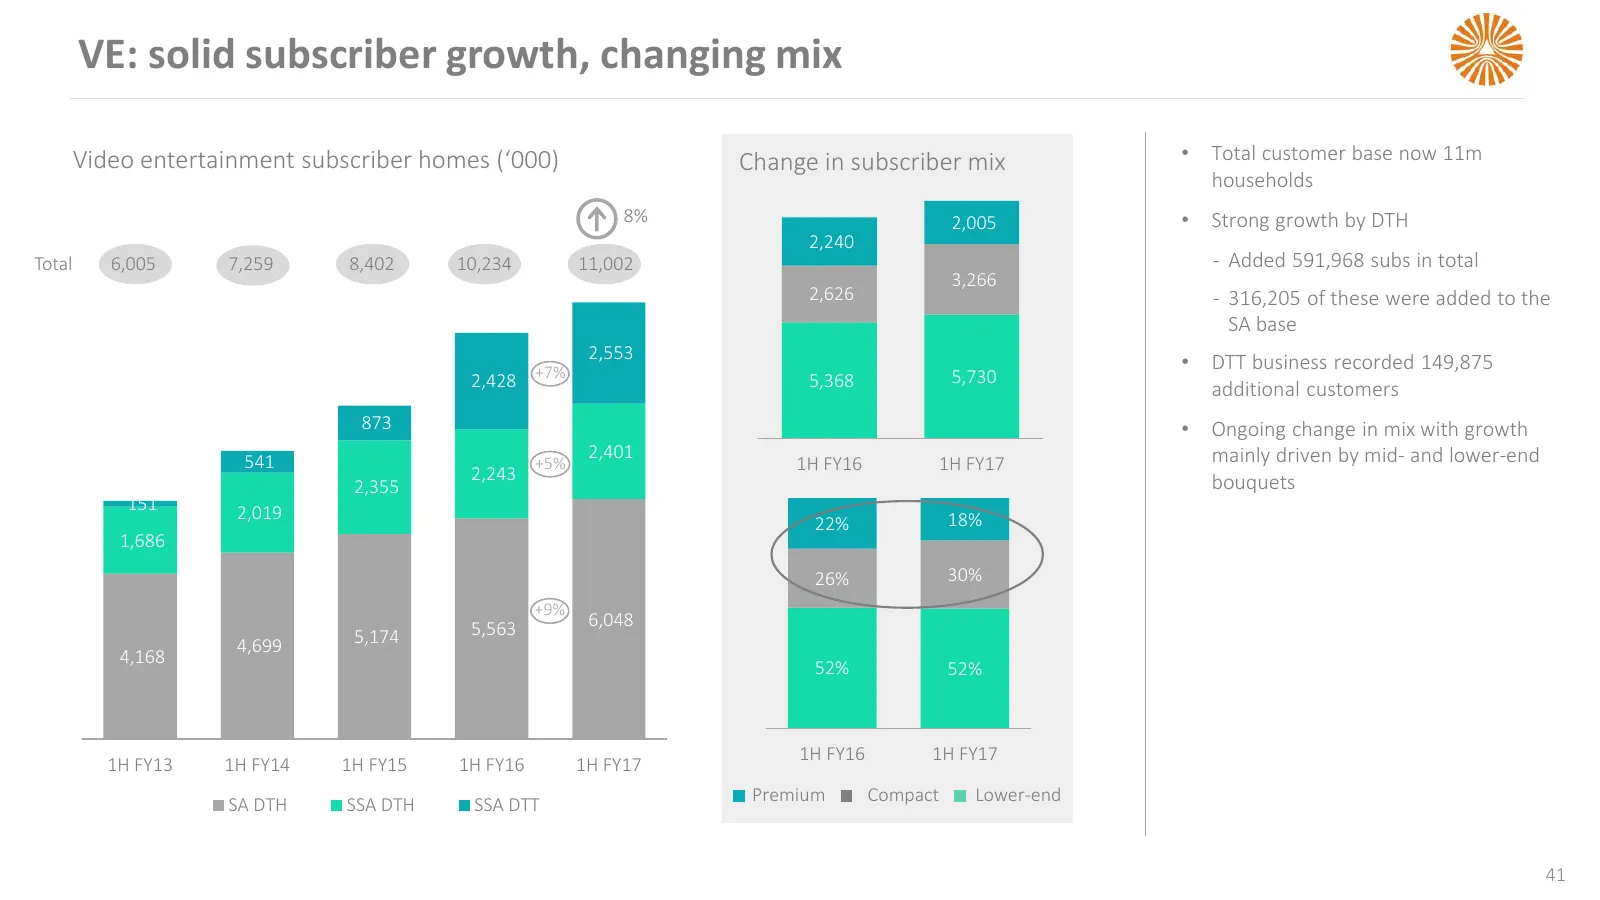
VE: solid subscriber growth, changing mix Video entertainment subscriber homes (‘000) Change in subscriber mix • Total customer base now 11m households 8% 2,005 • Strong growth by DTH 2,240 Total 6,005 7,259 8,402 10,234 11,002 ‐ Added 591,968 subs in total 3,266 2,626 ‐ 316,205 of these were added
Slide 42: VE: financials hit by local currency pricing vs. USD input costs
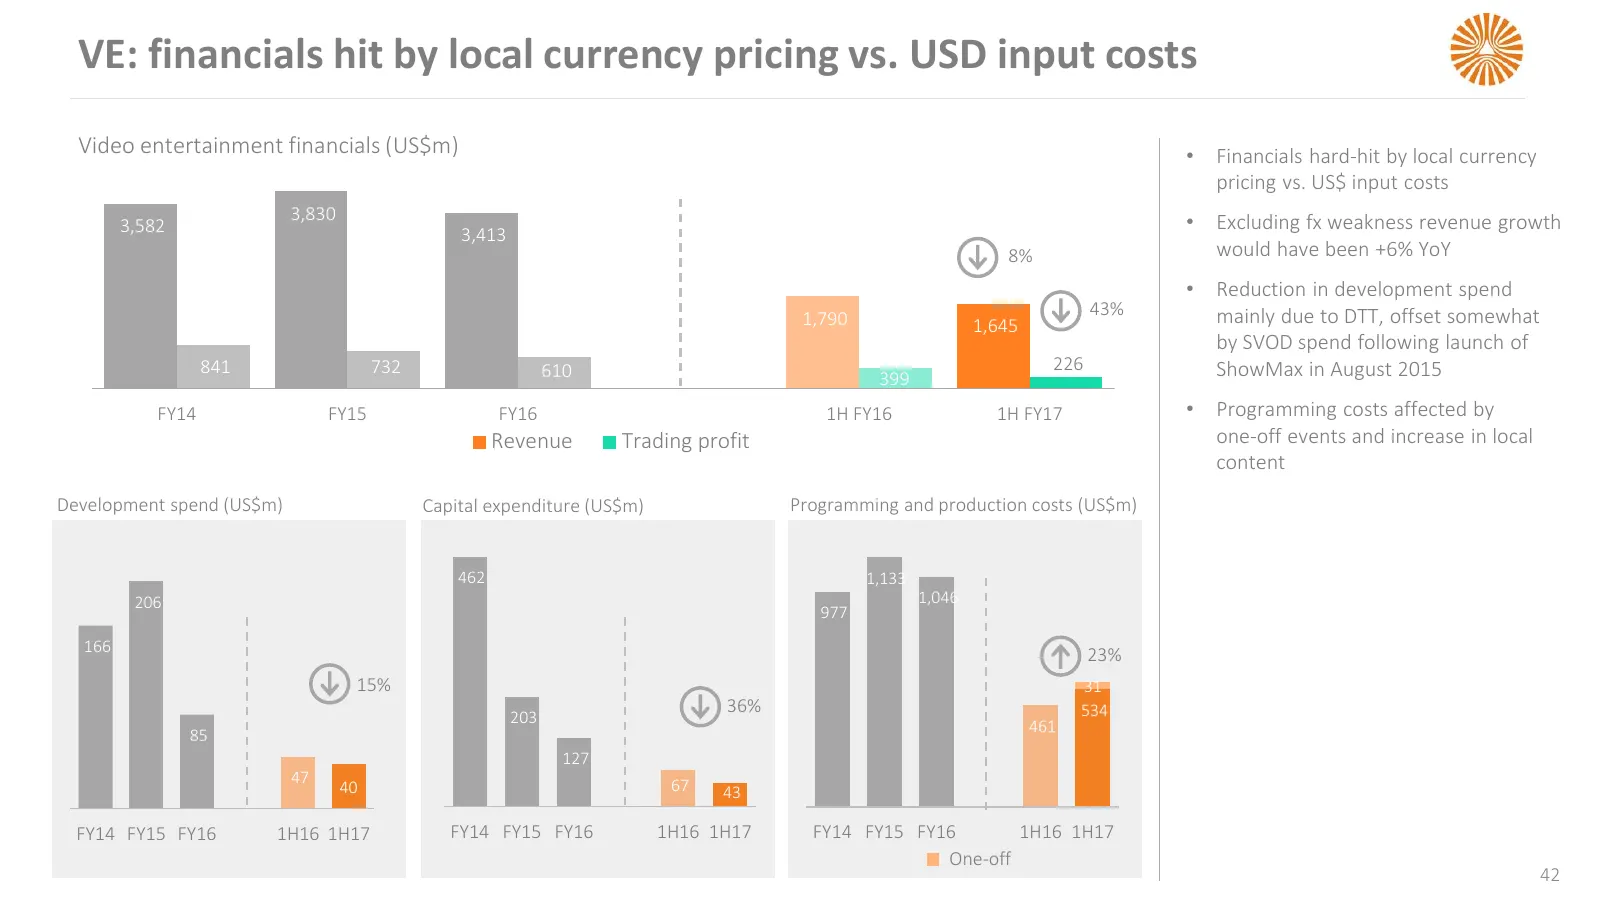
VE: financials hit by local currency pricing vs. USD input costs Video entertainment financials (US$m) • Financials hard-hit by local currency pricing vs. US$ input costs 3,830 • Excluding fx weakness revenue growth 3,582 3,413 8% would have been +6% YoY • Reduction in development spend 1,790 43% ma
Slide 43: VE: SSA operational progress negated by Naira devaluation
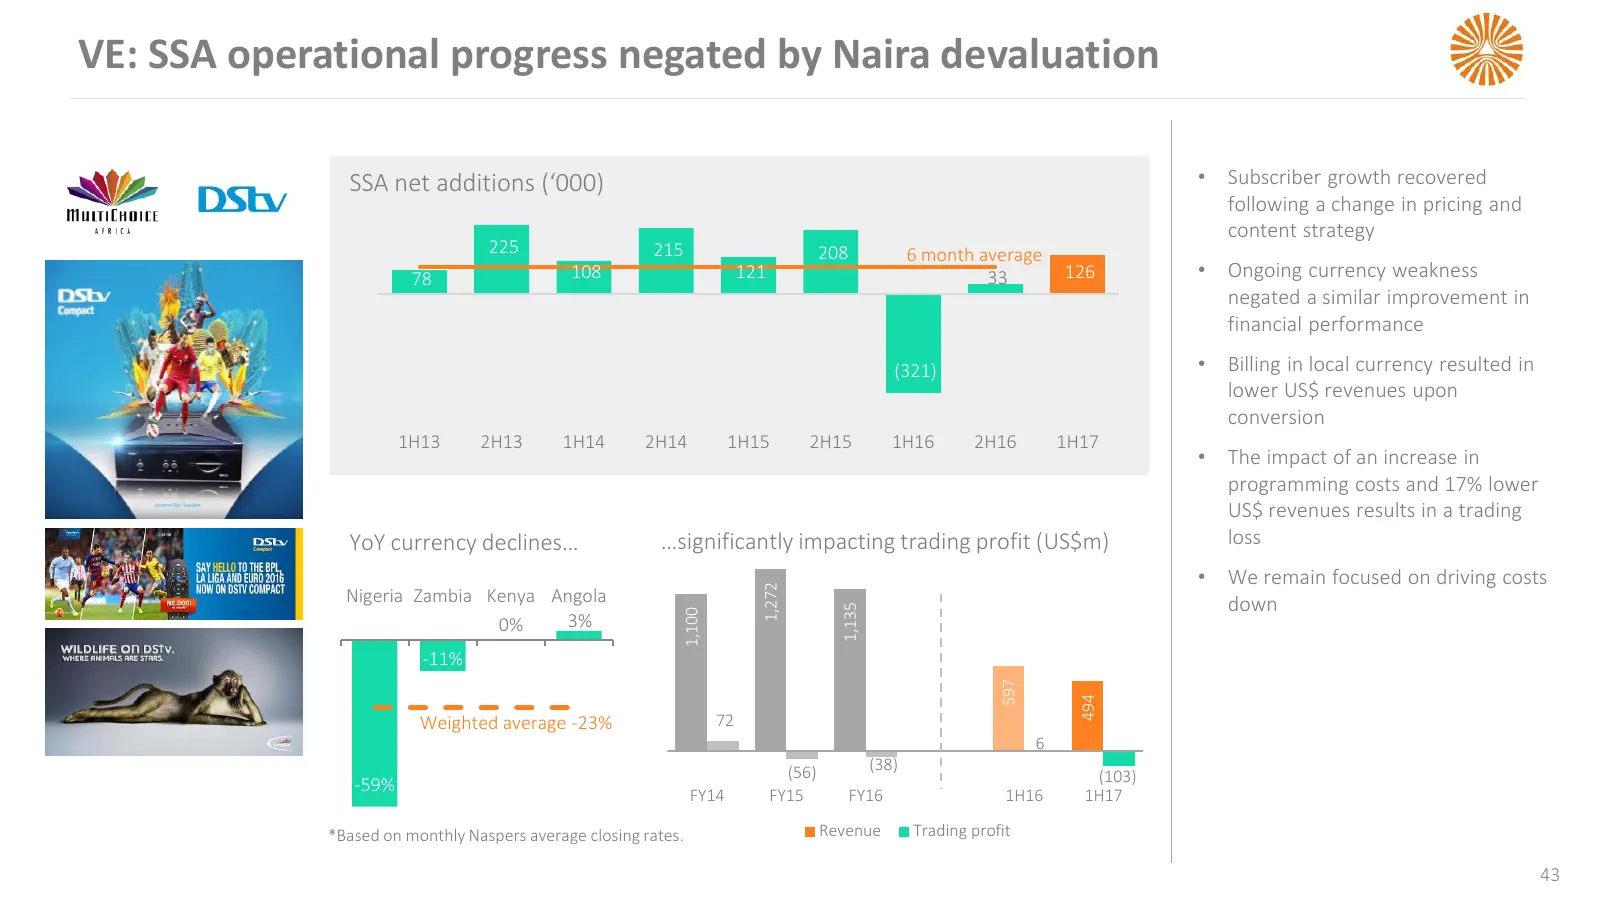
VE: SSA operational progress negated by Naira devaluation SSA net additionsSSA (‘000) net additions (‘000) • Subscriber growth recovered following a change in pricing and content strategy 225 215 208 6 month average 78 108 121 33 126 • Ongoing currency weakness negated a similar improvement in finan
Slide 44: VE: solid results by DTH South Africa
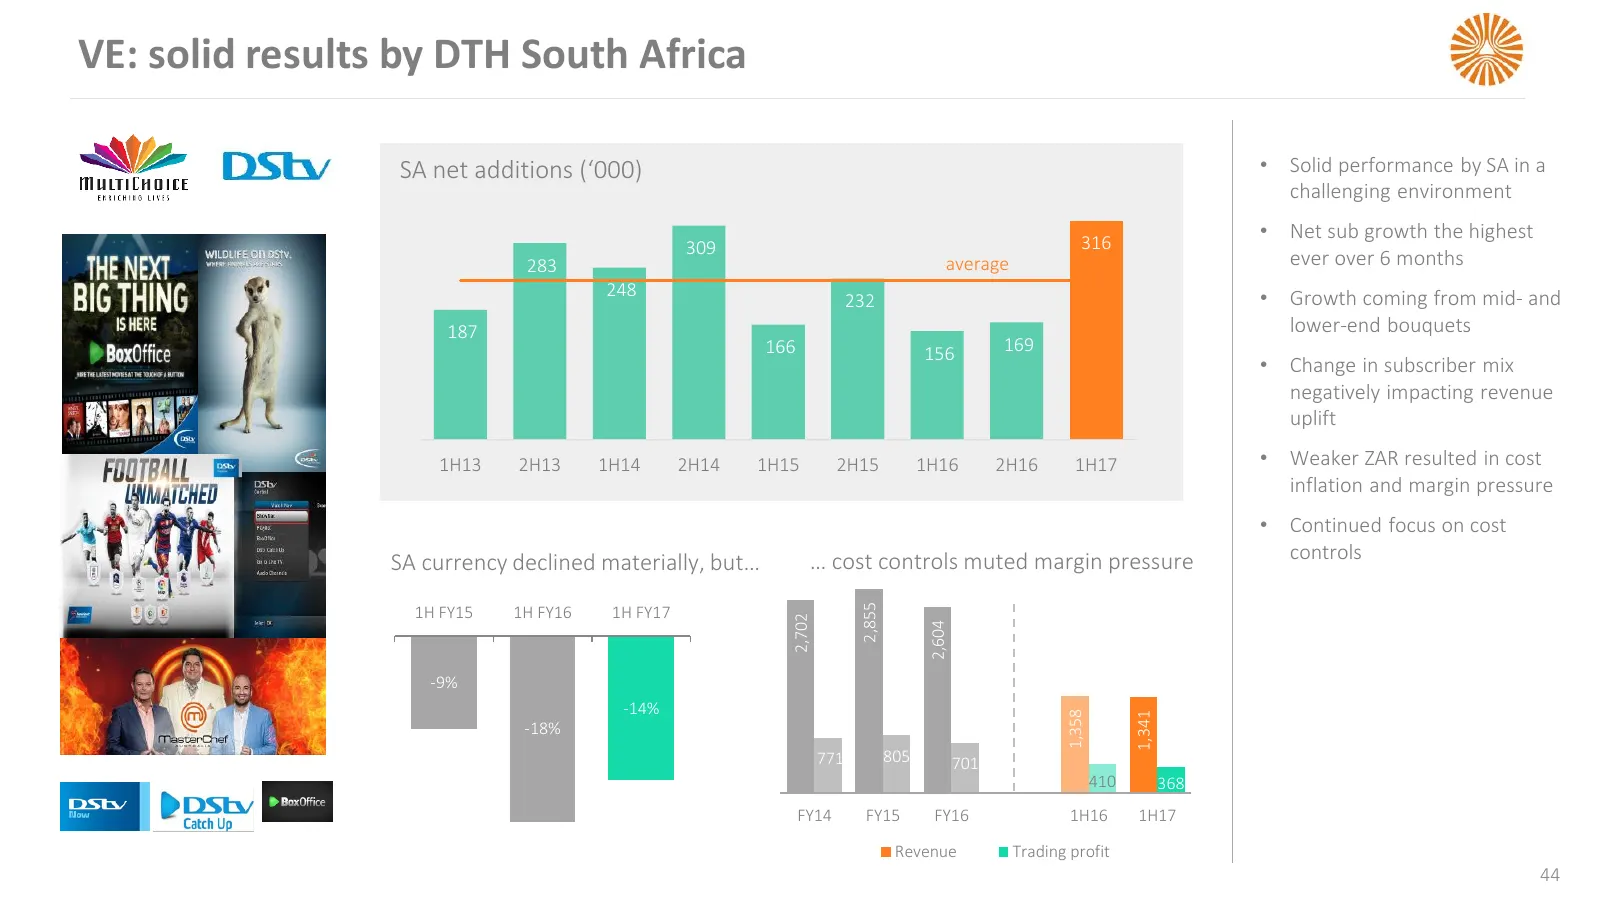
VE: solid results by DTH South Africa SA net additions (‘000) • Solid performance by SA in a challenging environment 316 • Net sub growth the highest 309 283 average ever over 6 months 248 • Growth coming from mid- and 232 187 lower-end bouquets 166 156 169 • Change in subscriber mix negatively impa
Slide 45: VE: DTT moving toward profitability
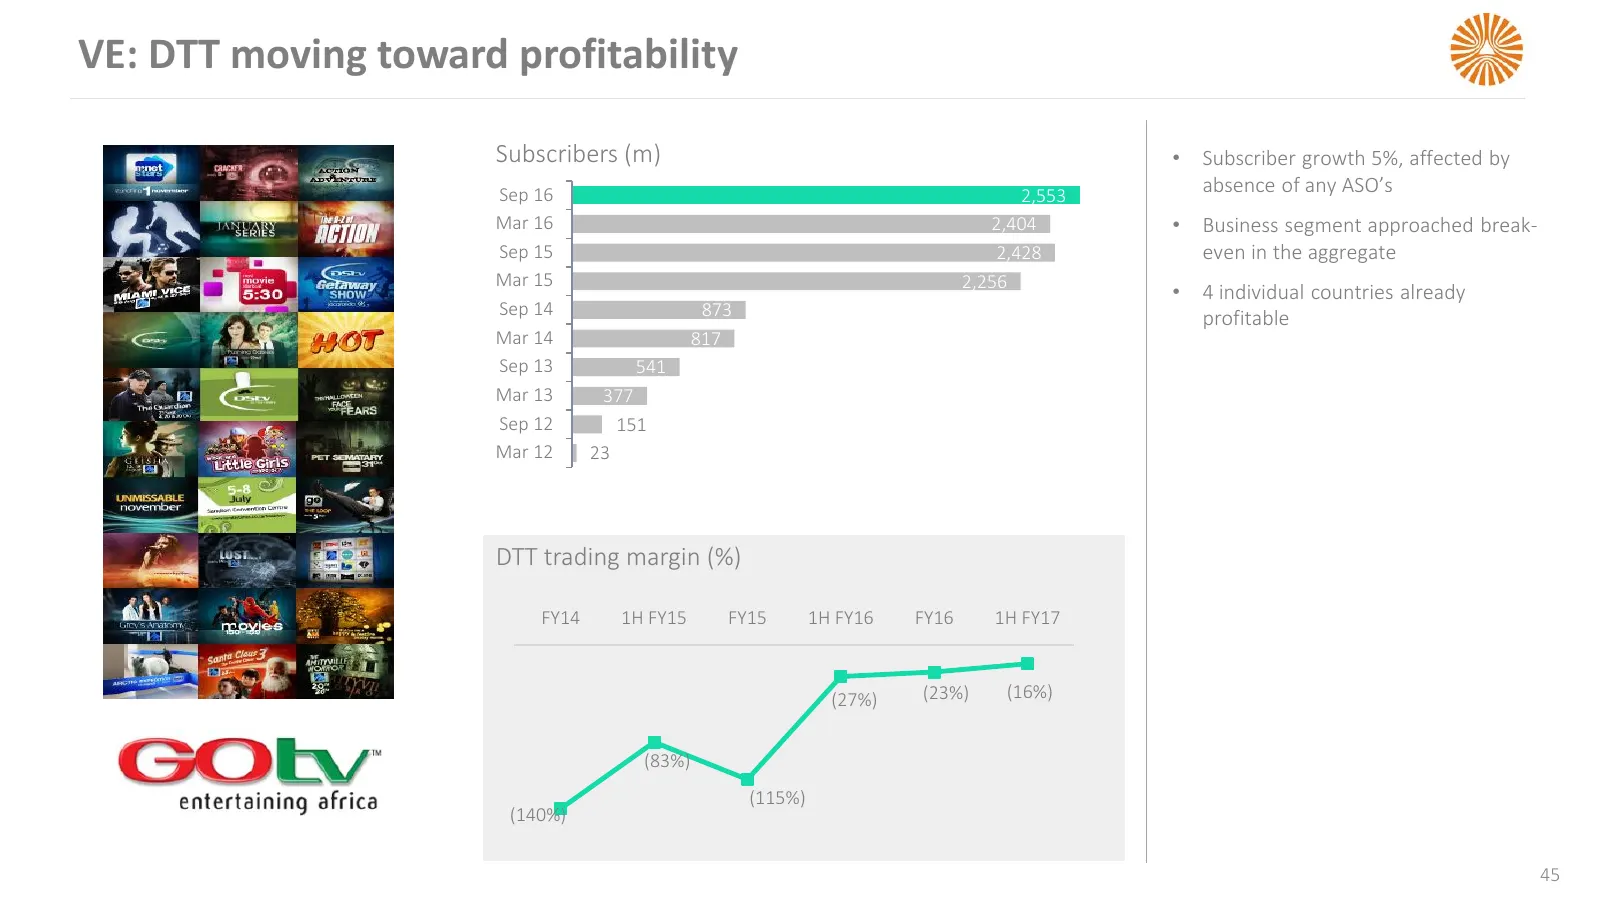
VE: DTT moving toward profitability Subscribers (m) • Subscriber growth 5%, affected by Sep 16 2,553 absence of any ASO’s Mar 16 2,404 • Business segment approached break- Sep 15 2,428 even in the aggregate Mar 15 2,256 • 4 individual countries already Sep 14 873 profitable Mar 14 817 Sep 13 541 Mar
Slide 46: Print Media
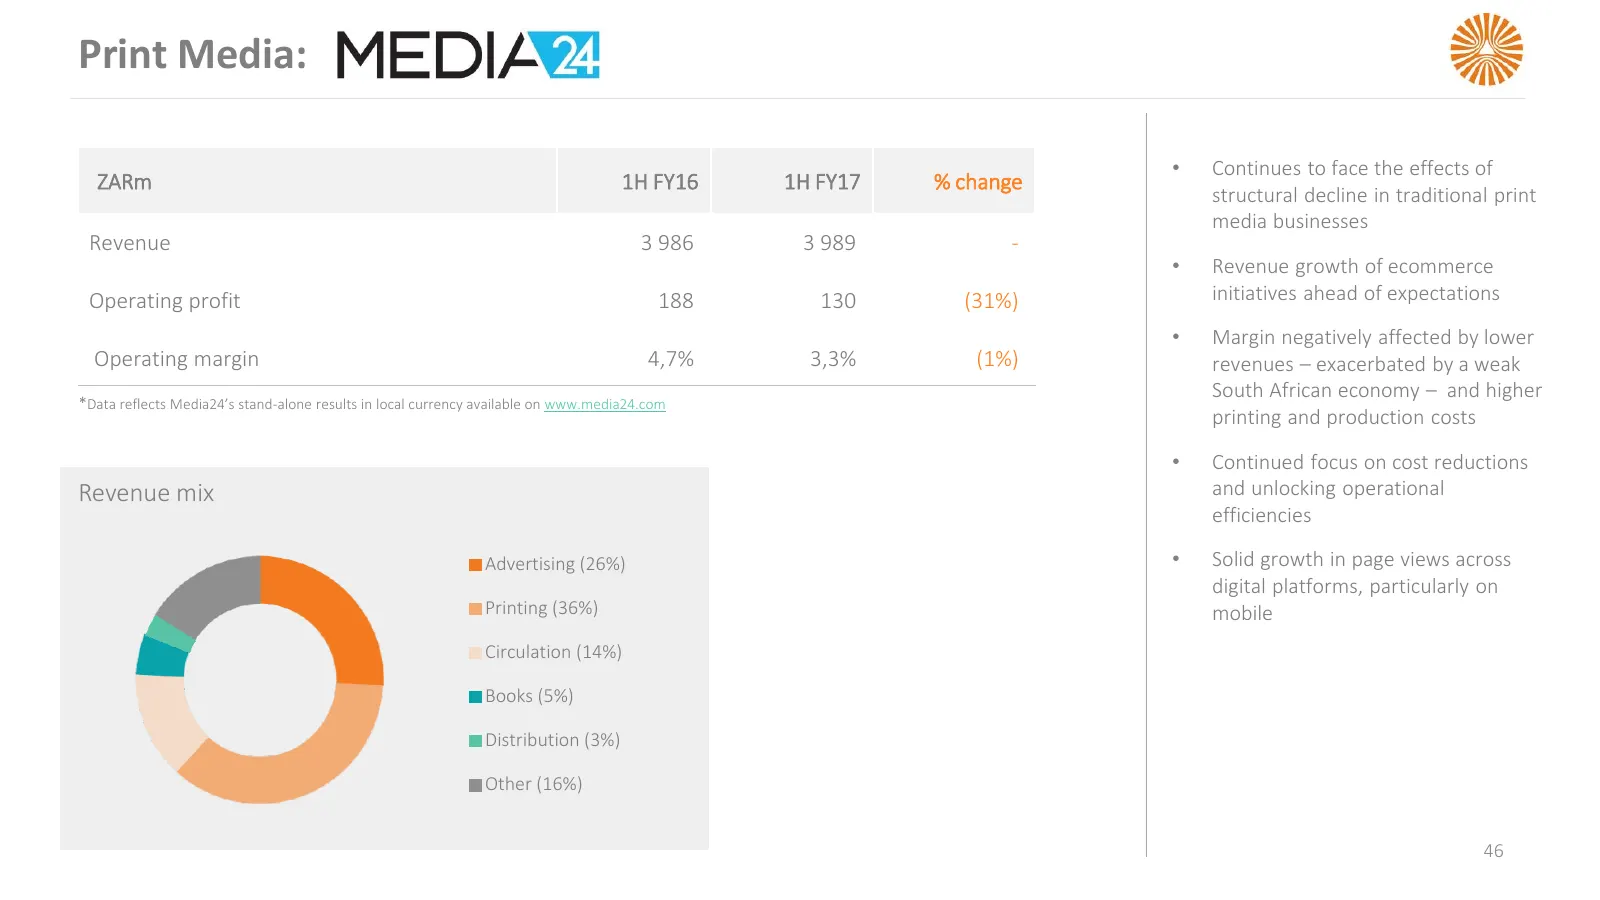
Print Media: • Continues to face the effects of ZARm 1H FY16 1H FY17 % change structural decline in traditional print media businesses Revenue 3 986 3 989 - • Revenue growth of ecommerce Operating profit 188 130 (31%) initiatives ahead of expectations • Margin negatively affected by lower Operating

Slide 47: Outlook
OUTLOOK
Slide 48: FY17 Outlook: continue building our platforms
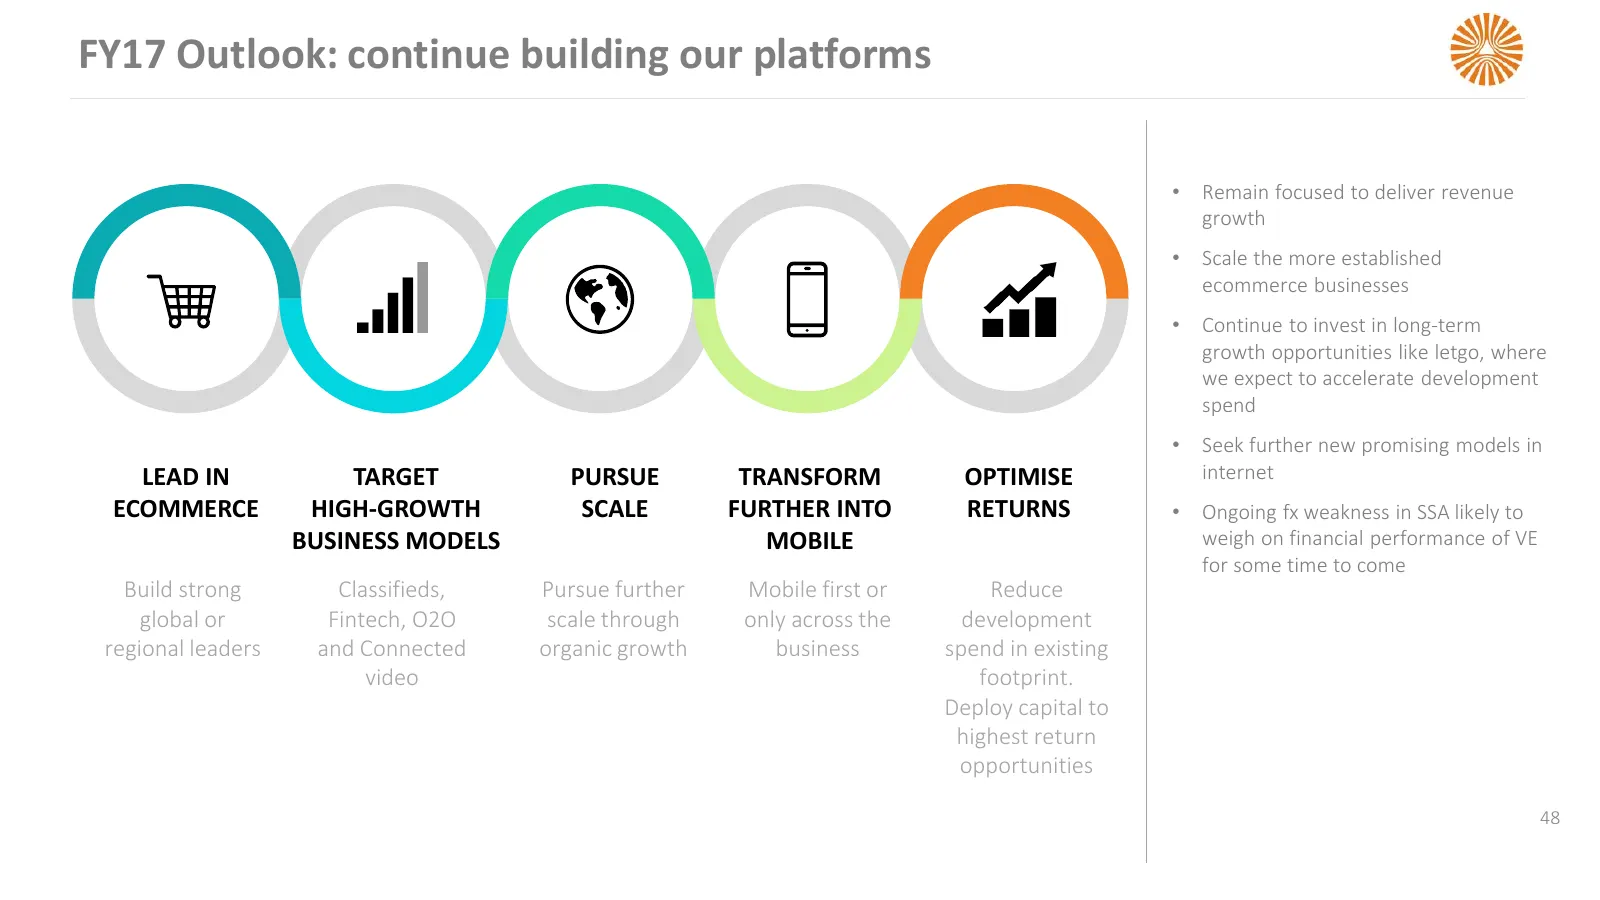
FY17 Outlook: continue building our platforms • Remain focused to deliver revenue growth • Scale the more established ecommerce businesses • Continue to invest in long-term growth opportunities like letgo, where we expect to accelerate development spend • Seek further new promising models in LEAD IN
Slide 49: Appendix
APPENDIX
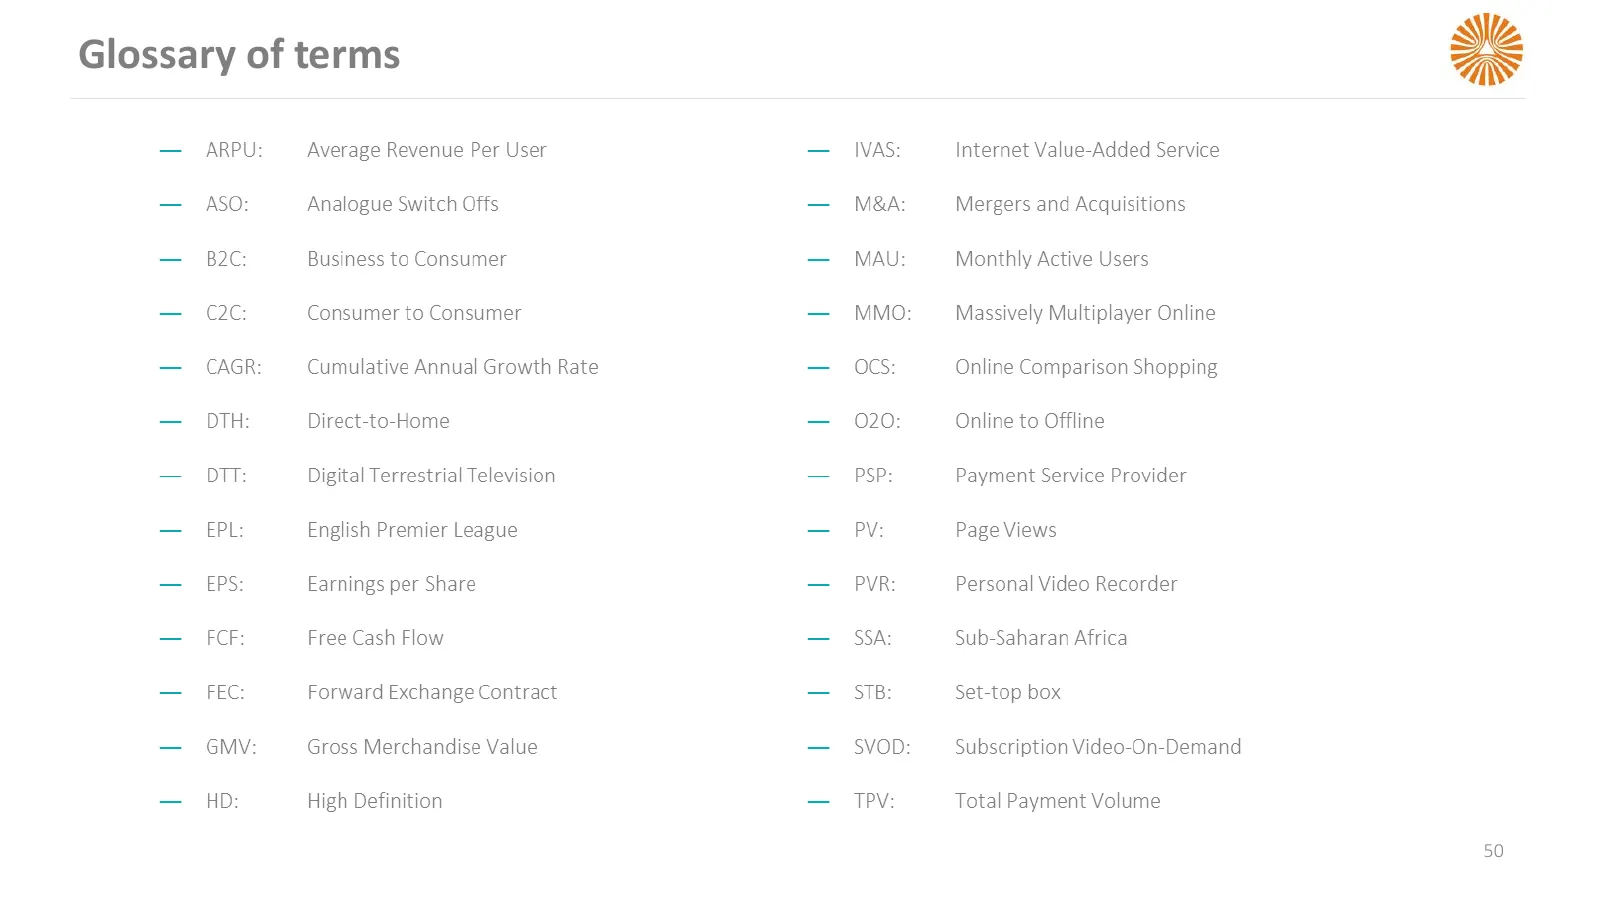
Slide 50: Glossary of terms
Glossary of terms —_ ARPU: — ASO: — B2C: — C2C: — _ CAGR: — DTH: — OTT: — EPL: — EPS: — FCF: — GMV: Average Revenue Per User Analogue Switch Offs Business to Consumer Consumer to Consumer Cumulative Annual Growth Rate Direct-to-Home Digital Terrestrial Television English Premier League Earnings per

Slide 51: Thank you
THANK YOU Meloy Horn +27 11 289 3320 +27 82 7727 123 InvestorRelations@naspers.com www.naspers.com
Source: Internet Archive copy of naspers.com
More decks from Naspers Limited Class N
 FY2026 Earnings Presentation60 slides · Jun 29, 2026
 FY2026 Earnings Presentation17 slides · Mar 31, 2026
 H1 2026 Earnings Presentation64 slides · Nov 24, 2025
 H1 FY26 Earnings Presentation17 slides · November 2025
 FY2025 Earnings Presentation51 slides · June 2025
 FY2025 Earnings Presentation17 slides · 2025