MMG Ltd. · HKEX:1208
MMG — FY2020 Earnings Presentation
48 slides from MMG's earnings presentation, Mar 4, 2021
Slide 1: Annual Results
ANNUAL RESULTS 4 March 2021
Slide 2: Disclaimer
DISCLAIMER The information contained in this presentation is intended solely for your personal reference and may not be reproduced, redistributed or passed on, directly or indirectly, to any other person (whether within or outside your organisation/firm) or published, in whole or in part, for any pu
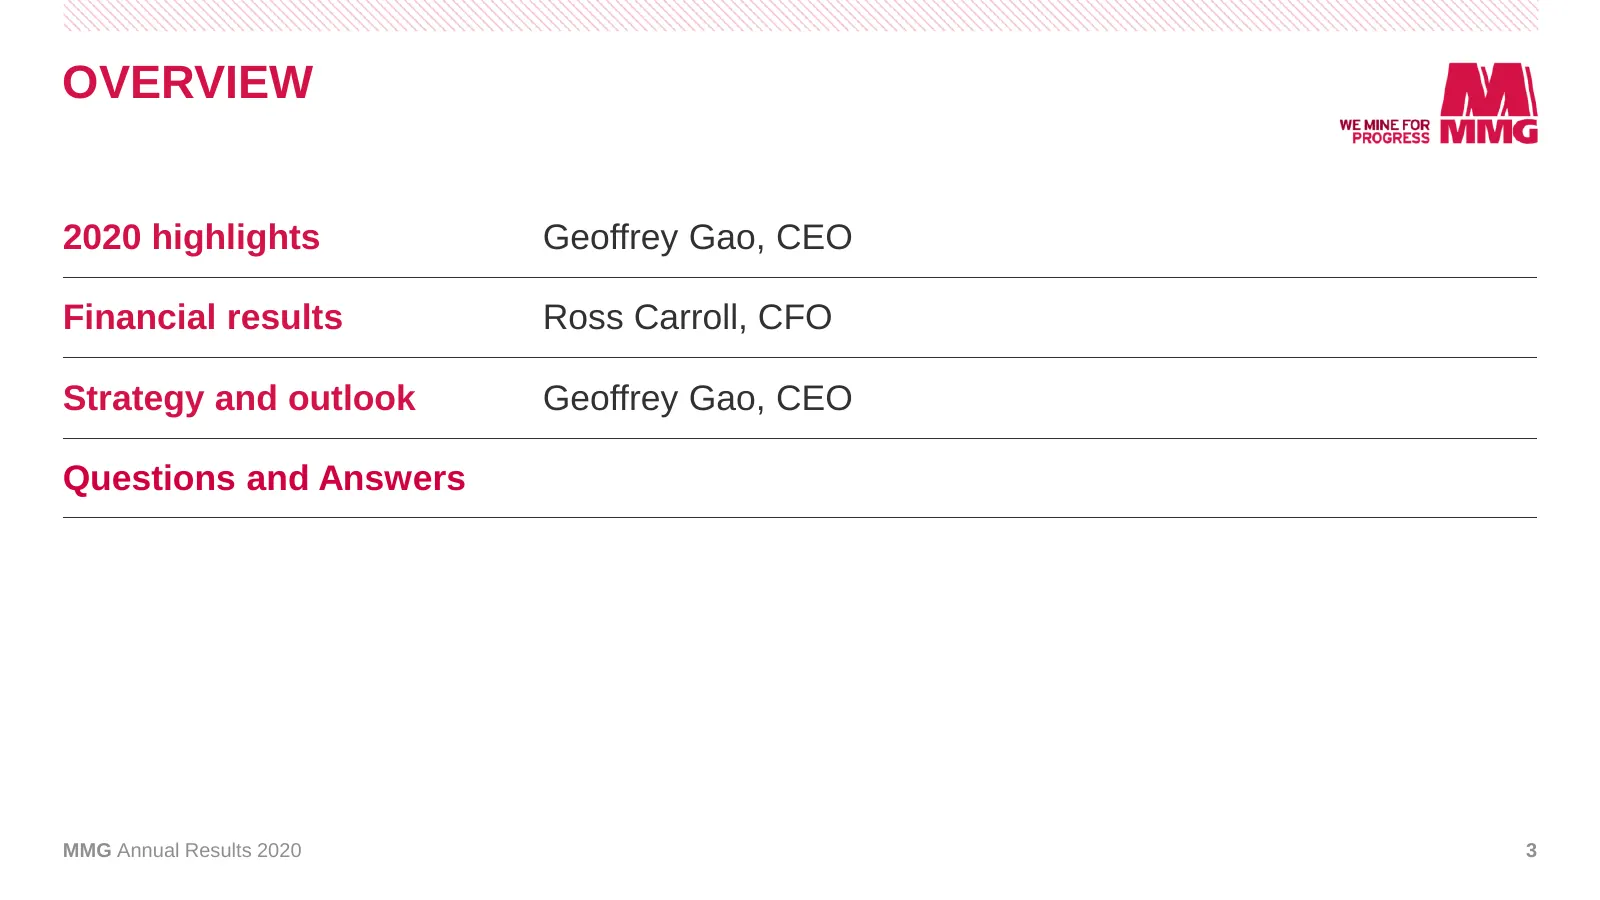
Slide 3: Overview
OVERVIEW 2020 highlights Geoffrey Gao, CEO Financial results Ross Carroll, CFO Strategy and outlook Geoffrey Gao, CEO Questions and Answers MMG Annual Results 2020 3
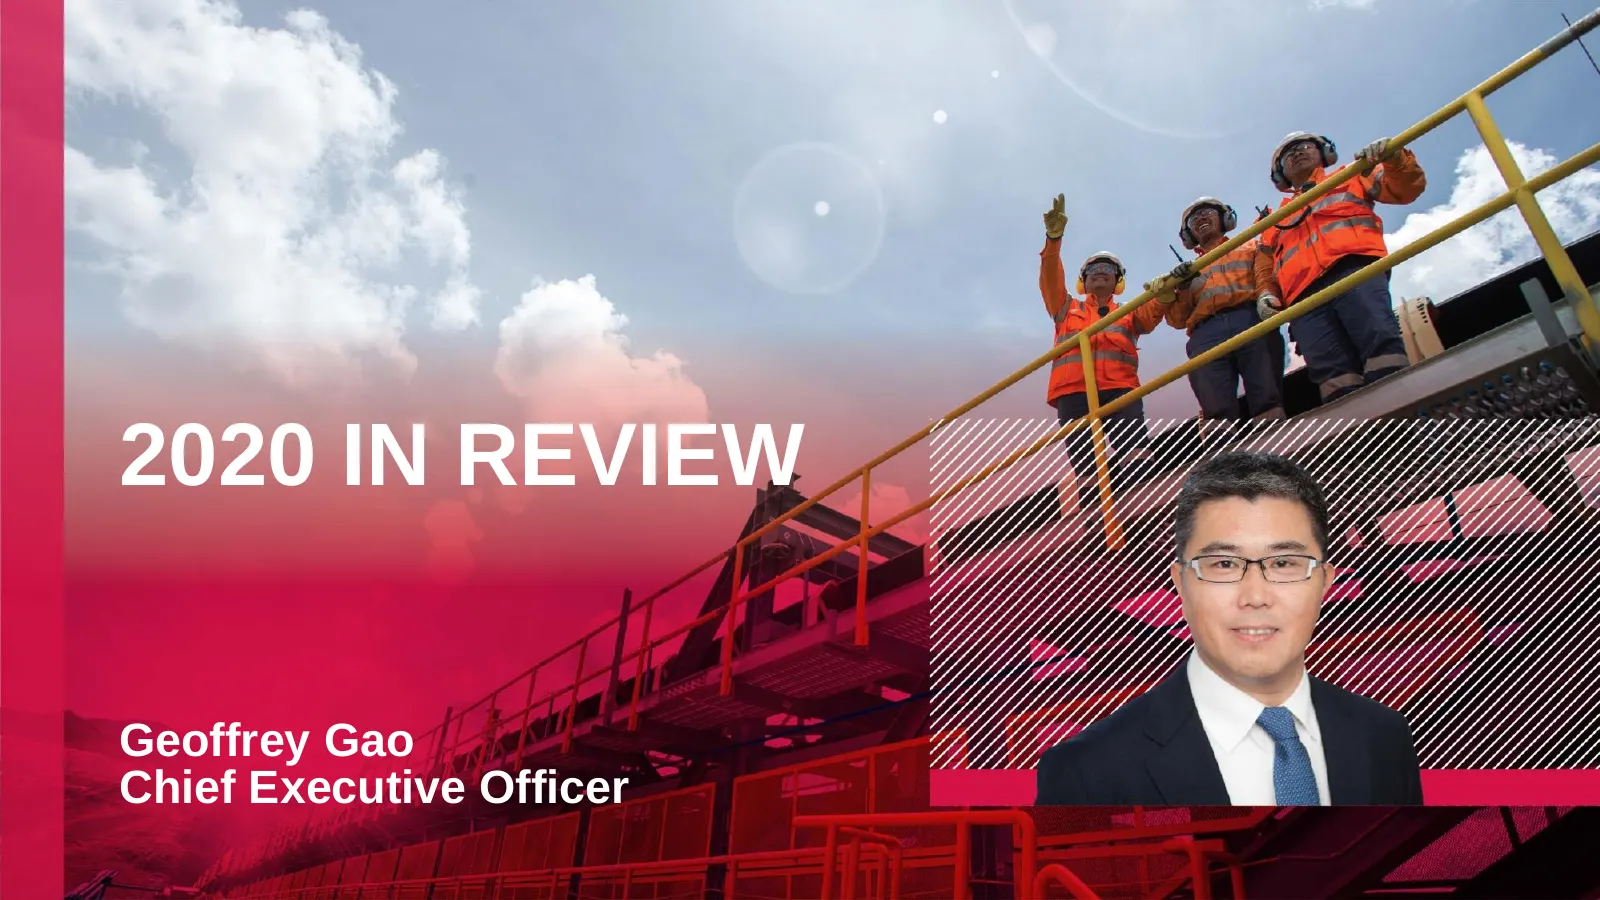
Slide 4: 2020 in Review
2020 IN REVIEW Geoffrey Gao Chief Executive Officer
Slide 5: 2020 Annual Review
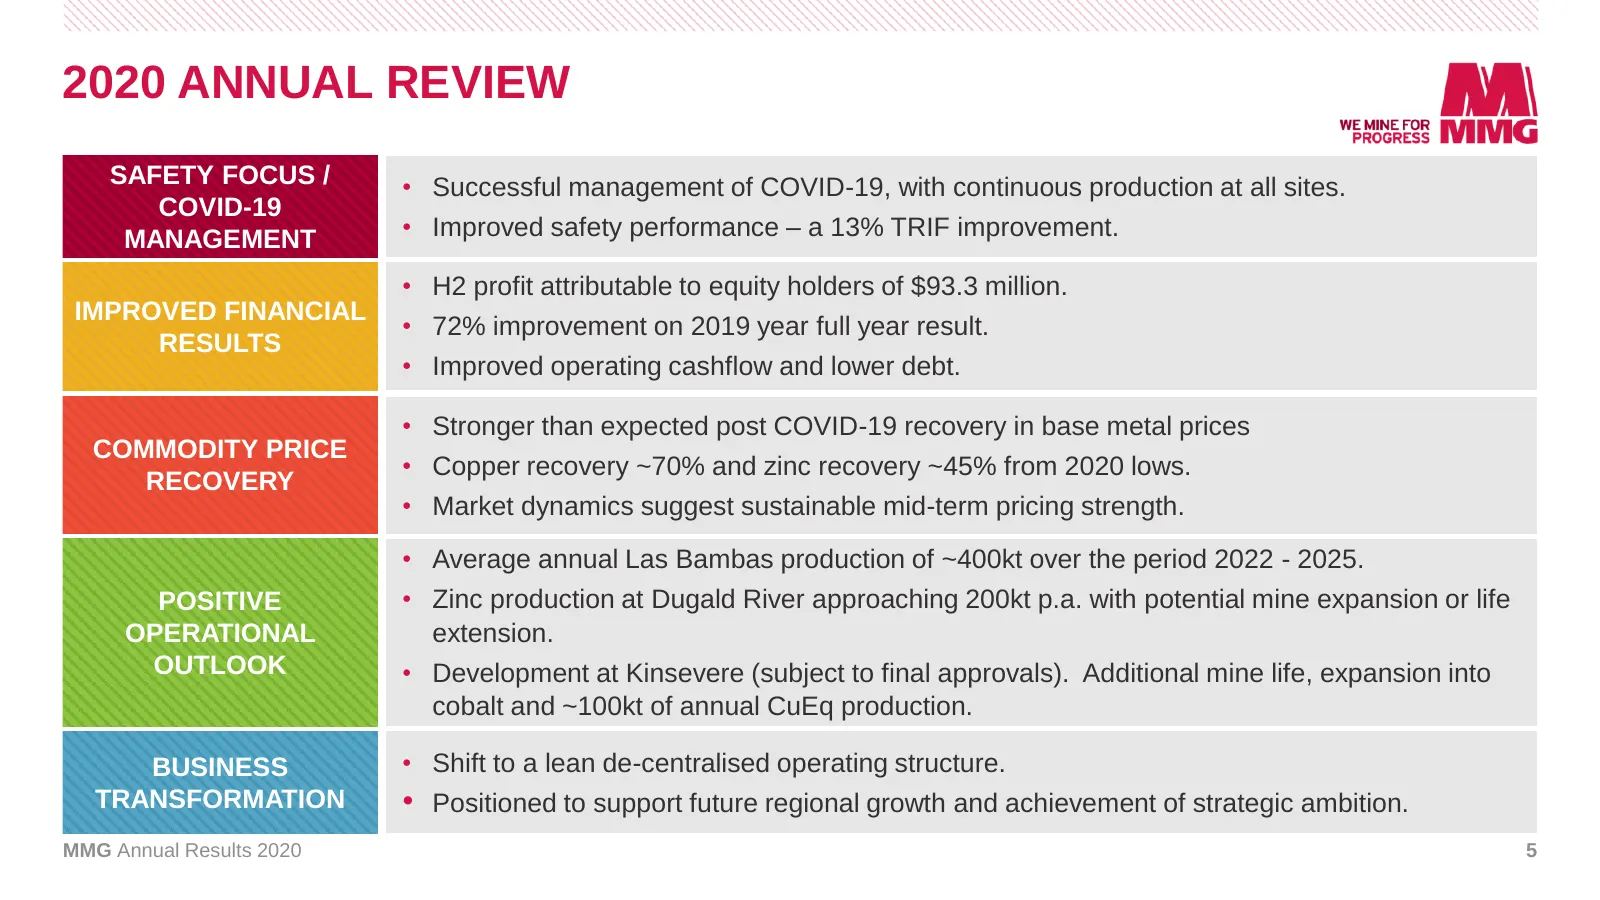
2020 ANNUAL REVIEW SAFETY FOCUS / • Successful management of COVID-19, with continuous production at all sites. COVID-19 MANAGEMENT • Improved safety performance – a 13% TRIF improvement. • H2 profit attributable to equity holders of $93.3 million. IMPROVED FINANCIAL • 72% improvement on 2019 year f
Slide 6: Safety, Environment and Social
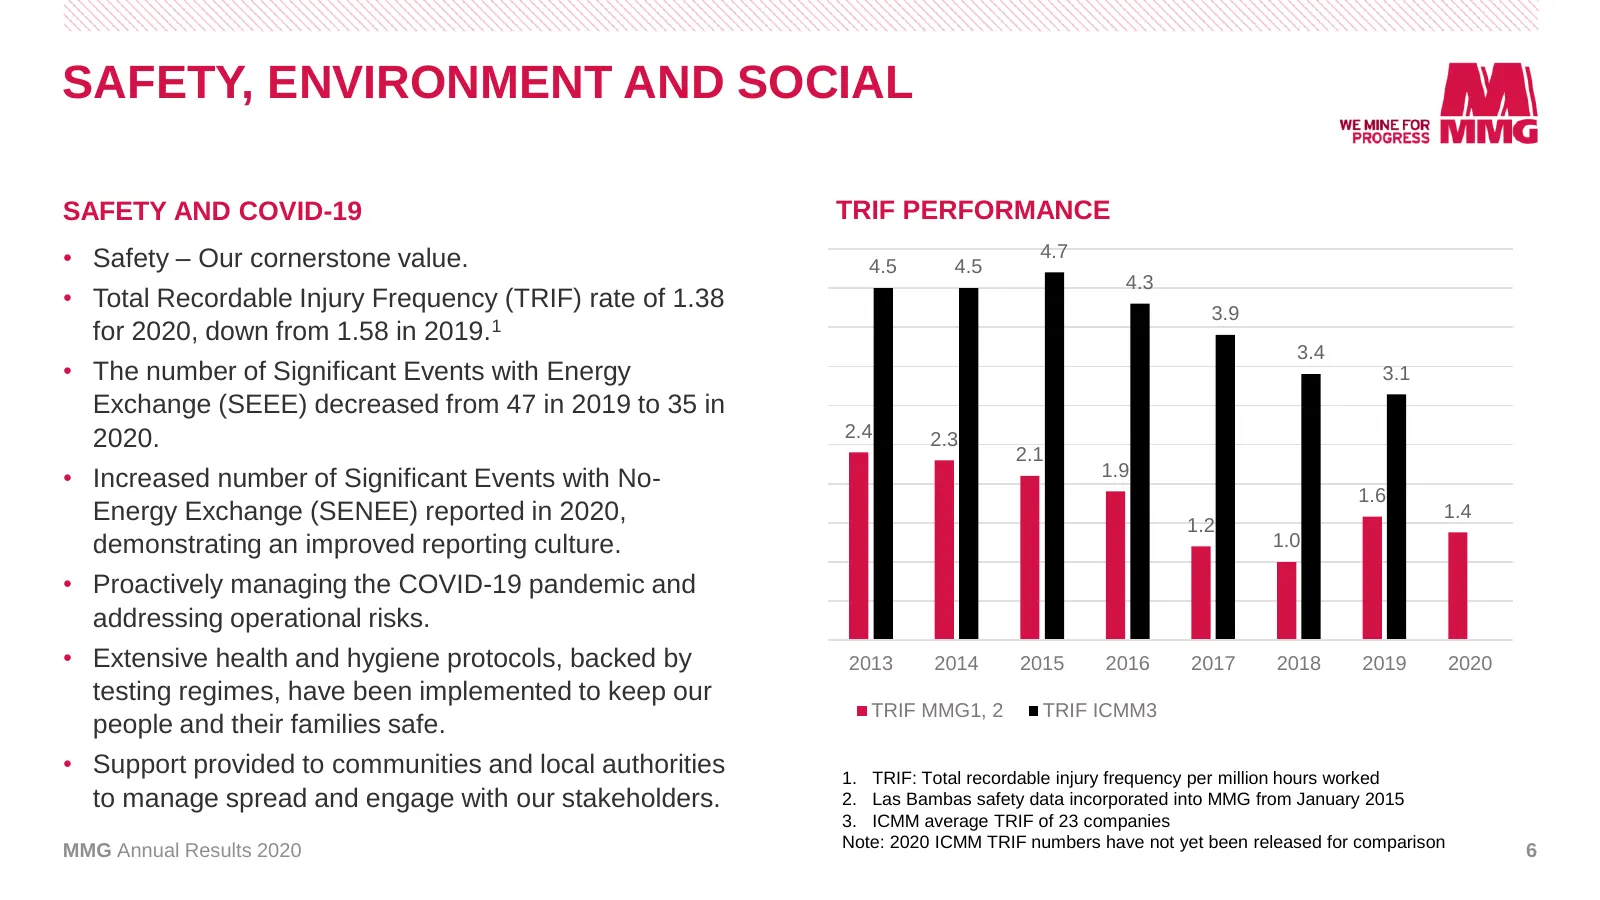
SAFETY, ENVIRONMENT AND SOCIAL SAFETY AND COVID-19 TRIF PERFORMANCE • Safety – Our cornerstone value. 4.5 4.5 4.7 4.3 • Total Recordable Injury Frequency (TRIF) rate of 1.38 3.9 for 2020, down from 1.58 in 2019.1 3.4 • The number of Significant Events with Energy 3.1 Exchange (SEEE) decreased from 4
Slide 7: Safety, Environment and Social
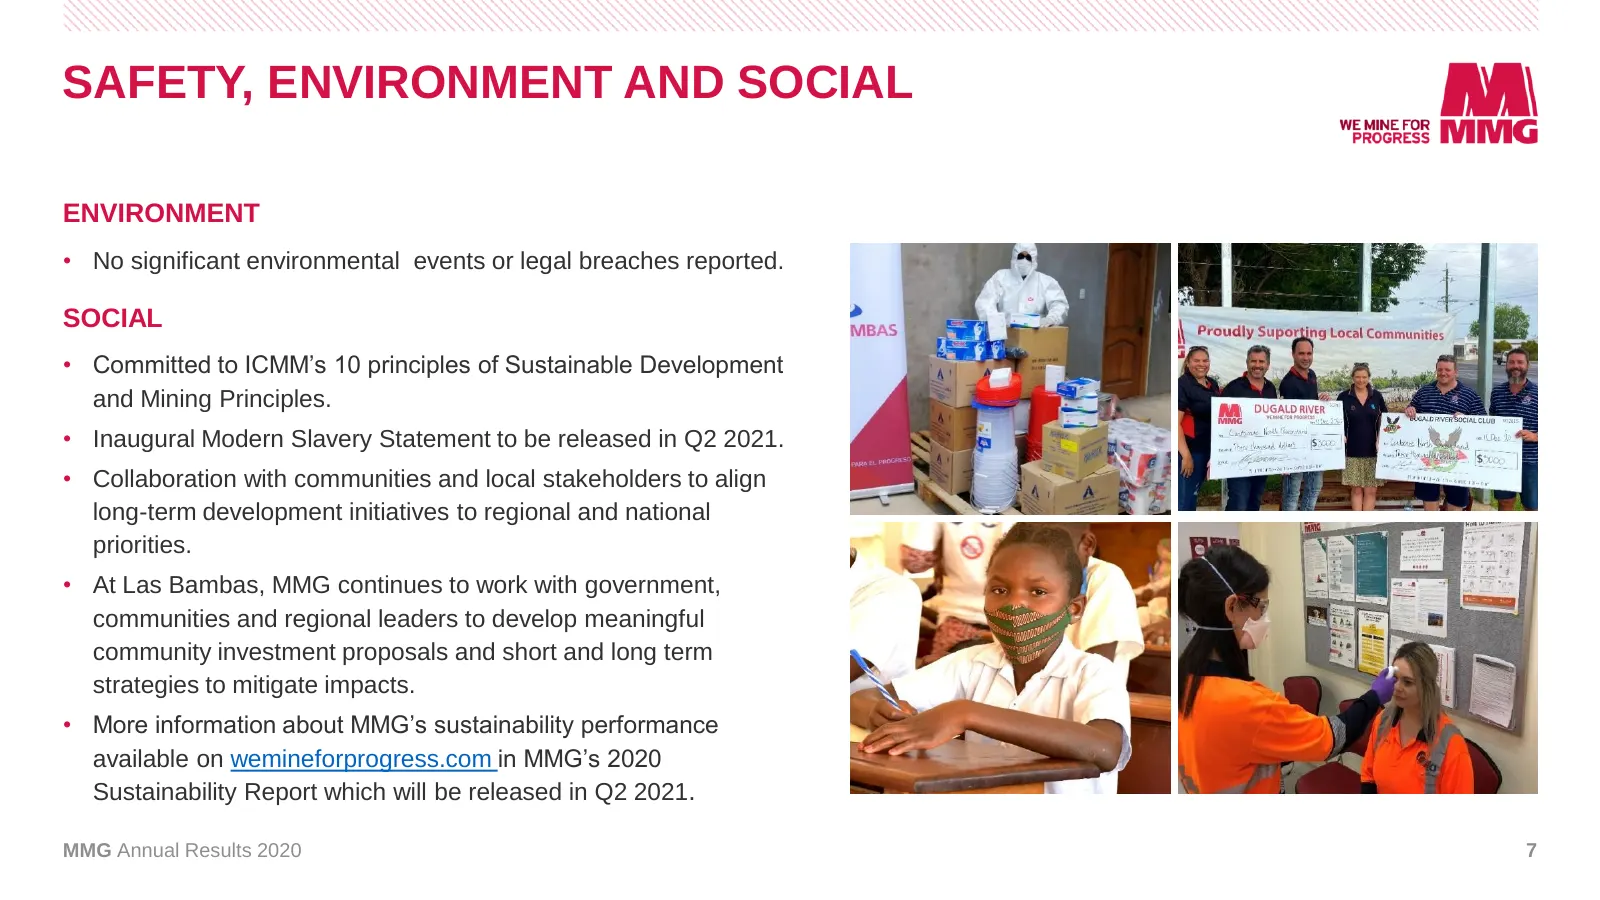
SAFETY, ENVIRONMENT AND SOCIAL ENVIRONMENT • No significant environmental events or legal breaches reported. SOCIAL • Committed to ICMM’s 10 principles of Sustainable Development and Mining Principles. • Inaugural Modern Slavery Statement to be released in Q2 2021. • Collaboration with communities a
Slide 8: Peru – Political, Community and Social Update
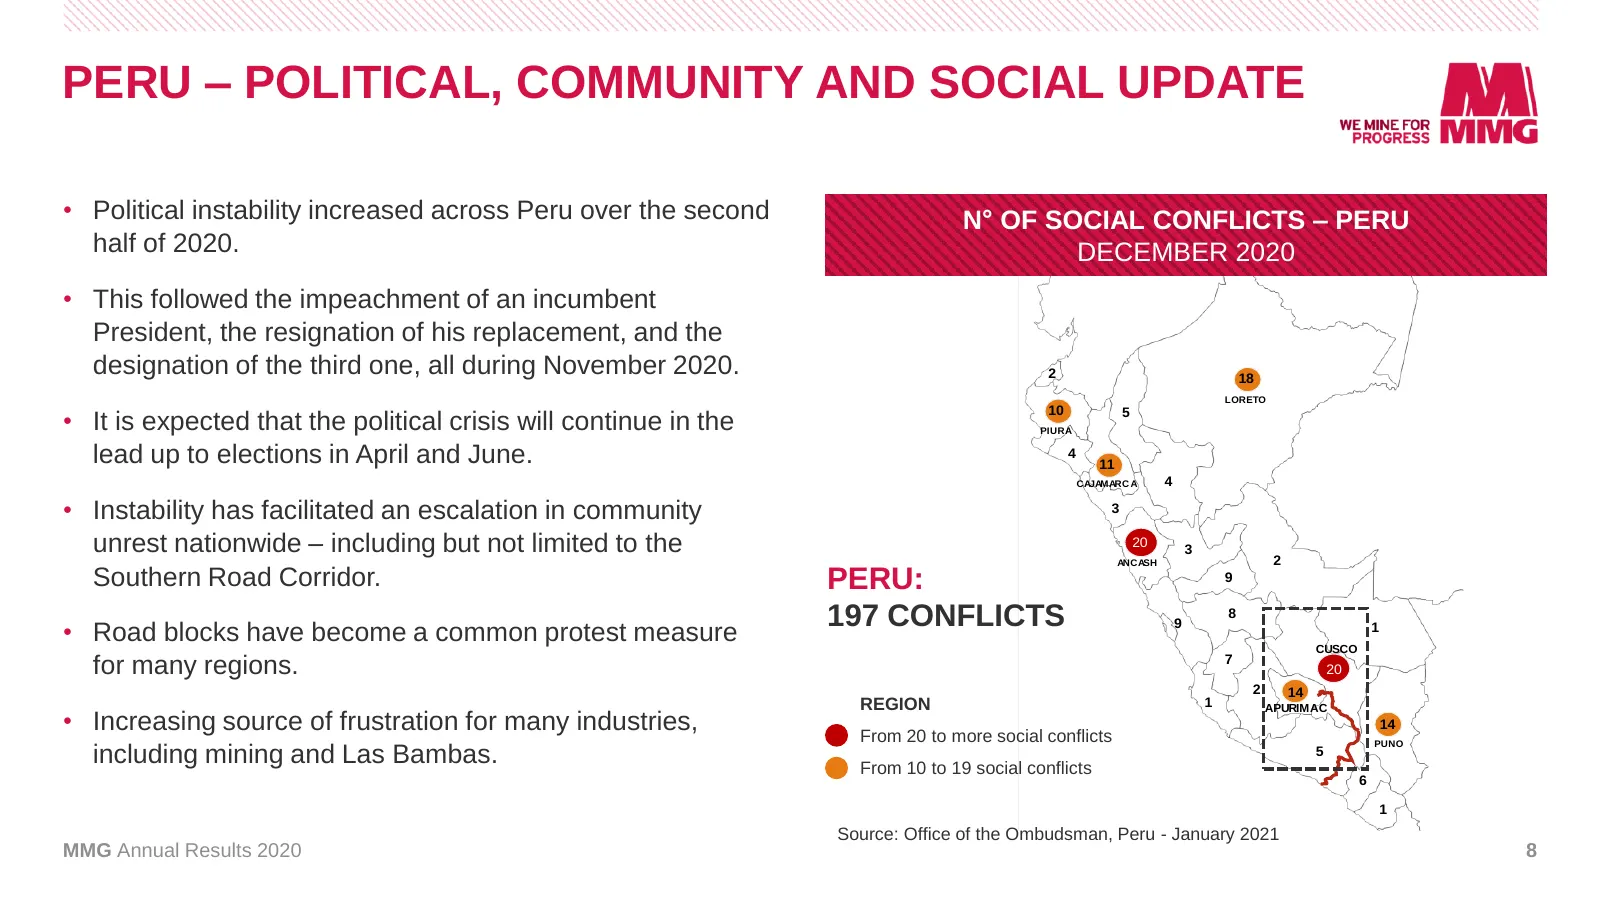
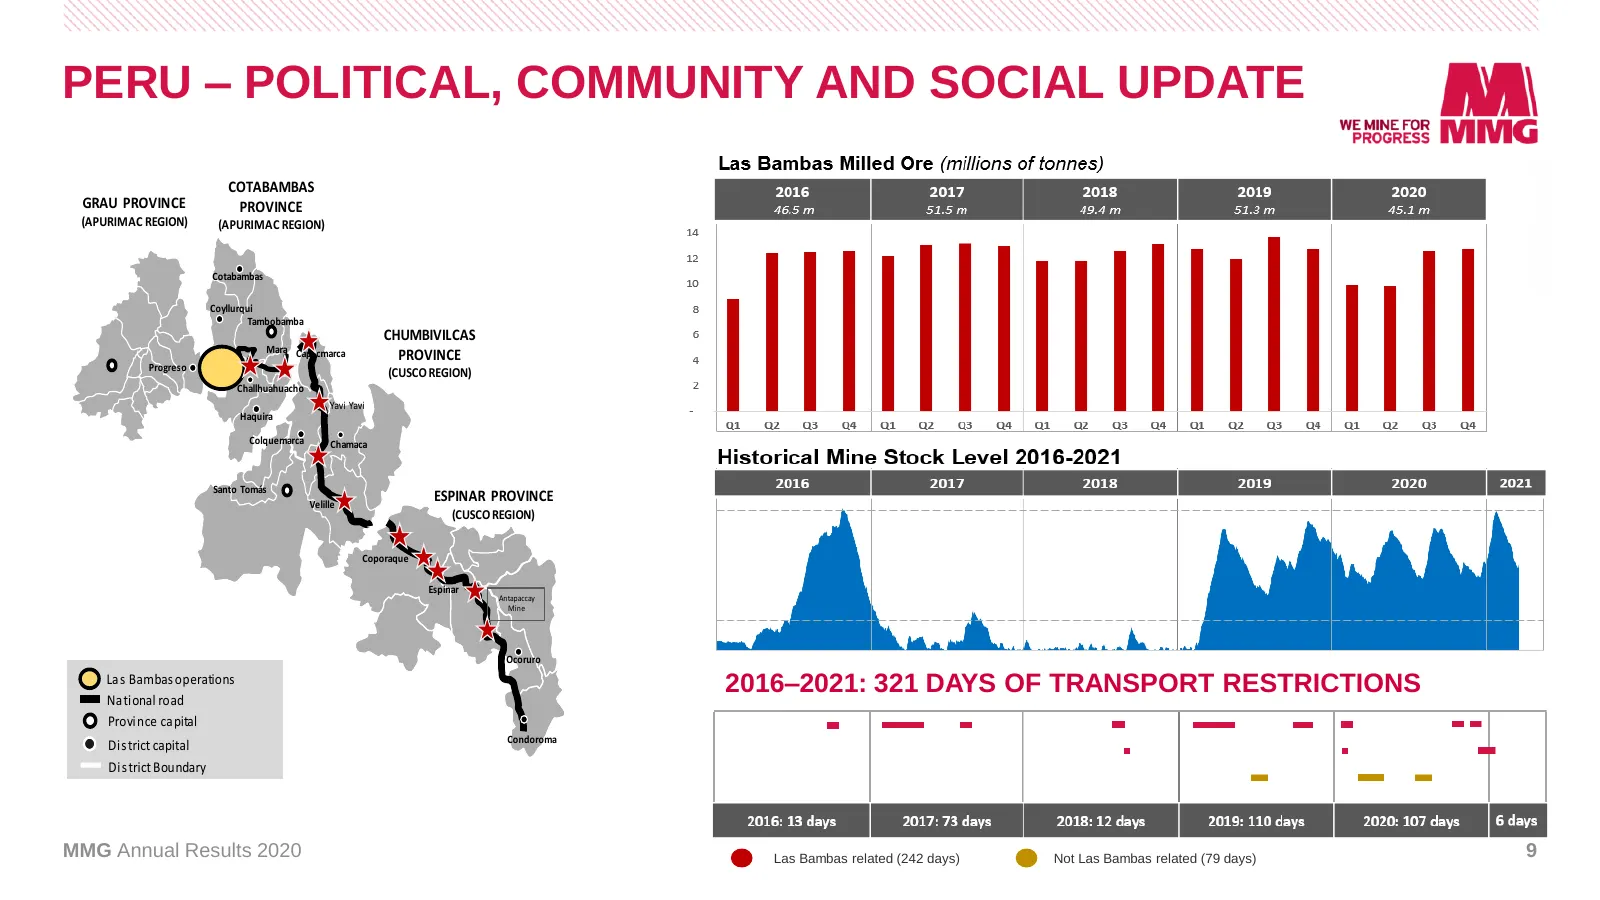
PERU – POLITICAL, COMMUNITY AND SOCIAL UPDATE • Political instability increased across Peru over the second N° OF SOCIAL CONFLICTS – PERU half of 2020. DECEMBER 2020 • This followed the impeachment of an incumbent President, the resignation of his replacement, and the designation of the third one, a
Slide 9: Peru Political, Community and Social Update: Heavy Haul Road Map
–Non-Asphalted PERUHEAVY HAUL ROAD MAP POLITICAL, Road COMMUNITY AND SOCIAL UPDATE COTABAMBAS GRAU PROVINCE PROVINCE (APURIMAC REGION) (APURIMAC REGION) Cotabambas Coyllurqui Tambobamba CHUMBIVILCAS Mara Capacmarca PROVINCE Progreso (CUSCO REGION) Challhuahuacho Yavi Yavi Haquira Colquemarca Chamaca
Slide 10: MMG's Portfolio is Leveraged to Megatrends
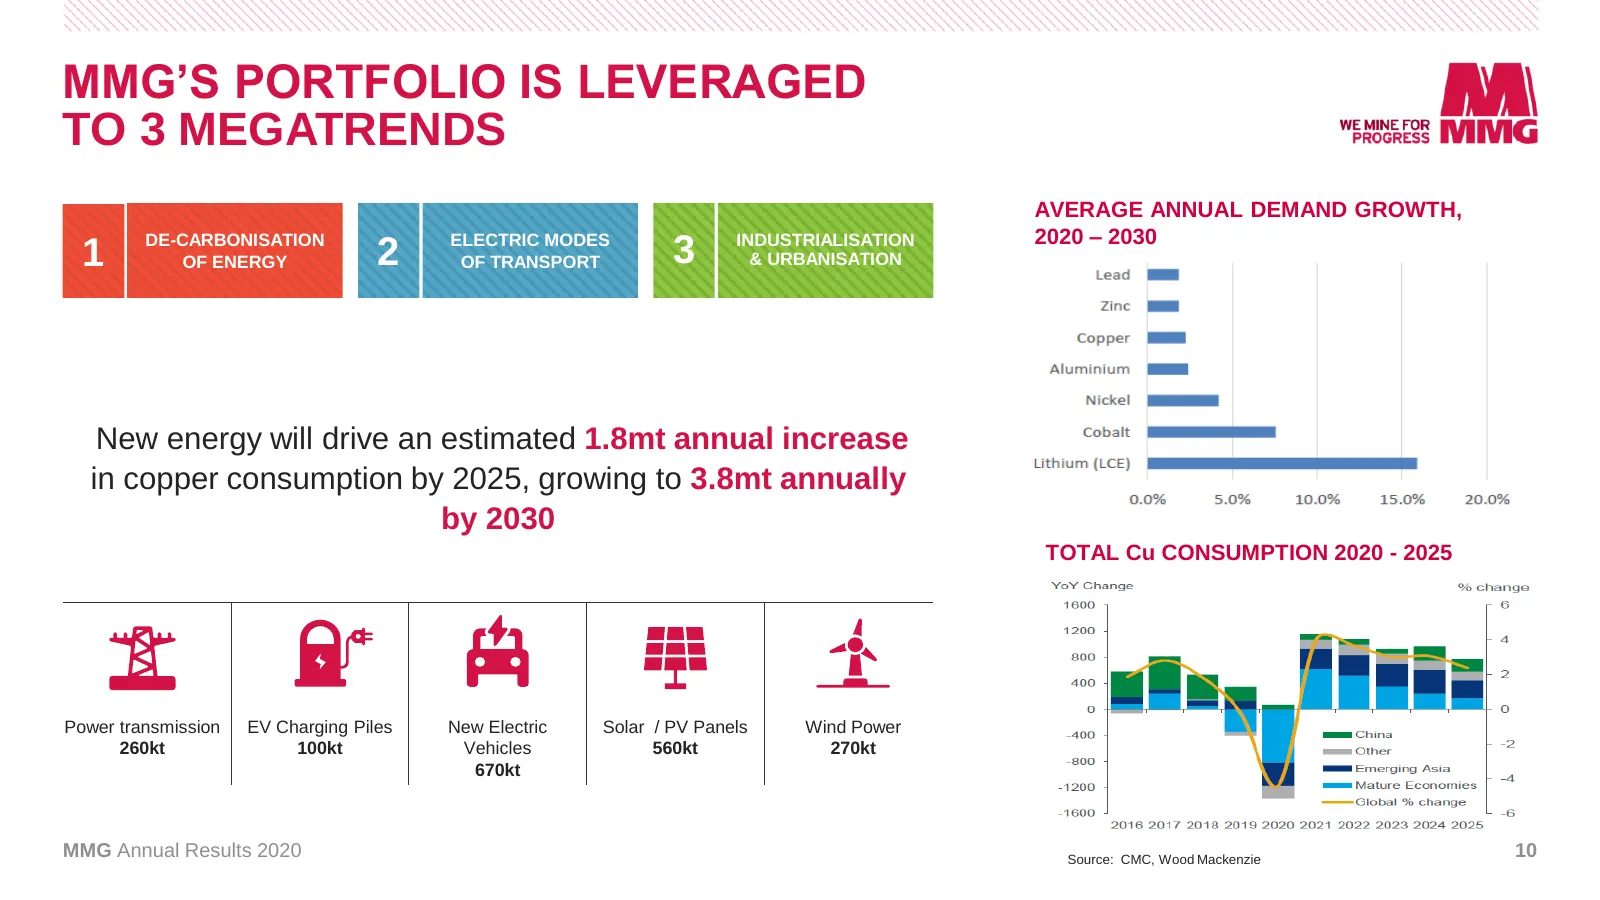
MMG’S PORTFOLIO IS LEVERAGED TO 3 MEGATRENDS AVERAGE ANNUAL DEMAND GROWTH, DE-CARBONISATION ELECTRIC MODES INDUSTRIALISATION 2020 – 2030 1 OF ENERGY 2 OF TRANSPORT 3 & URBANISATION New energy will drive an estimated 1.8mt annual increase in copper consumption by 2025, growing to 3.8mt annually by 20
Slide 11: Strong Underlying Commodity Fundamentals
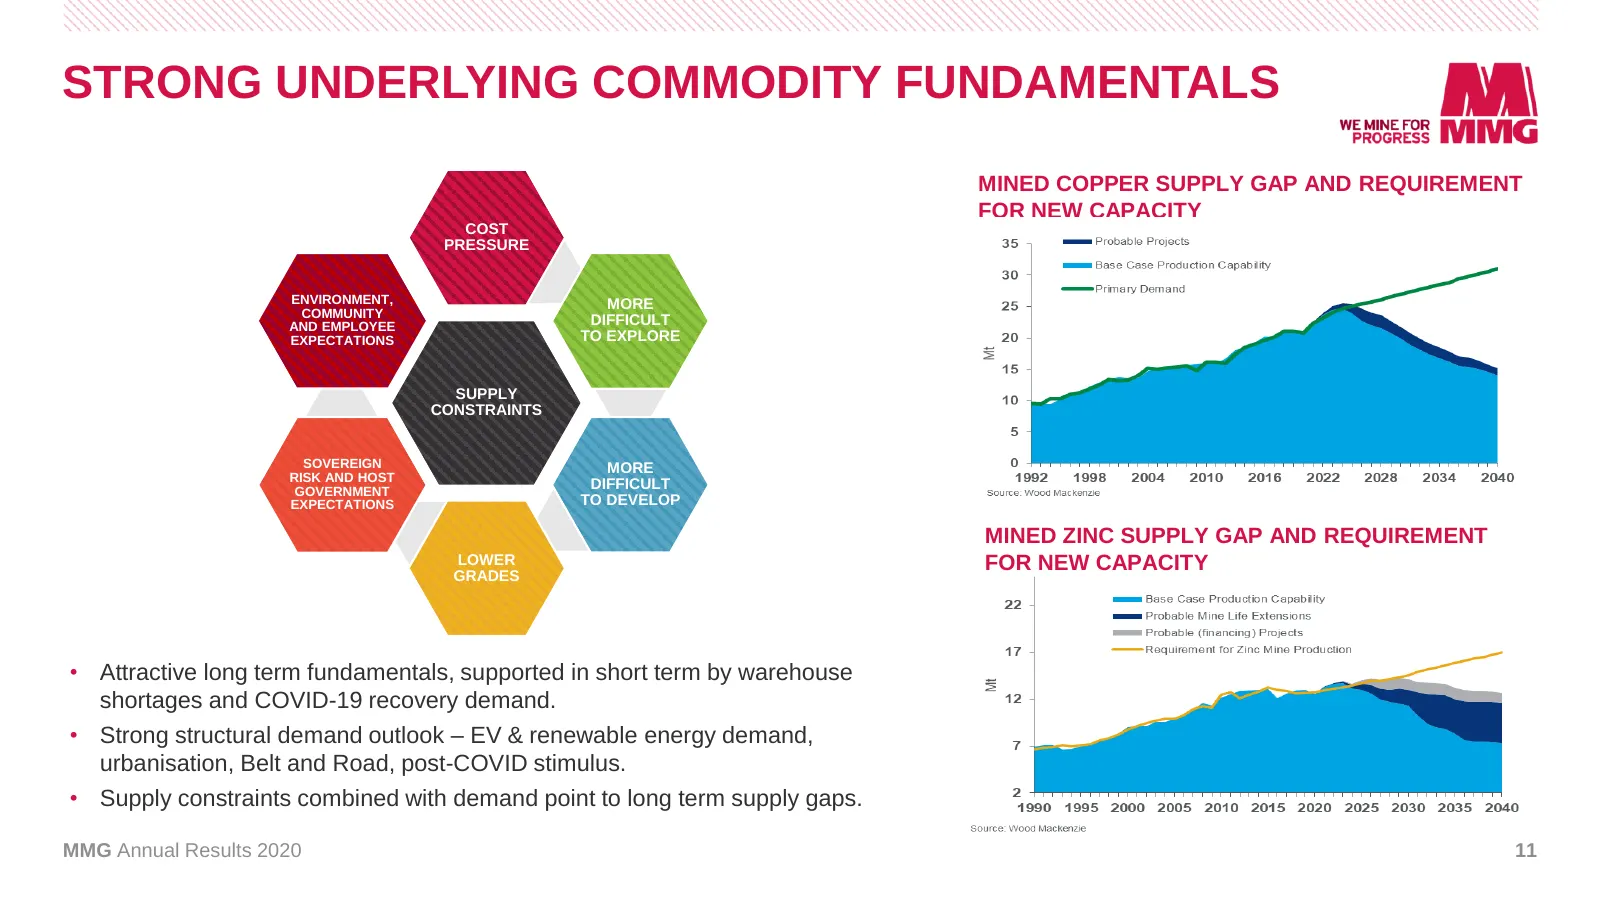
STRONG UNDERLYING COMMODITY FUNDAMENTALS MINED COPPER SUPPLY GAP AND REQUIREMENT FOR NEW CAPACITY COST PRESSURE ENVIRONMENT, MORE COMMUNITY AND EMPLOYEE DIFFICULT EXPECTATIONS TO EXPLORE SUPPLY CONSTRAINTS SOVEREIGN MORE RISK AND HOST GOVERNMENT DIFFICULT EXPECTATIONS TO DEVELOP MINED ZINC SUPPLY GA
Slide 12: Business Transformation
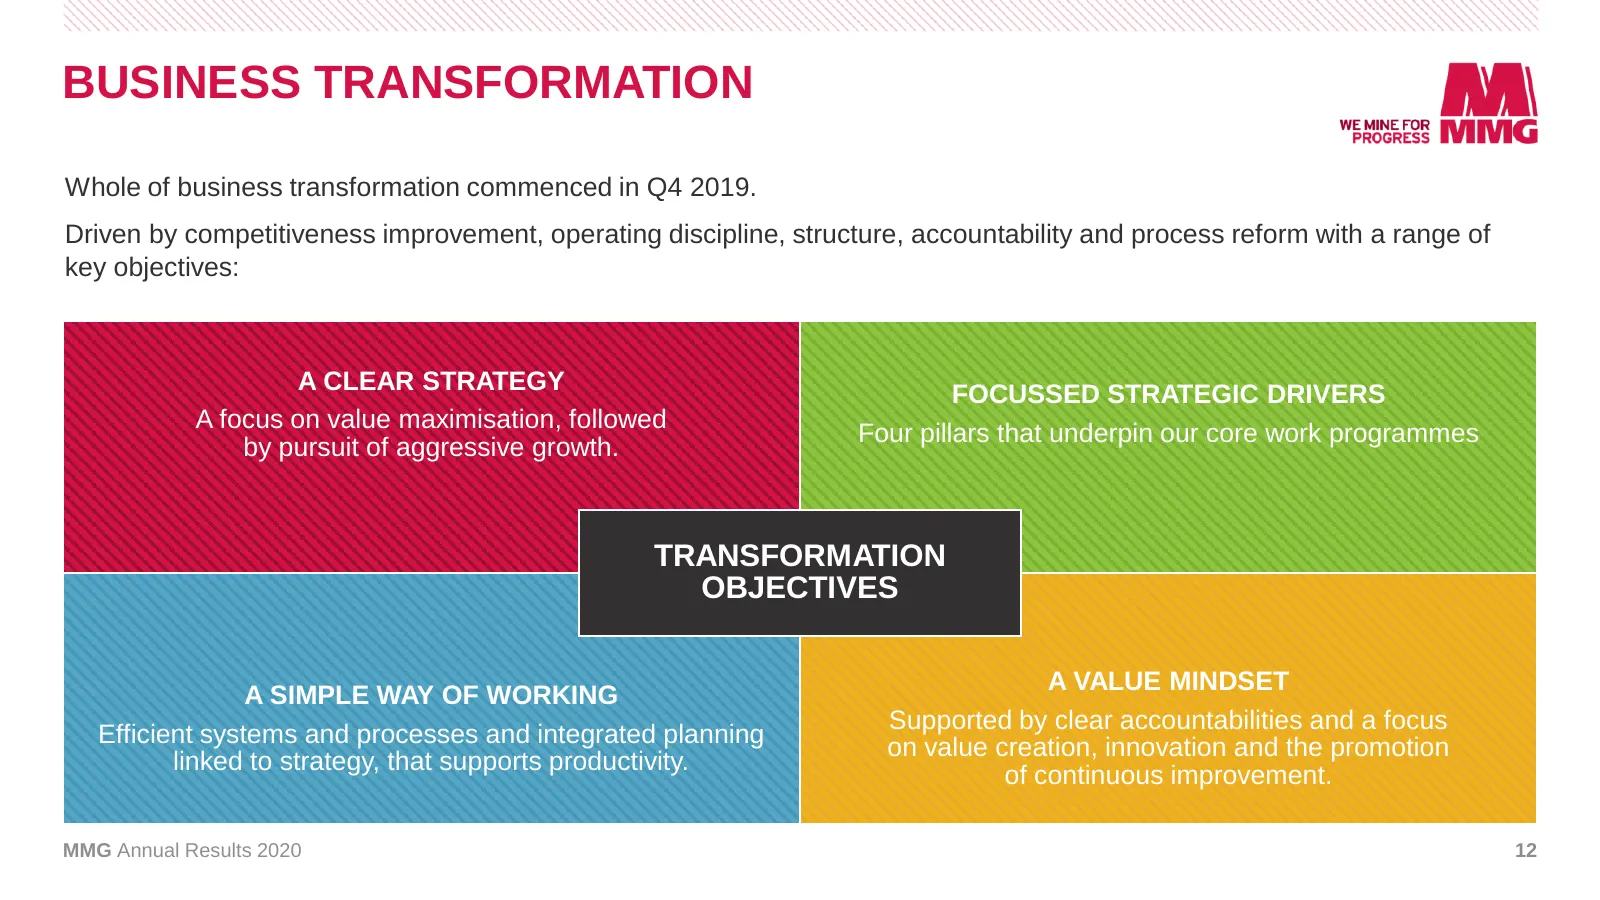
BUSINESS TRANSFORMATION Whole of business transformation commenced in Q4 2019. Driven by competitiveness improvement, operating discipline, structure, accountability and process reform with a range of key objectives: A CLEAR STRATEGY FOCUSSED STRATEGIC DRIVERS A focus on value maximisation, followed
Slide 13: Financial Results
FINANCIAL RESULTS Ross Carroll Chief Financial Officer
Slide 14: Financial Performance
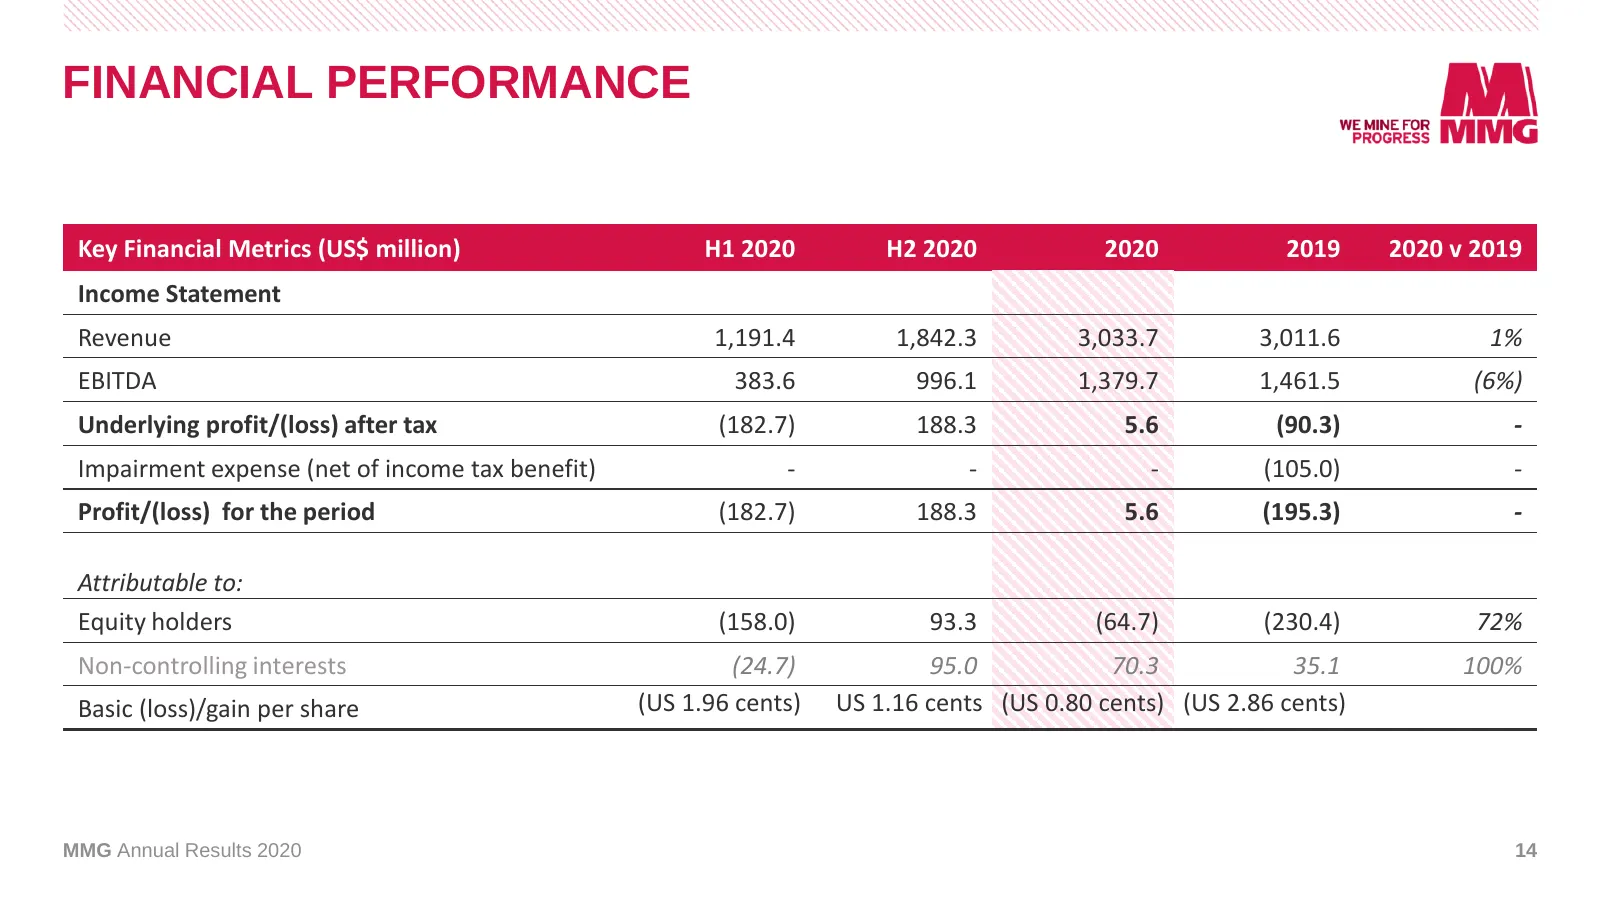
FINANCIAL PERFORMANCE Key Financial Metrics (US$ million) H1 2020 H2 2020 2020 2019 2020 v 2019 Income Statement Revenue 1,191.4 1,842.3 3,033.7 3,011.6 1% EBITDA 383.6 996.1 1,379.7 1,461.5 (6%) Underlying profit/(loss) after tax (182.7) 188.3 5.6 (90.3) - Impairment expense (net of income tax bene
Slide 15: Year on Year NPAT Variance
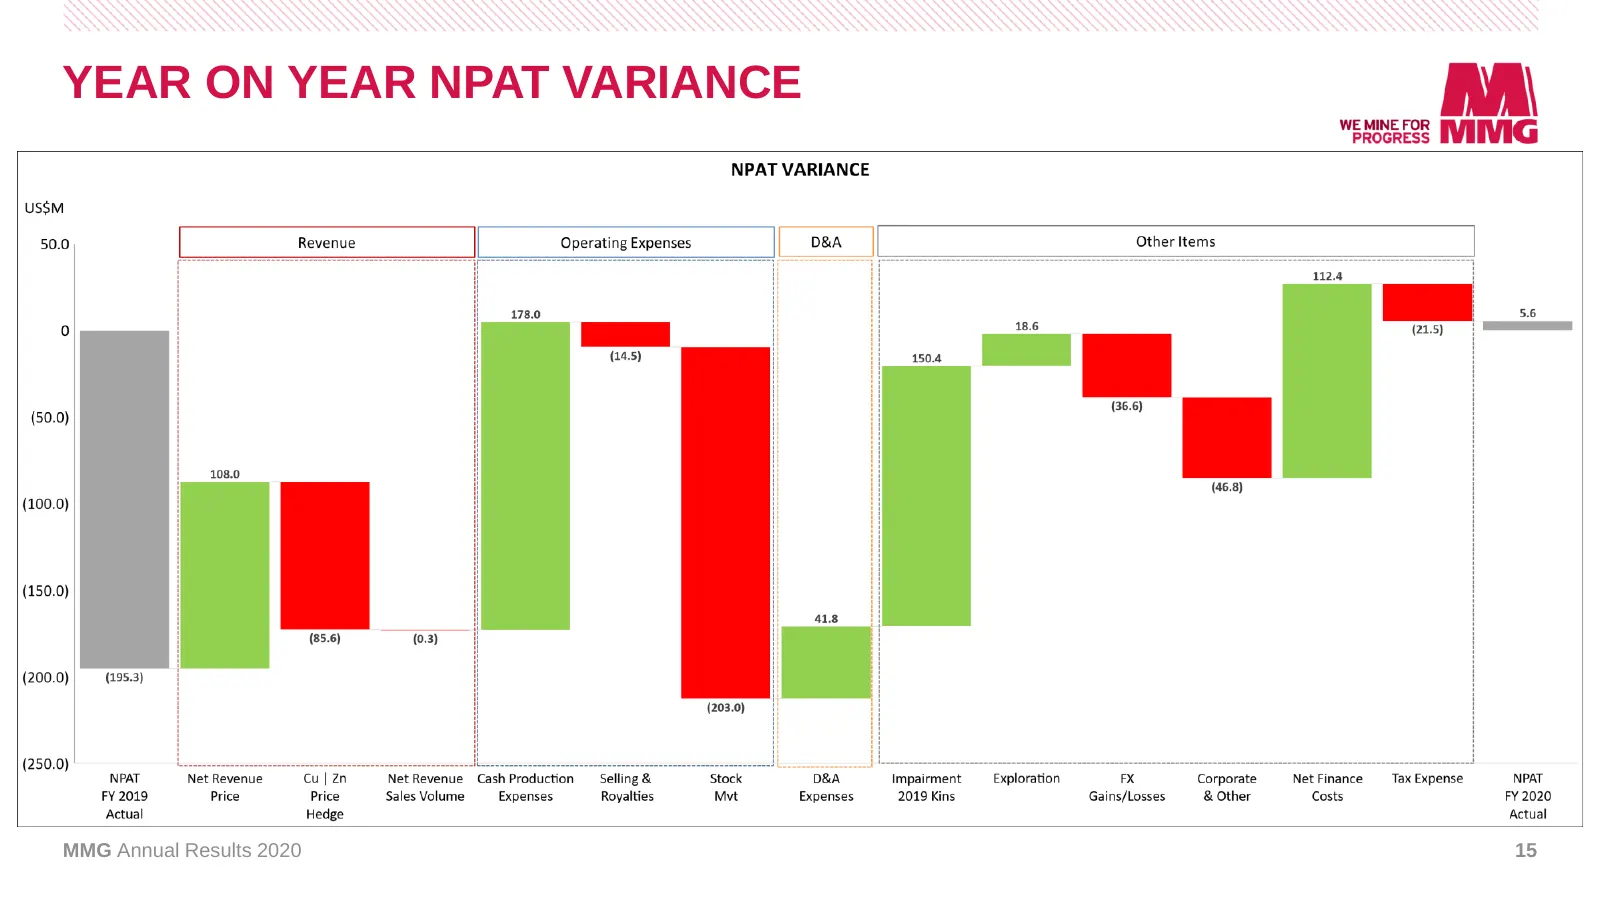
YEAR ON YEAR NPAT VARIANCE MMG Annual Results 2020 15
Slide 16: Commodity Price Sensitivity
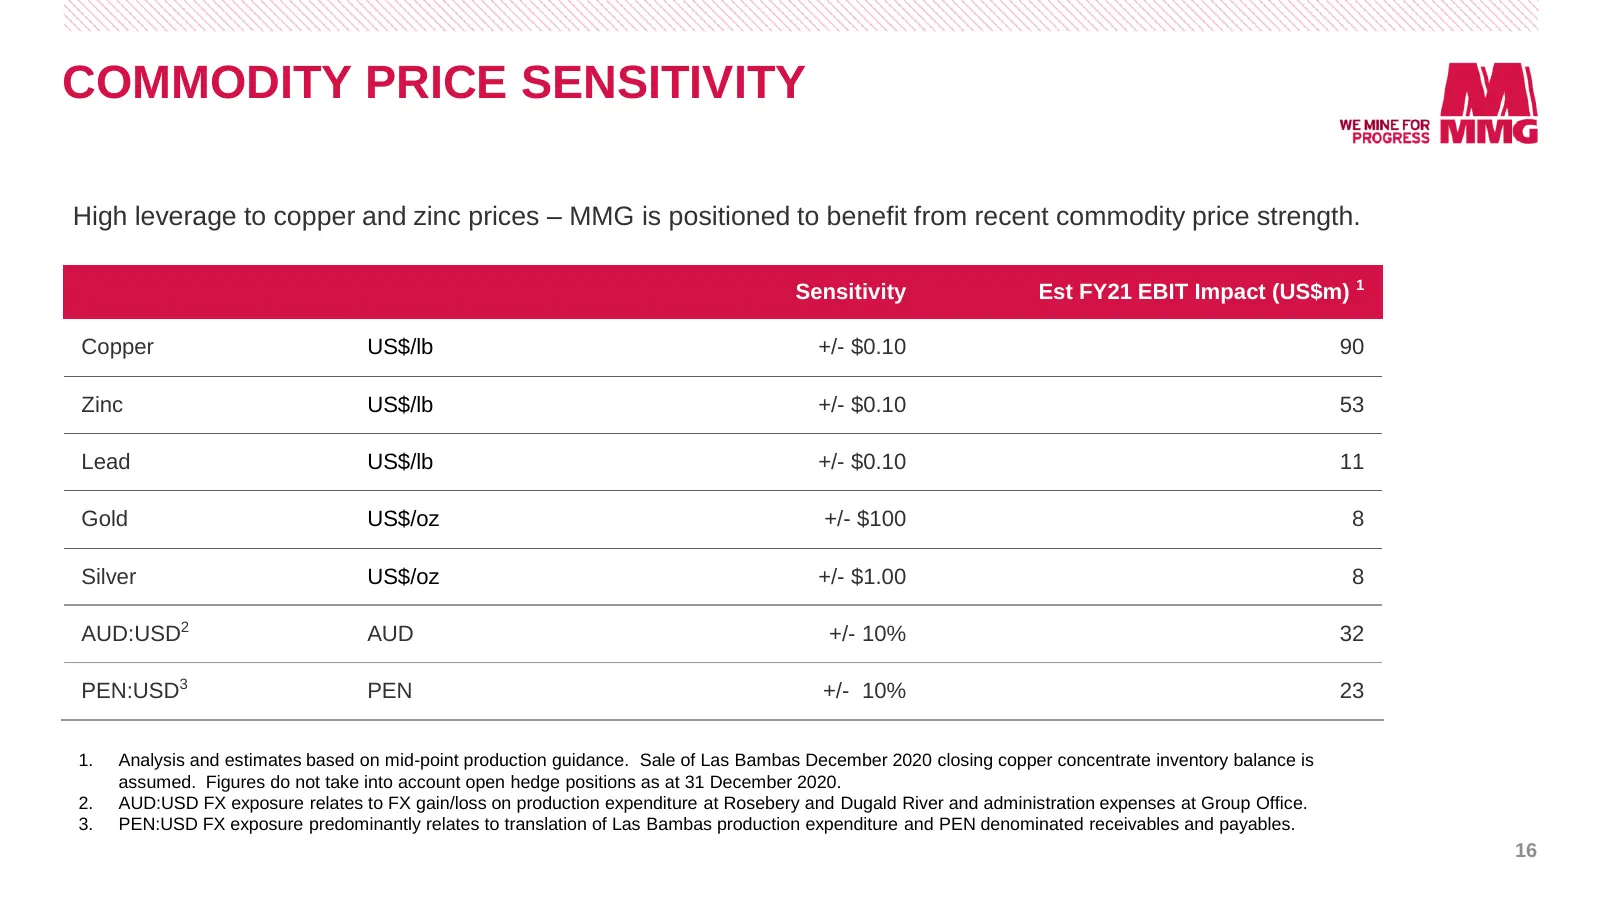
COMMODITY PRICE SENSITIVITY High leverage to copper and zinc prices – MMG is positioned to benefit from recent commodity price strength. Sensitivity Est FY21 EBIT Impact (US$m) 1 Copper US$/lb +/- $0.10 90 Zinc US$/lb +/- $0.10 53 Lead US$/lb +/- $0.10 11 Gold US$/oz +/- $100 8 Silver US$/oz +/- $1.
Slide 17: Commodity Price Sensitivity Continued
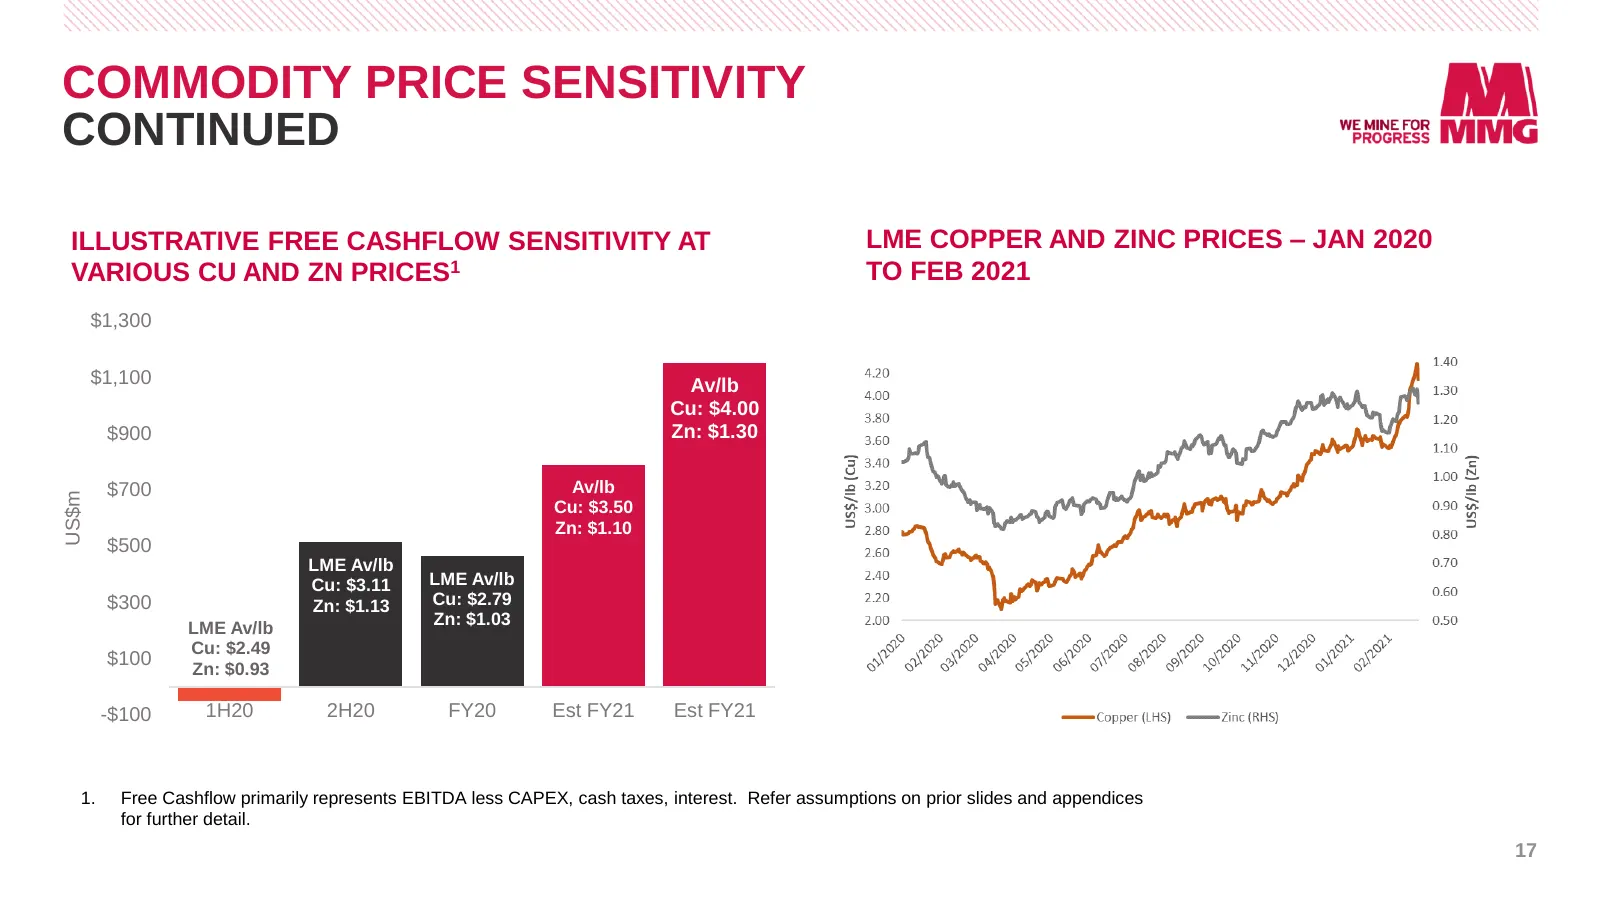
COMMODITY PRICE SENSITIVITY CONTINUED ILLUSTRATIVE FREE CASHFLOW SENSITIVITY AT LME COPPER AND ZINC PRICES – JAN 2020 VARIOUS CU AND ZN PRICES1 TO FEB 2021 $1,300 $1,100 Av/lb Cu: $4.00 $900 Zn: $1.30 $700 Av/lb US$m Cu: $3.50 Zn: $1.10 $500 LME Av/lb Cu: $3.11 LME Av/lb $300 Zn: $1.13 Cu: $2.79 LME
Slide 18: Capital Expenditure
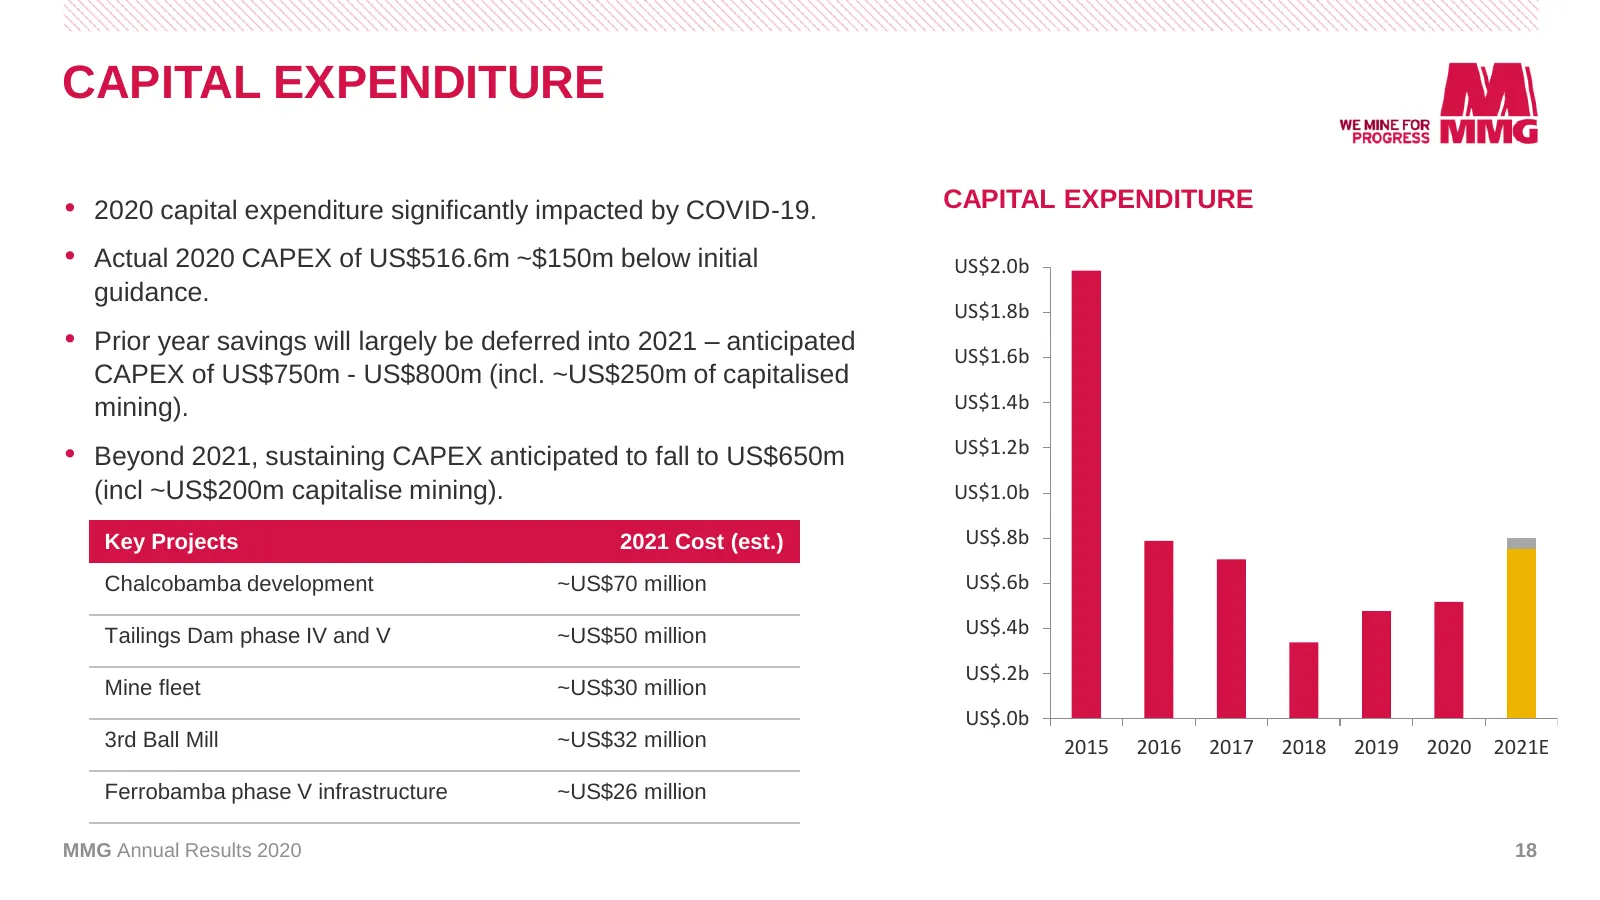
CAPITAL EXPENDITURE • 2020 capital expenditure significantly impacted by COVID-19. CAPITAL EXPENDITURE • Actual 2020 CAPEX of US$516.6m ~$150m below initial US$2.0b guidance. US$1.8b • Prior year savings will largely be deferred into 2021 – anticipated US$1.6b CAPEX of US$750m - US$800m (incl. ~US$2
Slide 19: Debt Reduced by $453 Million – Strong Liquidity Position
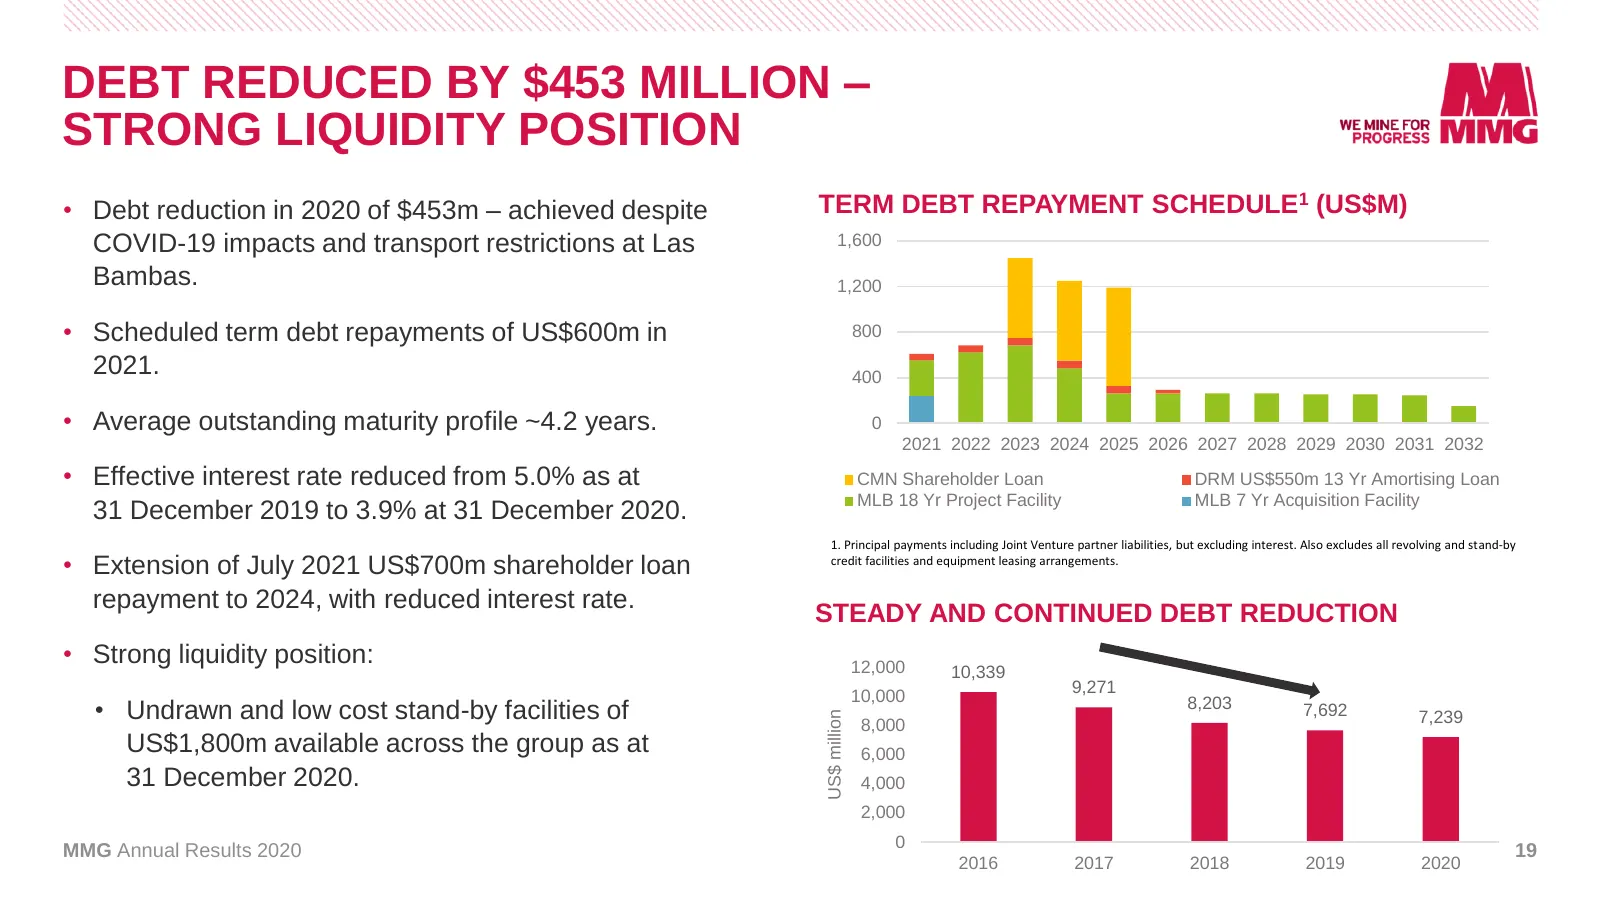
DEBT REDUCED BY $453 MILLION – STRONG LIQUIDITY POSITION • Debt reduction in 2020 of $453m – achieved despite TERM DEBT REPAYMENT SCHEDULE1 (US$M) COVID-19 impacts and transport restrictions at Las 1,600 Bambas. 1,200 • Scheduled term debt repayments of US$600m in 800 2021. 400 • Average outstanding
Slide 20: Las Bambas Overview 2020
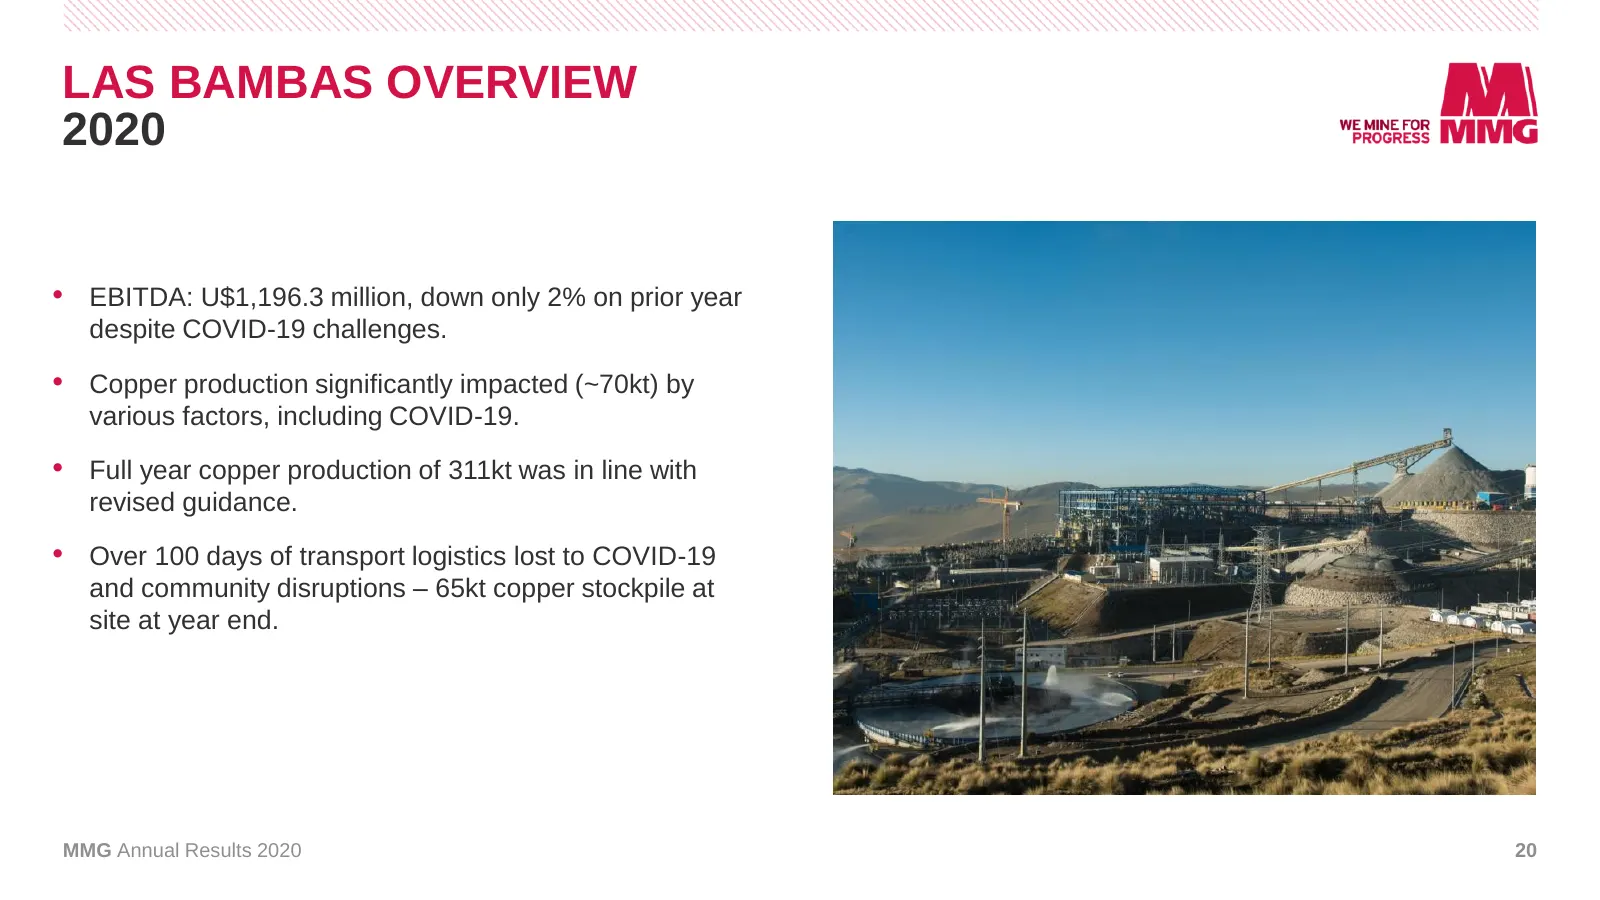
LAS BAMBAS OVERVIEW 2020 • EBITDA: U$1,196.3 million, down only 2% on prior year despite COVID-19 challenges. • Copper production significantly impacted (~70kt) by various factors, including COVID-19. • Full year copper production of 311kt was in line with revised guidance. • Over 100 days of transp
Slide 21: Las Bambas Overview 2021 Focus
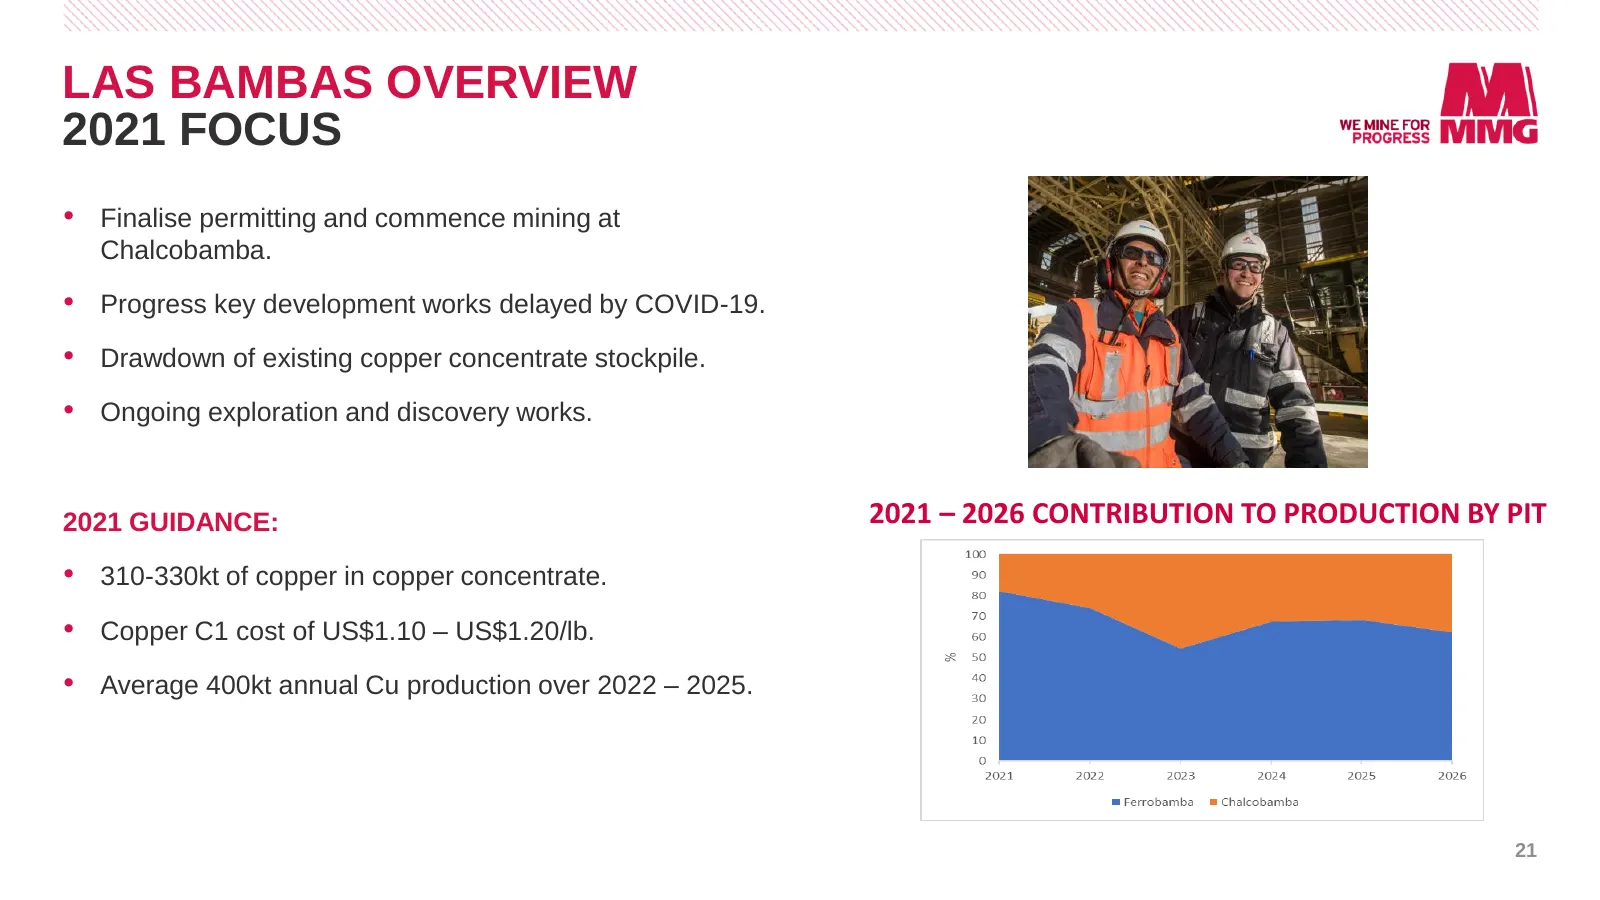
LAS BAMBAS OVERVIEW 2021 FOCUS • Finalise permitting and commence mining at Chalcobamba. • Progress key development works delayed by COVID-19. • Drawdown of existing copper concentrate stockpile. • Ongoing exploration and discovery works. 2021 GUIDANCE: 2021 – 2026 CONTRIBUTION TO PRODUCTION BY PIT
Slide 22: Kinsevere Overview 2020
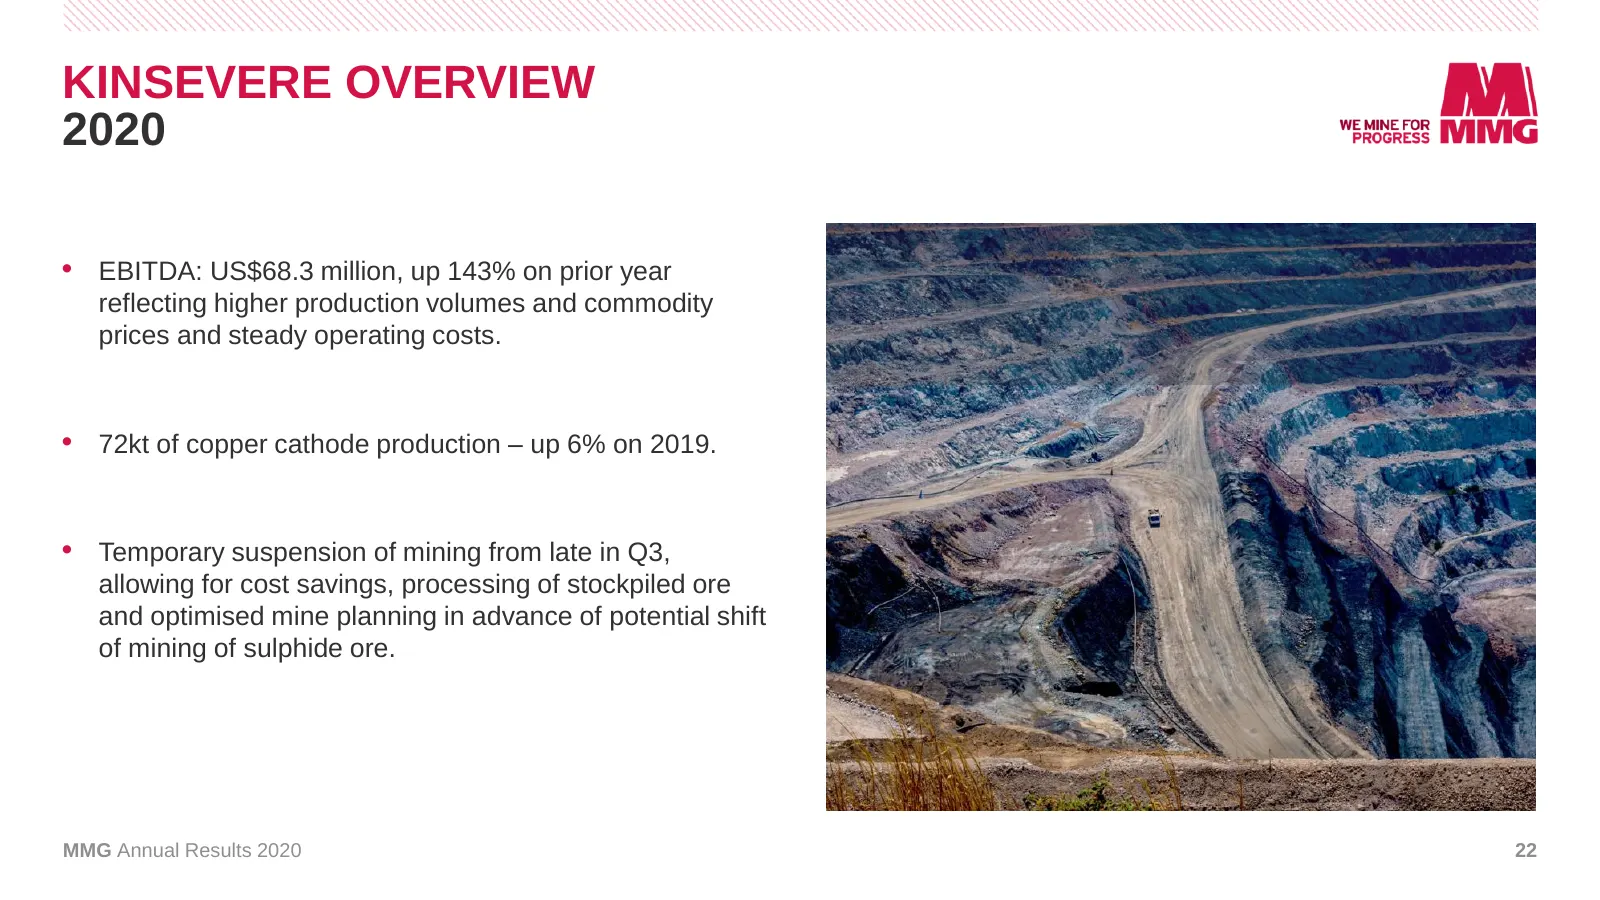
KINSEVERE OVERVIEW 2020 • EBITDA: US$68.3 million, up 143% on prior year reflecting higher production volumes and commodity prices and steady operating costs. • 72kt of copper cathode production – up 6% on 2019. • Temporary suspension of mining from late in Q3, allowing for cost savings, processing
Slide 23: Kinsevere Overview 2021 Focus
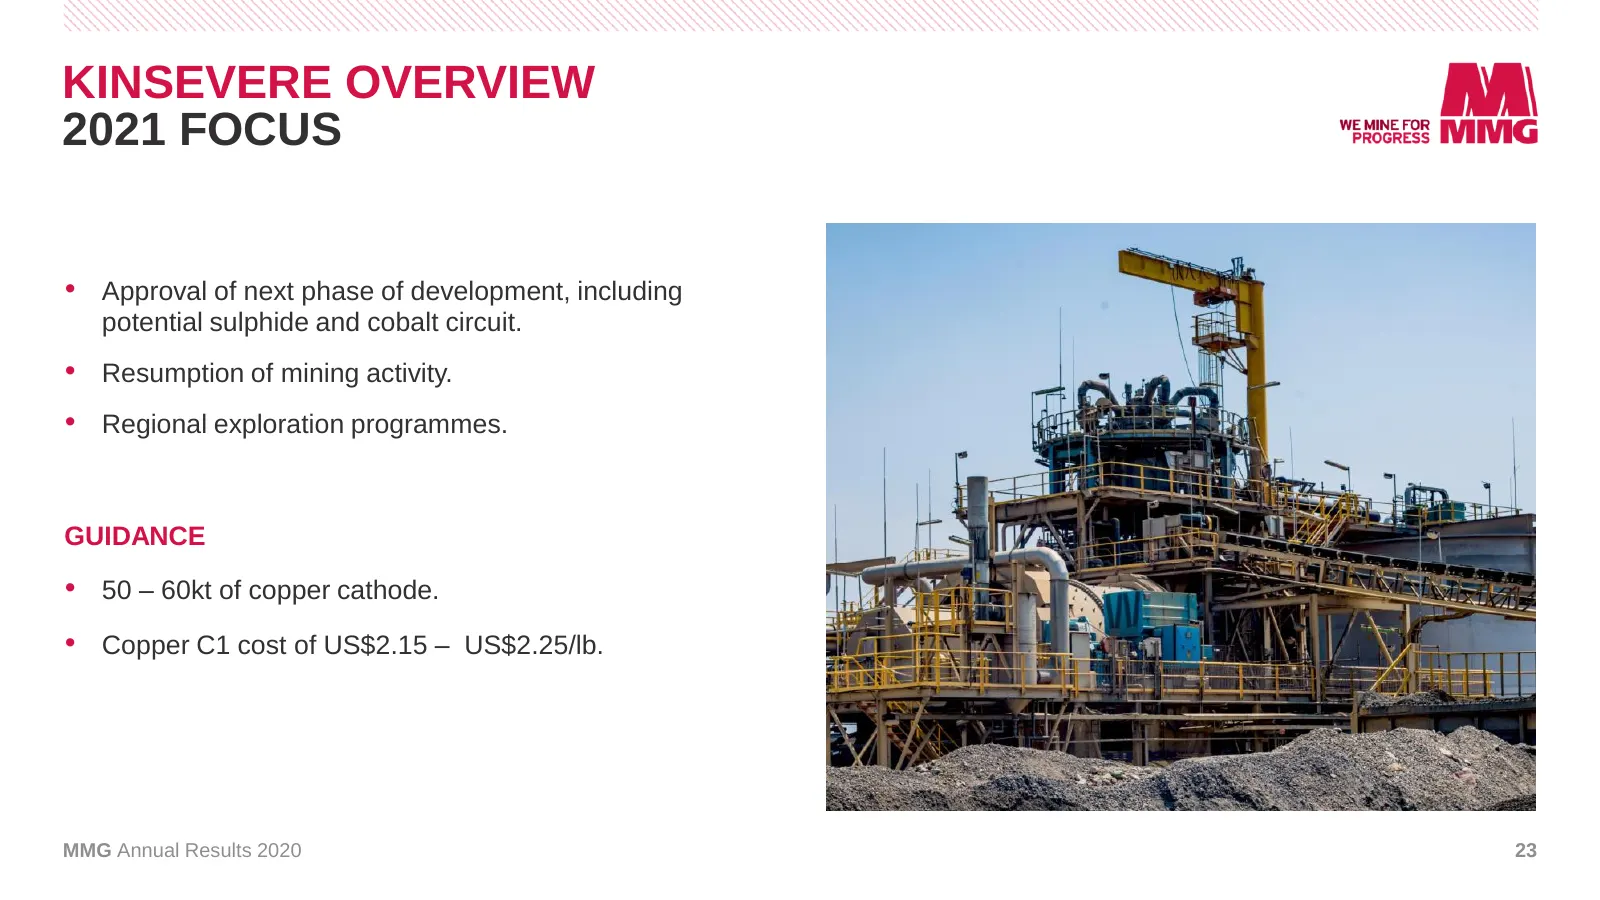
KINSEVERE OVERVIEW 2021 FOCUS • Approval of next phase of development, including potential sulphide and cobalt circuit. • Resumption of mining activity. • Regional exploration programmes. GUIDANCE • 50 – 60kt of copper cathode. • Copper C1 cost of US$2.15 – US$2.25/lb. MMG Annual Results 2020 23
Slide 24: Dugald River Overview 2020
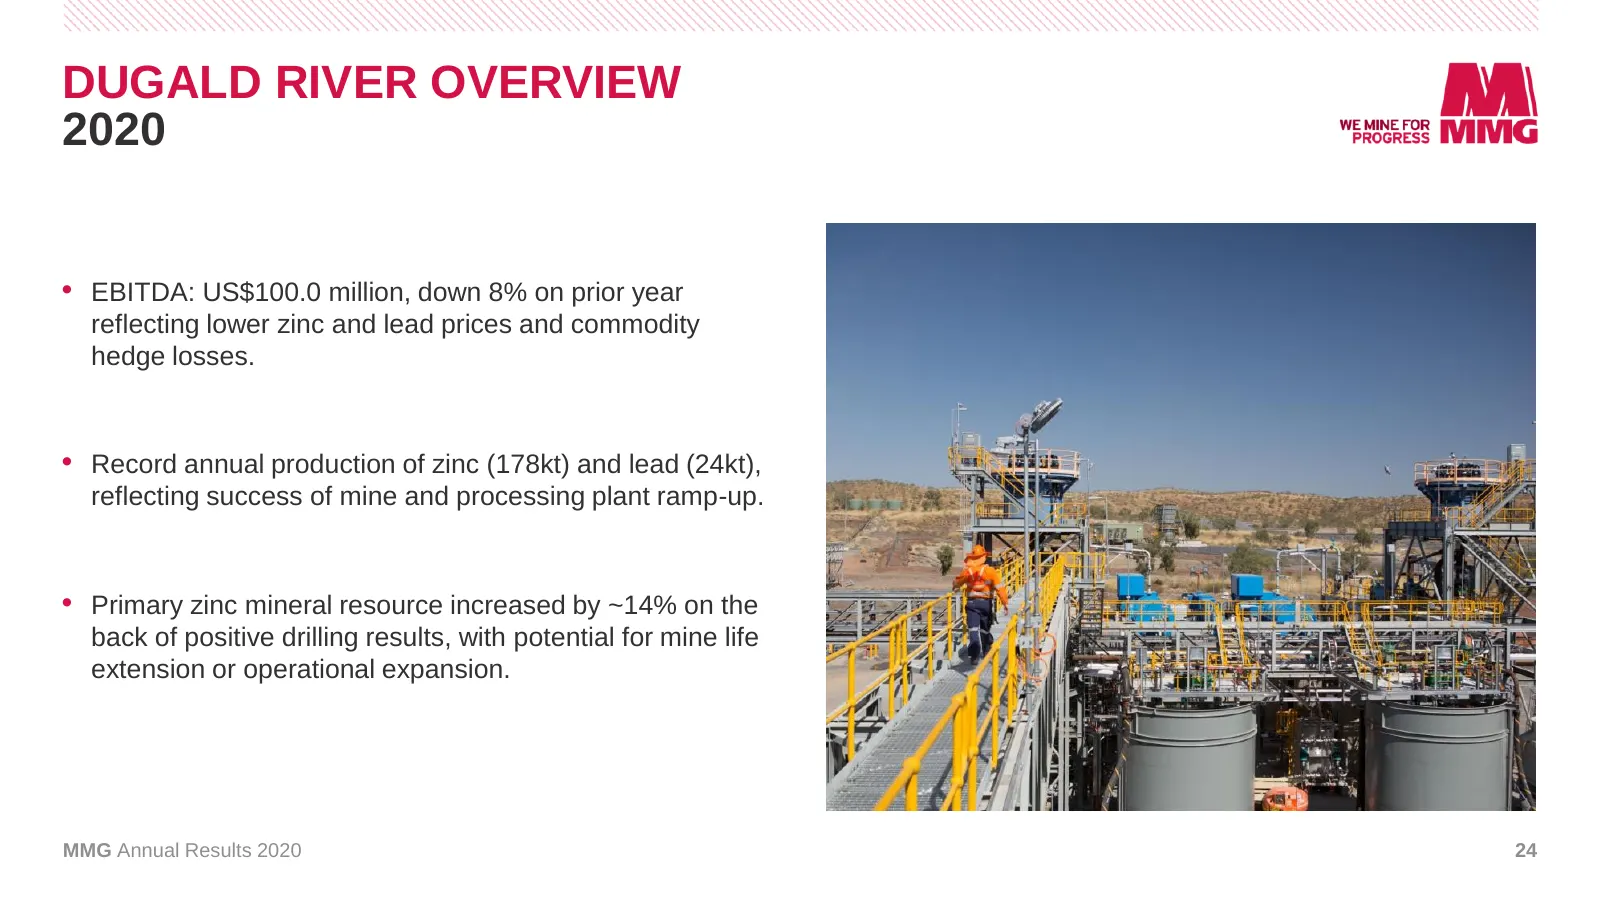
DUGALD RIVER OVERVIEW 2020 • EBITDA: US$100.0 million, down 8% on prior year reflecting lower zinc and lead prices and commodity hedge losses. • Record annual production of zinc (178kt) and lead (24kt), reflecting success of mine and processing plant ramp-up. • Primary zinc mineral resource increase
Slide 25: Dugald River Overview 2021 Focus
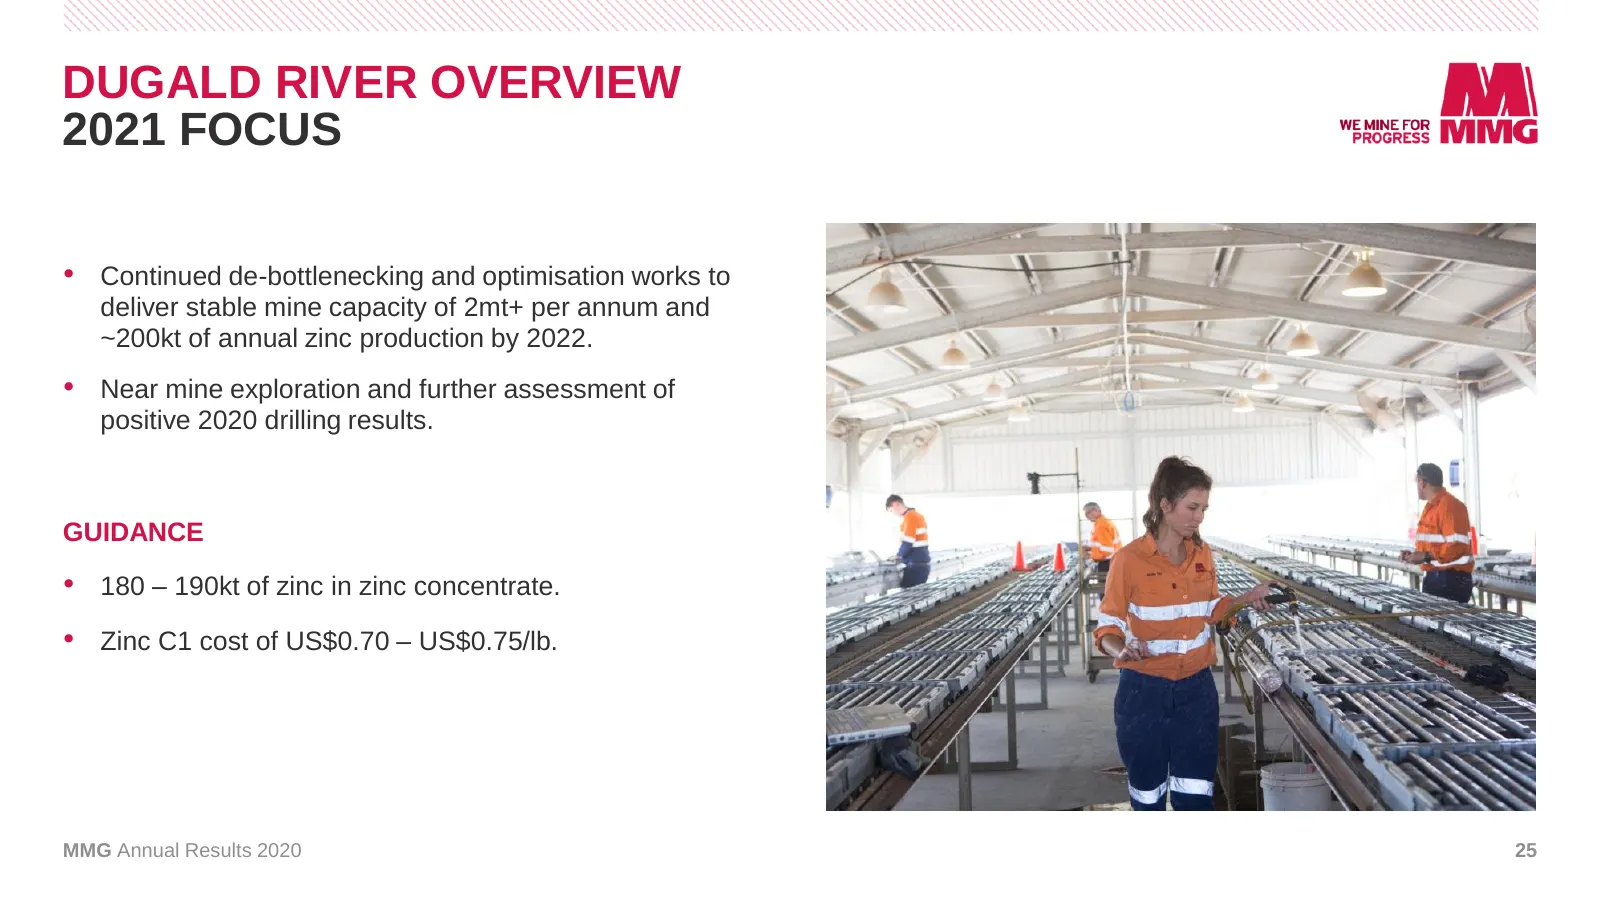
DUGALD RIVER OVERVIEW 2021 FOCUS • Continued de-bottlenecking and optimisation works to deliver stable mine capacity of 2mt+ per annum and ~200kt of annual zinc production by 2022. • Near mine exploration and further assessment of positive 2020 drilling results. GUIDANCE • 180 – 190kt of zinc in zin
Slide 26: Rosebery Overview 2020
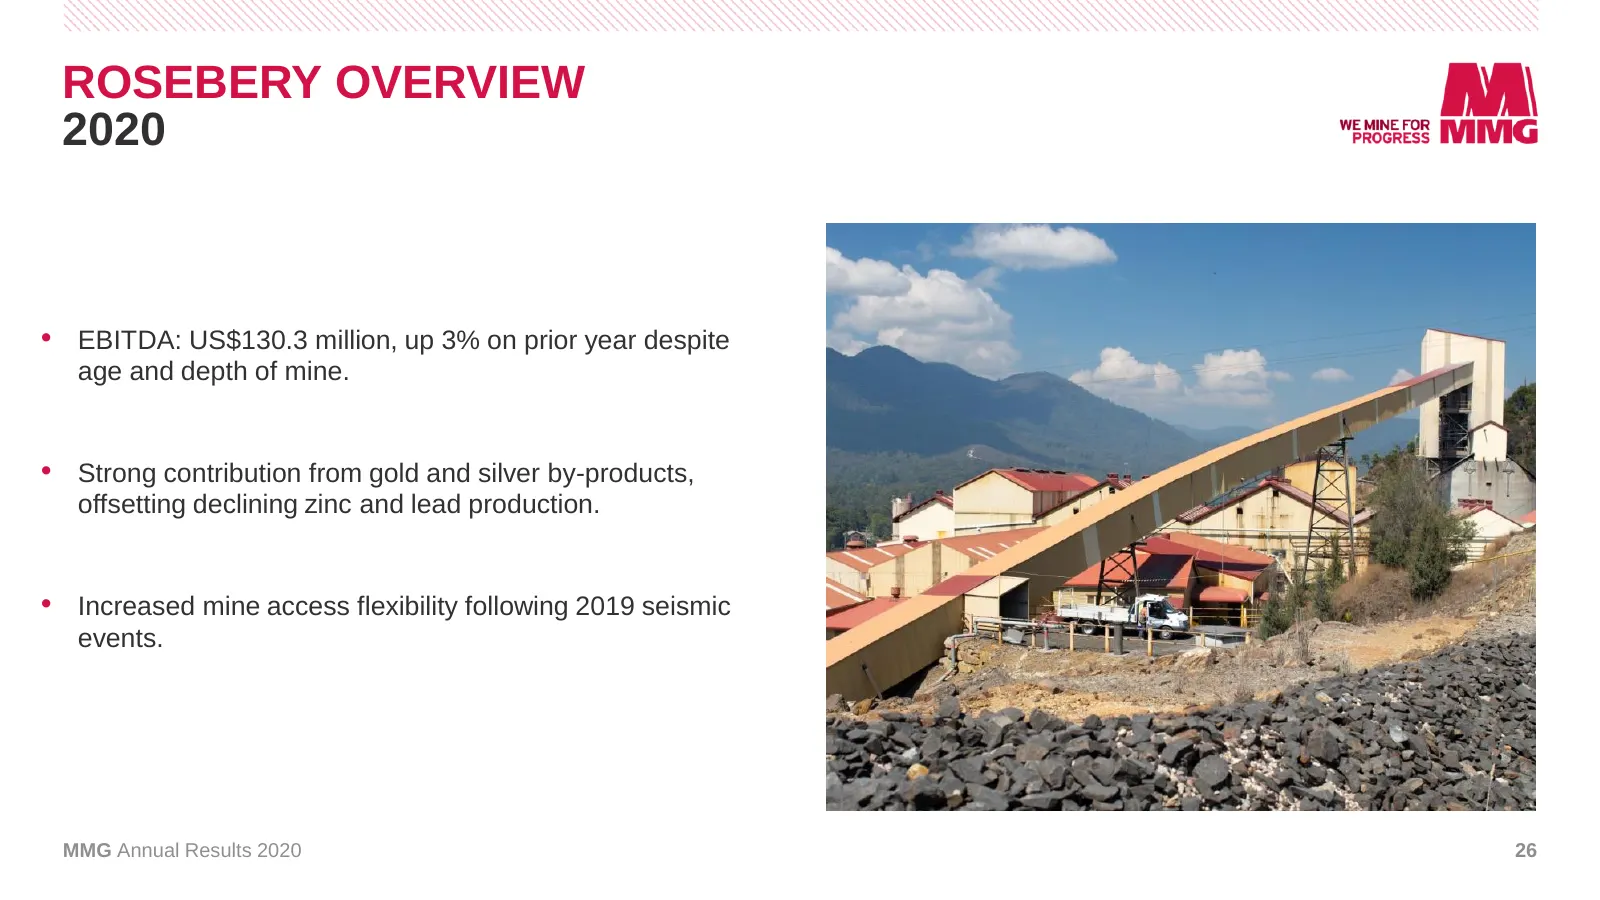
ROSEBERY OVERVIEW 2020 • EBITDA: US$130.3 million, up 3% on prior year despite age and depth of mine. • Strong contribution from gold and silver by-products, offsetting declining zinc and lead production. • Increased mine access flexibility following 2019 seismic events. MMG Annual Results 2020 26
Slide 27: Rosebery Overview 2021 Focus
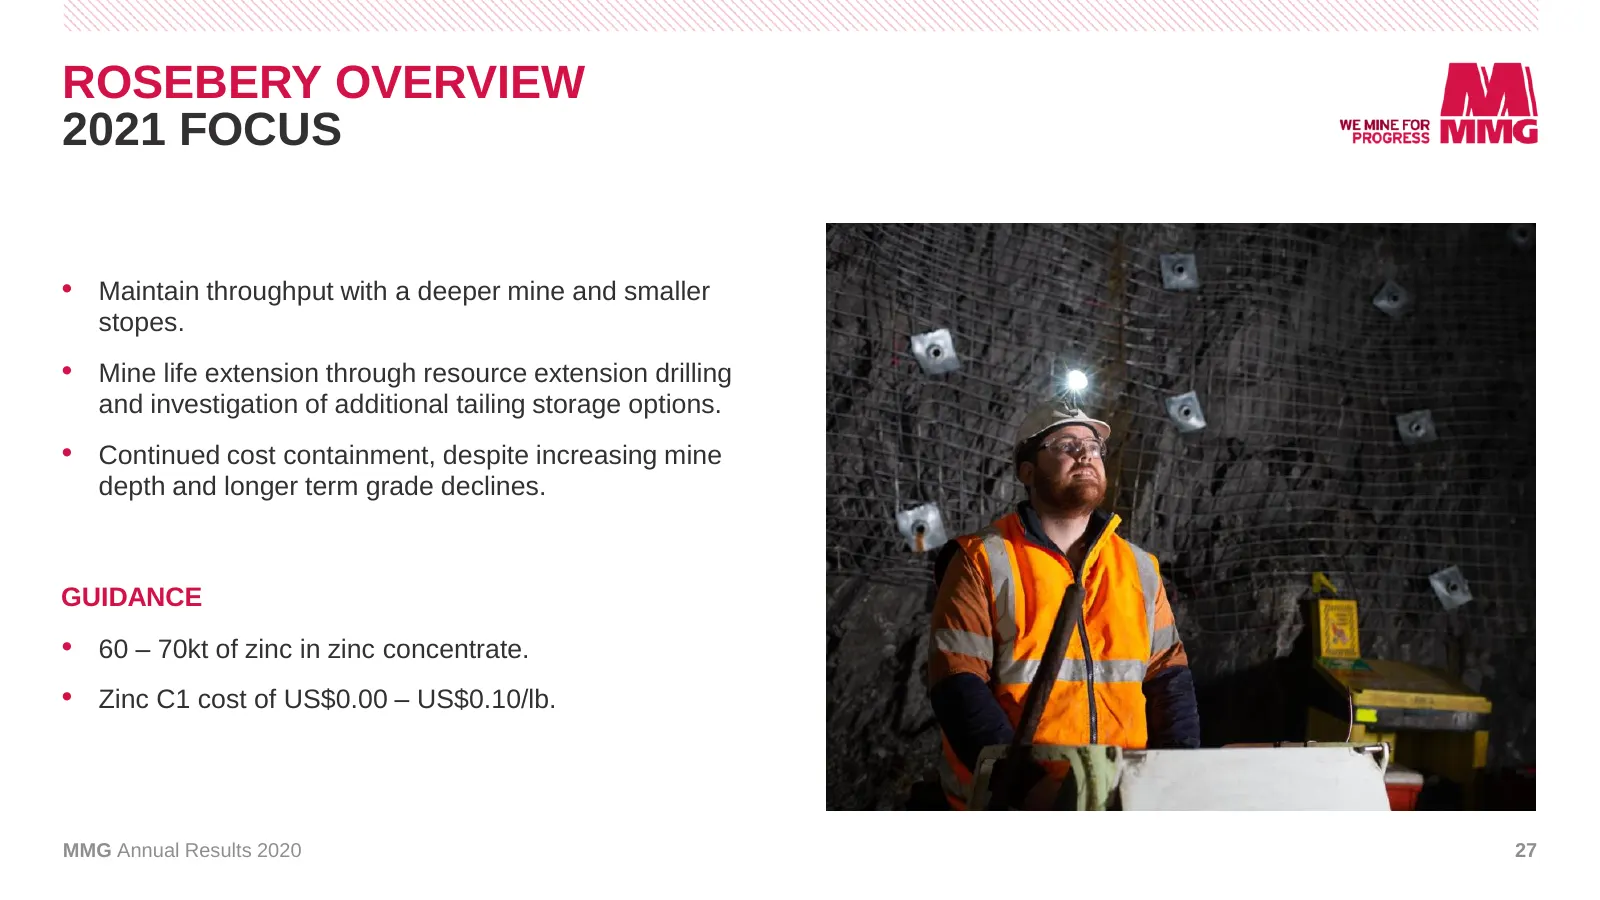
ROSEBERY OVERVIEW 2021 FOCUS • Maintain throughput with a deeper mine and smaller stopes. • Mine life extension through resource extension drilling and investigation of additional tailing storage options. • Continued cost containment, despite increasing mine depth and longer term grade declines. GUI
Slide 28: 2021 Strategy and Outlook
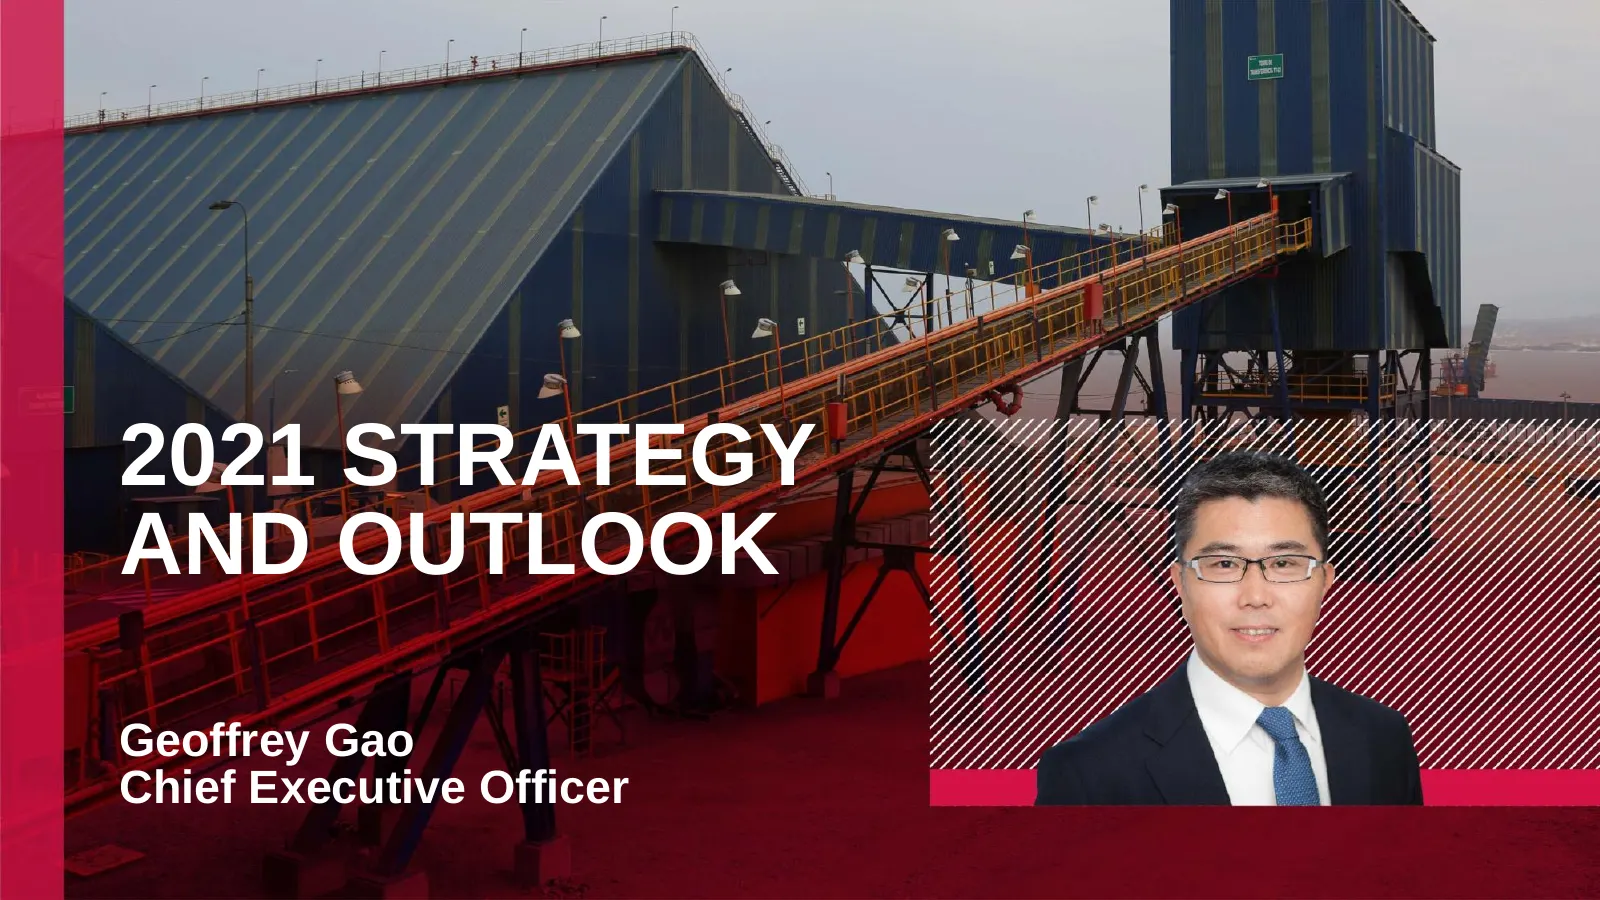
2021 STRATEGY AND OUTLOOK Geoffrey Gao Chief Executive Officer
Slide 29: Positive Outlook
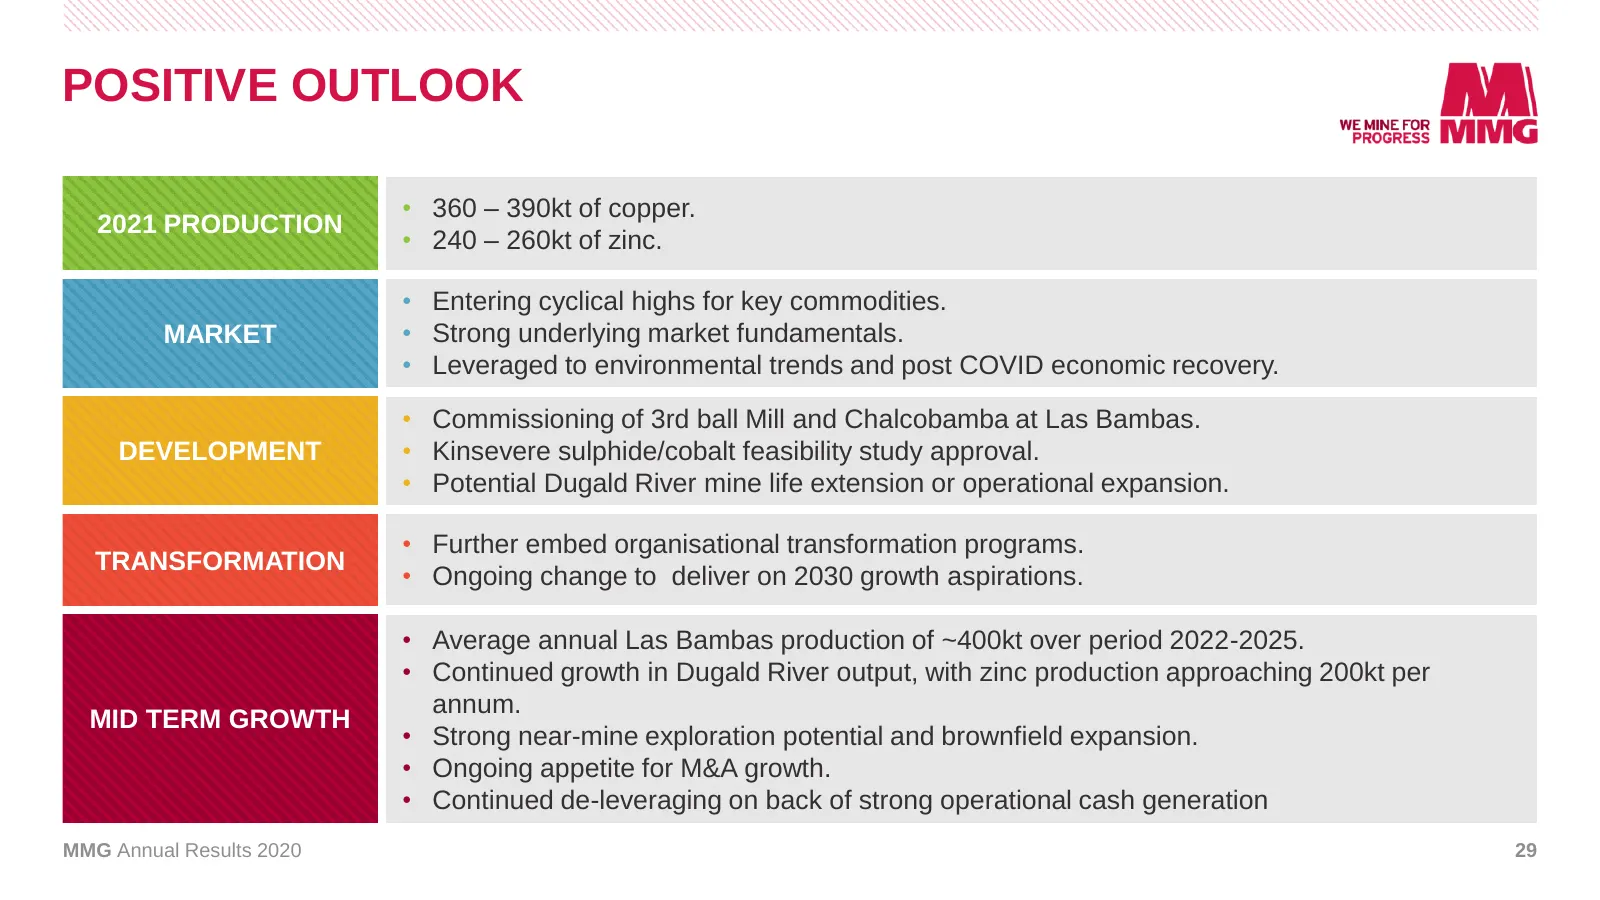
POSITIVE OUTLOOK • 360 – 390kt of copper. 2021 PRODUCTION • 240 – 260kt of zinc. • Entering cyclical highs for key commodities. MARKET • Strong underlying market fundamentals. • Leveraged to environmental trends and post COVID economic recovery. • Commissioning of 3rd ball Mill and Chalcobamba at La
Slide 30: Target Annual Copper Equivalent Production of 2 Million Tonnes by 2030
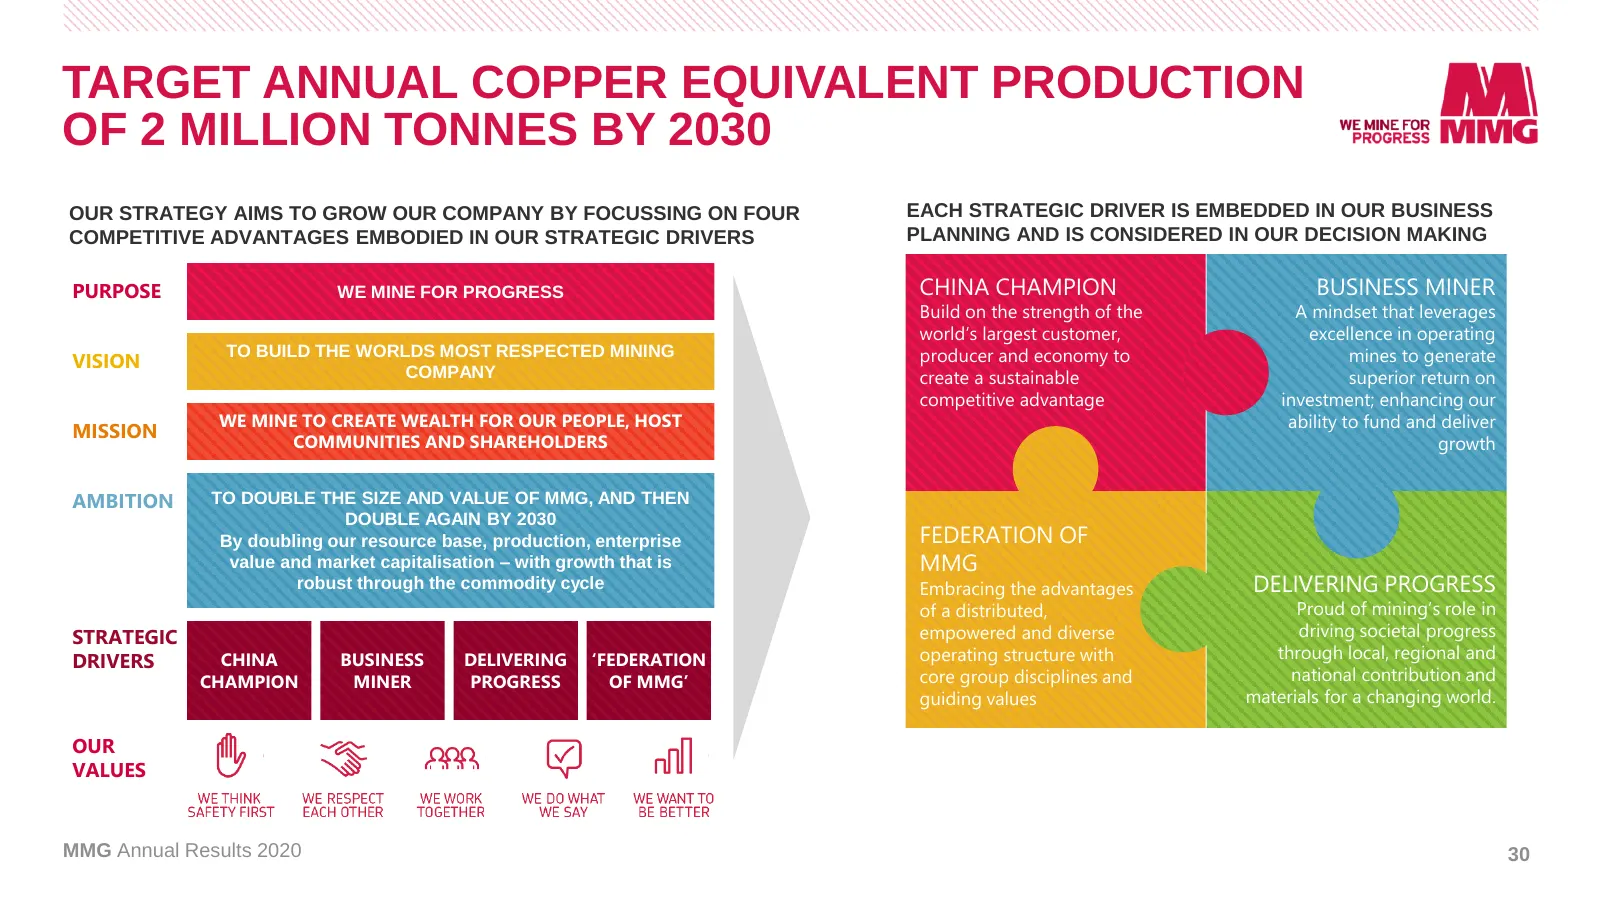
TARGET ANNUAL COPPER EQUIVALENT PRODUCTION OF 2 MILLION TONNES BY 2030 OUR STRATEGY AIMS TO GROW OUR COMPANY BY FOCUSSING ON FOUR EACH STRATEGIC DRIVER IS EMBEDDED IN OUR BUSINESS COMPETITIVE ADVANTAGES EMBODIED IN OUR STRATEGIC DRIVERS PLANNING AND IS CONSIDERED IN OUR DECISION MAKING PURPOSE WE MI
Slide 31: 2020 Annual Results - Q&A
2020 Annual Results - Q&A Geoffrey Gao Ross Carroll Chief Executive Officer Chief Financial Officer
Slide 32: Appendix
APPENDIX
Slide 33: MMG Asset Base and 2021 Guidance
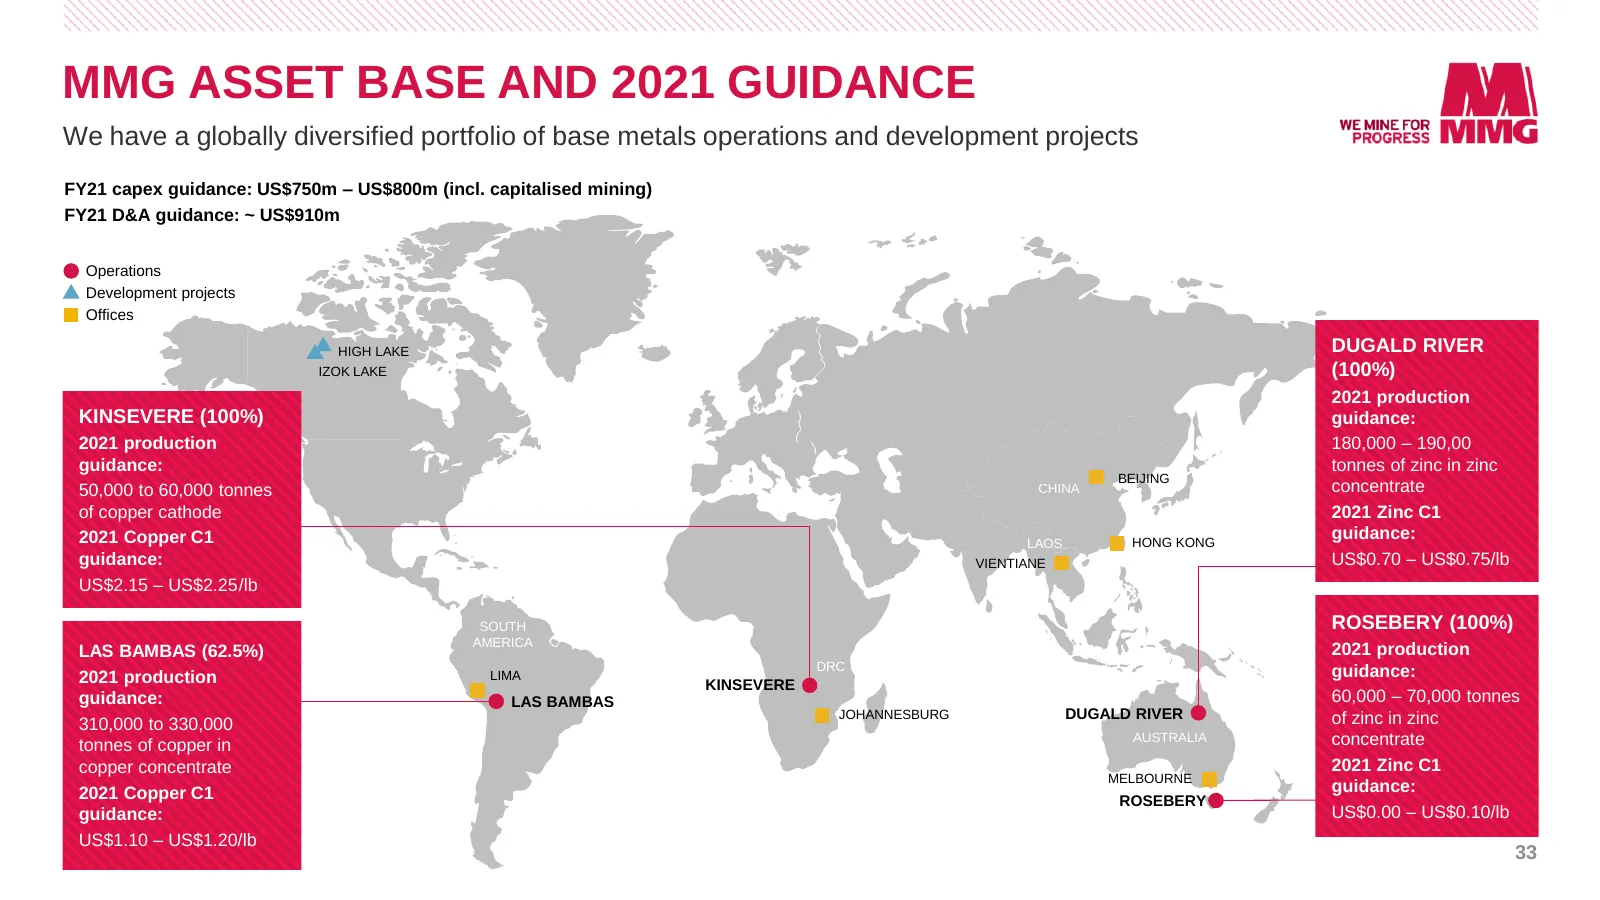
MMG ASSET BASE AND 2021 GUIDANCE We have a globally diversified portfolio of base metals operations and development projects FY21 capex guidance: US$750m – US$800m (incl. capitalised mining) FY21 D&A guidance: ~ US$910m Operations Development projects Offices HIGH LAKE DUGALD RIVER IZOK LAKE (100%)
Slide 34: Free Cash Flow Sensitivity to Copper and Zinc
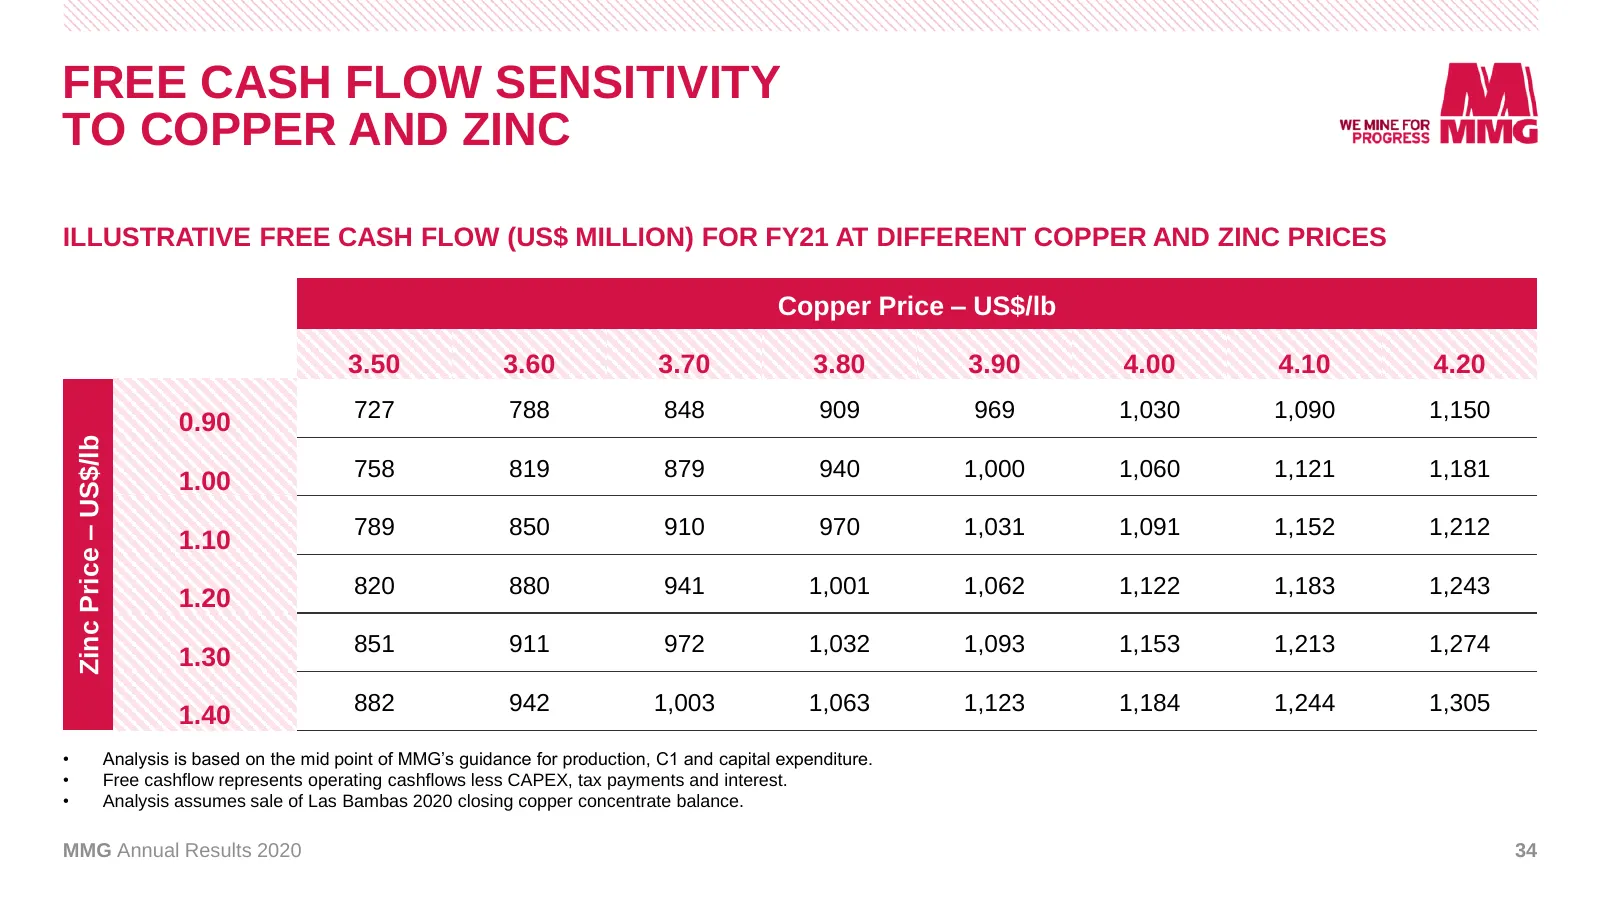
FREE CASH FLOW SENSITIVITY TO COPPER AND ZINC ILLUSTRATIVE FREE CASH FLOW (US$ MILLION) FOR FY21 AT DIFFERENT COPPER AND ZINC PRICES Copper Price – US$/lb 3.50 3.60 3.70 3.80 3.90 4.00 4.10 4.20 727 788 848 909 969 1,030 1,090 1,150 0.90 Zinc Price – US$/lb 758 819 879 940 1,000 1,060 1,121 1,181 1.
Slide 35: 2021 Illustrative Spot EBITDA & FCF
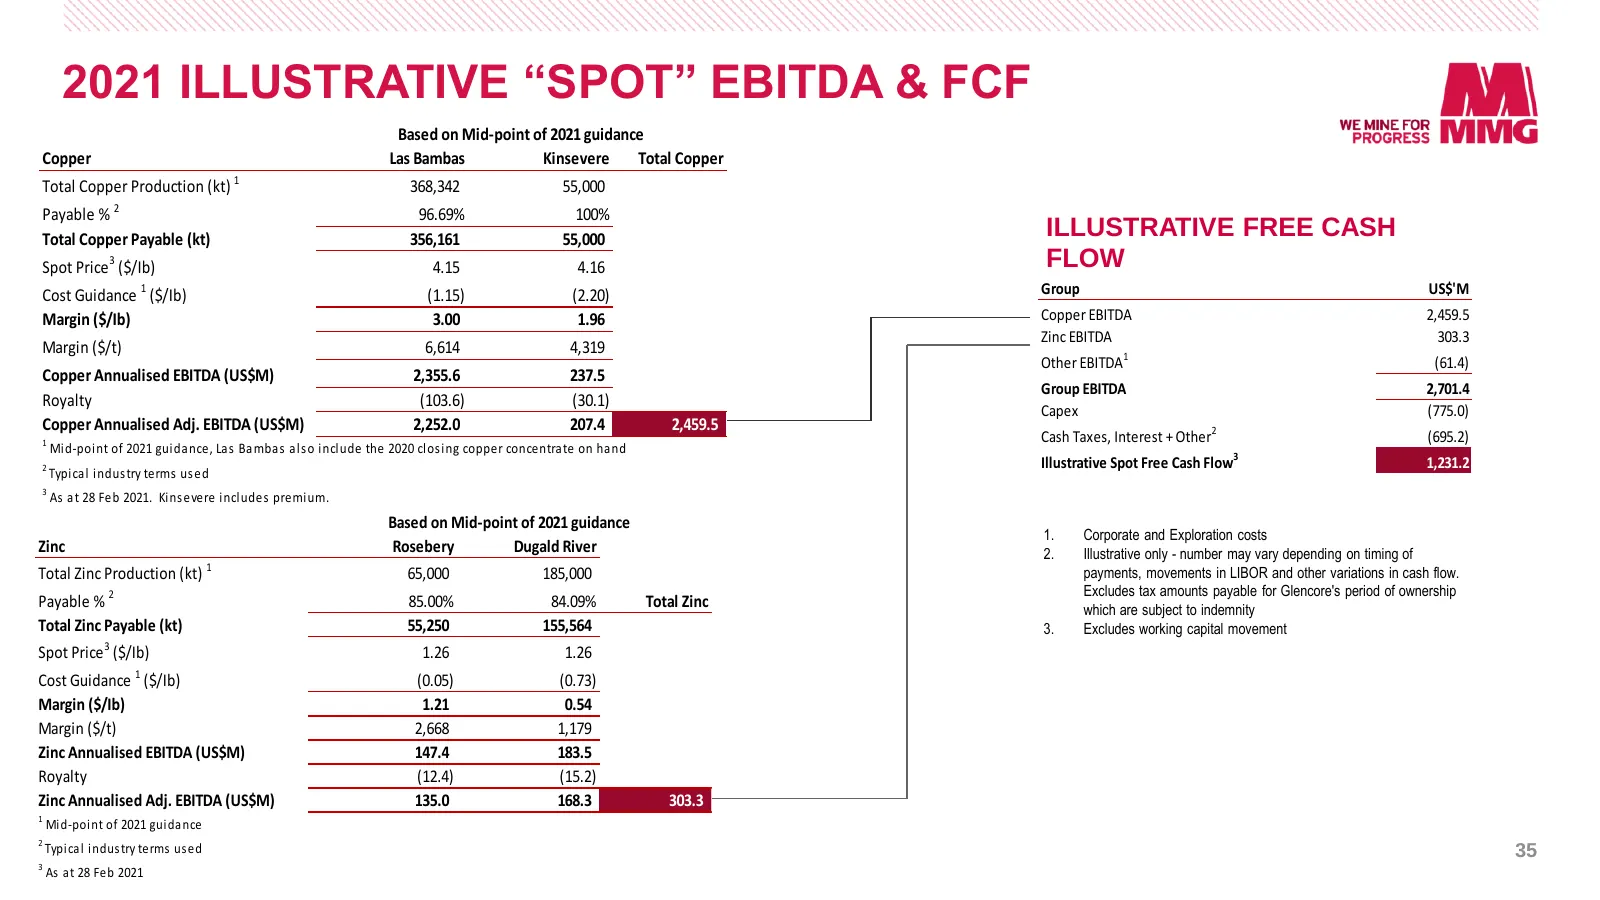
2021 ILLUSTRATIVE “SPOT” EBITDA & FCF Based on Mid-point of 2021 guidance Copper Las Bambas Kinsevere Total Copper Total Copper Production (kt) 1 368,342 55,000 Payable % 2 96.69% 100% Total Copper Payable (kt) 356,161 55,000 ILLUSTRATIVE FREE CASH 3 Spot Price ($/Ib) 4.15 4.16 FLOW Cost Guidance 1
Slide 36: Profit to MMG Equity Holders
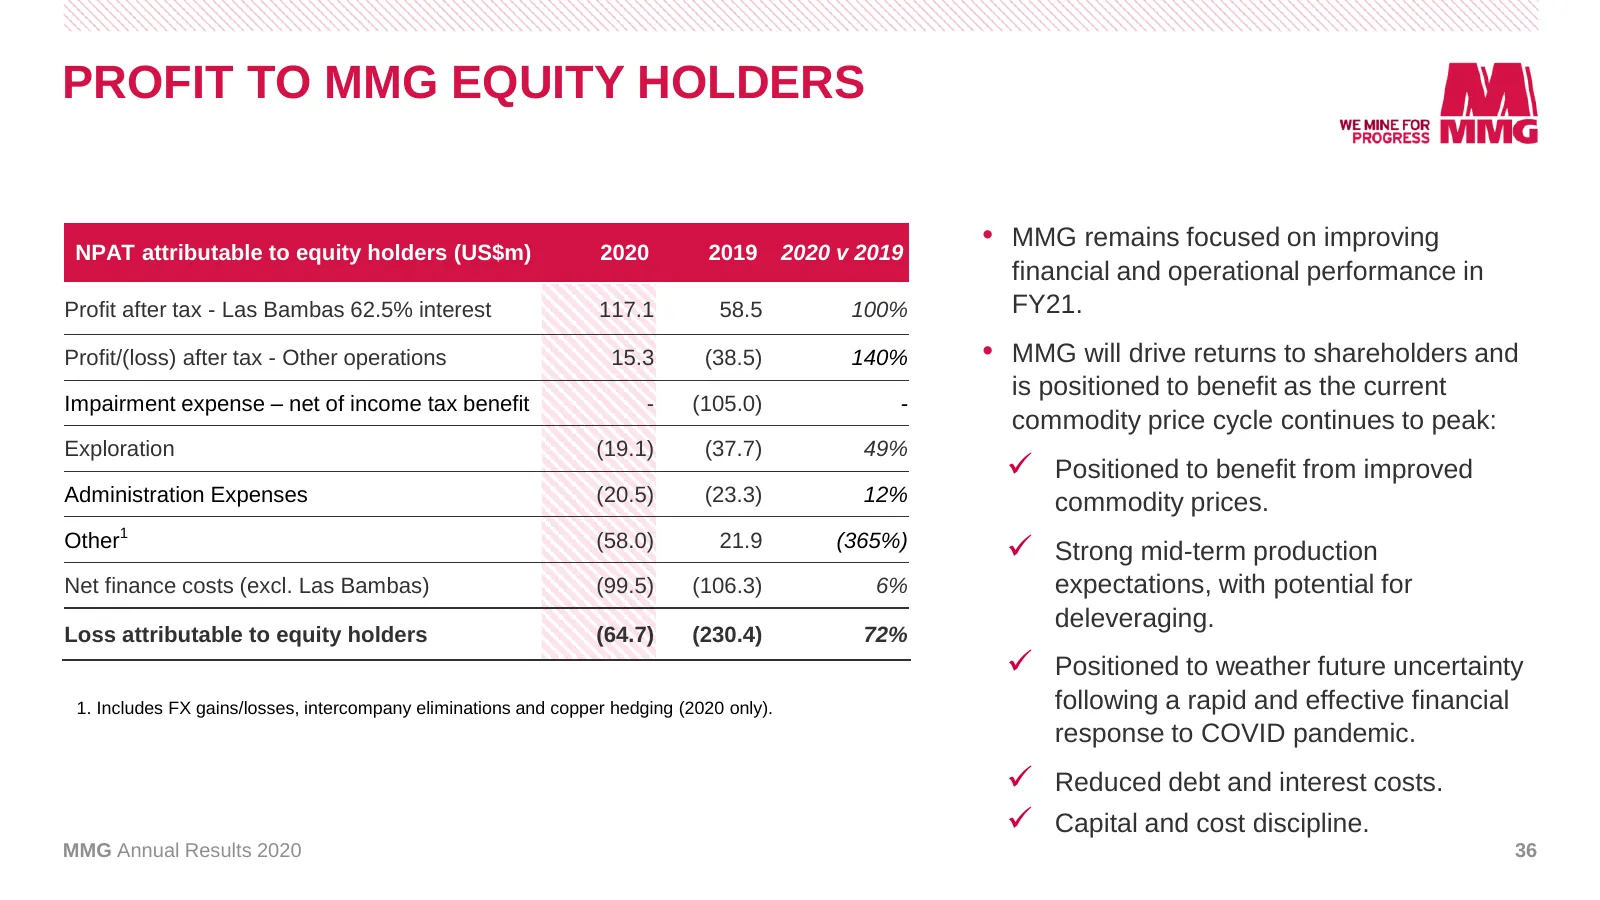
PROFIT TO MMG EQUITY HOLDERS NPAT attributable to equity holders (US$m) 2020 2019 2020 v 2019 • MMG remains focused on improving financial and operational performance in Profit after tax - Las Bambas 62.5% interest 117.1 58.5 100% FY21. Profit/(loss) after tax - Other operations 15.3 (38.5) 140% • M
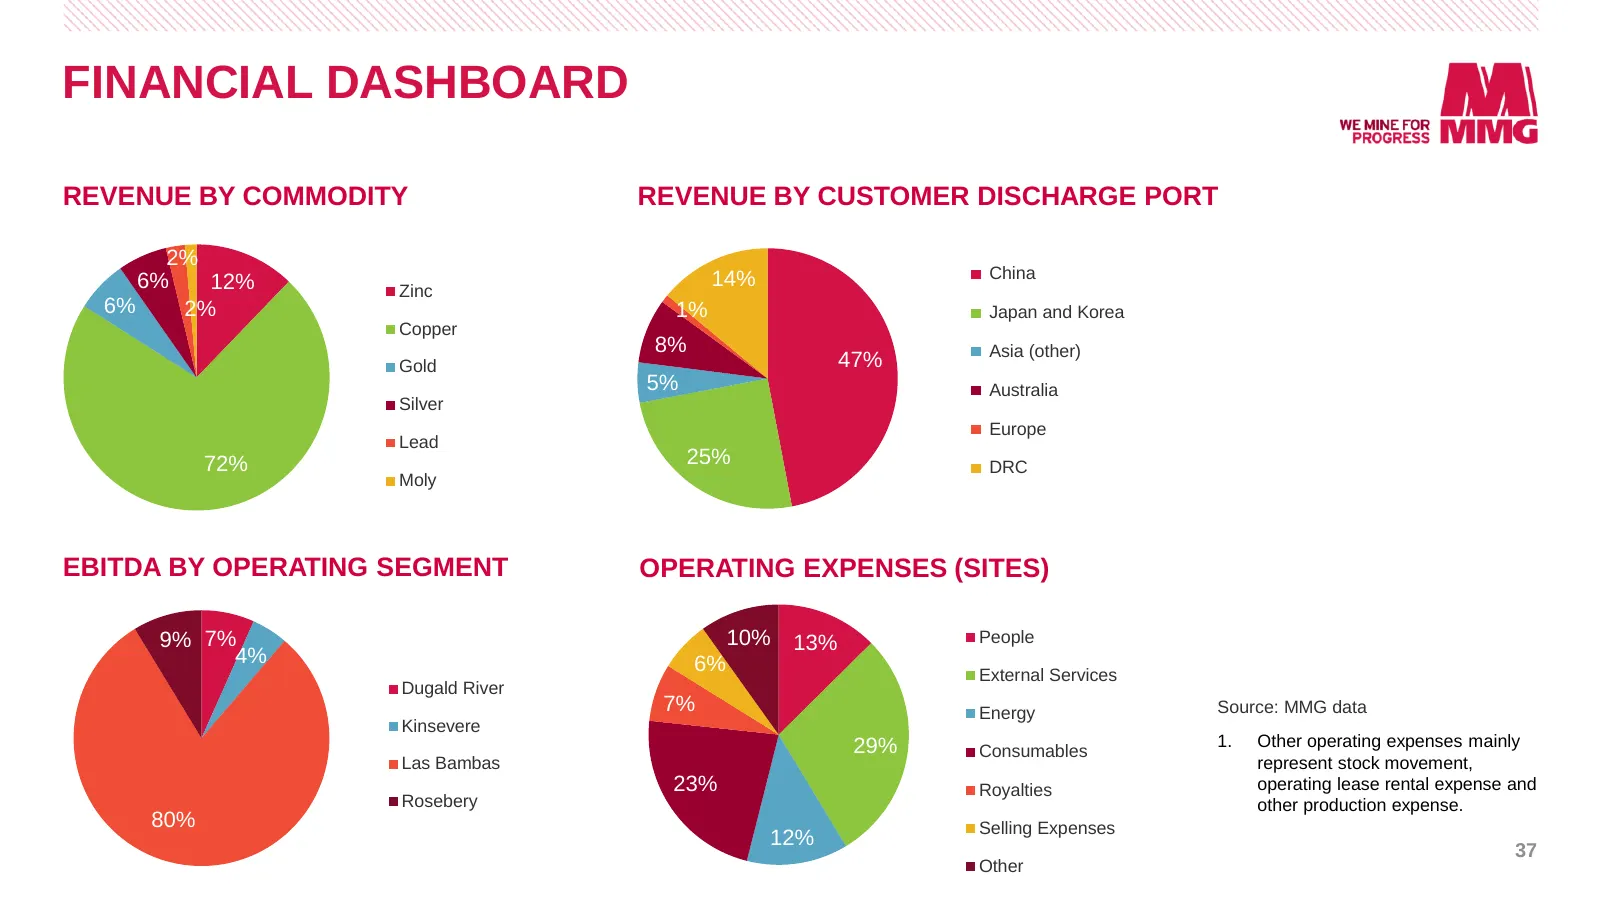
Slide 37: Financial Dashboard
FINANCIAL DASHBOARD REVENUE BY COMMODITY REVENUE BY CUSTOMER DISCHARGE PORT 2% 6% 14% China 12% Zinc 6% 2% 1% Japan and Korea Copper 8% Asia (other) Gold 47% 5% Australia Silver Europe Lead 72% 25% DRC Moly EBITDA BY OPERATING SEGMENT OPERATING EXPENSES (SITES) 9% 7% 10% 13% People 4% 6% External Se
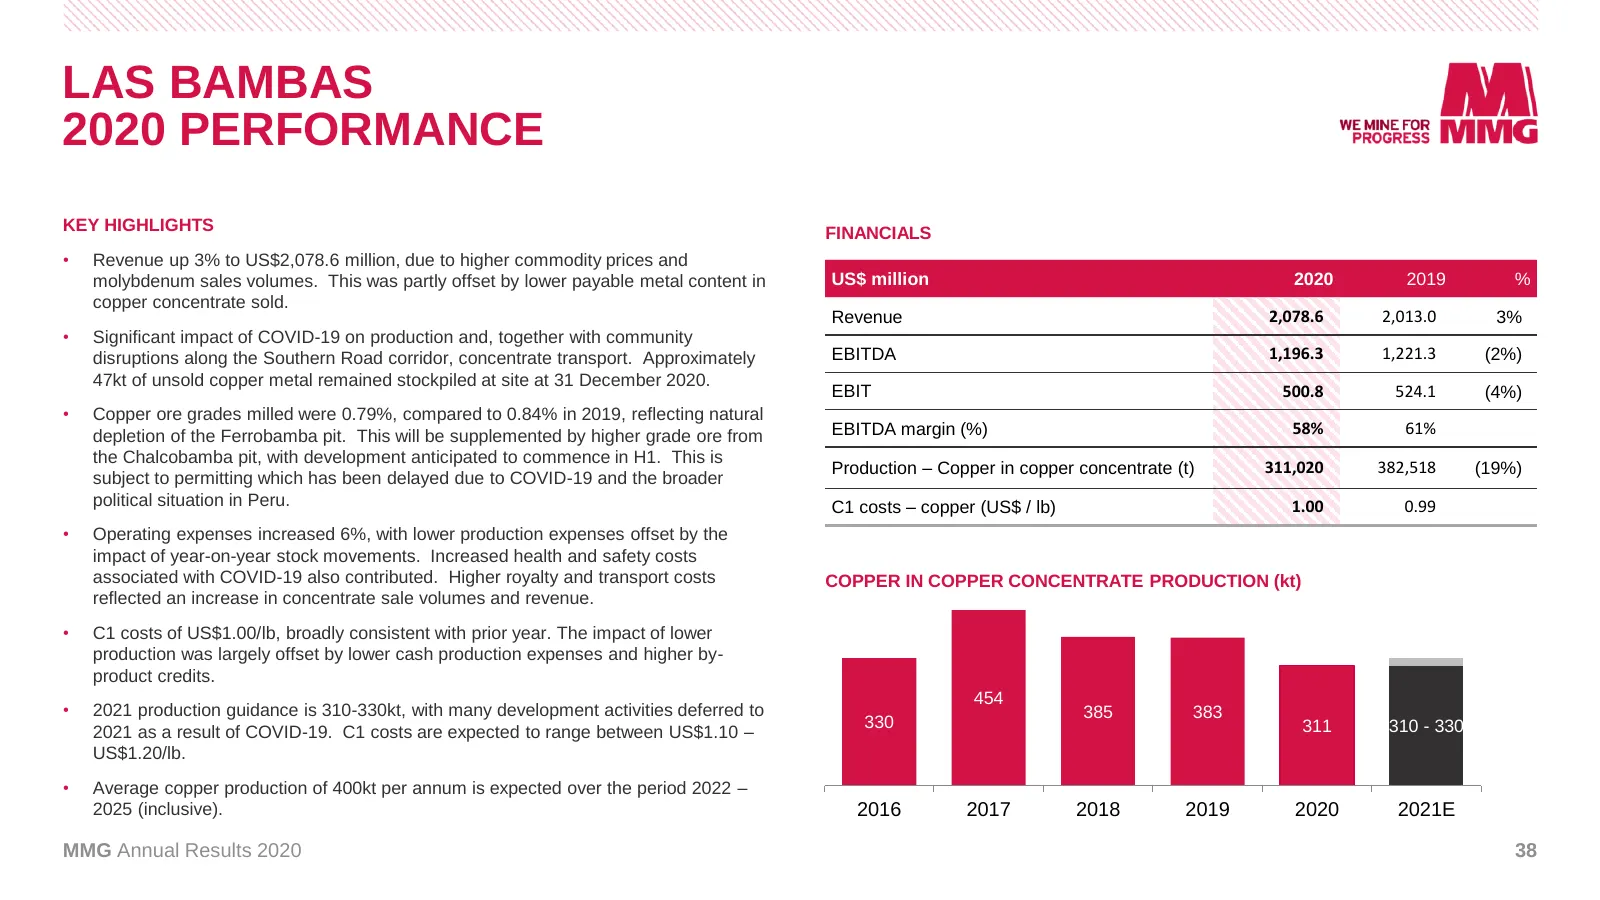
Slide 38: Las Bambas 2020 Performance
LAS BAMBAS 2020 PERFORMANCE KEY HIGHLIGHTS FINANCIALS • Revenue up 3% to US$2,078.6 million, due to higher commodity prices and molybdenum sales volumes. This was partly offset by lower payable metal content in US$ million 2020 2019 % copper concentrate sold. Revenue 2,078.6 2,013.0 3% • Significant
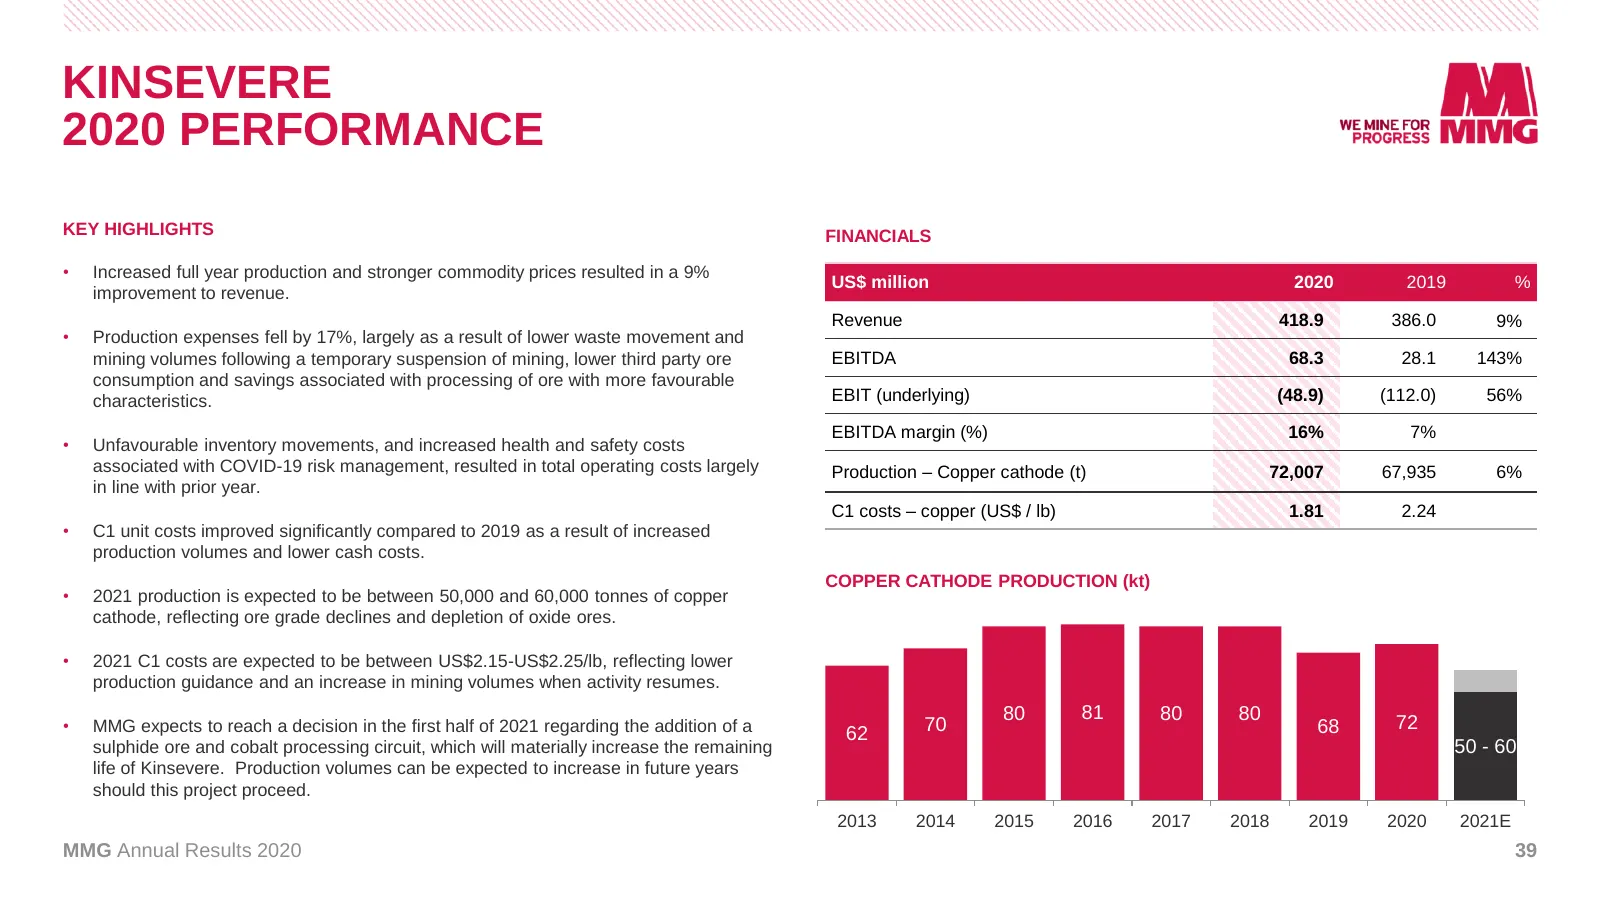
Slide 39: Kinsevere 2020 Performance
KINSEVERE 2020 PERFORMANCE KEY HIGHLIGHTS FINANCIALS • Increased full year production and stronger commodity prices resulted in a 9% US$ million 2020 2019 % improvement to revenue. Revenue 418.9 386.0 9% • Production expenses fell by 17%, largely as a result of lower waste movement and mining volume
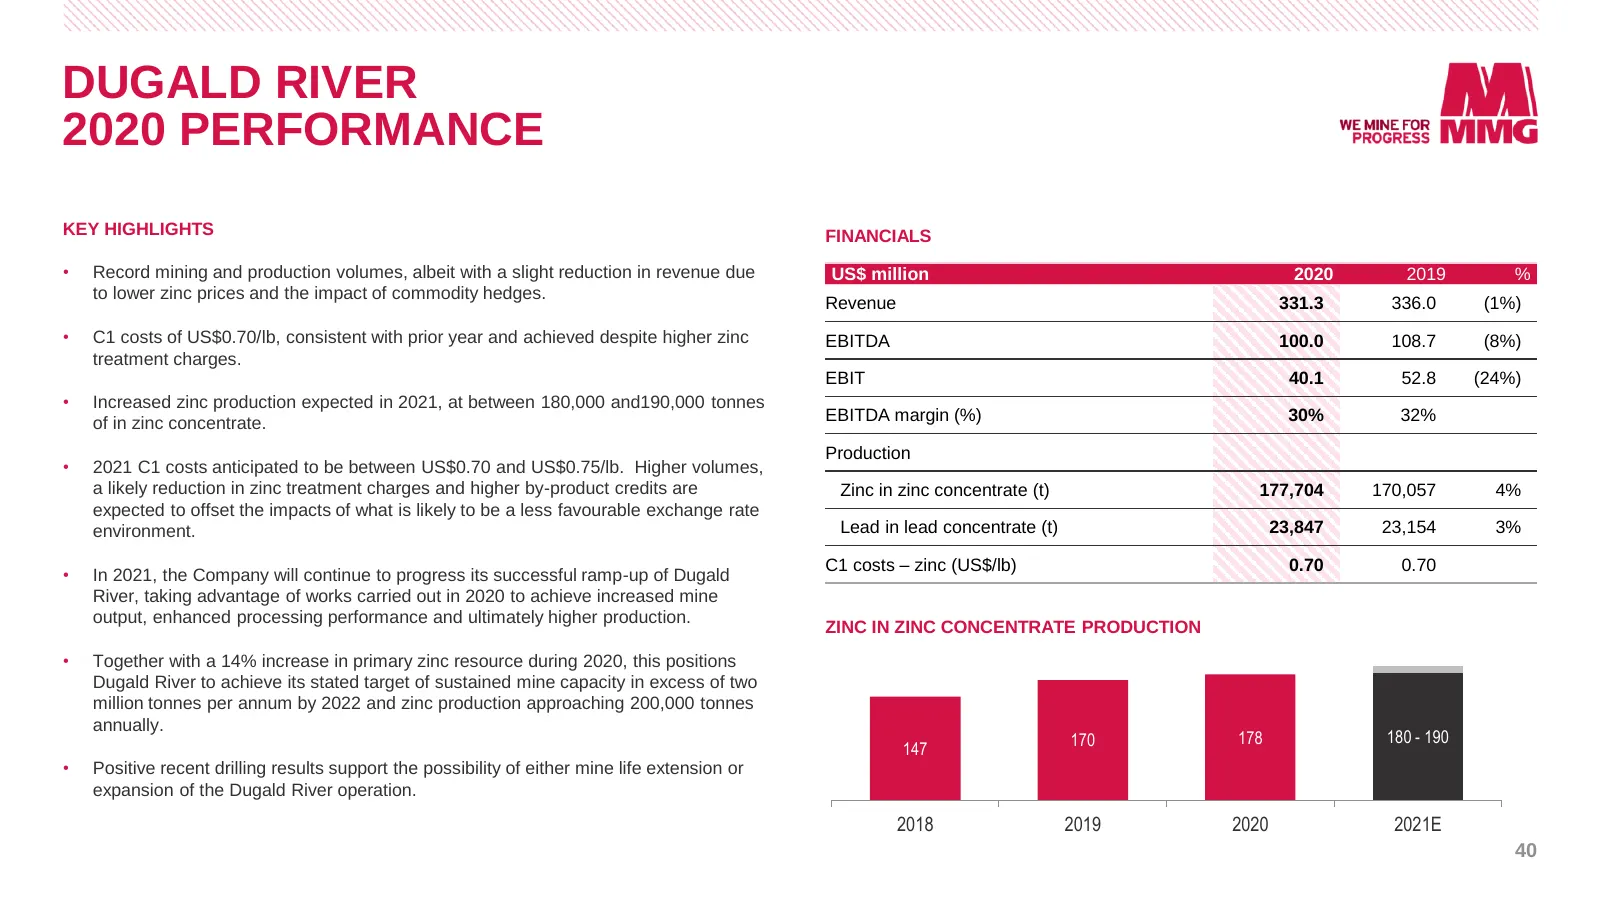
Slide 40: Dugald River 2020 Performance
DUGALD RIVER 2020 PERFORMANCE KEY HIGHLIGHTS FINANCIALS • Record mining and production volumes, albeit with a slight reduction in revenue due US$ million 2020 2019 % to lower zinc prices and the impact of commodity hedges. Revenue 331.3 336.0 (1%) • C1 costs of US$0.70/lb, consistent with prior year
Slide 41: Rosebery 2020 Performance
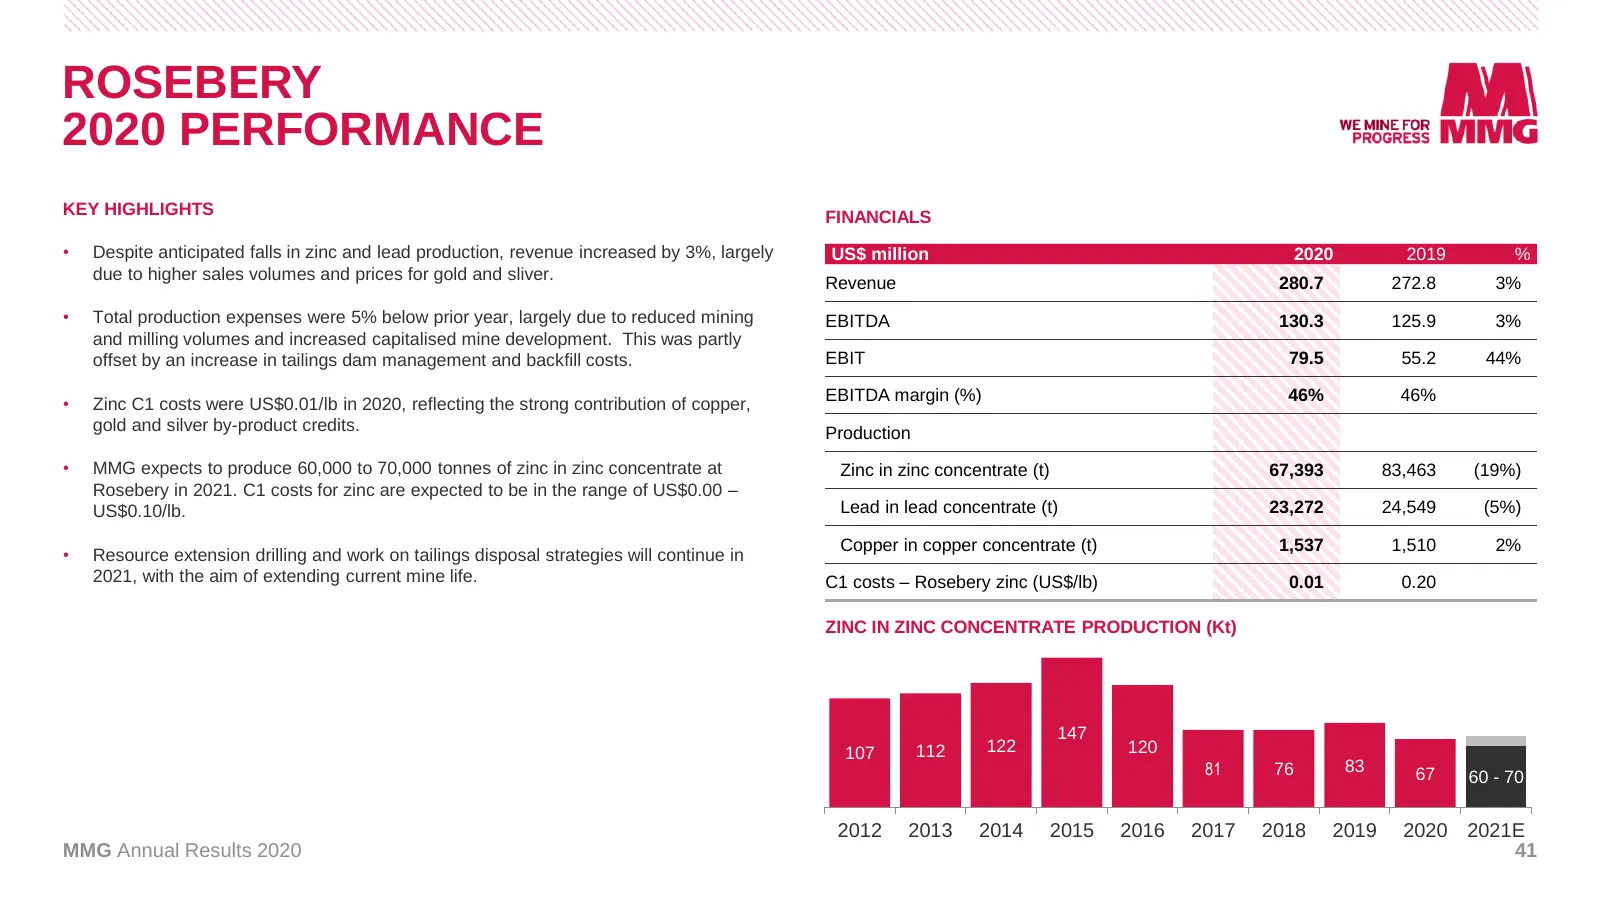
ROSEBERY 2020 PERFORMANCE KEY HIGHLIGHTS FINANCIALS • Despite anticipated falls in zinc and lead production, revenue increased by 3%, largely US$ million 2020 2019 % due to higher sales volumes and prices for gold and sliver. Revenue 280.7 272.8 3% • Total production expenses were 5% below prior yea
Slide 42: Profit and Loss Statement
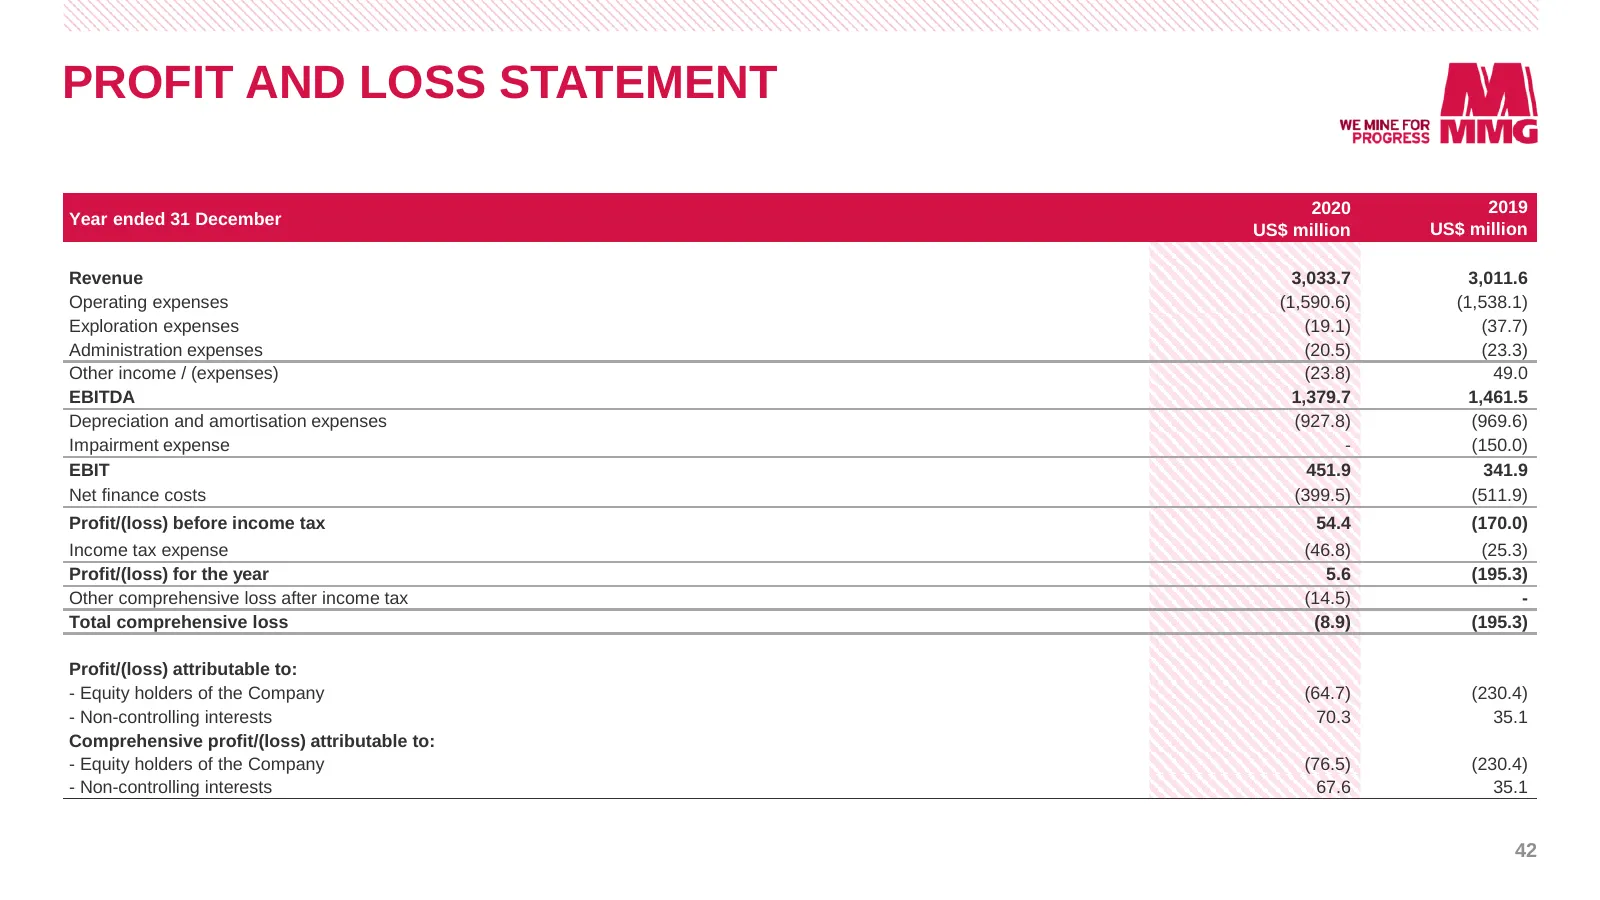
PROFIT AND LOSS STATEMENT 2020 2019 Year ended 31 December US$ million US$ million Revenue 3,033.7 3,011.6 Operating expenses (1,590.6) (1,538.1) Exploration expenses (19.1) (37.7) Administration expenses (20.5) (23.3) Other income / (expenses) (23.8) 49.0 EBITDA 1,379.7 1,461.5 Depreciation and amo
Slide 43: Balance Sheet
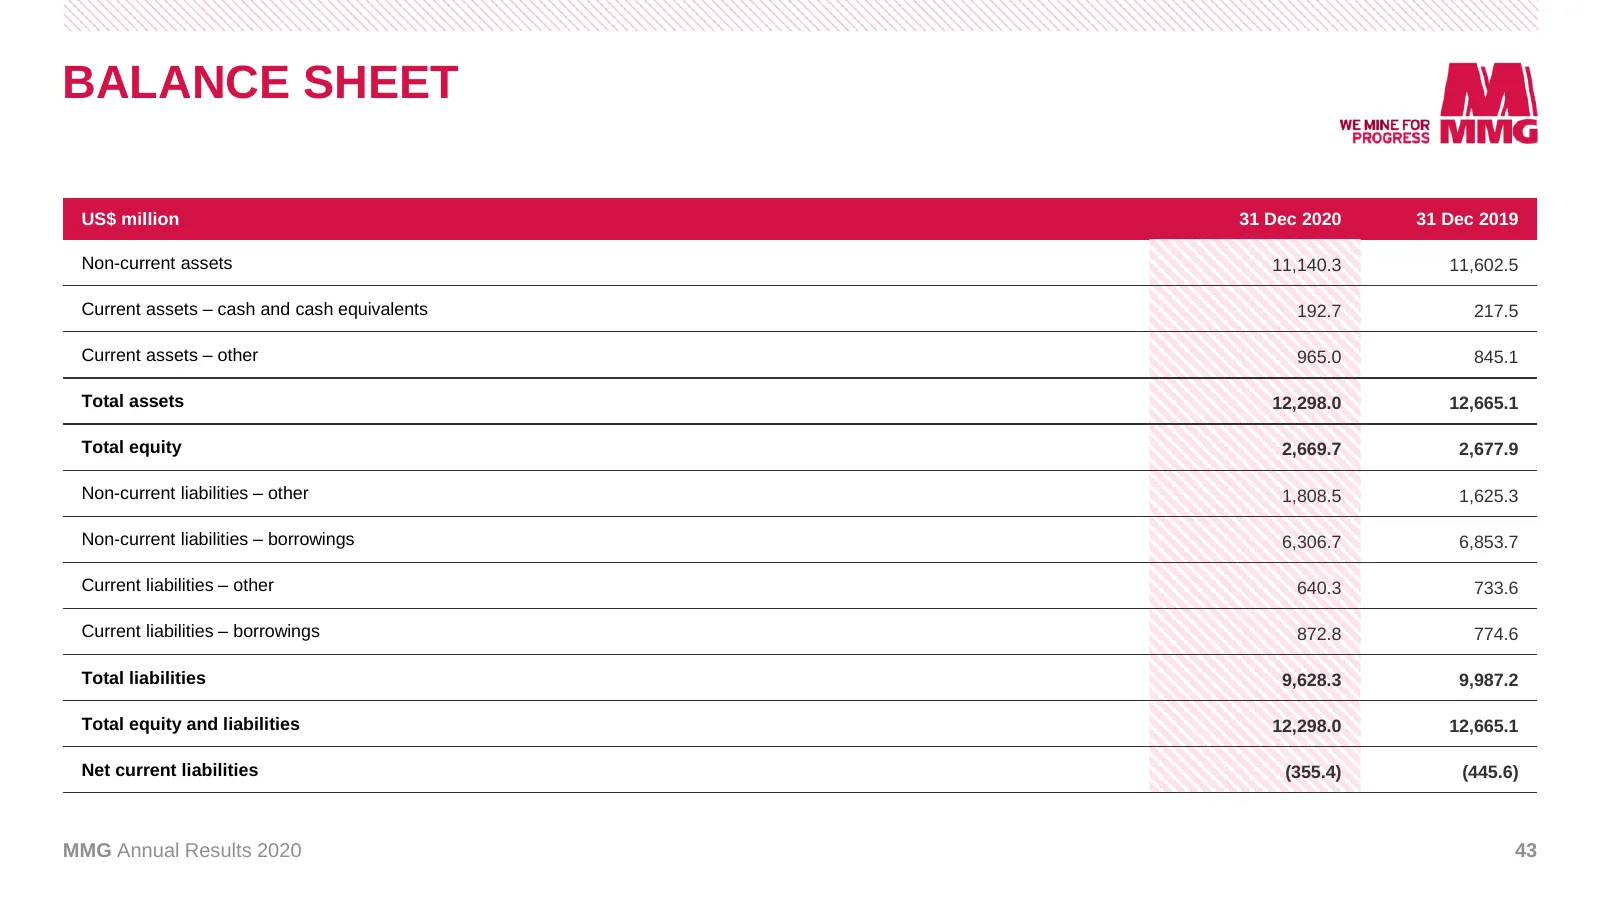
BALANCE SHEET US$ million 31 Dec 2020 31 Dec 2019 Non-current assets 11,140.3 11,602.5 Current assets – cash and cash equivalents 192.7 217.5 Current assets – other 965.0 845.1 Total assets 12,298.0 12,665.1 Total equity 2,669.7 2,677.9 Non-current liabilities – other 1,808.5 1,625.3 Non-current lia
Slide 44: Statement of Cash Flow
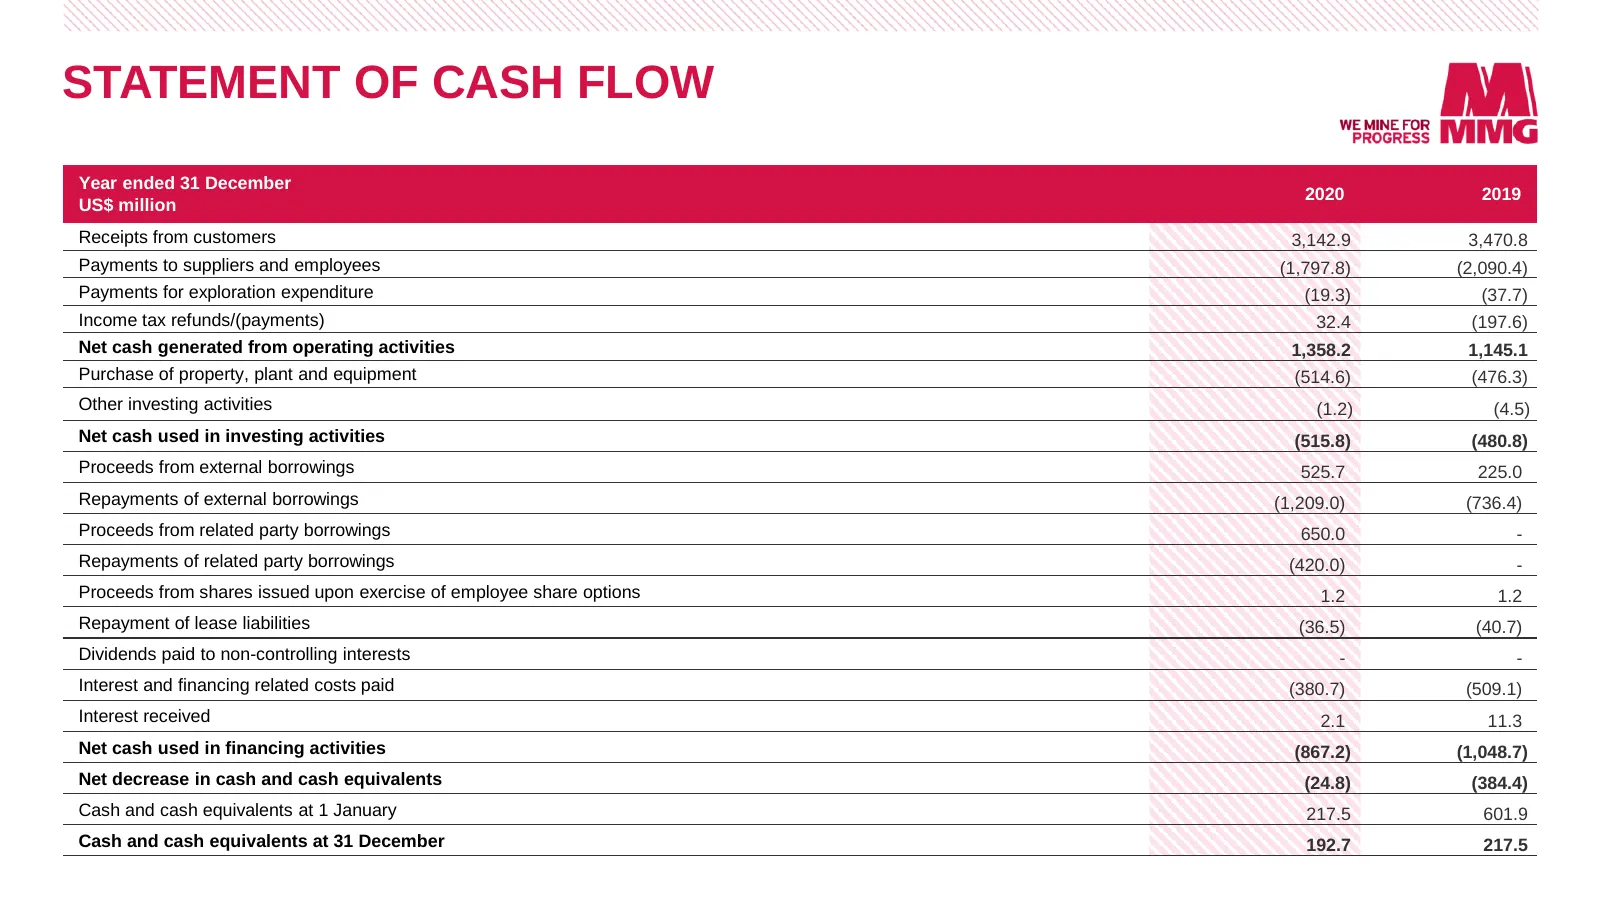
STATEMENT OF CASH FLOW Year ended 31 December 2020 2019 US$ million Receipts from customers 3,142.9 3,470.8 Payments to suppliers and employees (1,797.8) (2,090.4) Payments for exploration expenditure (19.3) (37.7) Income tax refunds/(payments) 32.4 (197.6) Net cash generated from operating activiti
Slide 45: MMG Overview
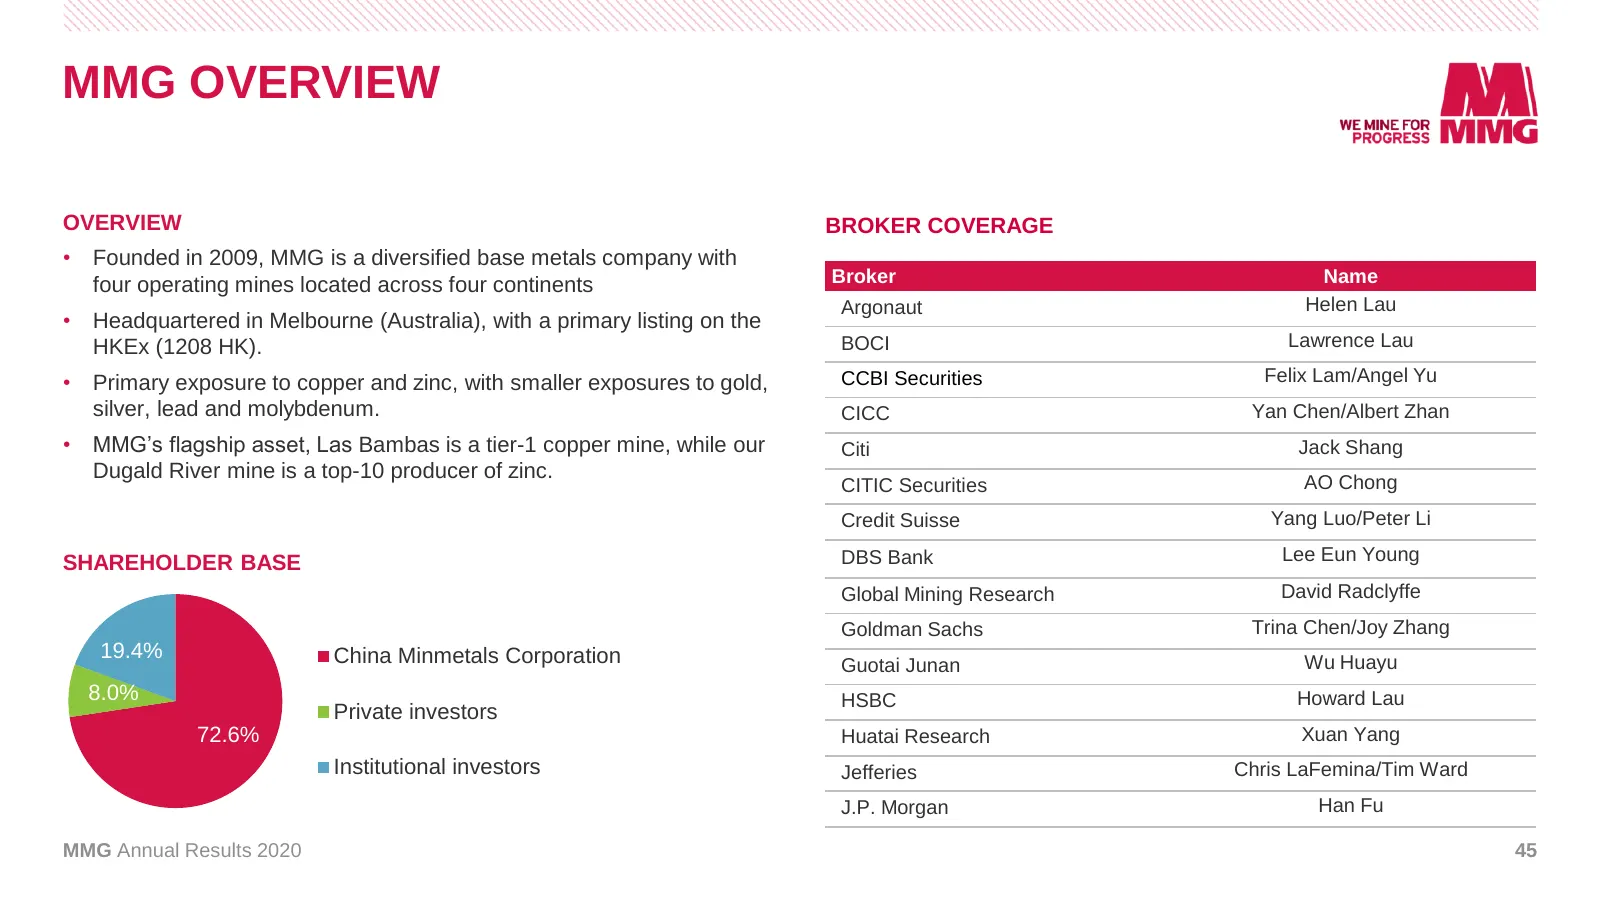
MMG OVERVIEW OVERVIEW BROKER COVERAGE • Founded in 2009, MMG is a diversified base metals company with four operating mines located across four continents Broker Name Argonaut Helen Lau • Headquartered in Melbourne (Australia), with a primary listing on the HKEx (1208 HK). BOCI Lawrence Lau • Primar
Slide 46: Mineral Resources
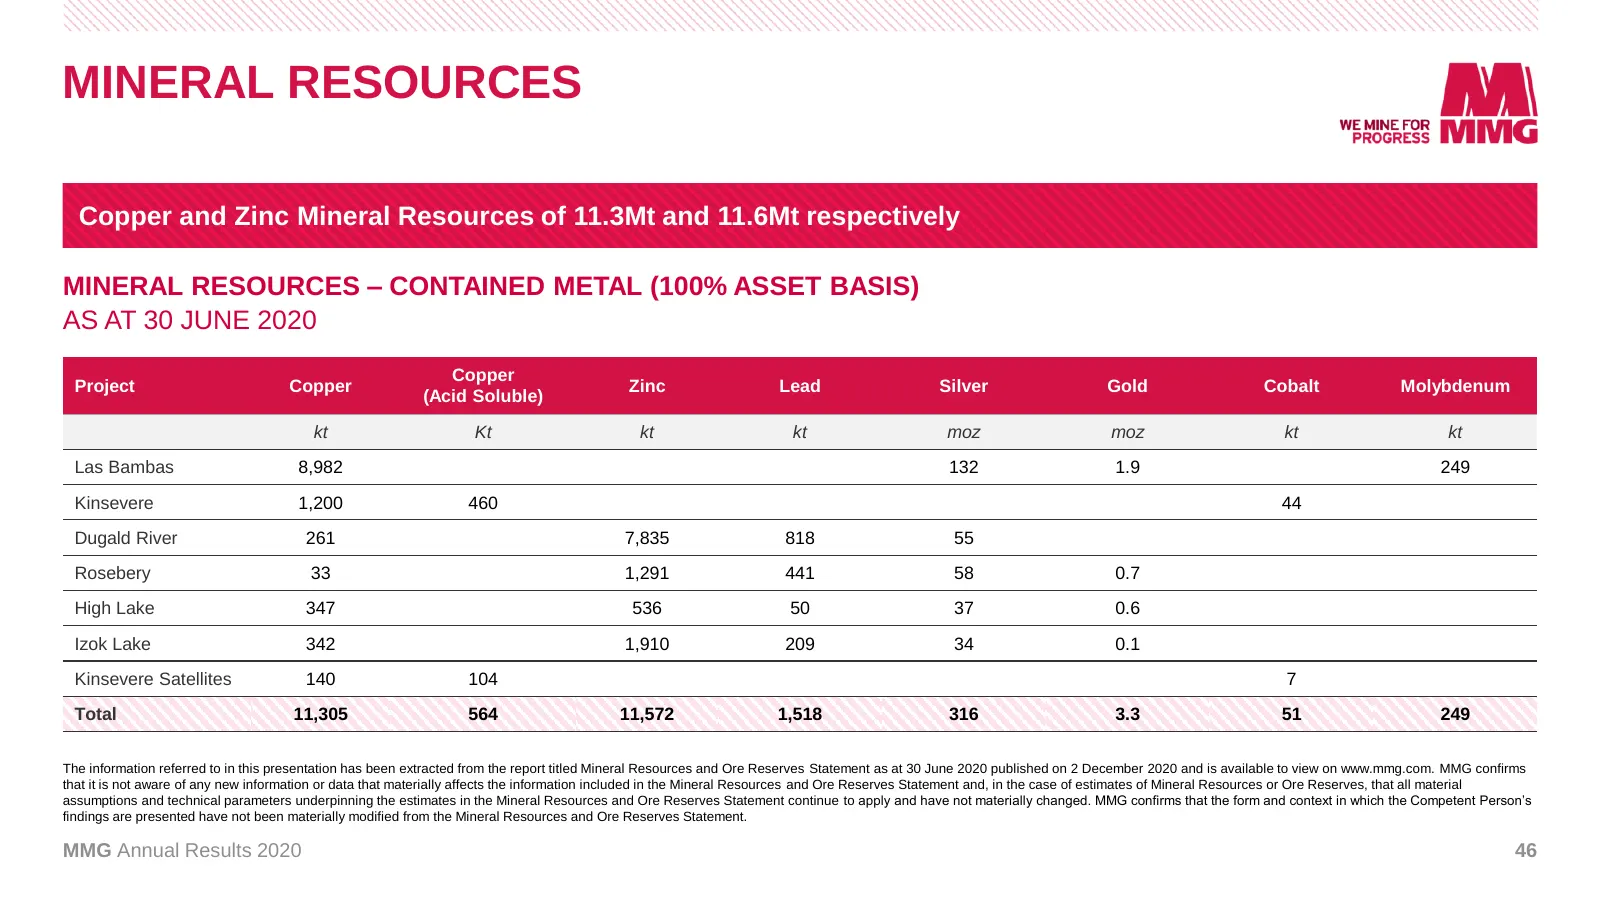
MINERAL RESOURCES Copper and Zinc Mineral Resources of 11.3Mt and 11.6Mt respectively MINERAL RESOURCES – CONTAINED METAL (100% ASSET BASIS) AS AT 30 JUNE 2020 Copper Project Copper Zinc Lead Silver Gold Cobalt Molybdenum (Acid Soluble) kt Kt kt kt moz moz kt kt Las Bambas 8,982 132 1.9 249 Kinsever
Slide 47: Ore Reserves
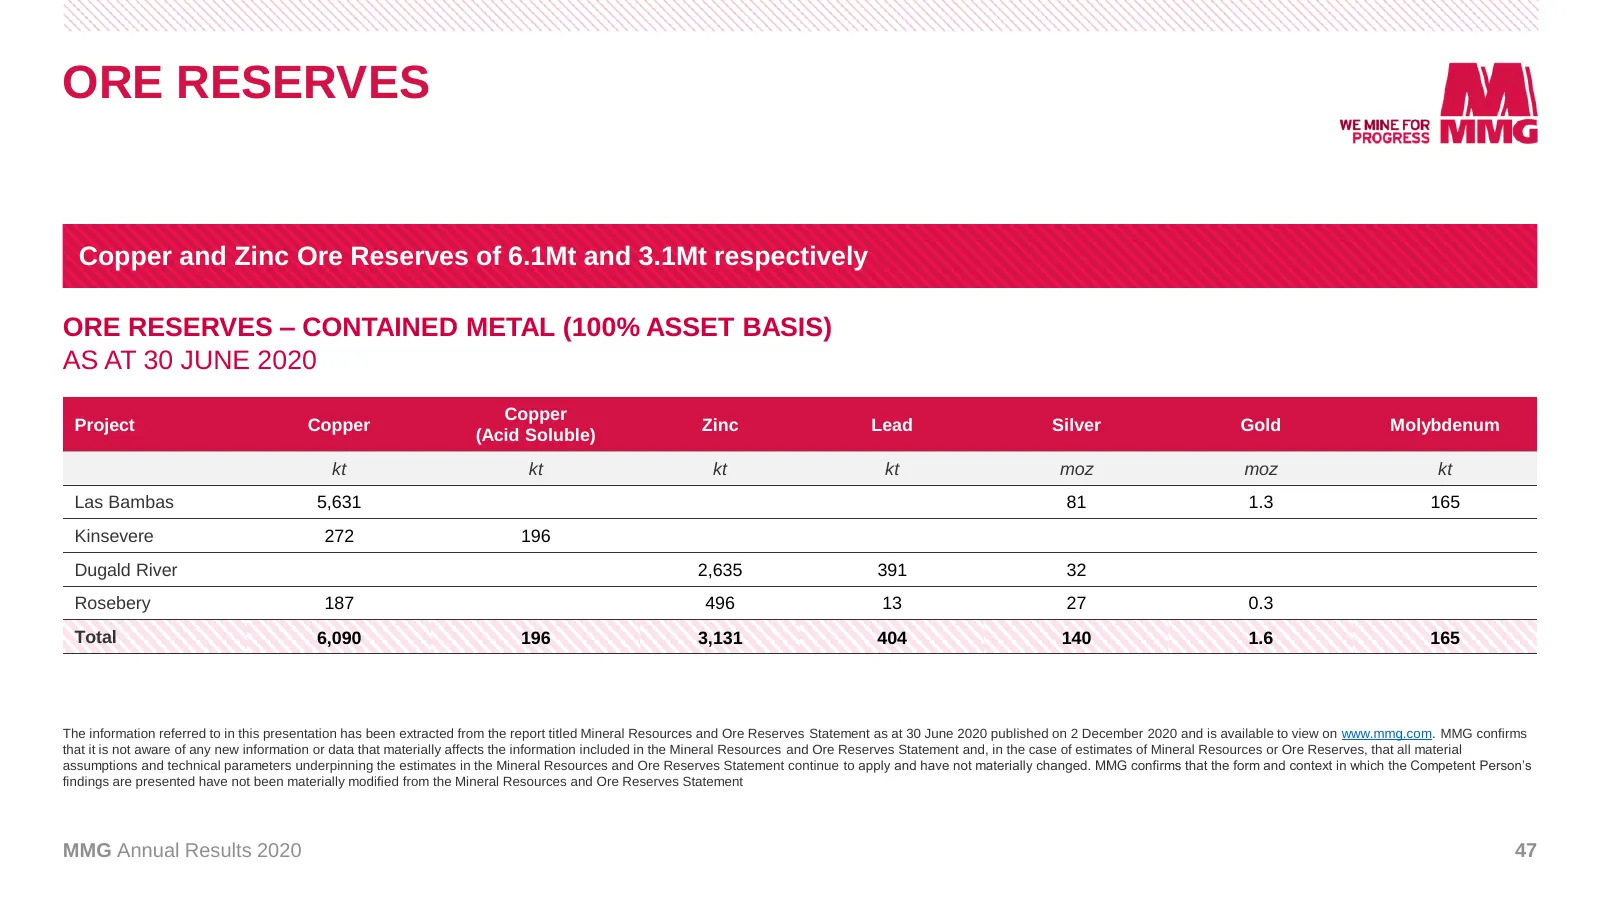
ORE RESERVES Copper and Zinc Ore Reserves of 6.1Mt and 3.1Mt respectively ORE RESERVES – CONTAINED METAL (100% ASSET BASIS) AS AT 30 JUNE 2020 Copper Project Copper Zinc Lead Silver Gold Molybdenum (Acid Soluble) kt kt kt kt moz moz kt Las Bambas 5,631 81 1.3 165 Kinsevere 272 196 Dugald River 2,635
Slide 48
Source: Internet Archive copy of mmg.com
More decks from MMG Ltd.
 H1 2026 Earnings Presentation45 slides · Aug 12, 2026
 Investor Presentation (May 2026)40 slides · May 2026
 FY2025 Earnings Presentation48 slides · Mar 4, 2026
 Morgan Stanley Twenty Fourth APAC Summit 202531 slides · November 2025
 H1 2025 Earnings Presentation41 slides · Aug 13, 2025
 H1 2025 Earnings Presentation41 slides · August 2025