Mobile Infrastructure Corporation · NASDAQ:BEEP
Mobile Infrastructure — Q3 2026 Earnings Presentation
26 slides from Mobile Infrastructure's earnings presentation, November 2026
Slide 1: Investor Presentation 3rd Quarter 2026
INVESTOR PRESENTATION 3rd Quarter 2026
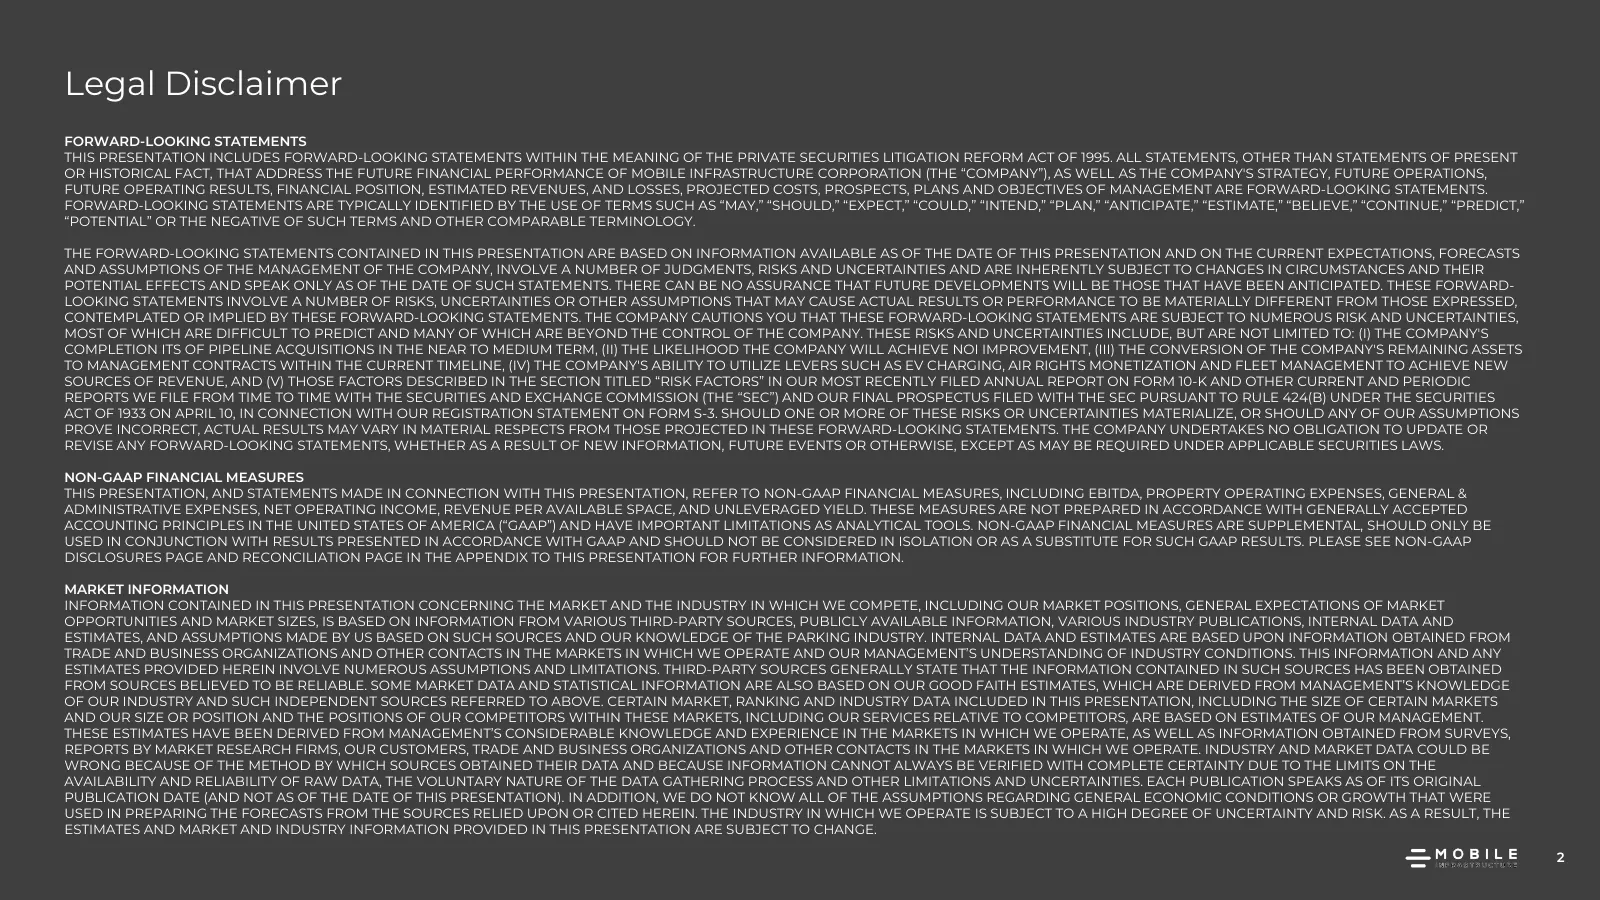
Slide 2: Legal Disclaimer
Legal Disclaimer FORWARD-LOOKING STATEMENTS THIS PRESENTATION INCLUDES FORWARD-LOOKING STATEMENTS WITHIN THE MEANING OF THE PRIVATE SECURITIES LITIGATION REFORM ACT OF 1995. ALL STATEMENTS, OTHER THAN STATEMENTS OF PRESENT OR HISTORICAL FACT, THAT ADDRESS THE FUTURE FINANCIAL PERFORMANCE OF MOBILE I
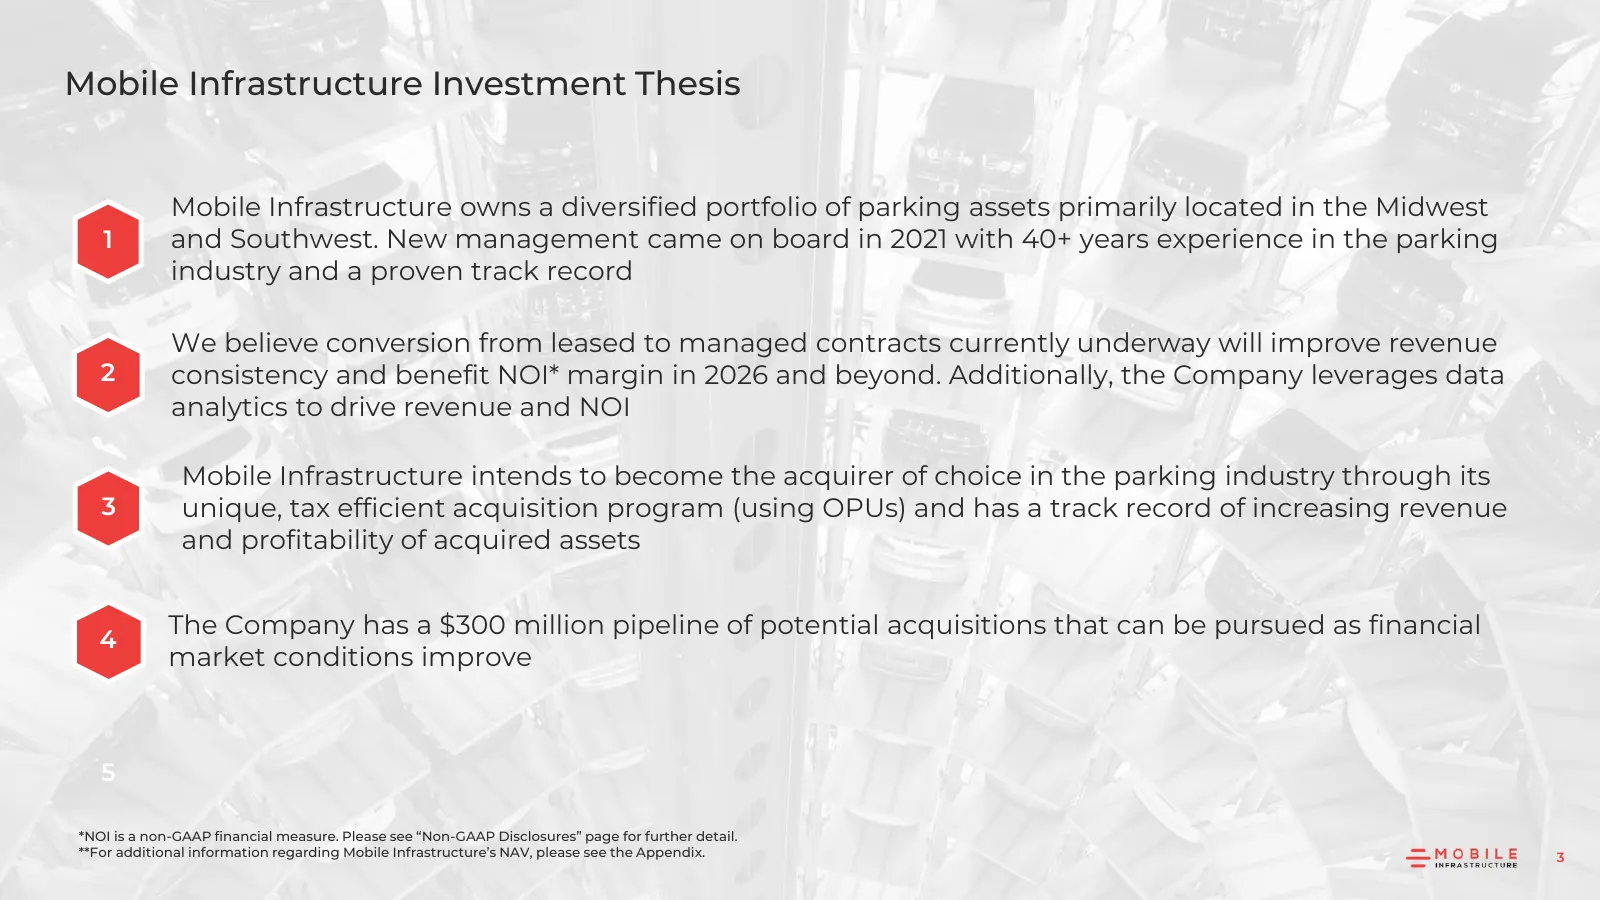
Slide 3: Mobile Infrastructure Investment Thesis
Mobile Infrastructure Investment Thesis Mobile Infrastructure owns a diversified portfolio of parking assets primarily located in the Midwest 1 and Southwest. New management came on board in 2021 with 40+ years experience in the parking industry and a proven track record We believe conversion from l
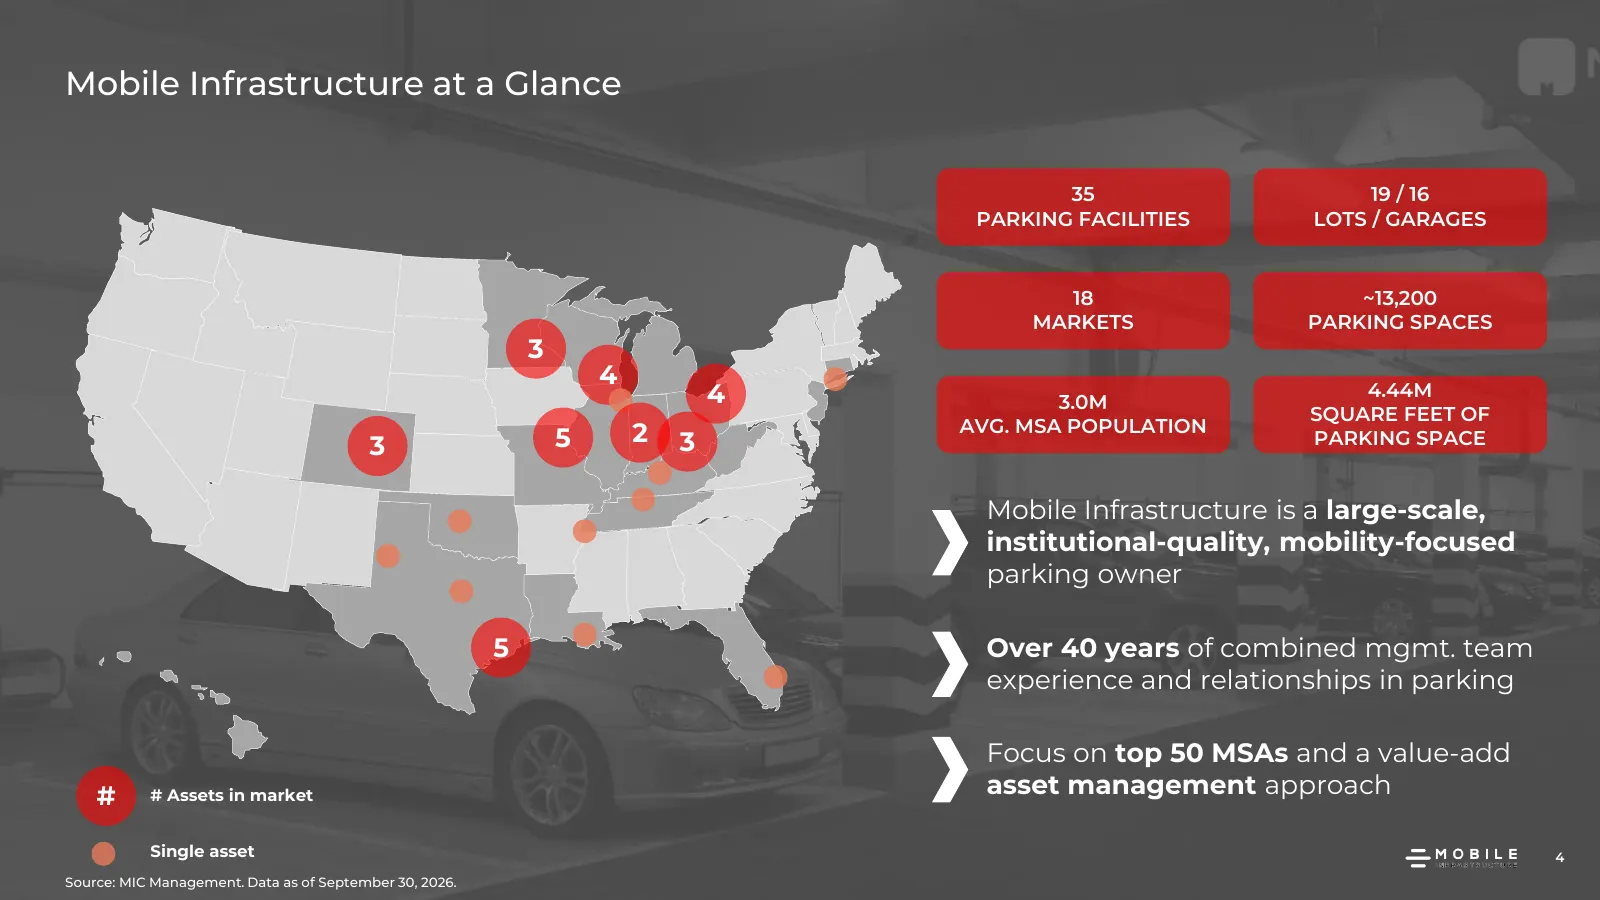
Slide 4: Mobile Infrastructure at a Glance
Mobile Infrastructure at a Glance 35 19 / 16 PARKING FACILITIES LOTS / GARAGES 18 ~13,200 MARKETS PARKING SPACES 3 4 4 3.0M 4.44M SQUARE FEET OF 2 AVG. MSA POPULATION 3 5 3 PARKING SPACE Mobile Infrastructure is a large-scale, institutional-quality, mobility-focused parking owner 5 Over 40 years of
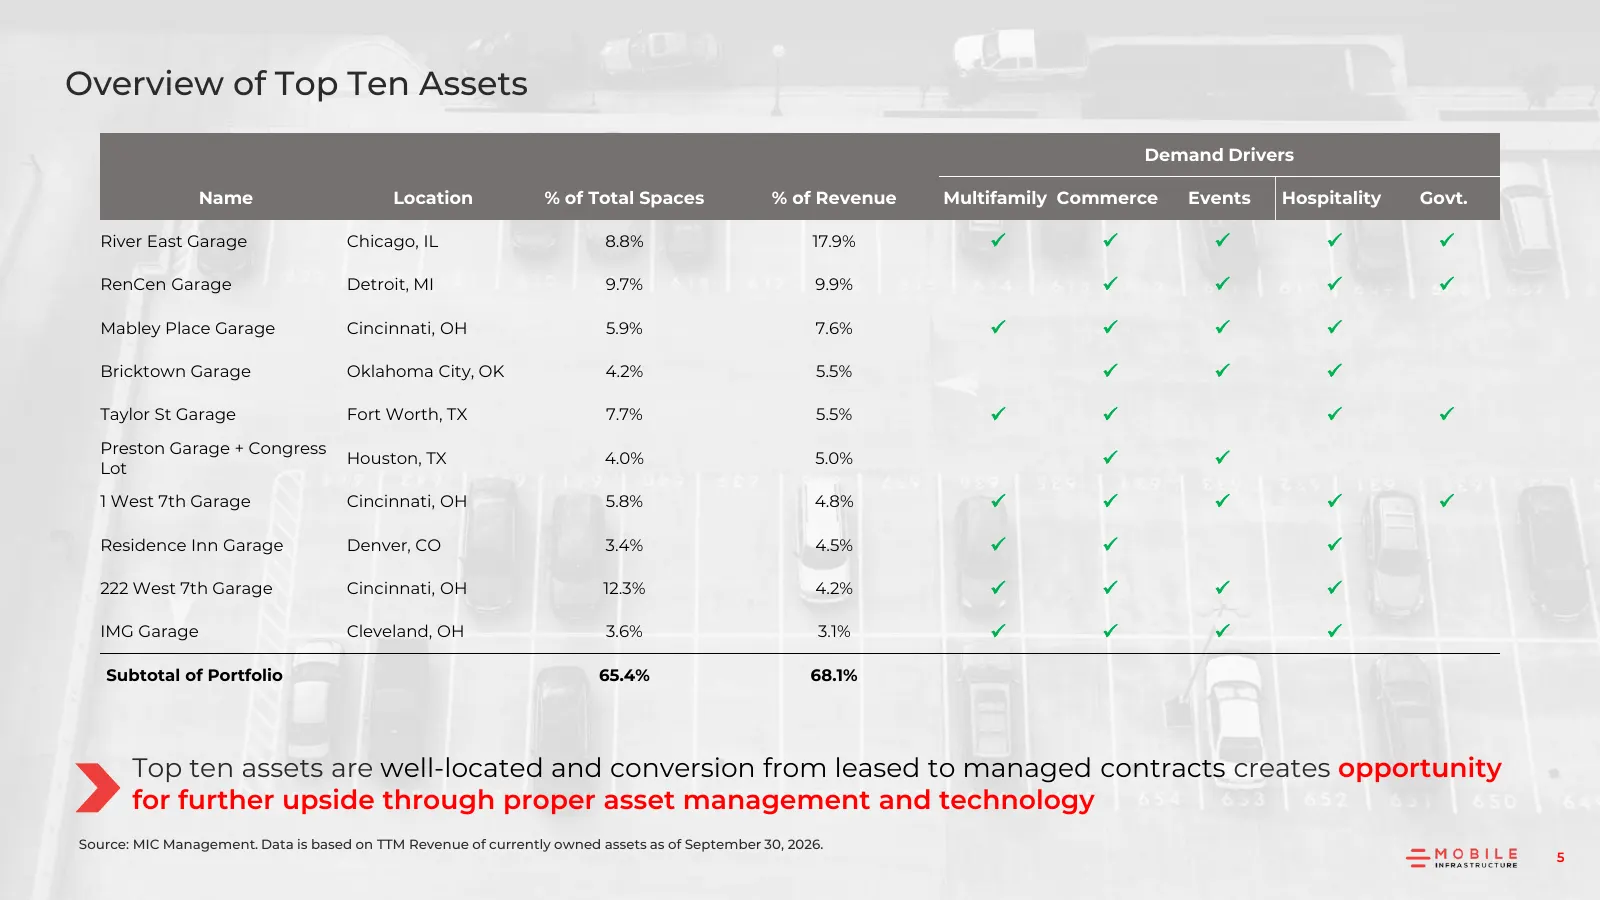
Slide 5: Overview of Top Ten Assets
Overview of Top Ten Assets Demand Drivers Name Location % of Total Spaces % of Revenue Multifamily Commerce Events Hospitality Govt. River East Garage Chicago, IL 8.8% 17.9% ✓ ✓ ✓ ✓ ✓ RenCen Garage Detroit, MI 9.7% 9.9% ✓ ✓ ✓ ✓ Mabley Place Garage Cincinnati, OH 5.9% 7.6% ✓ ✓ ✓ ✓ Bricktown Garage Ok
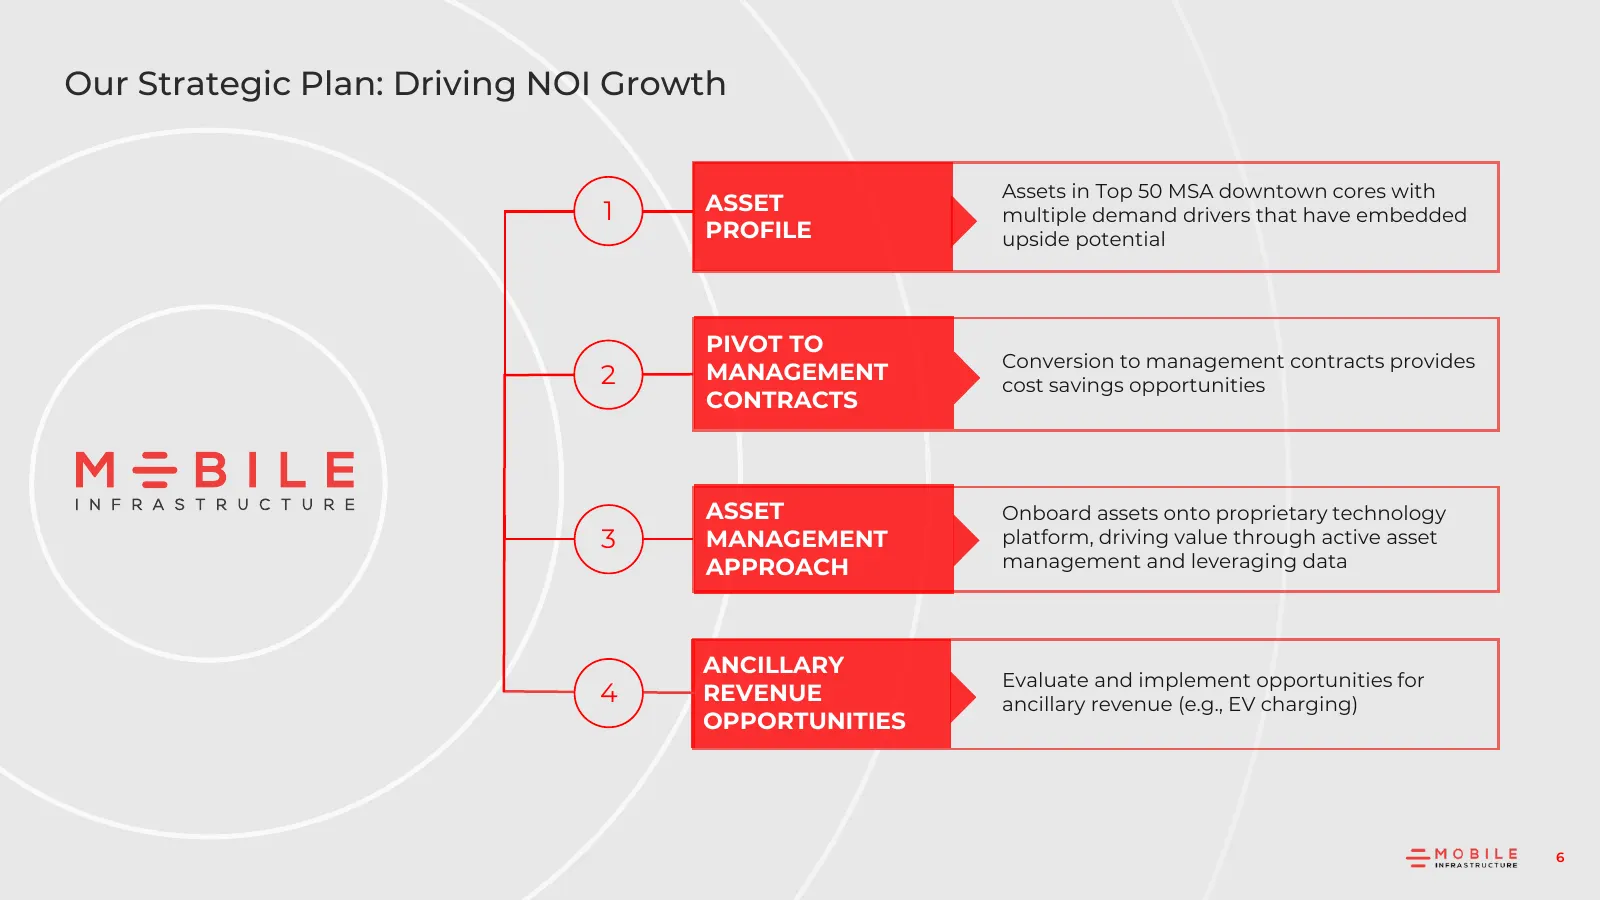
Slide 6: Our Strategic Plan: Driving NOI Growth
Our Strategic Plan: Driving NOI Growth Assets in Top 50 MSA downtown cores with 1 ASSET multiple demand drivers that have embedded PROFILE upside potential PIVOT TO Conversion to management contracts provides 2 MANAGEMENT cost savings opportunities CONTRACTS ASSET Onboard assets onto proprietary tec
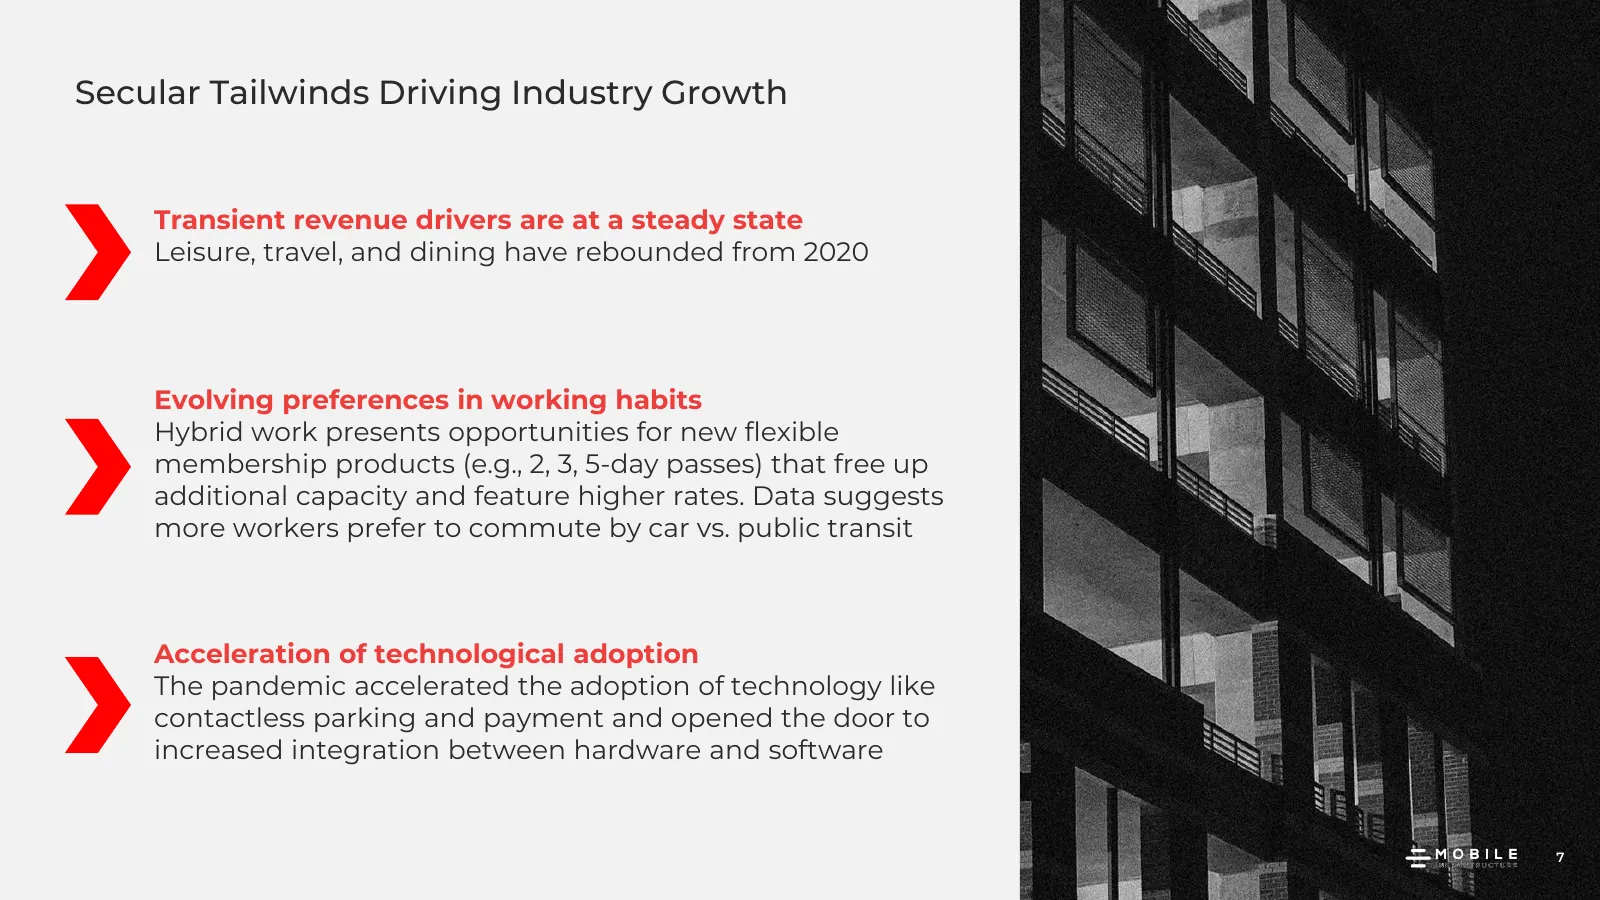
Slide 7: Secular Tailwinds Driving Industry Growth
Secular Tailwinds Driving Industry Growth Transient revenue drivers are at a steady state Leisure, travel, and dining have rebounded from 2020 Evolving preferences in working habits Hybrid work presents opportunities for new flexible membership products (e.g., 2, 3, 5-day passes) that free up additi
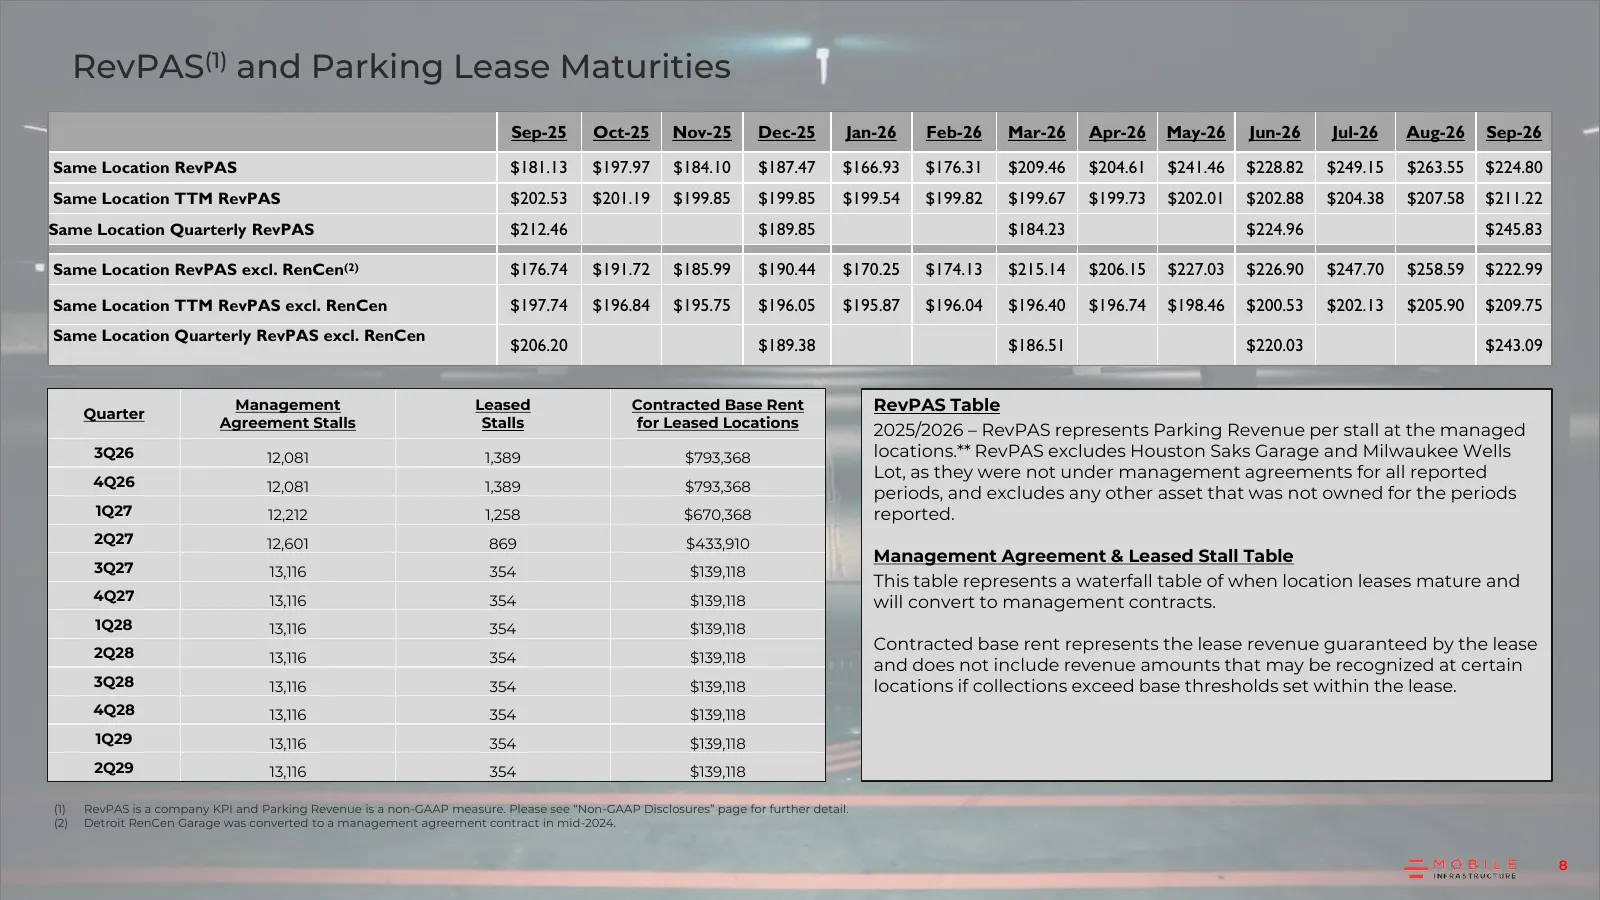
Slide 8: RevPAS and Parking Lease Maturities
RevPAS(1) and Parking Lease Maturities Sep-25 Oct-25 Nov-25 Dec-25 Jan-26 Feb-26 Mar-26 Apr-26 May-26 Jun-26 Jul-26 Aug-26 Sep-26 Same Location RevPAS $181.13 $197.97 $184.10 $187.47 $166.93 $176.31 $209.46 $204.61 $241.46 $228.82 $249.15 $263.55 $224.80 Same Location TTM RevPAS $202.53 $201.19 $199
Slide 9: Asset Overview
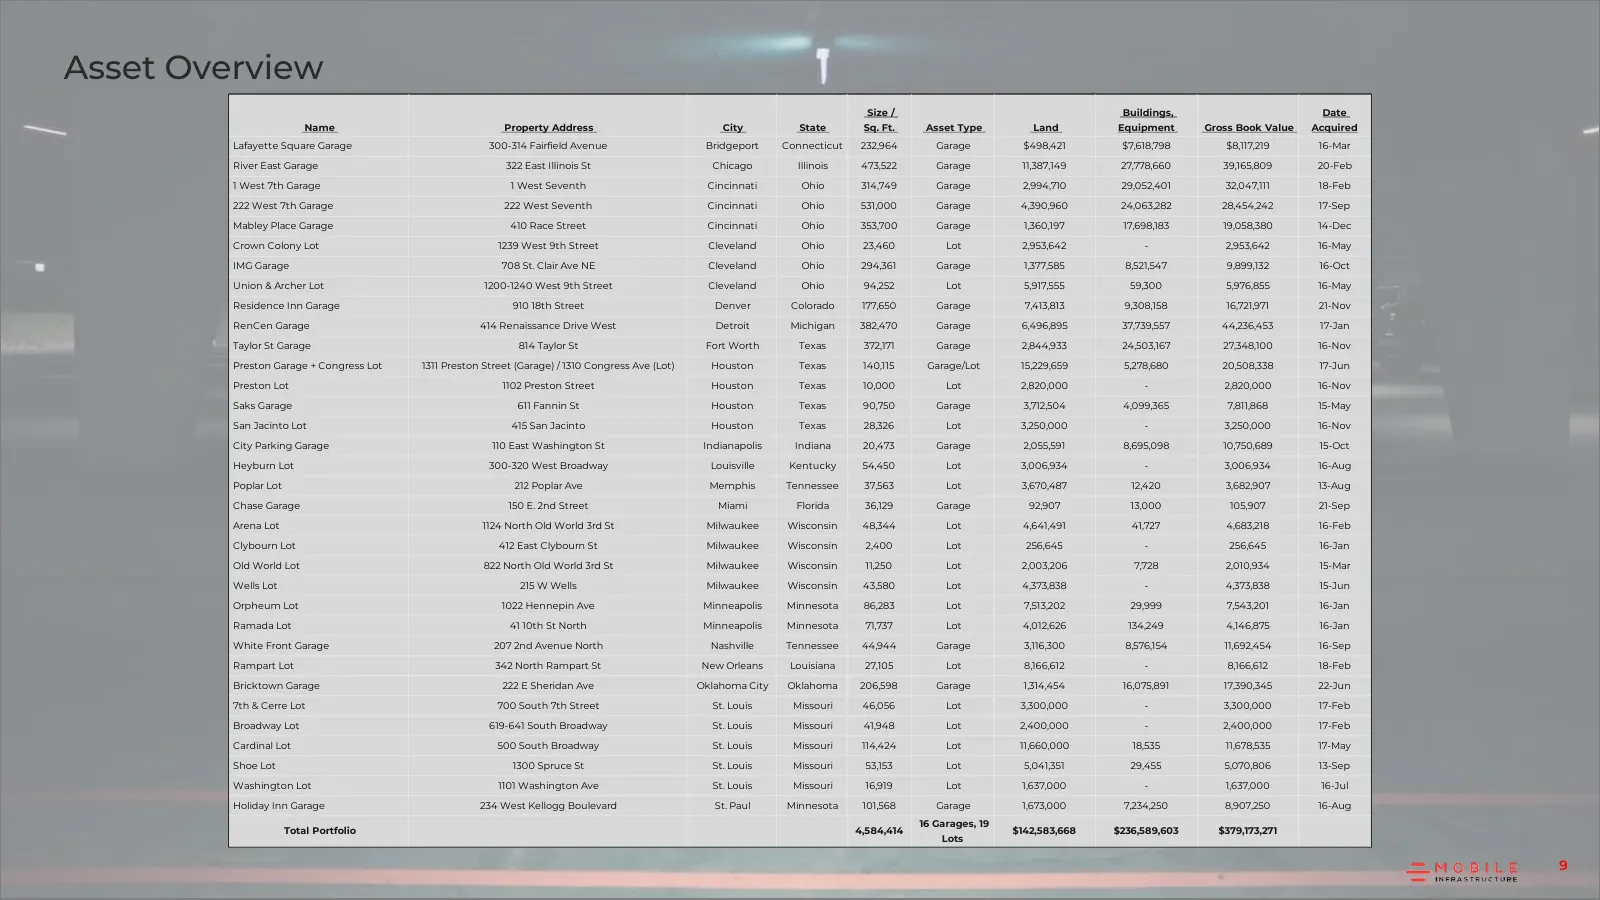
Asset Overview Size / Buildings, Date Name Property Address City State Sq. Ft. Asset Type Land Equipment Gross Book Value Acquired Lafayette Square Garage 300-314 Fairfield Avenue Bridgeport Connecticut 232,964 Garage $498,421 $7,618,798 $8,117,219 16-Mar River East Garage 322 East Illinois St Chica
Slide 10: Today vs. The Future
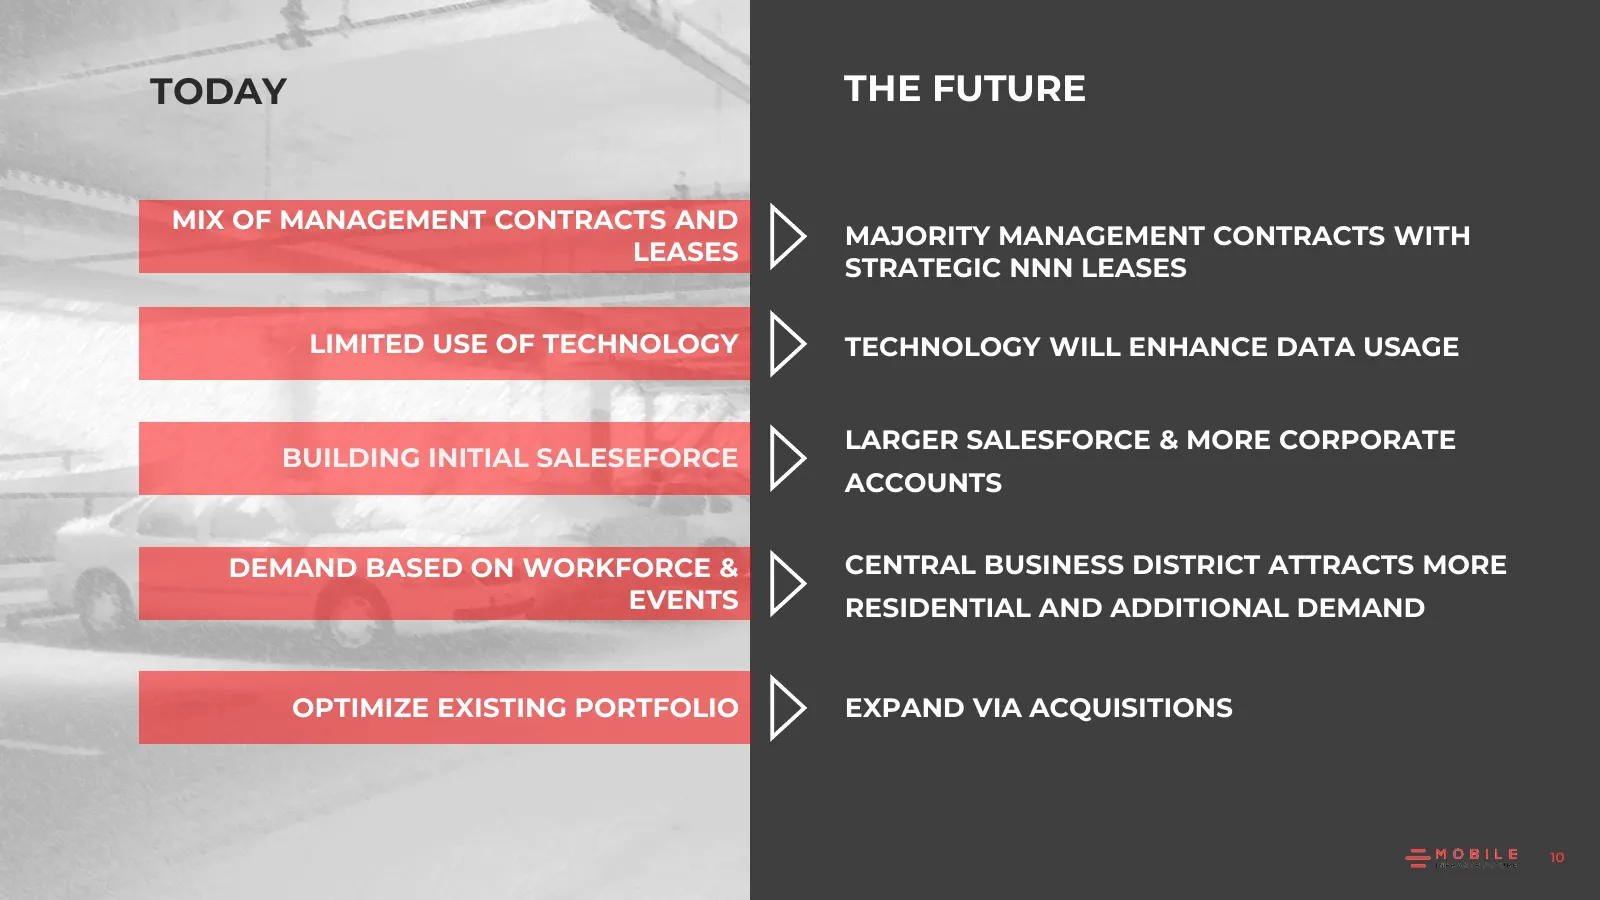
TODAY THE FUTURE MIX OF MANAGEMENT CONTRACTS AND MAJORITY MANAGEMENT CONTRACTS WITH LEASES STRATEGIC NNN LEASES LIMITED USE OF TECHNOLOGY TECHNOLOGY WILL ENHANCE DATA USAGE LARGER SALESFORCE & MORE CORPORATE BUILDING INITIAL SALESEFORCE ACCOUNTS DEMAND BASED ON WORKFORCE & CENTRAL BUSINESS DISTRICT
Slide 11: Future Company & Portfolio Repositioning
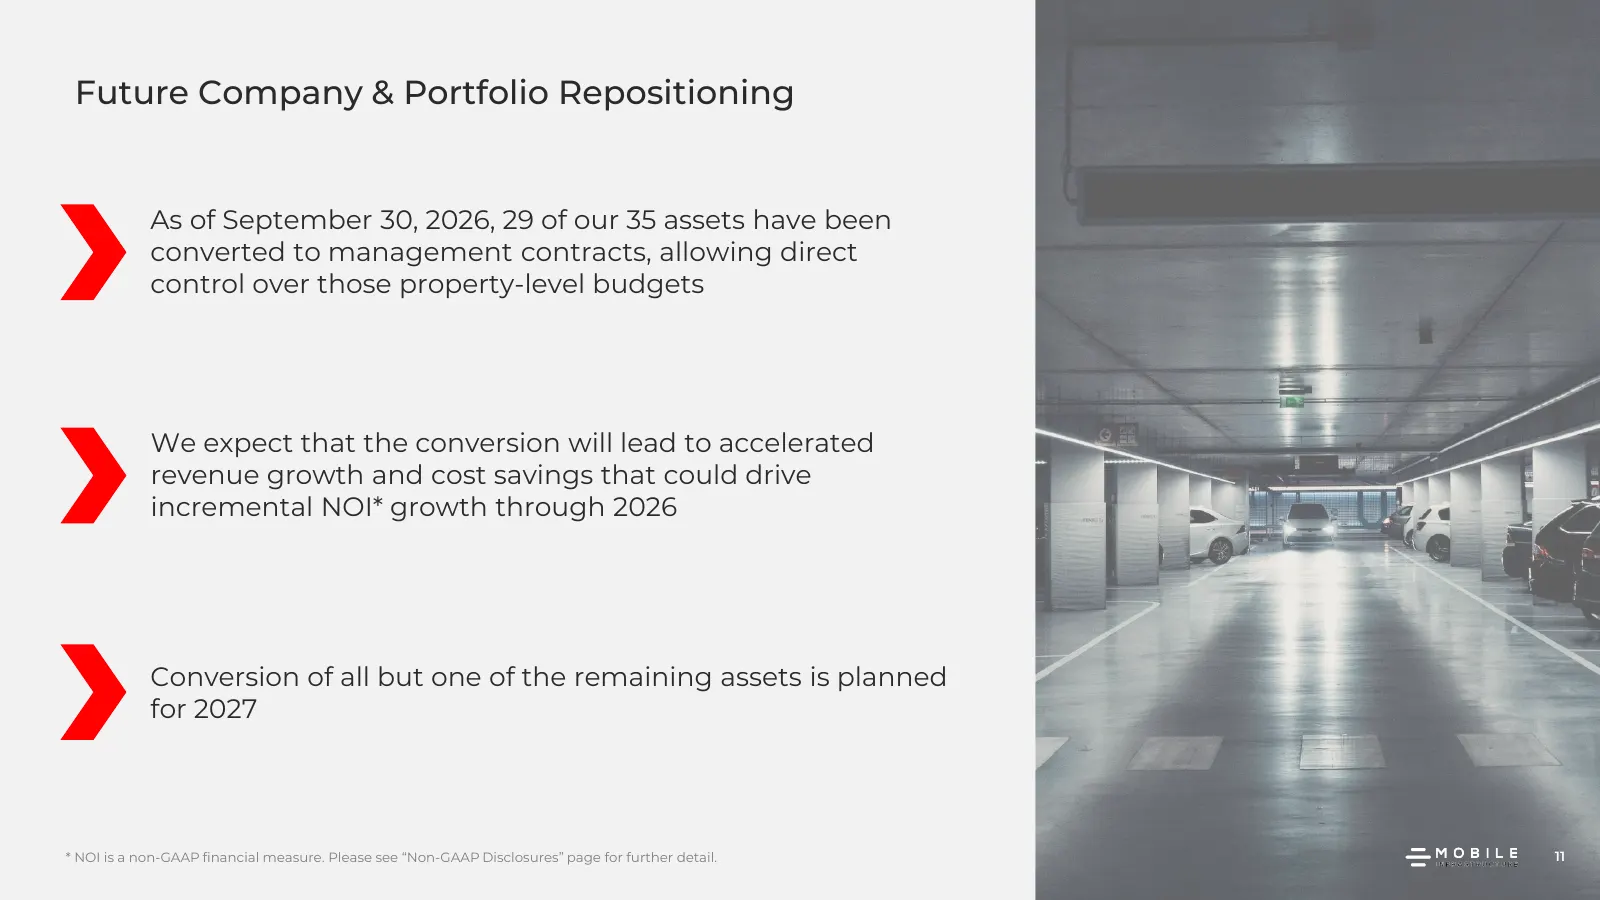
Future Company & Portfolio Repositioning As of September 30, 2026, 29 of our 35 assets have been converted to management contracts, allowing direct control over those property-level budgets We expect that the conversion will lead to accelerated revenue growth and cost savings that could drive increm
Slide 12: Advantages of Management Contracts
Advantages of Management Contracts 1 Ability to leverage Mobile’s experienced management team to accelerate growth 2 Better control and management of expenses 3 Ability to ramp-up marketing as appropriate 4 Improved data visibility of parking usage and demand metrics 12
Slide 13: The U.S. Parking Industry is Massive
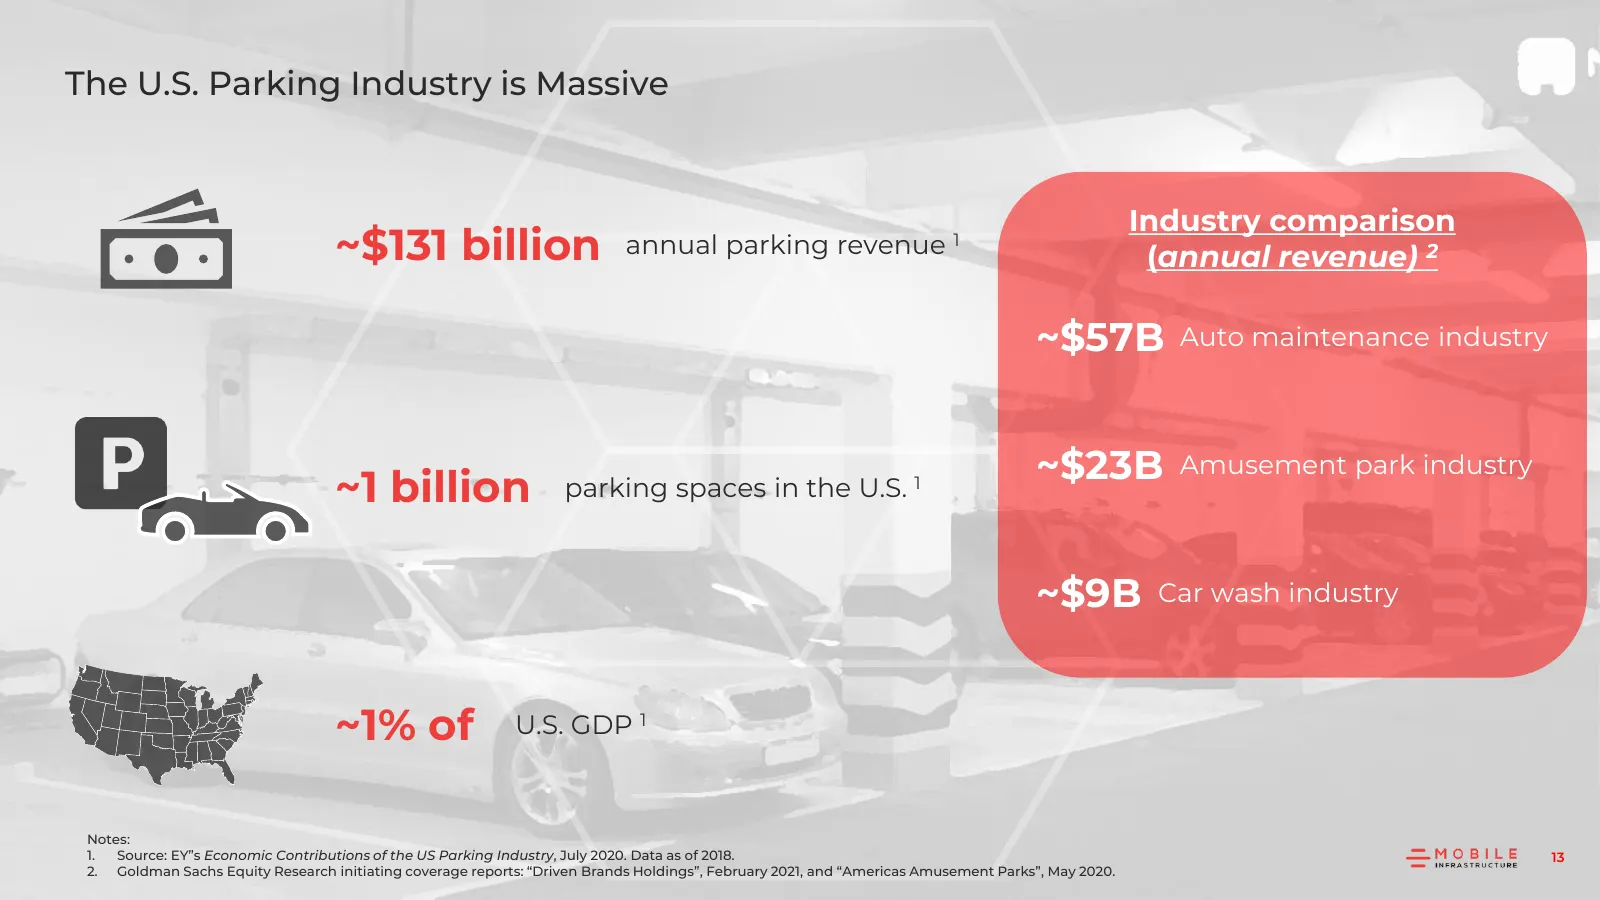
The U.S. Parking Industry is Massive Industry comparison ~$131 billion annual parking revenue 1 (annual revenue) 2 ~$57B Auto maintenance industry ~$23B Amusement park industry ~1 billion parking spaces in the U.S. 1 ~$9B Car wash industry ~1% of U.S. GDP 1 Notes: 1. Source: EY”s Economic Contributi
Slide 14: Mobile Infrastructure Is Well-Positioned
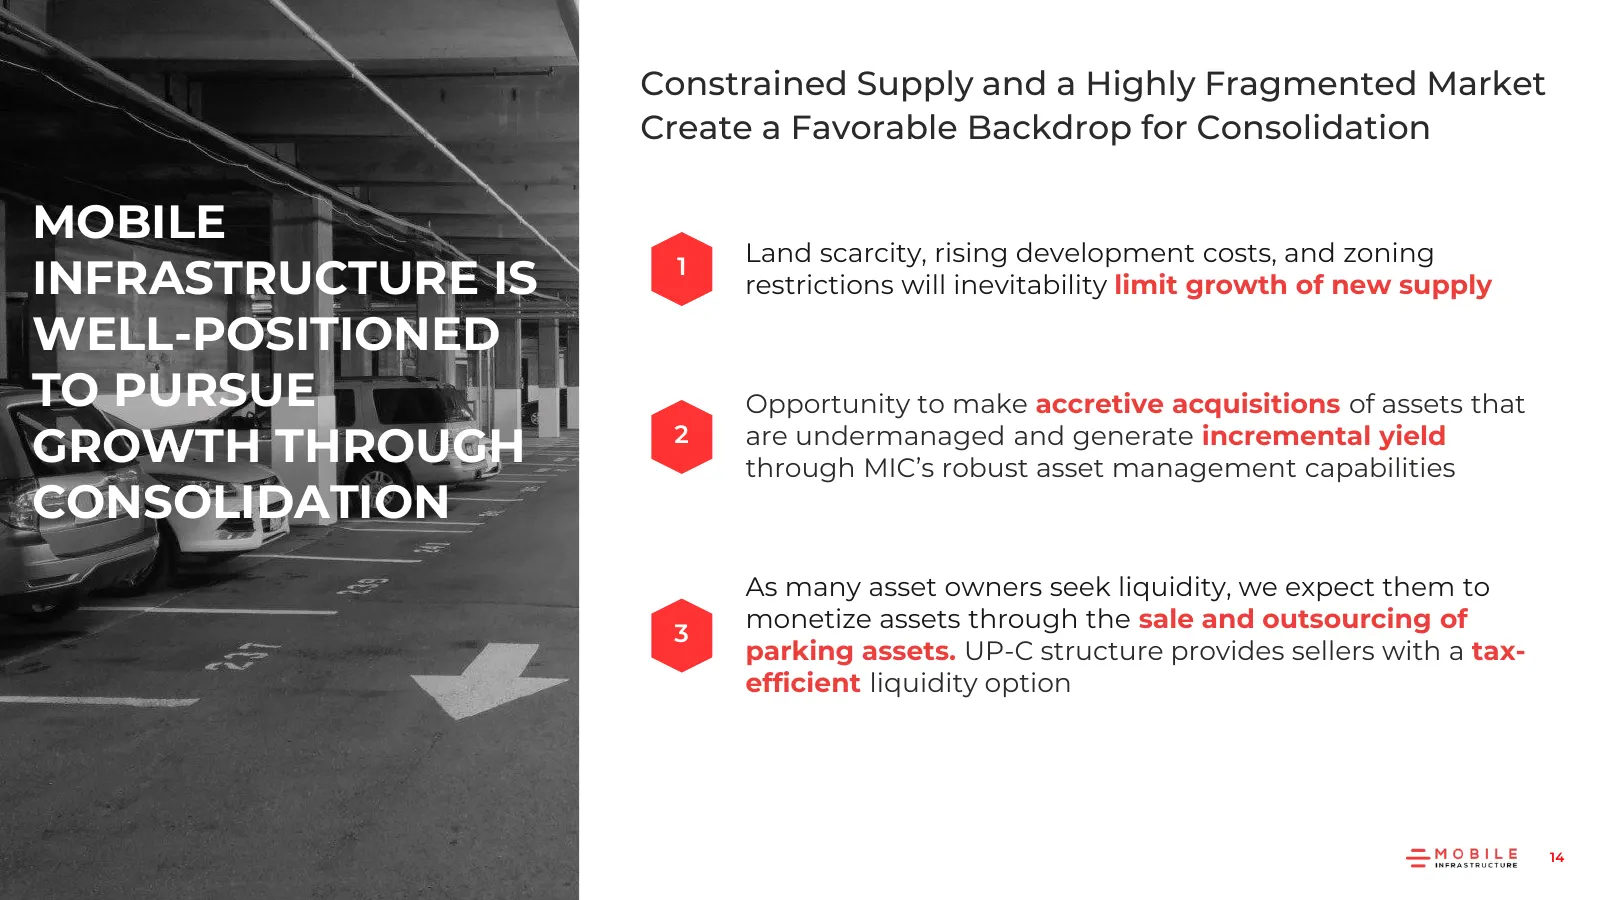
Constrained Supply and a Highly Fragmented Market Create a Favorable Backdrop for Consolidation MOBILE Land scarcity, rising development costs, and zoning INFRASTRUCTURE IS 1 restrictions will inevitability limit growth of new supply WELL-POSITIONED TO PURSUE Opportunity to make accretive acquisitio
Slide 15: Acquisition Approach
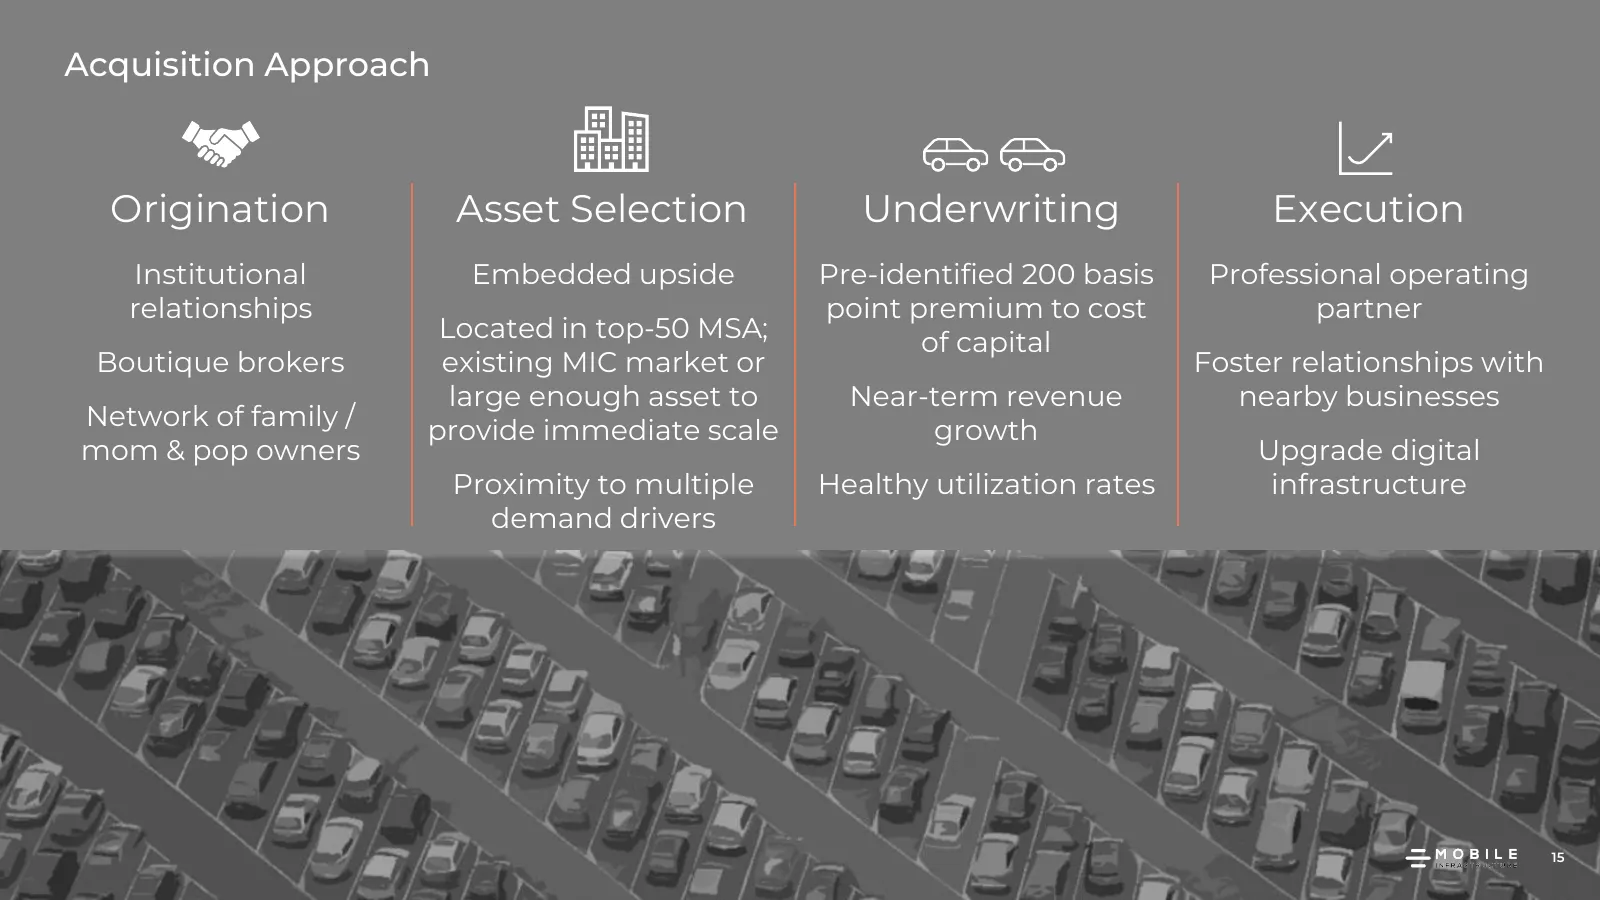
Acquisition Approach Origination Asset Selection Underwriting Execution Institutional Embedded upside Pre-identified 200 basis Professional operating relationships point premium to cost partner Located in top-50 MSA; of capital Boutique brokers existing MIC market or Foster relationships with large
Slide 16: Case study – Improving NOI: Residence Inn Garage (Denver, CO)
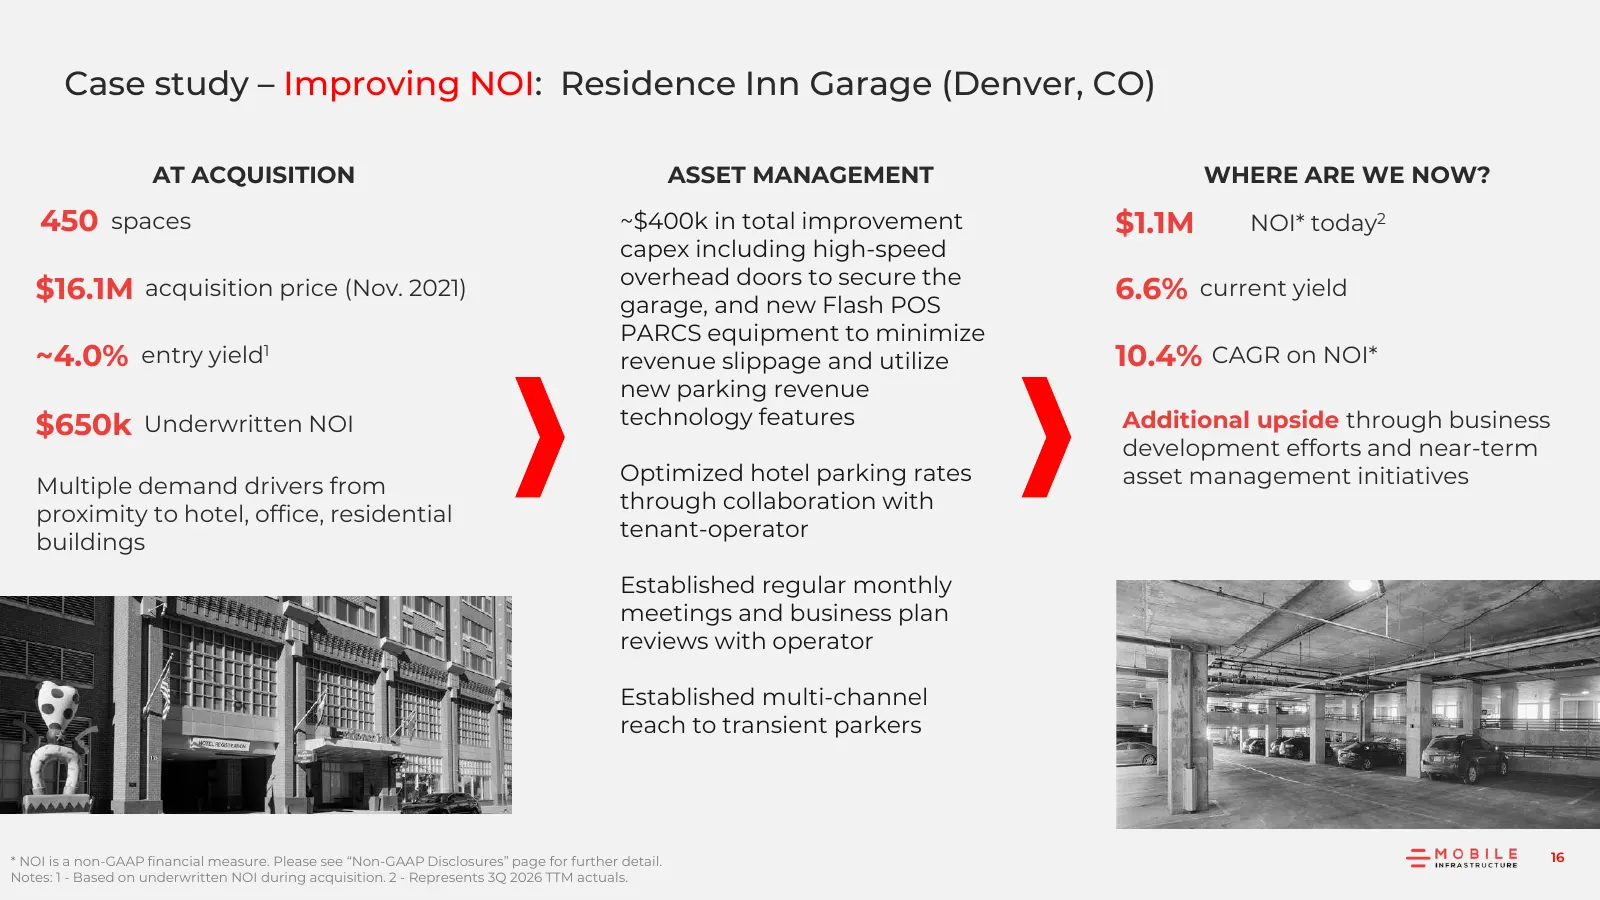
Case study – Improving NOI: Residence Inn Garage (Denver, CO) AT ACQUISITION ASSET MANAGEMENT WHERE ARE WE NOW? 450 spaces ~$400k in total improvement $1.1M NOI* today2 capex including high-speed overhead doors to secure the $16.1M acquisition price (Nov. 2021) garage, and new Flash POS 6.6% current
Slide 17: Case study – Improving NOI: River East Garage (Chicago, IL)
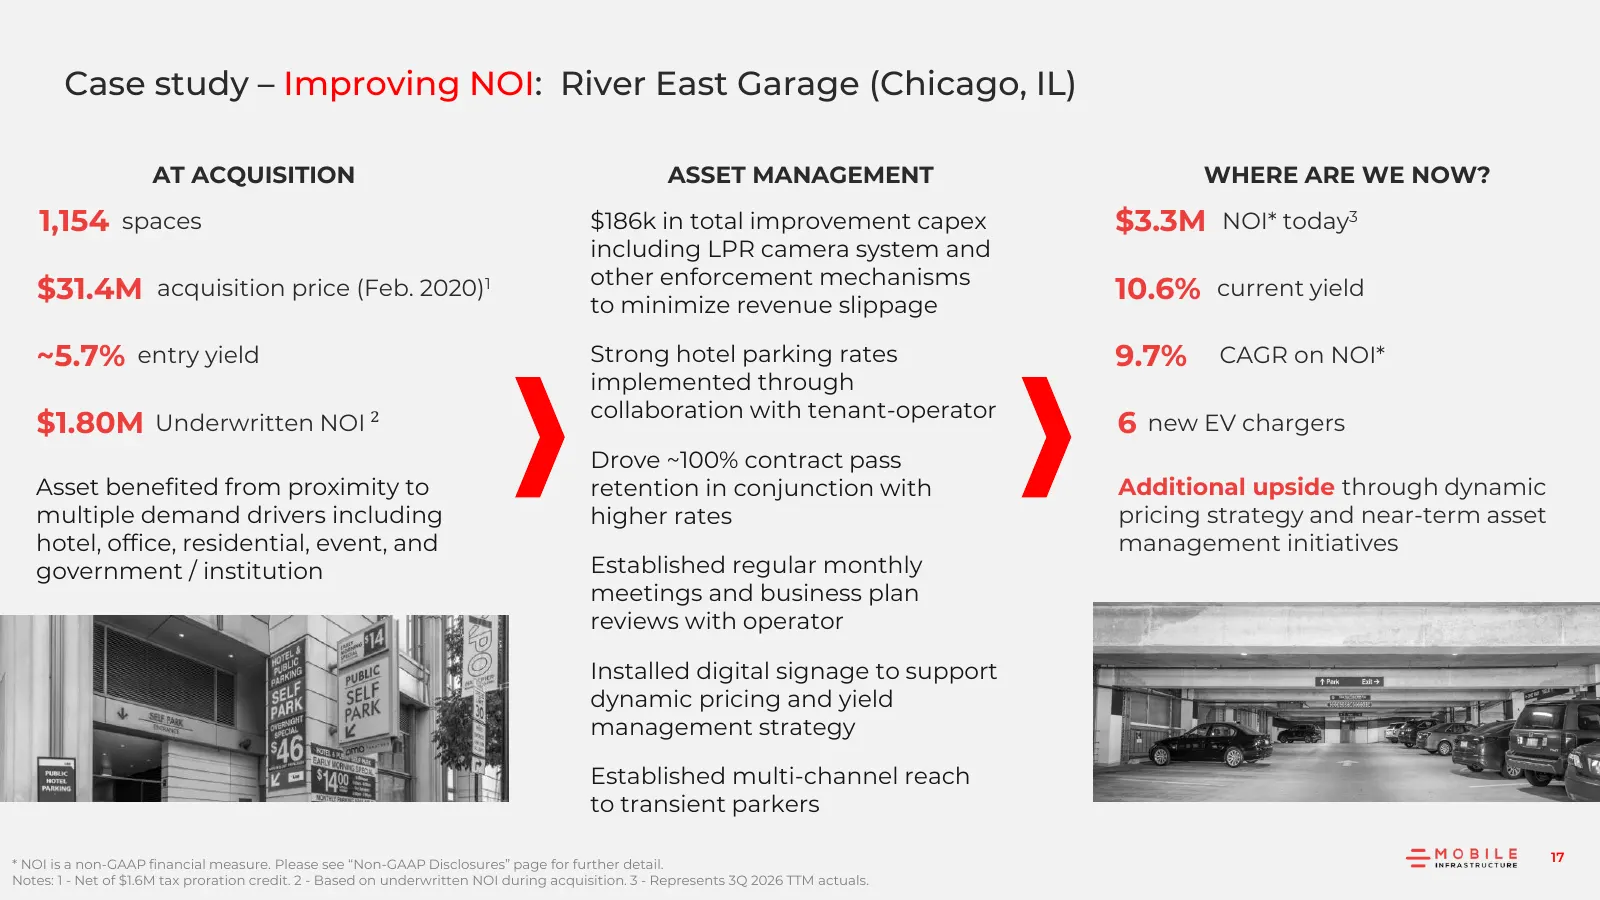
Case study – Improving NOI: River East Garage (Chicago, IL) AT ACQUISITION ASSET MANAGEMENT WHERE ARE WE NOW? 1,154 spaces $186k in total improvement capex $3.3M NOI* today3 including LPR camera system and other enforcement mechanisms $31.4M acquisition price (Feb. 2020)1 to minimize revenue slippag
Slide 18: Kastle RTO Tracker vs. MIC Performance
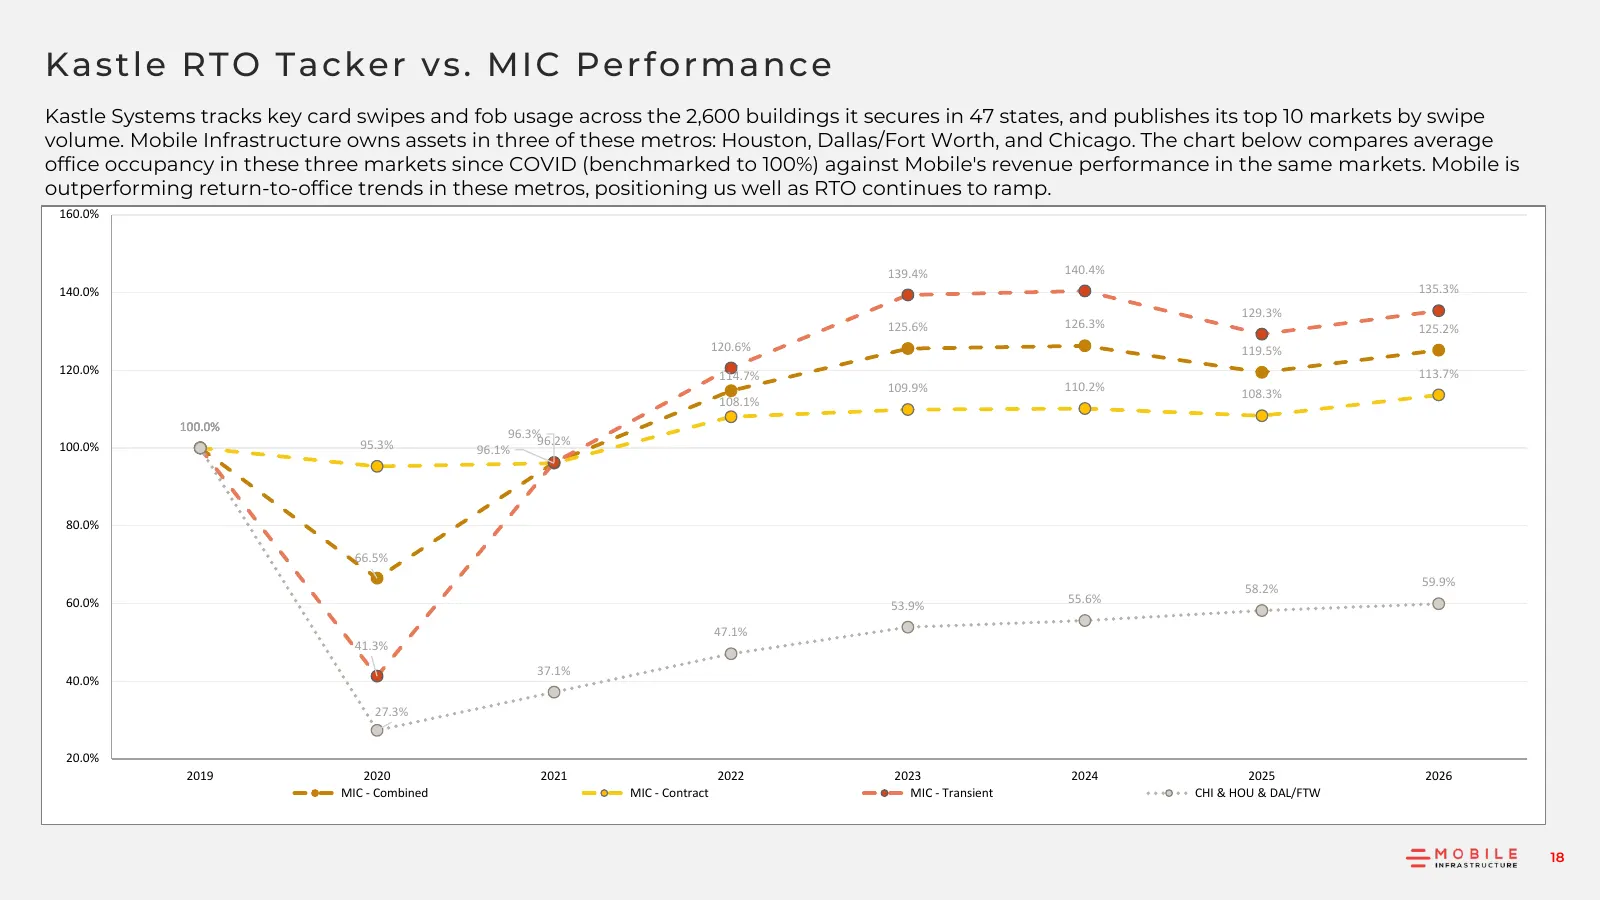
Ka s t l e RT O T a ck er vs . MI C P e rf o rm a n ce Kastle Systems tracks key card swipes and fob usage across the 2,600 buildings it secures in 47 states, and publishes its top 10 markets by swipe volume. Mobile Infrastructure owns assets in three of these metros: Houston, Dallas/Fort Worth, and
Slide 19: Portfolio Optimization Strategy
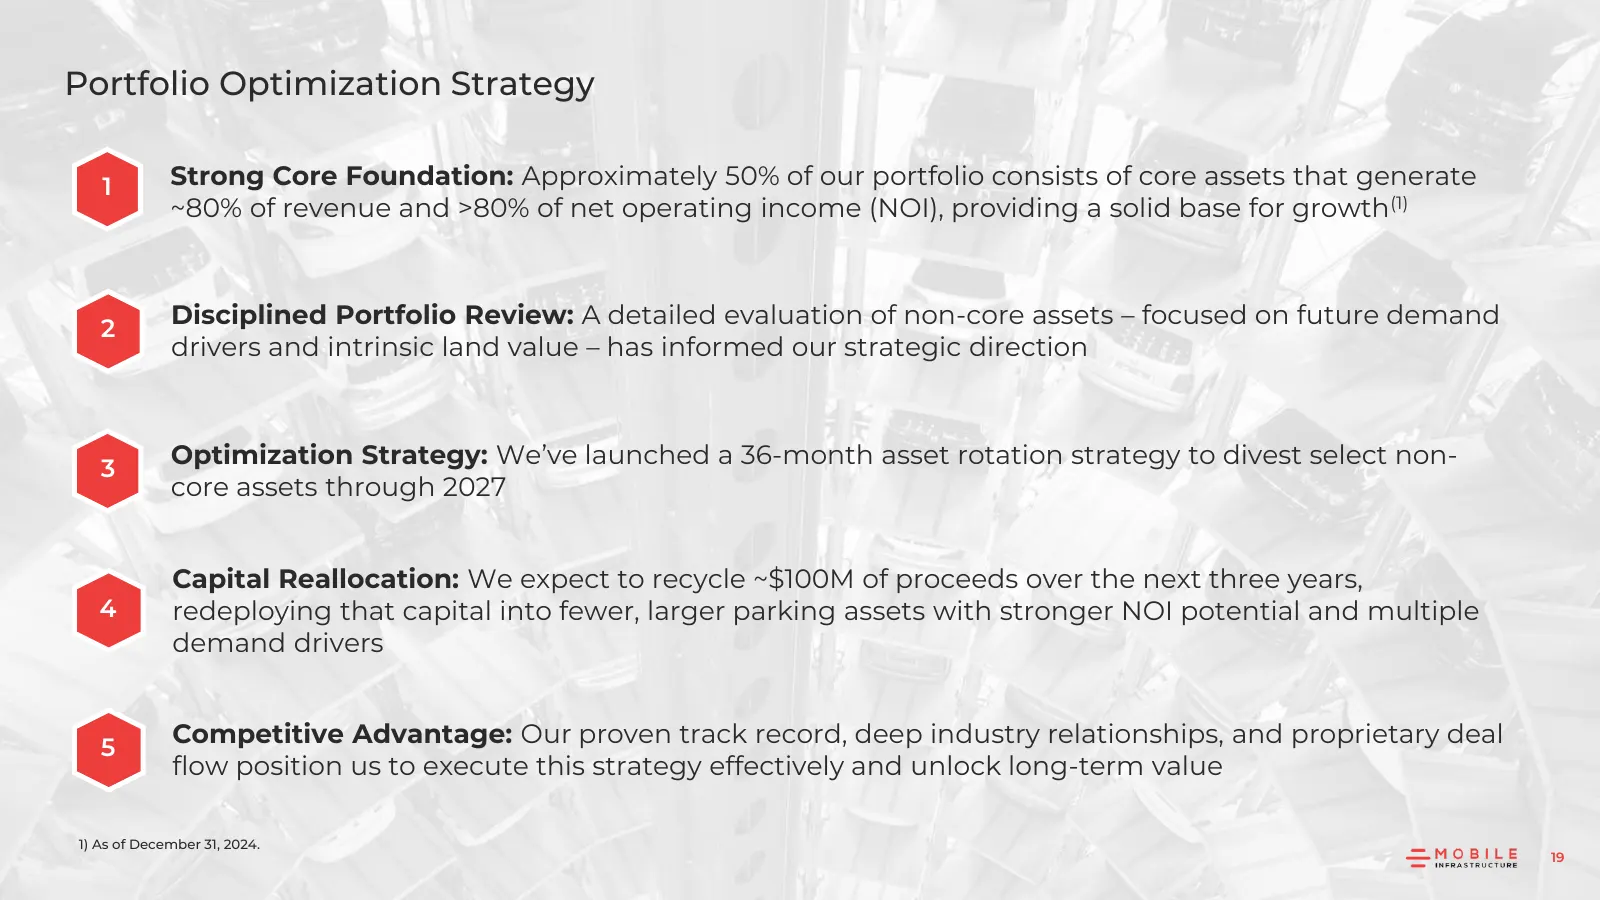
Portfolio Optimization Strategy 1 Strong Core Foundation: Approximately 50% of our portfolio consists of core assets that generate ~80% of revenue and >80% of net operating income (NOI), providing a solid base for growth(1) 2 Disciplined Portfolio Review: A detailed evaluation of non-core assets – f
Slide 20: Extensive Acquisition Pipeline Supports Long-Term Growth
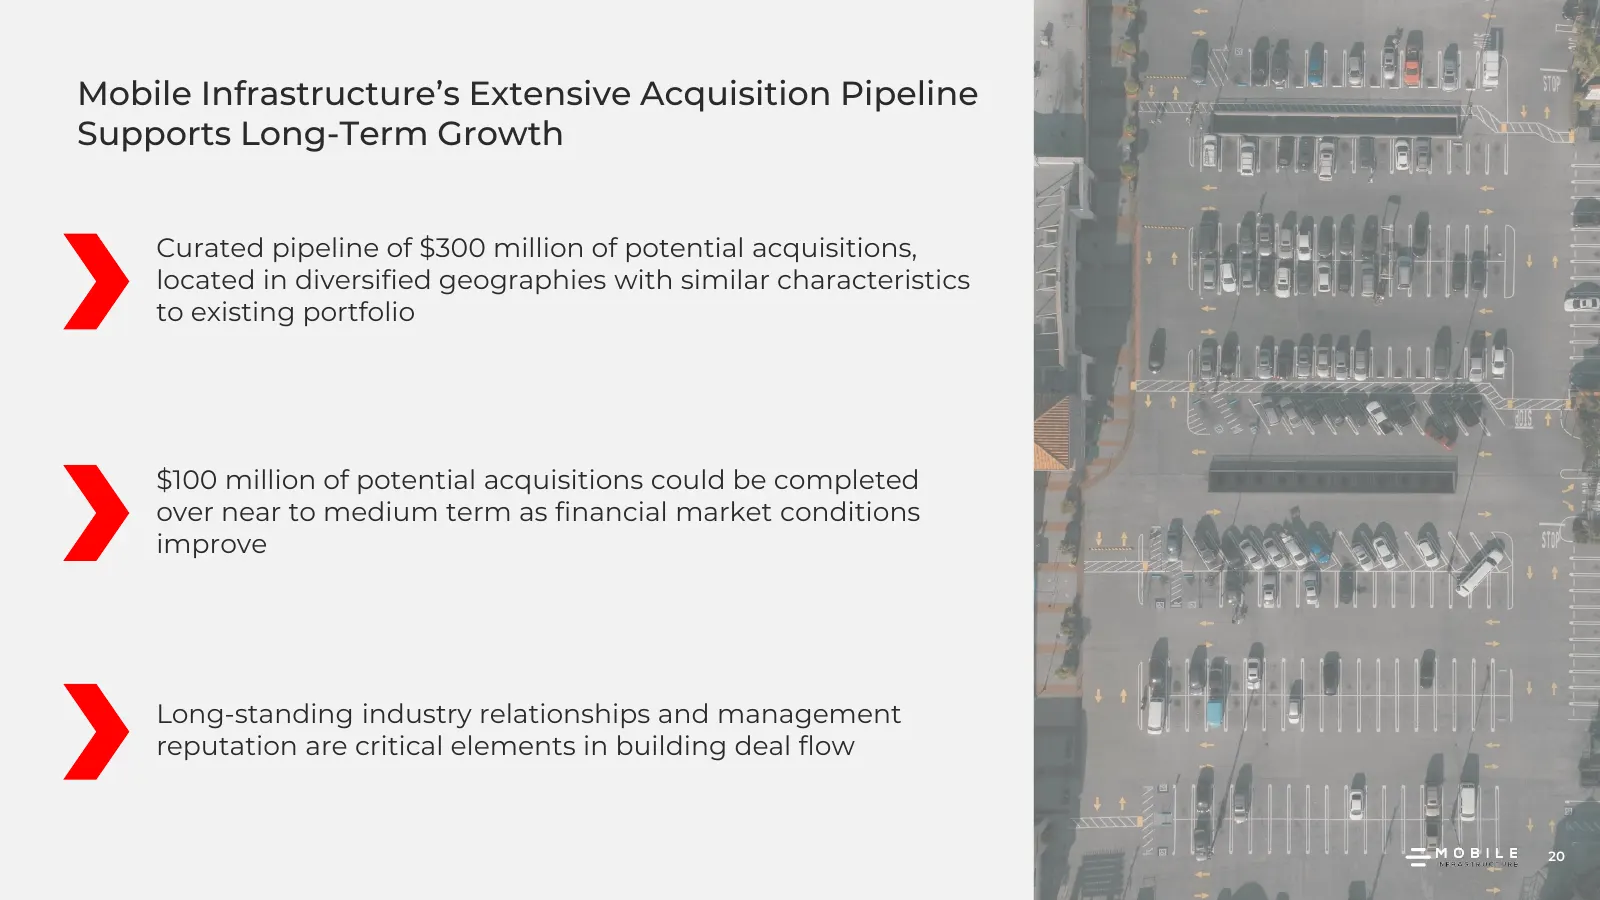
Mobile Infrastructure’s Extensive Acquisition Pipeline Supports Long-Term Growth Curated pipeline of $300 million of potential acquisitions, located in diversified geographies with similar characteristics to existing portfolio $100 million of potential acquisitions could be completed over near to me

Slide 21: Appendix
INFRASTRUCTURE APPENDIX
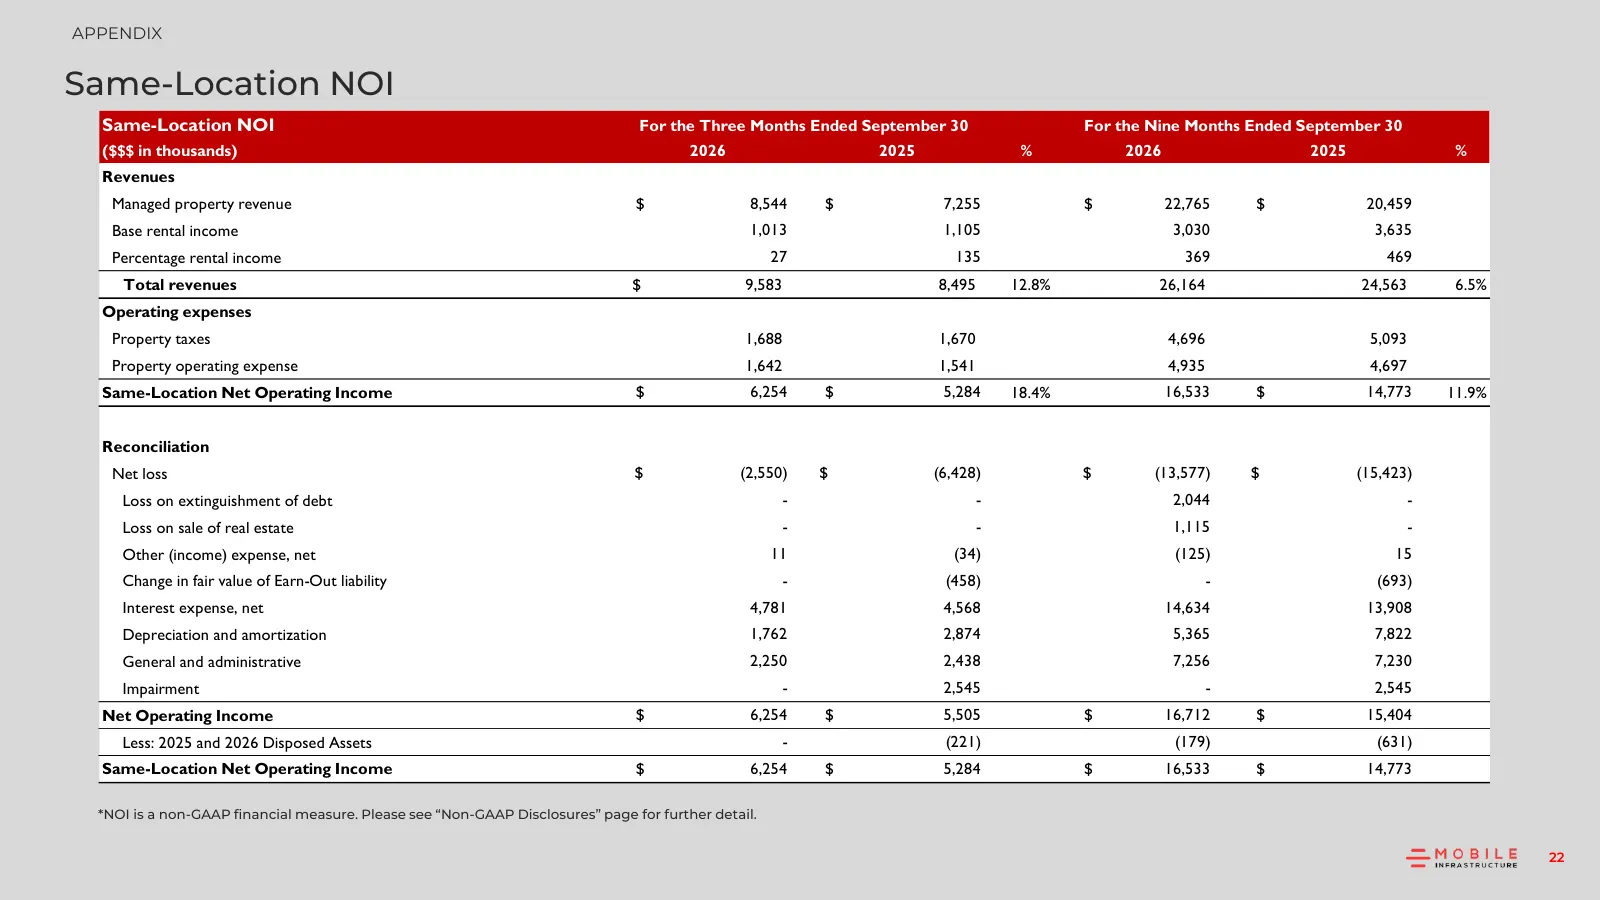
Slide 22: Same-Location NOI
APPENDIX Same-Location NOI Same-Location NOI For the Three Months Ended September 30 For the Nine Months Ended September 30 ($$$ in thousands) 2026 2025 % 2026 2025 % Revenues Managed property revenue $ 8,544 $ 7,255 $ 22,765 $ 20,459 Base rental income 1,013 1,105 3,030 3,635 Percentage rental inco
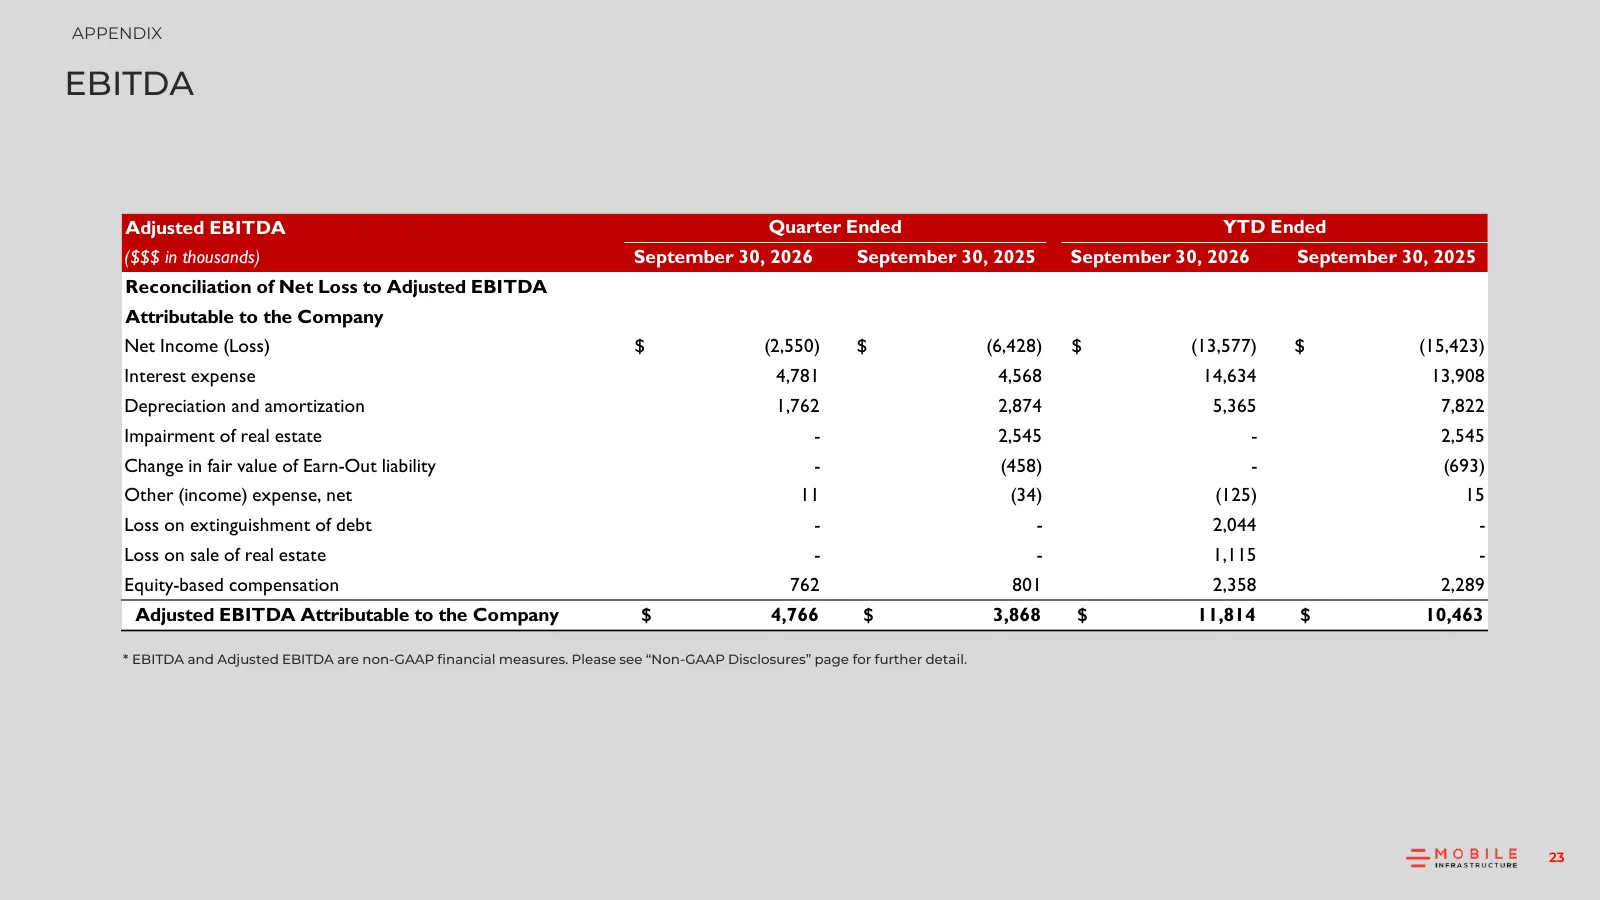
Slide 23: EBITDA
APPENDIX EBITDA Adjusted EBITDA Quarter Ended YTD Ended ($$$ in thousands) September 30, 2026 September 30, 2025 September 30, 2026 September 30, 2025 Reconciliation of Net Loss to Adjusted EBITDA Attributable to the Company Net Income (Loss) $ (2,550) $ (6,428) $ (13,577) $ (15,423) Interest expens
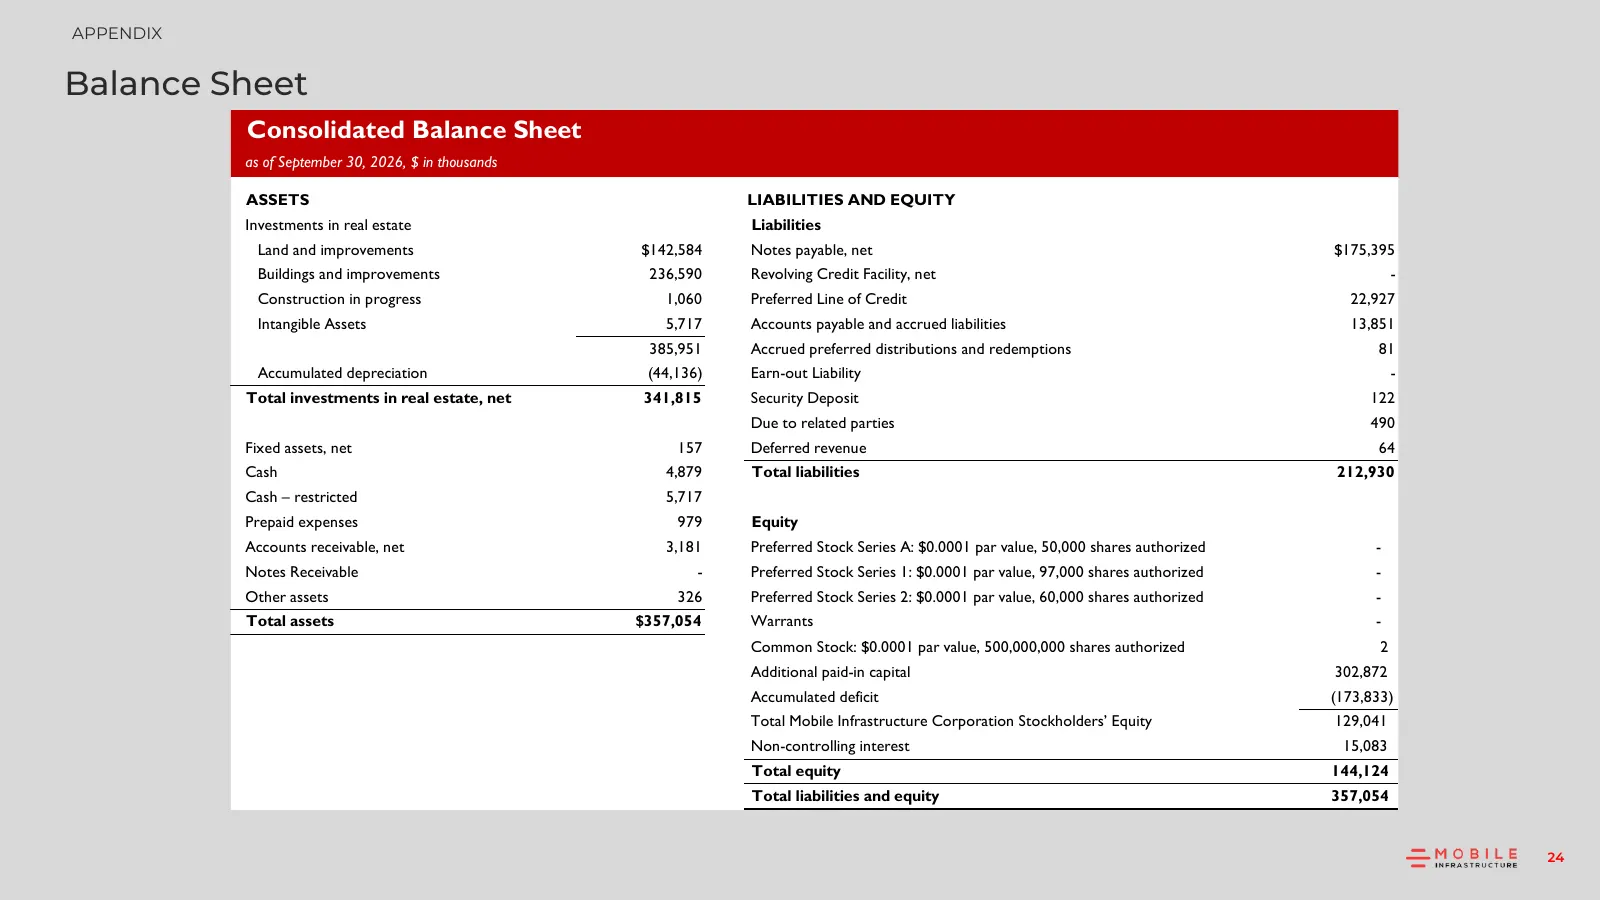
Slide 24: Balance Sheet
APPENDIX Balance Sheet Consolidated Balance Sheet as of September 30, 2026, $ in thousands ASSETS LIABILITIES AND EQUITY Investments in real estate Liabilities Land and improvements $142,584 Notes payable, net $175,395 Buildings and improvements 236,590 Revolving Credit Facility, net - Construction
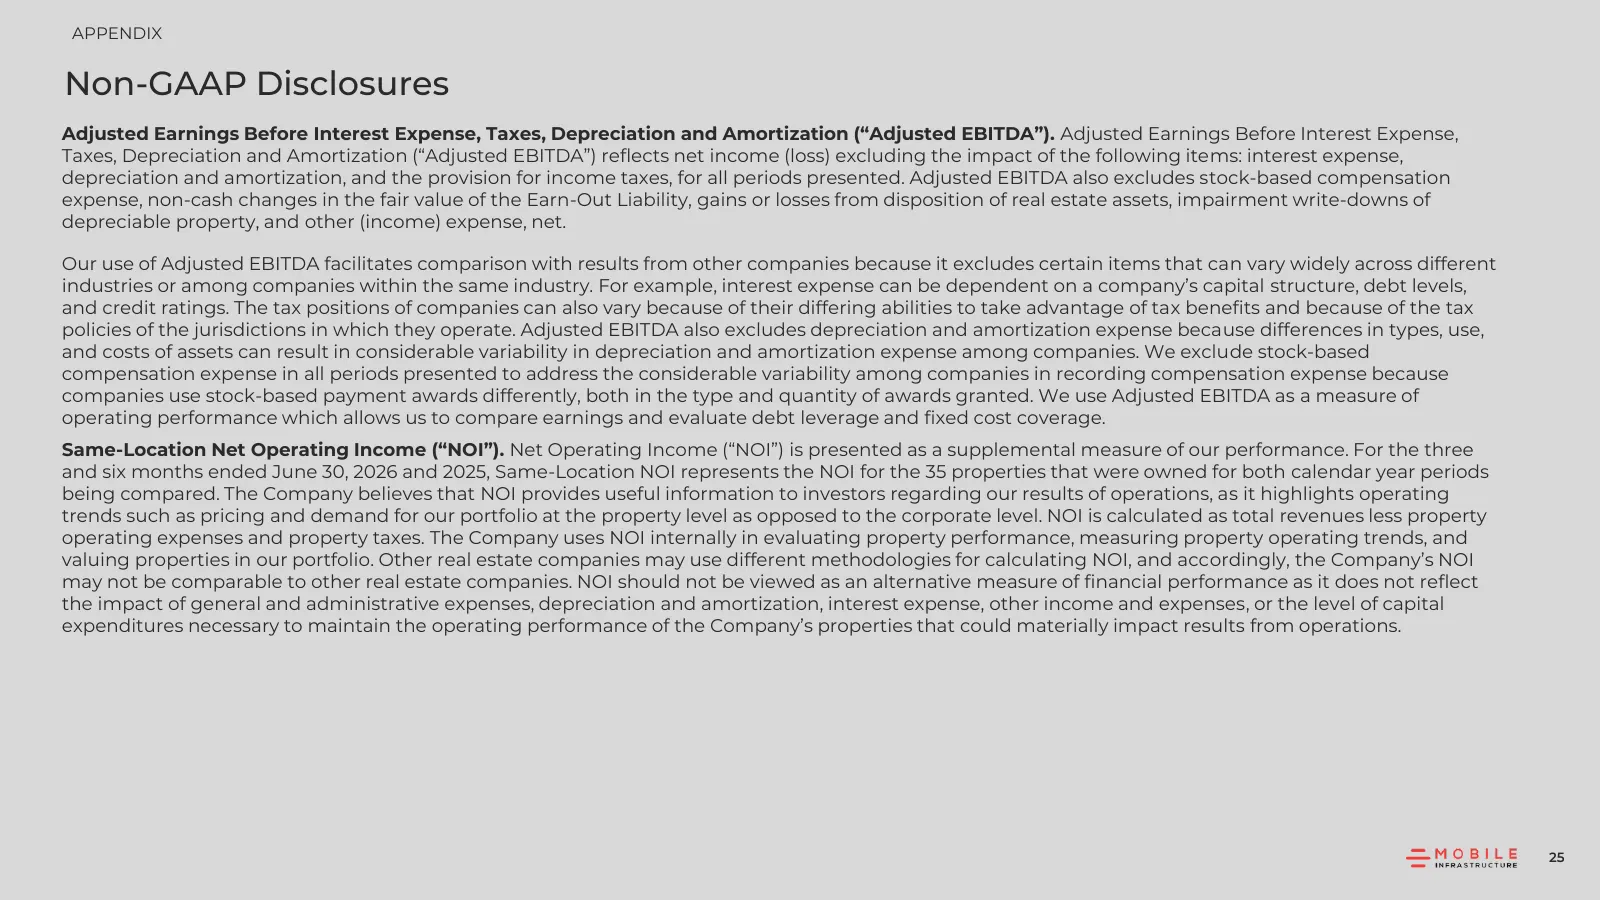
Slide 25: Non-GAAP Disclosures
APPENDIX Non-GAAP Disclosures Adjusted Earnings Before Interest Expense, Taxes, Depreciation and Amortization (“Adjusted EBITDA”). Adjusted Earnings Before Interest Expense, Taxes, Depreciation and Amortization (“Adjusted EBITDA”) reflects net income (loss) excluding the impact of the following item
Slide 26: Non-GAAP Disclosures
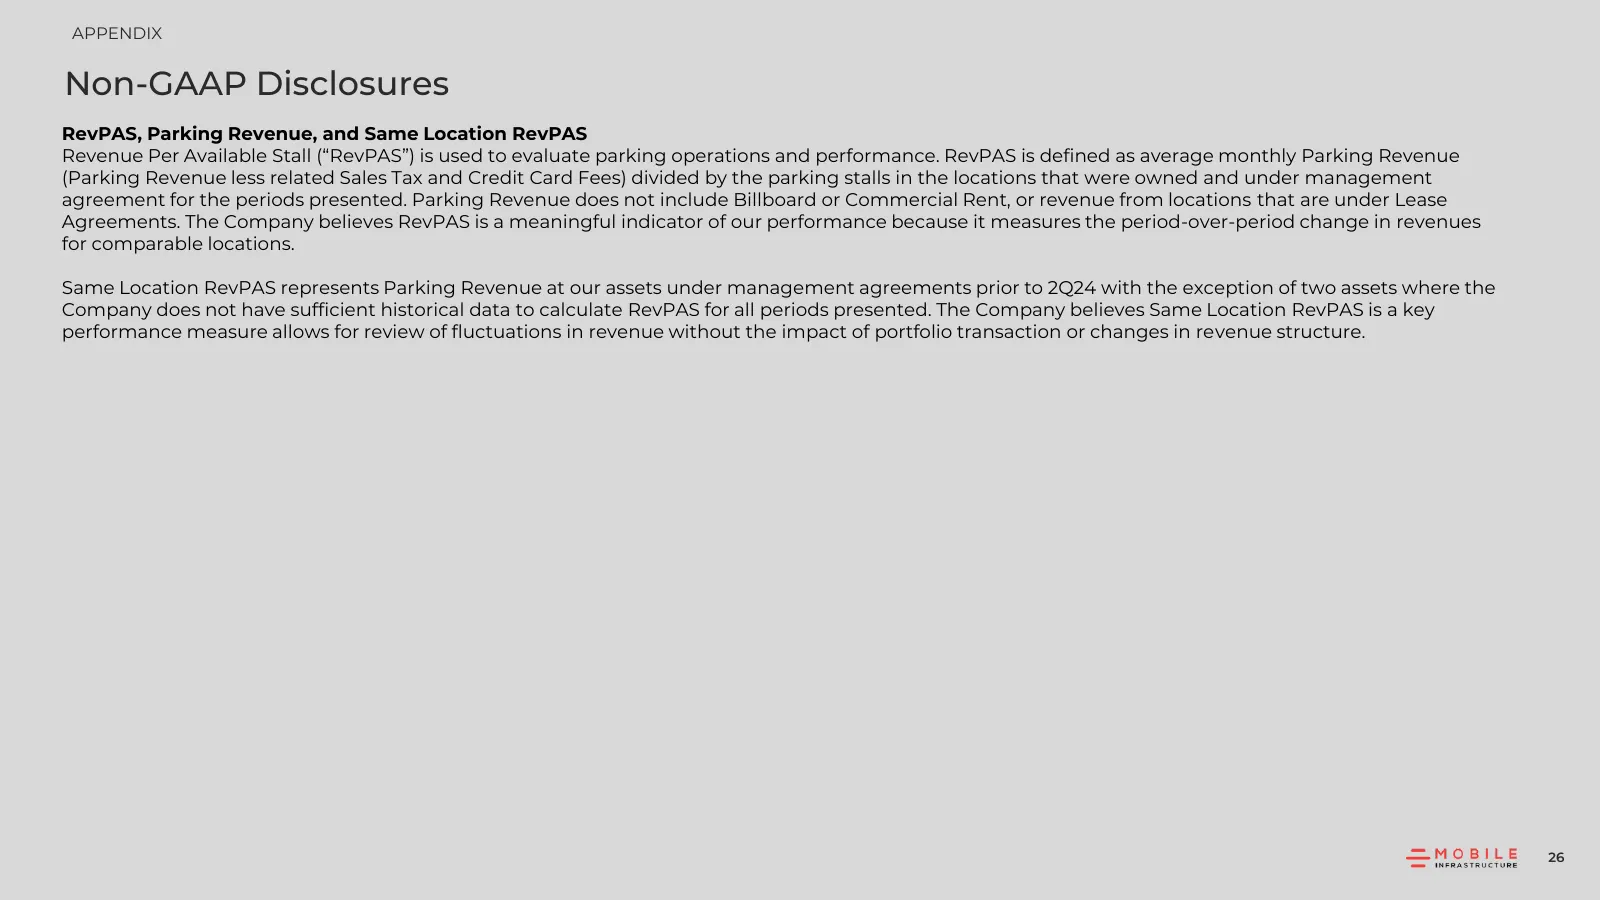
APPENDIX Non-GAAP Disclosures RevPAS, Parking Revenue, and Same Location RevPAS Revenue Per Available Stall (“RevPAS”) is used to evaluate parking operations and performance. RevPAS is defined as average monthly Parking Revenue (Parking Revenue less related Sales Tax and Credit Card Fees) divided by
Source: company website
More decks from Mobile Infrastructure Corporation
 Q2 2026 Earnings Presentation26 slides · Aug 11, 2026
 Q1 2026 Earnings Presentation25 slides · May 12, 2026
 Q1 2025 Earnings Presentation27 slides · May 13, 2025
 SPAC Merger (January 2023)61 slides · Jan 13, 2023
 Fifth Wall Acquisition Corp. III — SPAC Merger (December 2022)7 slides · Dec 14, 2022
 SPAC Merger (December 2022)7 slides · Dec 14, 2022