INX — Q2 2009 Earnings Presentation
22 slides from INX's earnings presentation, Aug 13, 2009
Slide 1: Financial Results for 2nd Quarter Ended June 30, 2009
Financial Results for 2™4 Quarter Ended June 30, 2009 Jim Long, Chairman & CEO Mark Hilz, President & COO Brian Fontana, Vice President & CFO August 13, 2009
Slide 2: GAAP Reconciliation and Safe Harbor Statement
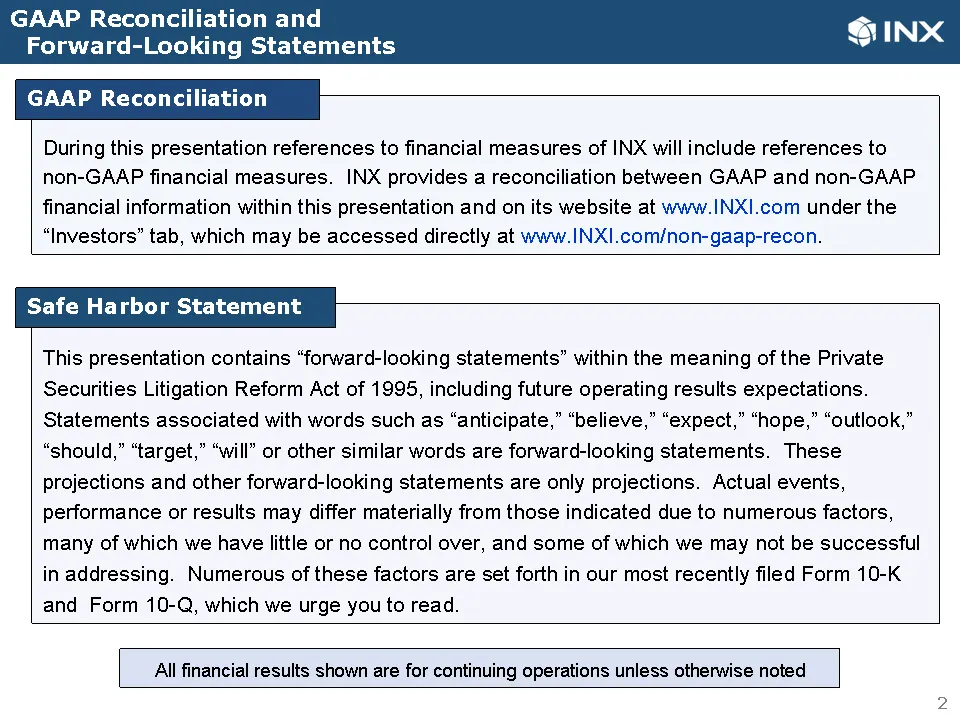
GAAP Reconciliation During this presentation references to financial measures of INX will include references to non-GAAP financial measures. INX provides a reconciliation between GAAP and non-GAAP financial information within this presentation and on its website at www.INXI.com under the “Investors”
Slide 3: Interrelated Areas
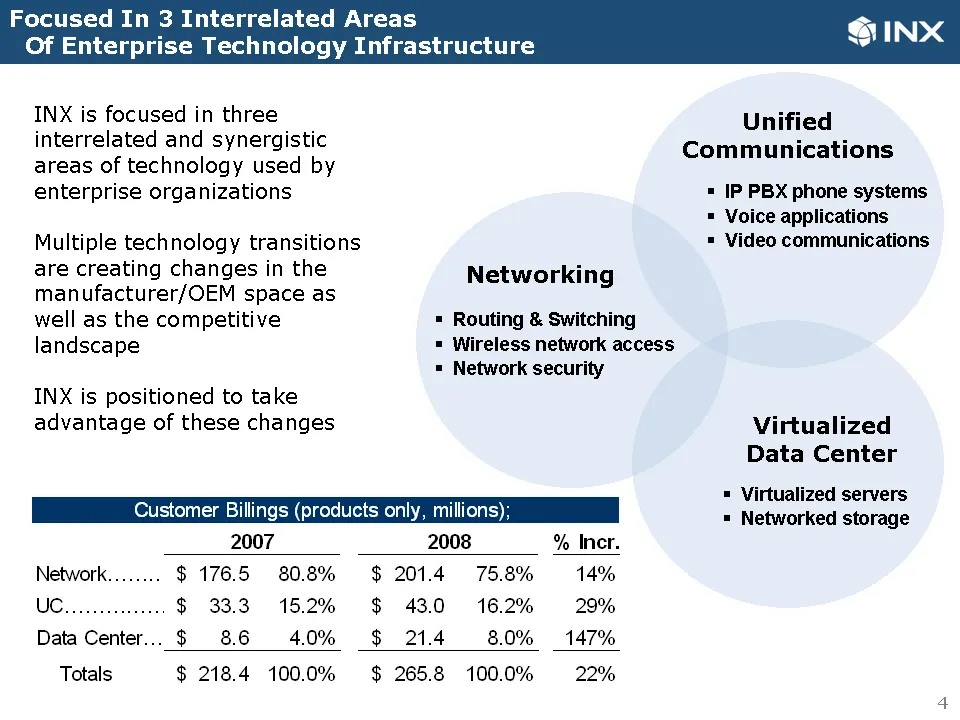
Interrelated Areas Enterprise Technology Infrastructure INX is focused in three interrelated and synergistic areas of technology used by enterprise organizations Multiple technology transitions are creating changes in the manufacturer/OEM space as well as the competitive landscape INX is positioned
Slide 4: Room for Long-Term Organic Growth
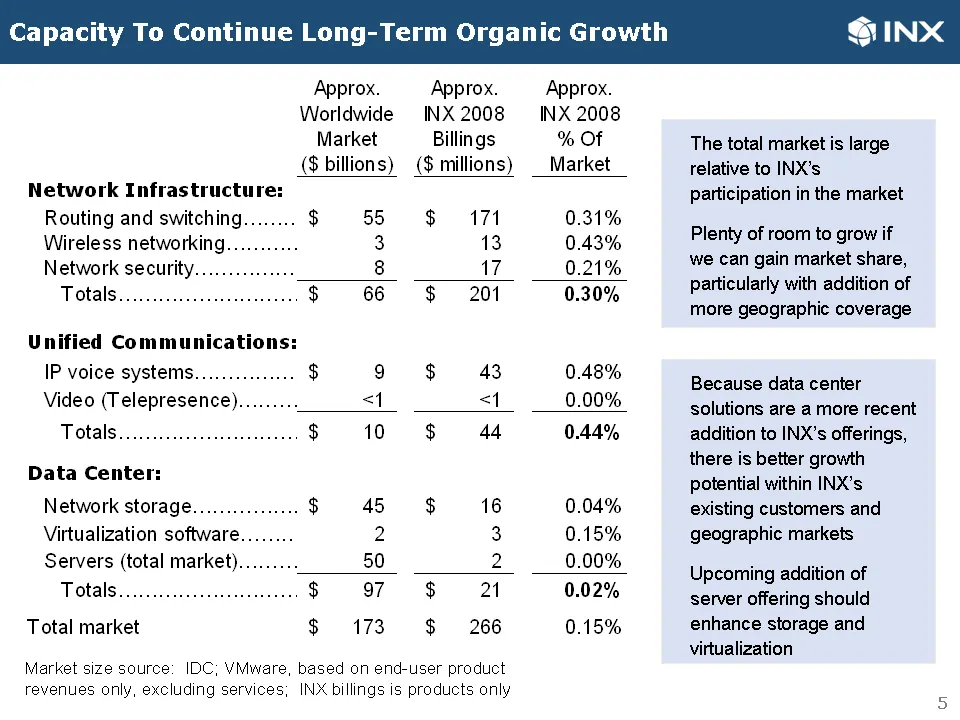
wth city To Continue Long-Term Organ Approx. Approx. Approx. Worldwide INX 2008 INX 2008 Market Billings % OF ($ billions) ($ millions) Market Network Infrastructure: Routing and switching. 55 171 0.31% Wireless networking. 3 13 0.43% Network security. 8 17 0.21% Totals 66 201 0.30% Unified Communic
Slide 5: Highlights Of Second Quarter Results & Accomplishments
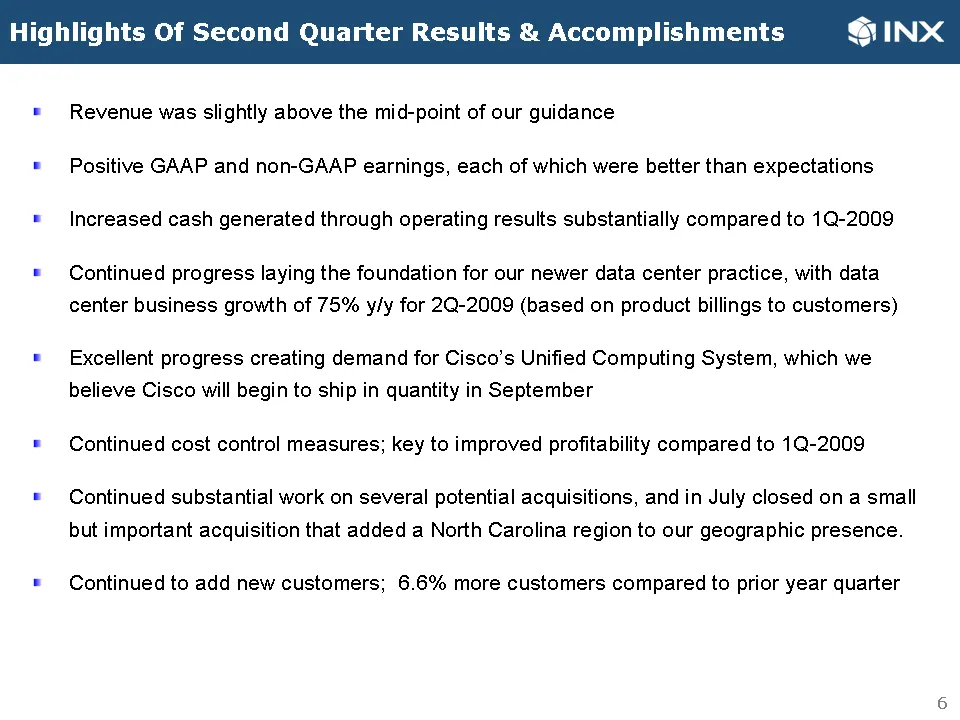
Highlights Of Second Quarter Results & Accomplishments Revenue was slightly above the mid-point of our guidance Positive GAAP and non-GAAP earnings, each of which were better than expectations Increased cash generated through operating results substantially compared to 1Q-2009 Continued progress lay
Slide 6: Growth Relative to Industry
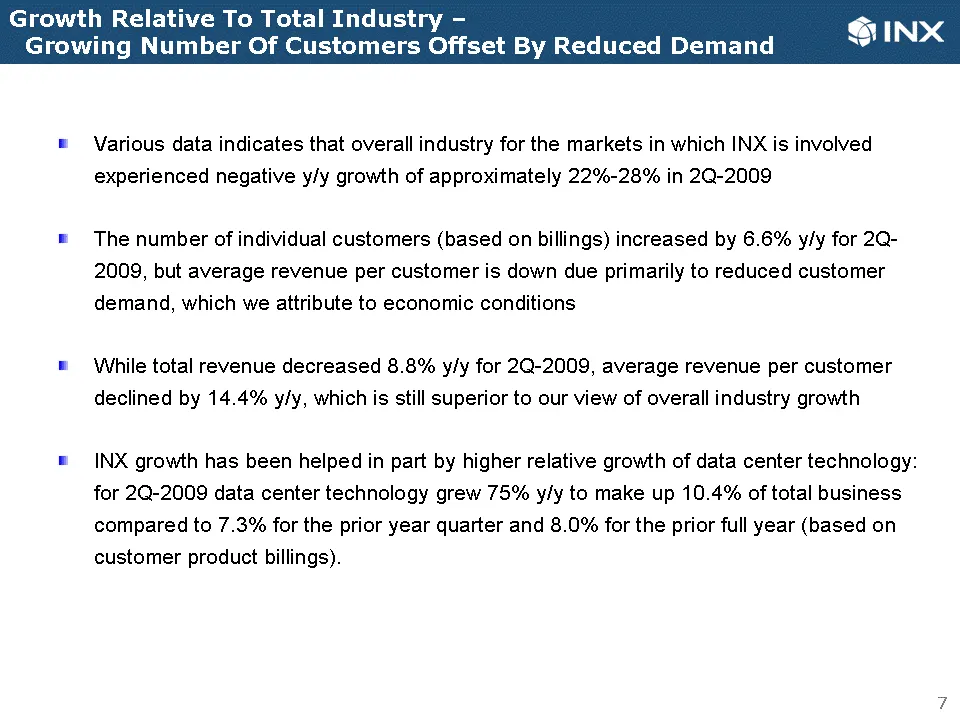
Growth Relative ig Number Of Customers Offset By Reduced Demand $ INX ® Various data indicates that overall industry for the markets in which INX is involved experienced negative y/y growth of approximately 22%-28% in 2Q-2009 = The number of individual customers (based on billings) increased by 6.6%
Slide 7: Meeting Our Long-Term Financial Goals
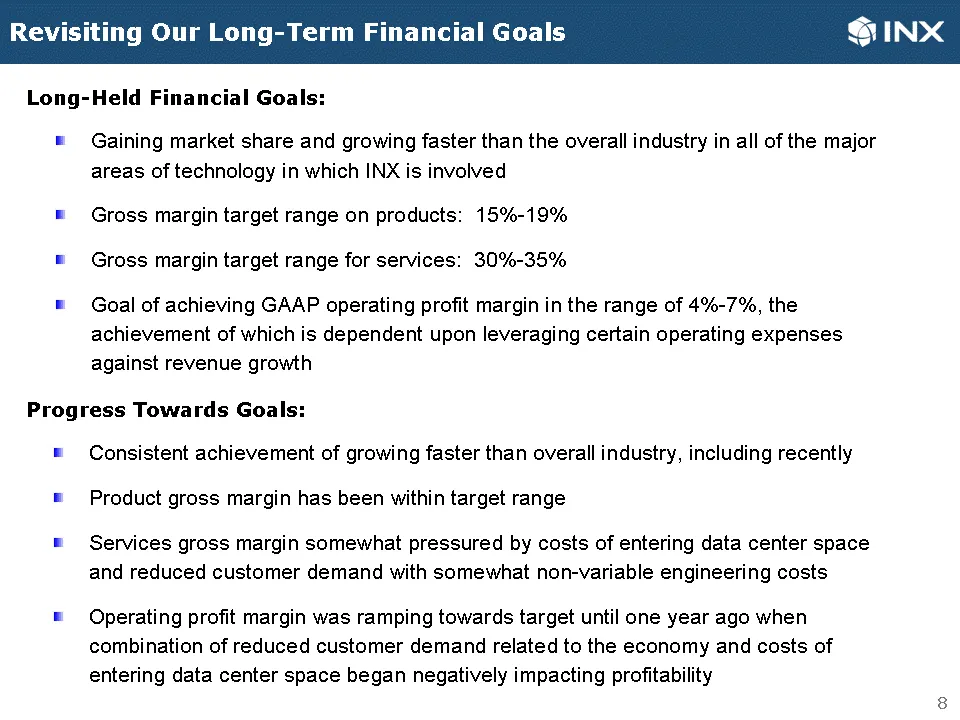
ing Our Long-Term Finan S INX Long-Held Financial Goals: ® Gaining market share and growing faster than the overall industry in all of the major areas of technology in which INX is involved = Gross margin target range on products: 15%-19% ® Gross margin target range for services: 30%-35% ® Goal of a
Slide 8: Second Quarter Financial Results
Second Quarter Financial Results Brian Fontana Vice President & CFO
Slide 9: Restatement Of Previously Reported Results
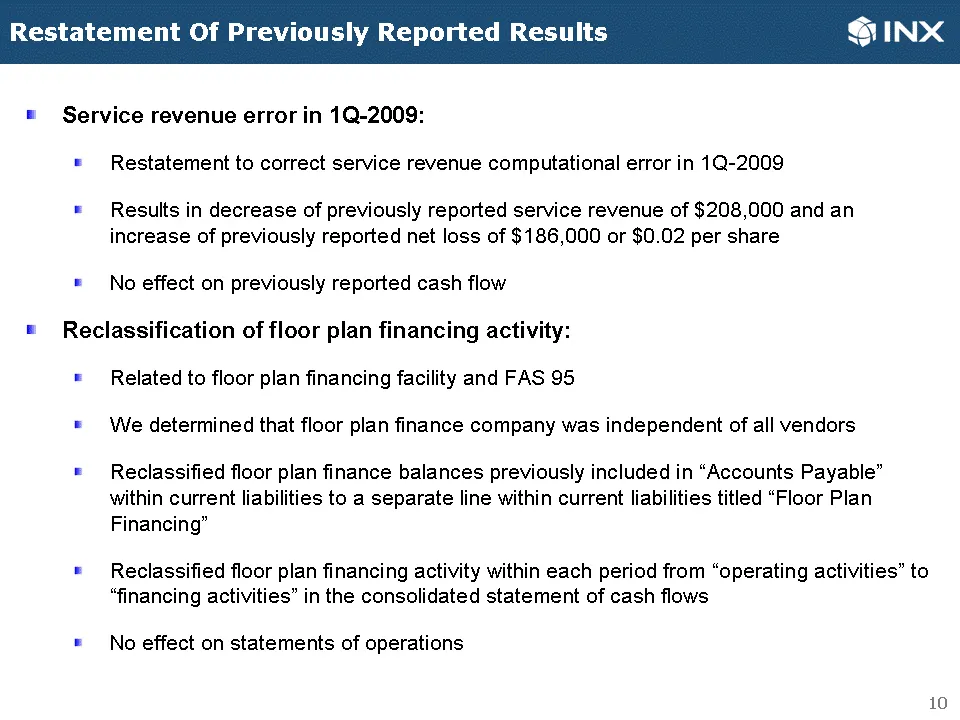
Restatement Of Previously Reported Results = Service revenue error in 1Q-2009: Restatement to correct service revenue computational error in 1Q-2009 Results in decrease of previously reported service revenue of $208,000 and an increase of previously reported net loss of $186,000 or $0.02 per share N
Slide 10: Second Quarter Ended 6/30/2009 Operating Results
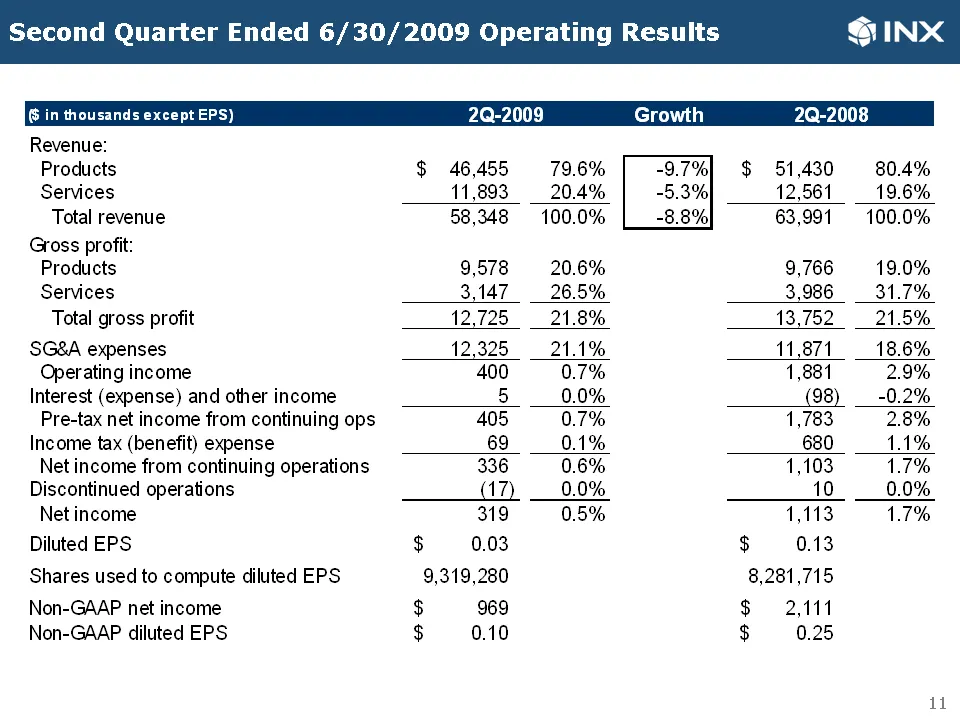
Second Quarter Ended 6/30/2009 Operating Results ( in thousands except EPS) 2Q-2009 Growth 2Q-2008 Revenue: Products $ 46,455 79.6% $ 51,430 80.4% Services 11,893 20.4% 12,561 19.6% Total revenue 58,348 100.0% 63,991 100.0% Goss profit: Products 9,578 9,766 Services 3,147 3,986 Total gross profit 12
Slide 11: Six Months Ended 6/30/2009 Operating Results
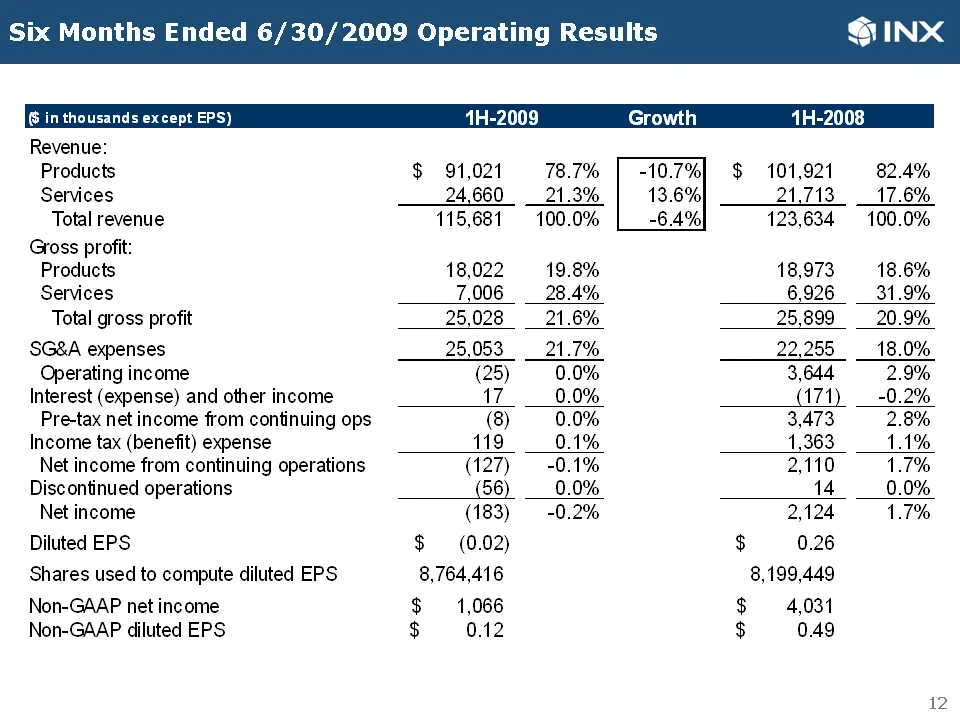
Six Months Ended 6/30/2009 Operating Results (6 in thousands except EPS) 1H-2009 Growth 1H-2008 Revenue: Products $ 91,021 78.7% $ 101,921 82.4% Services 24.660 21.3% 21,713 17.6% Total revenue 115,681 100.0% 123,634 100.0% Gross profit: Products 18,022 19.8% 18,973 18.6% Services 7,006 28.4% 6,926
Slide 12: Balance Sheet Data
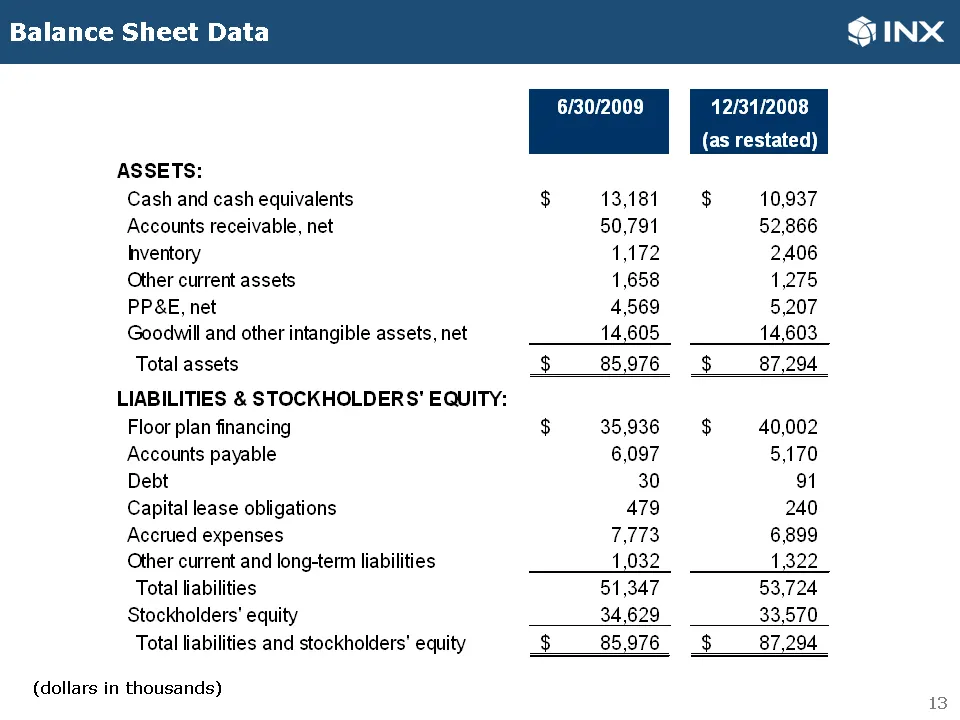
Balance Sheet Data 6/30/2009 12/31/2008 (as restated) ASSETS: Cash and cash equivalents $ 13,181 $ 10,937 Accounts receivable, net 50,791 52,866 ventory 1,172 2406 Other current assets 1,658 1,275 PP&E, net 4,569 5,207 Goodwill and other intangible assets, net 14,605 14,603 Total assets $ 85,976 _$
Slide 13: Cash Generated From Income Statement
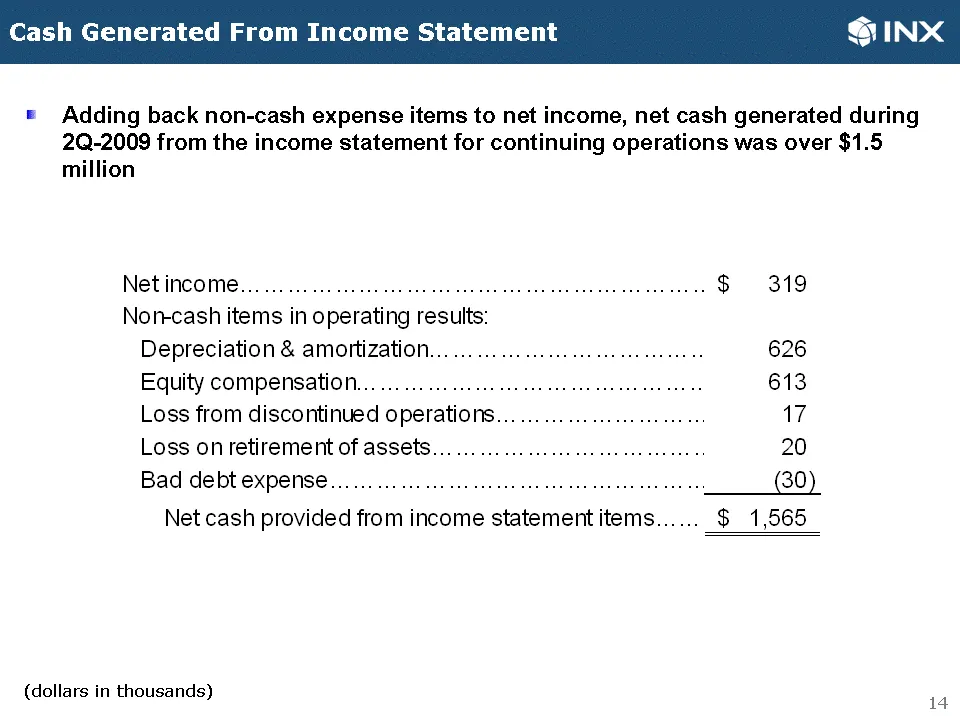
Cash Generated From Income Statement GS INX ® Adding back non-cash expense items to net income, net cash generated during 2Q-2009 from the income statement for continuing operations was over $1.5 million Net income.. wee ttt B 319 Nor-cash items i in n operating results: Depreciation & amortization.
Slide 14: Accounts Receivable
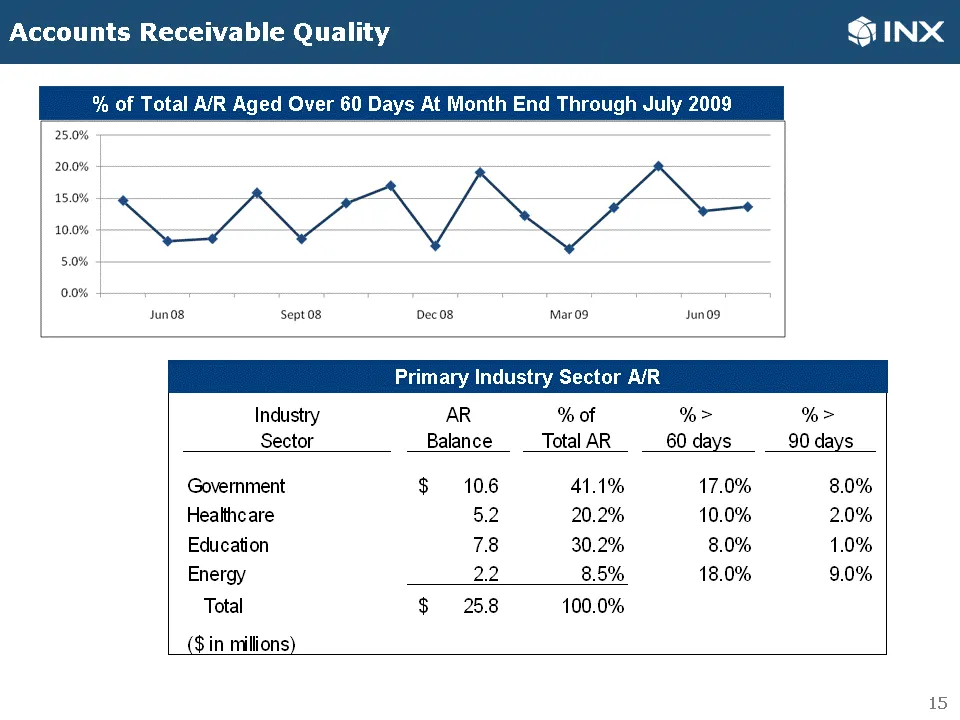
Accounts Rec GS INX % of Total A/R Aged Over 60 Days At Month End Through July 2009 Jun08, Sept 08 Dec os Mar 09 Jun09 Primary Industry Sector A/R Industry AR % of % > %> Sector Balance Total AR 60 days 90 days Government $ 10.6 41.1% 17.0% 8.0% Healthcare 5.2 20.2% 10.0% 2.0% Education 78 30.2% 8.0
Slide 15: Update On INX Operations & Industry Trends
Update On INX Operations & Industry Trends Mark Hilz President & COO
Slide 16: Second Quarter Recap
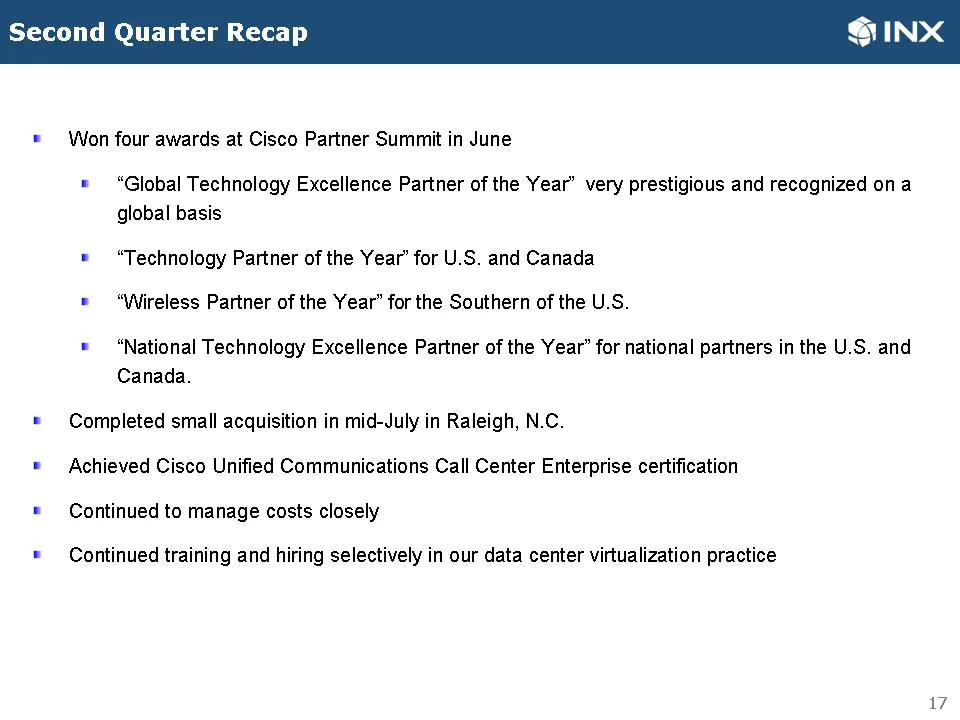
Second Quarter Reca = Won four awards at Cisco Partner Summit in June = “Global Technology Excellence Partner of the Year’ very prestigious and recognized ona global basis = “Technology Partner of the Year’ for U.S. and Canada = “Wireless Partner of the Year” for the Southern of the U.S. = “National
Slide 17: Enterprise Network Infrastructure Market
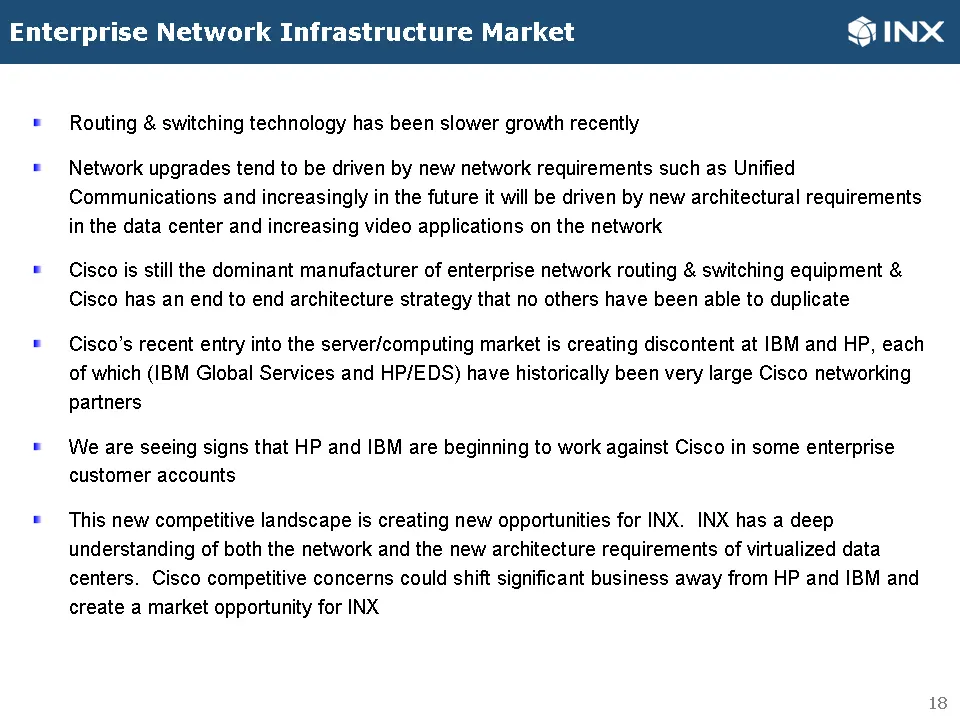
Enterprise Netw structure Market = Routing & switching technology has been slower growth recently = Network upgrades tend to be driven by new network requirements such as Unified Communications and increasingly in the future it will be driven by new architectural requirements in the data center and
Slide 18: Enterprise Unified Communications Market
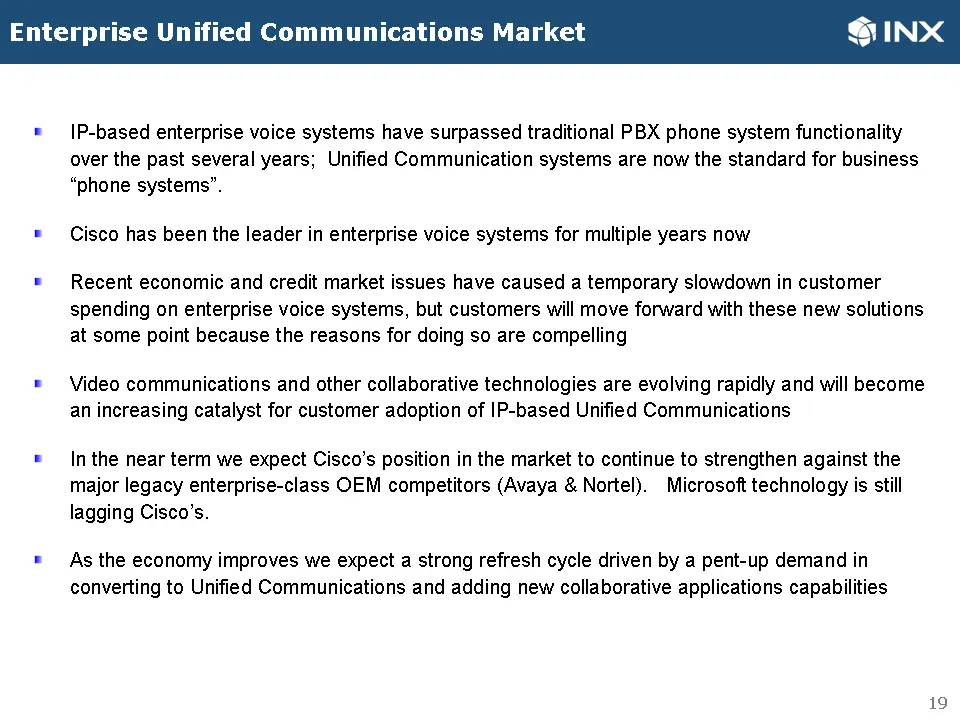
Enterprise U = |P-based enterprise voice systems have surpassed traditional PBX phone system functionality over the past several years; Unified Communication systems are now the standard for business “phone systems”. = Cisco has been the leader in enterprise voice systems for multiple years now = Re
Slide 19: Enterprise Data Center Market
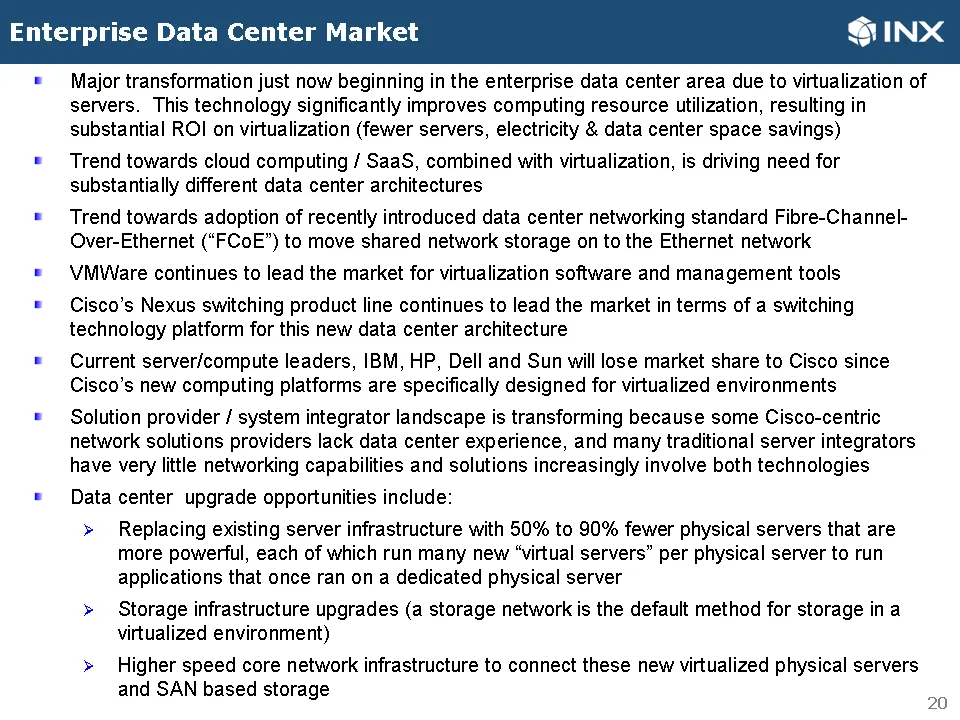
Enterprise Data Center Market INX = Major transformation just now beginning in the enterprise data center area due to virtualization of servers. This technology significantly improves computing resource utilization, resulting in substantial ROI on virtualization (fewer servers, electricity & data ce
Slide 20: Outlook, Summary & Q&A
Outlook, Summary & Q&A Jim Long Chairman & CEO
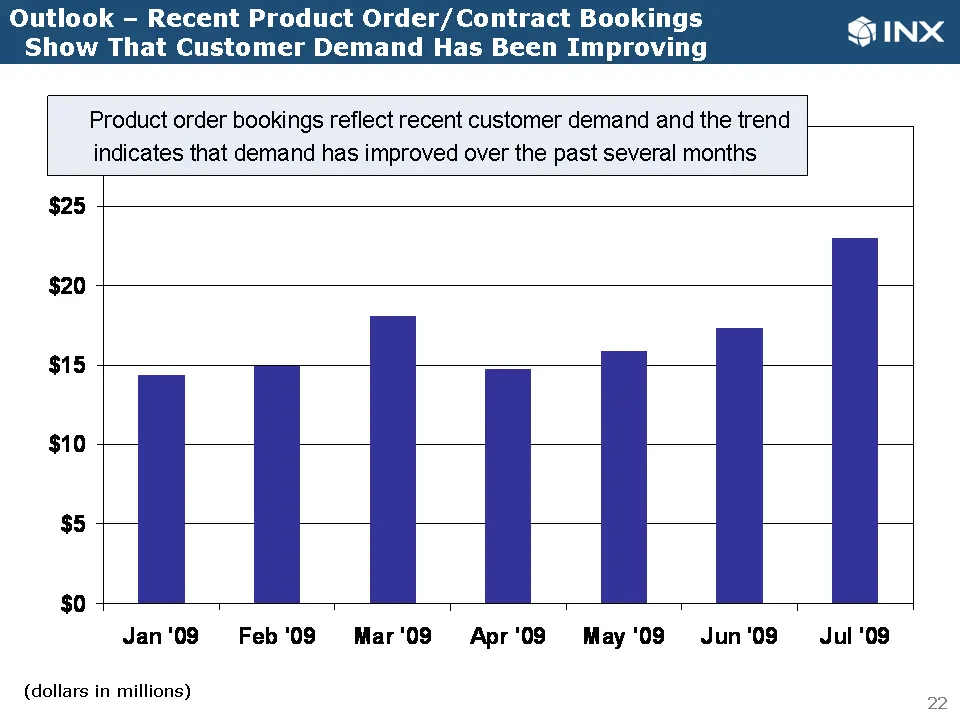
Slide 21: Outlook — Recent Product Order/Contract Bookings
Outlook — Recent Product Order/ Contract Bookings GINX Show That Customer Demand Has Been Improving and indicates that demand has improved over the past several months $20 $15 $10 $5 $0 Jan ‘0 Jun ‘0 Feb'0S8 Mar‘'09 "apr ‘08 ” May ‘0 Jul '09 | Product order bookings reflect recent customer demand an
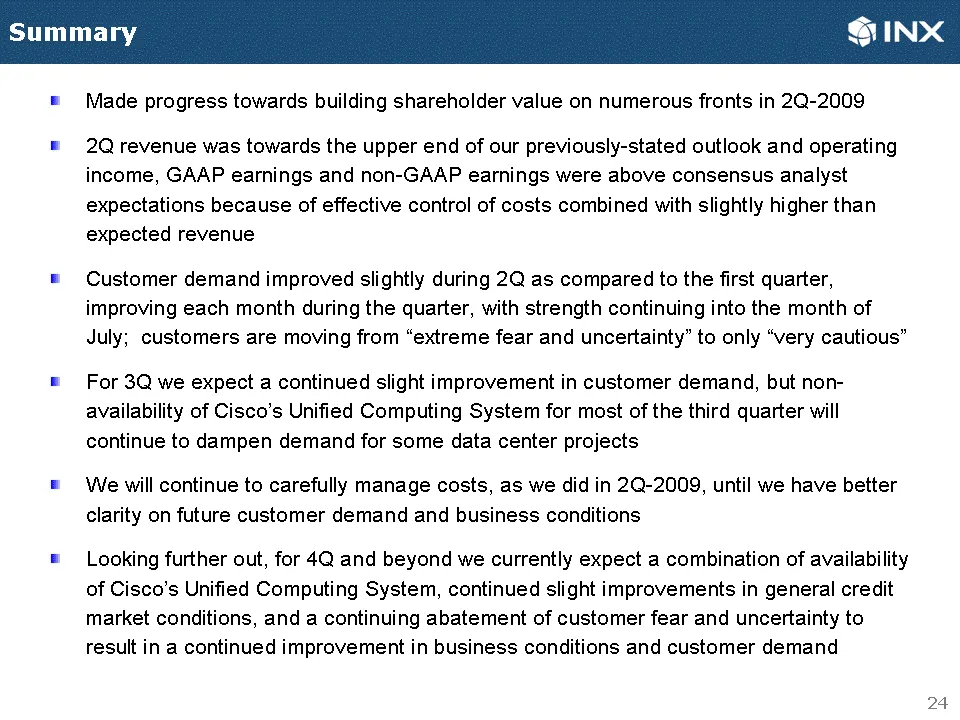
Slide 22: Summary and Outlook
G@INX Made progress towards building shareholder value on numerous fronts in 2Q-2009 2Q revenue was towards the upper end of our previously-stated outlook and operating income, GAAP earnings and non-GAAP earnings were above consensus analyst expectations because of effective control of costs combine
Source: SEC EDGAR · 8-K filed Aug 13, 2009
More decks from INX Inc
 Merger or Acquisition (November 2011)10 slides · Nov 1, 2011
 Rodman & Renshaw Global Investment Conference 201120 slides · Sep 13, 2011
 Shareholder Meeting (July 2011)15 slides · Jul 19, 2011
 Q1 2011 Earnings Presentation15 slides · Jul 13, 2011
 FY2010 Earnings Presentation28 slides · Jun 6, 2011
 Corporate Update (November 2010)24 slides · Nov 10, 2010