JCDecaux SE · EURONEXT:DEC
JCDecaux — FY2014 Earnings Presentation
53 slides from JCDecaux's earnings presentation, Mar 5, 2015
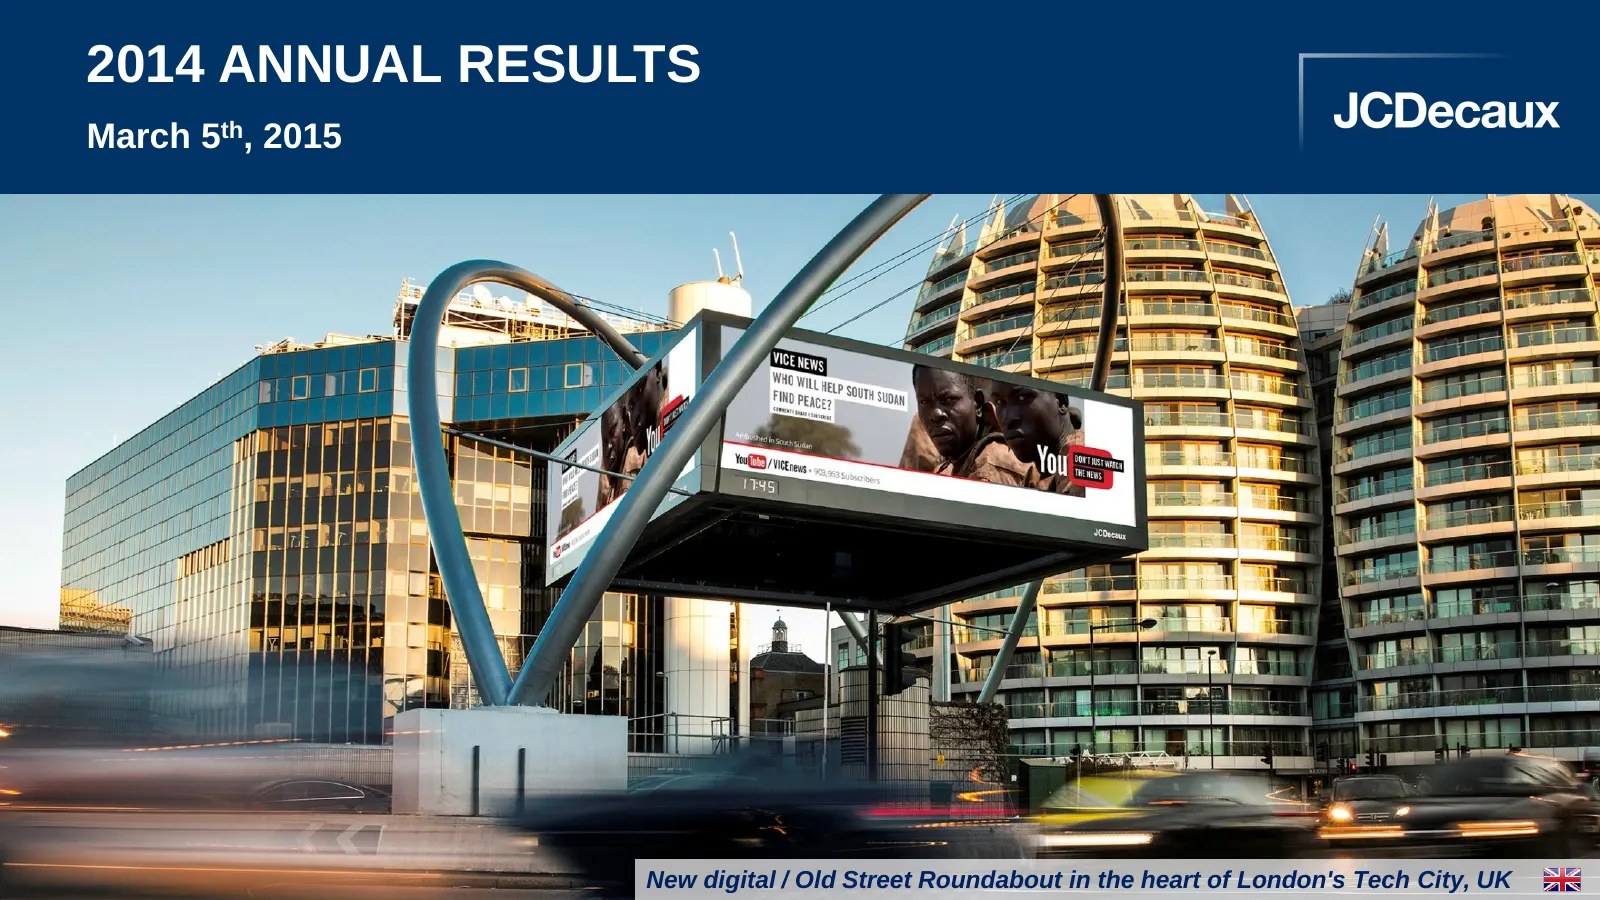
Slide 1: 2014 Annual Results
2014 ANNUAL RESULTS March 5th, 2015 New digital / Old Street Roundabout in the heart of London's Tech City, UK

Slide 2: Business Overview
BUSINESS OVERVIEW
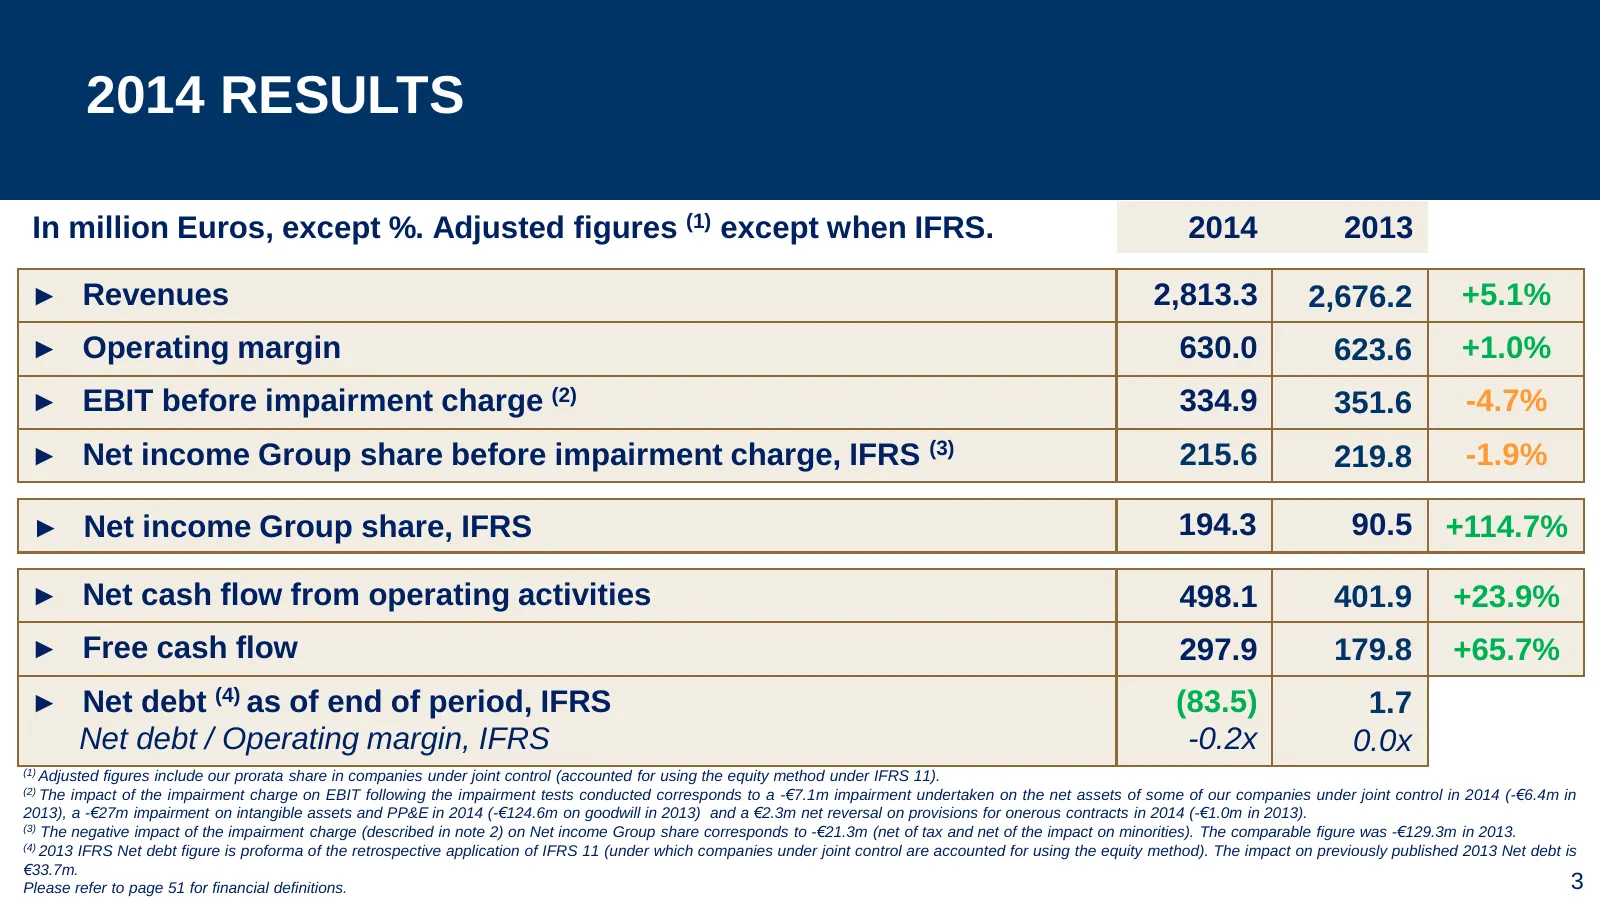
Slide 3: 2014 Results
2014 RESULTS In million Euros, except %. Adjusted figures (1) except when IFRS. 2014 2013 ► Revenues 2,813.3 2,676.2 +5.1% ► Operating margin 630.0 623.6 +1.0% ► EBIT before impairment charge (2) 334.9 351.6 -4.7% ► Net income Group share before impairment charge, IFRS (3) 215.6 219.8 -1.9% ► Net in
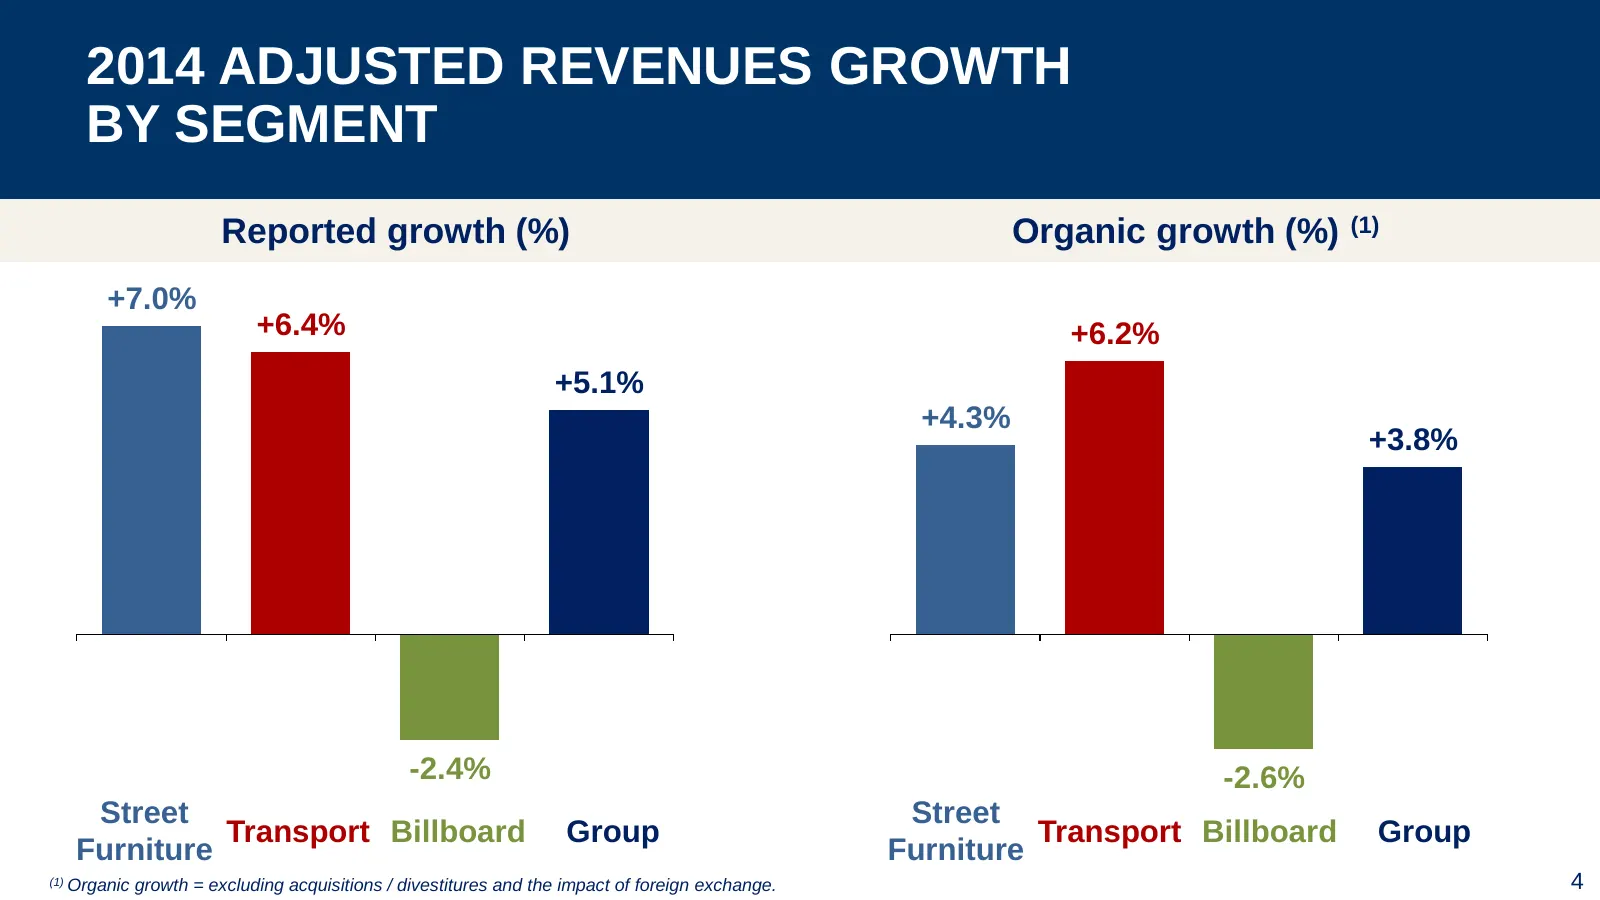
Slide 4: 2014 Adjusted Revenues Growth by Segment
2014 ADJUSTED REVENUES GROWTH BY SEGMENT Reported growth (%) Organic growth (%) (1) +7.0% +6.4% +6.2% +5.1% +4.3% +3.8% -2.4% -2.6% Street Street Transport Billboard Group Transport Billboard Group Furniture Furniture (1) Organic growth = excluding acquisitions / divestitures and the impact of forei
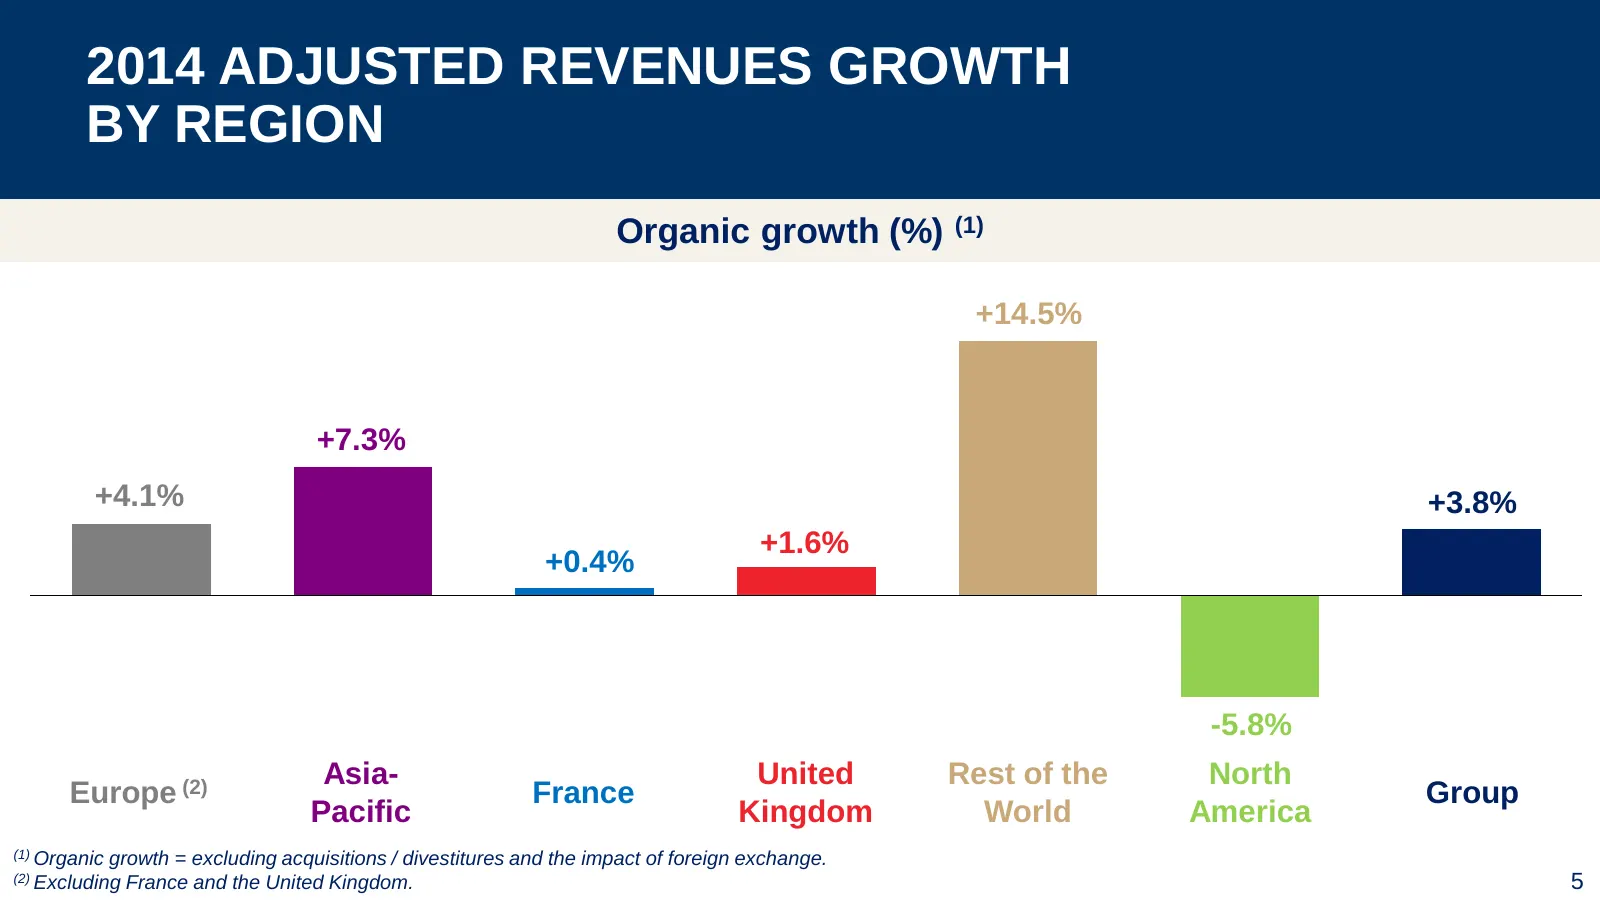
Slide 5: 2014 Adjusted Revenues Growth by Region
2014 ADJUSTED REVENUES GROWTH BY REGION Organic growth (%) (1) +14.5% +7.3% +4.1% +3.8% +1.6% +0.4% -5.8% Asia- United Rest of the North Europe (2) France Group Pacific Kingdom World America (1) Organic growth = excluding acquisitions / divestitures and the impact of foreign exchange. (2) Excluding
Slide 6: 2014 Adjusted Revenues Breakdown
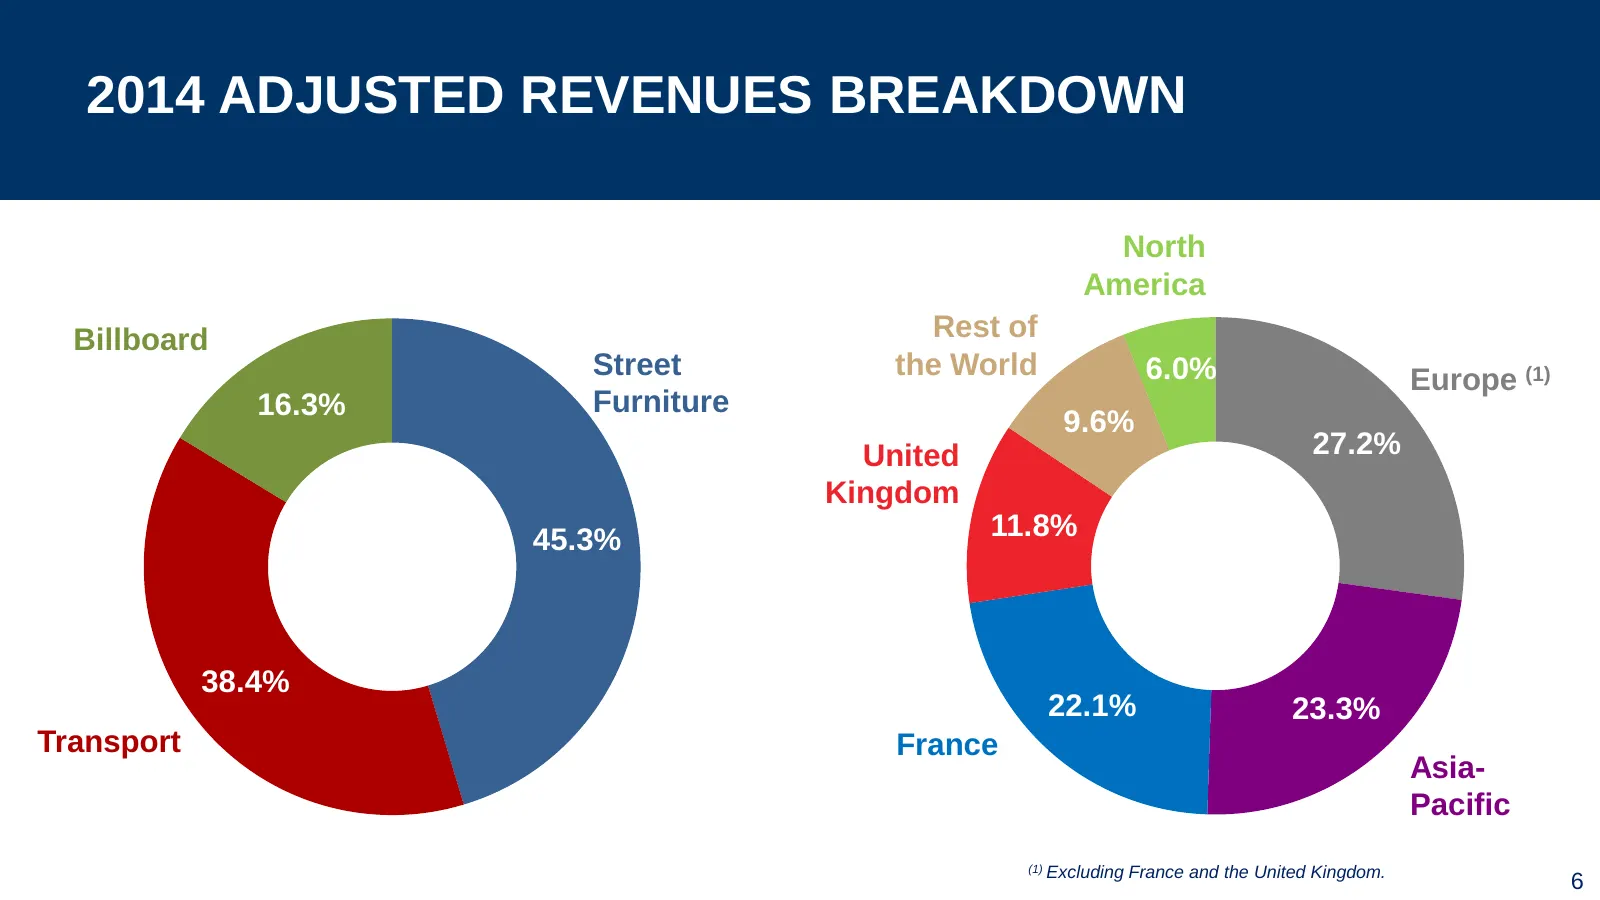
2014 ADJUSTED REVENUES BREAKDOWN North America Billboard Rest of Street the World 6.0% Europe (1) 16.3% Furniture 9.6% United 27.2% Kingdom 45.3% 11.8% 38.4% 22.1% 23.3% Transport France Asia- Pacific (1) Excluding France and the United Kingdom. 6
Slide 7: Fast-Growing Countries Now a Third of Group Revenues
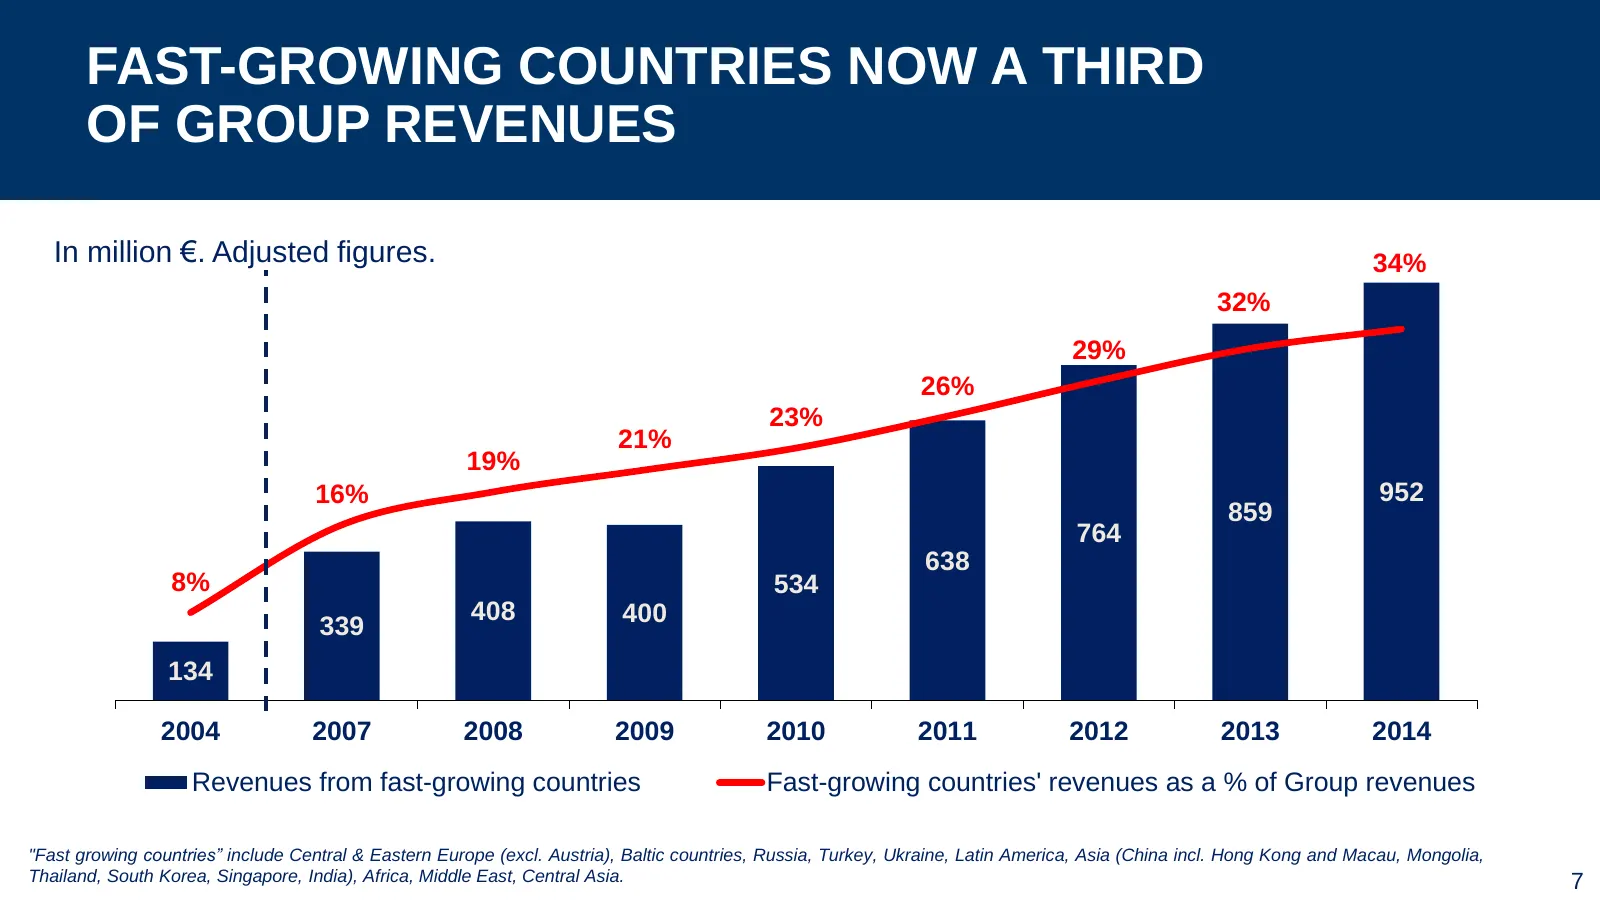
FAST-GROWING COUNTRIES NOW A THIRD OF GROUP REVENUES In million €. Adjusted figures. 34% 32% 29% 26% 23% 21% 19% 16% 952 859 764 638 8% 534 408 400 339 134 2004 2007 2008 2009 2010 2011 2012 2013 2014 Revenues from fast-growing countries Fast-growing countries' revenues as a % of Group revenues "Fas
Slide 8: Strong Growth from Digital: +37% Increase in Revenues in 2014
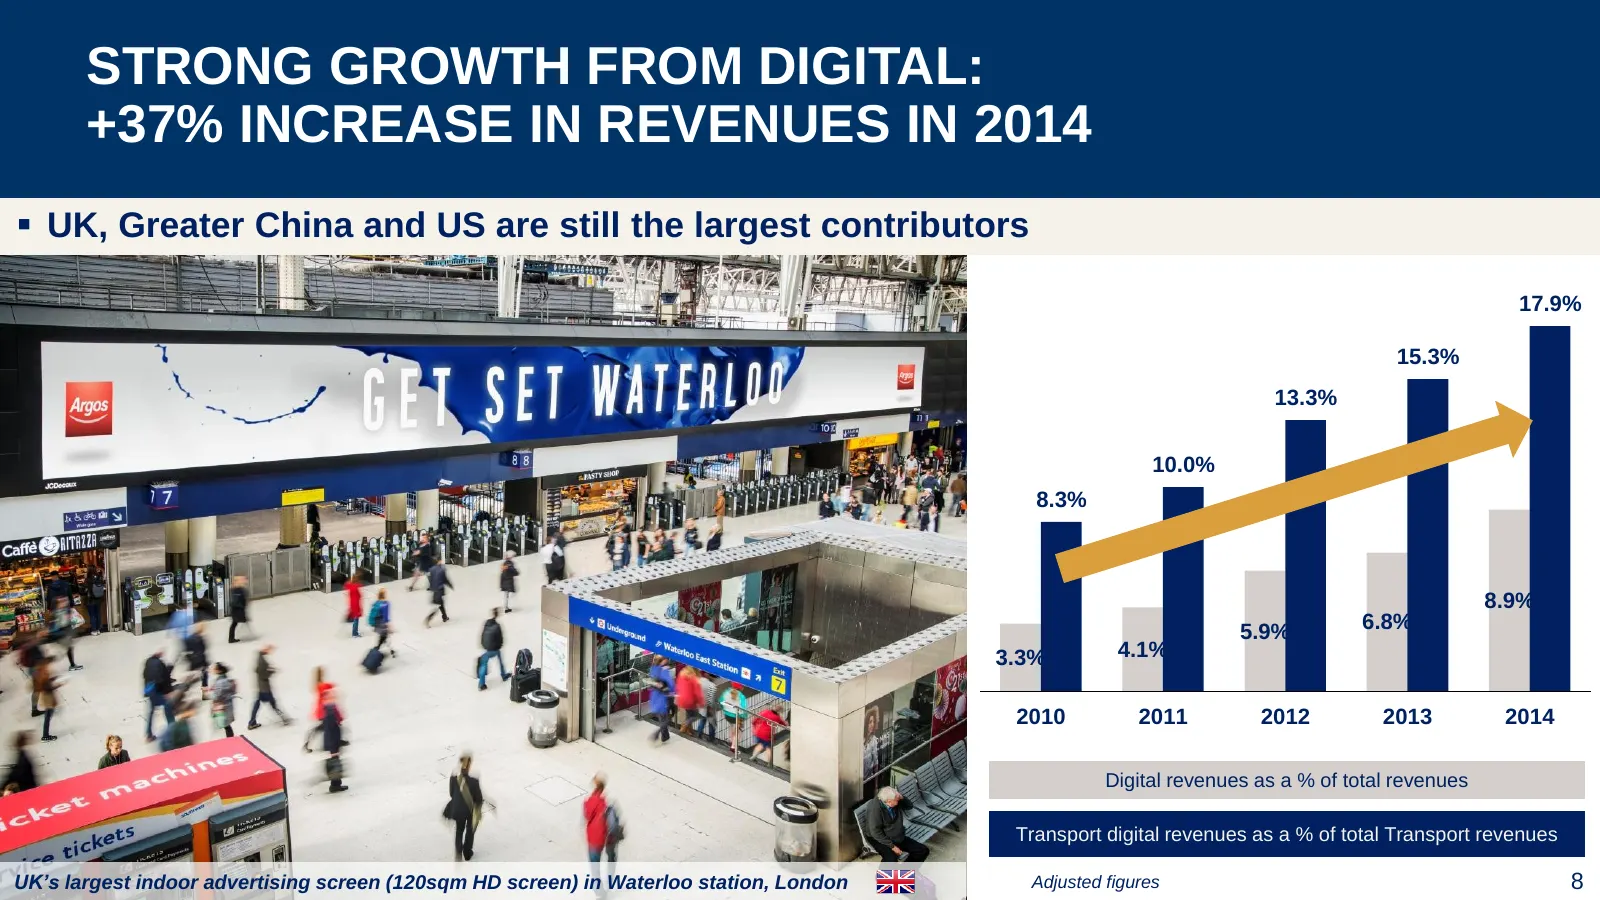
STRONG GROWTH FROM DIGITAL: +37% INCREASE IN REVENUES IN 2014 UK, Greater China and US are still the largest contributors 17.9% 15.3% 13.3% 10.0% 8.3% 8.9% 5.9% 6.8% 3.3% 4.1% 2010 2011 2012 2013 2014 Digital revenues as a % of total revenues Transport digital revenues as a % of total Transport re
Slide 9: Return to Positive Adjusted Organic Revenues Growth in Europe
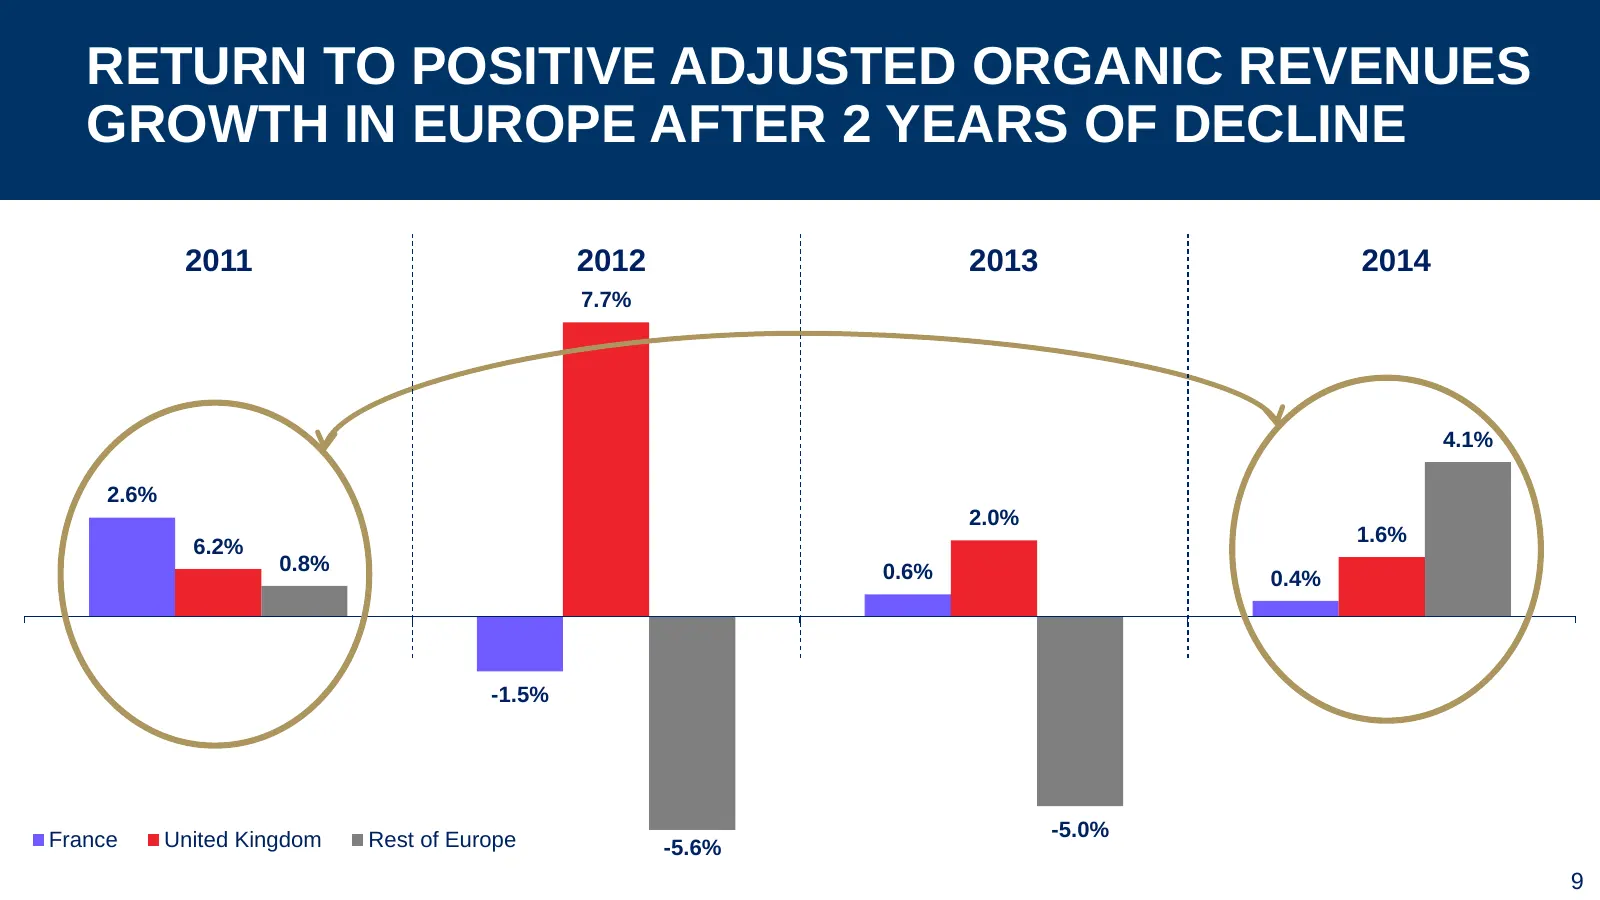
RETURN TO POSITIVE ADJUSTED ORGANIC REVENUES GROWTH IN EUROPE AFTER 2 YEARS OF DECLINE 2011 2012 2013 2014 7.7% 4.1% 2.6% 2.0% 1.6% 6.2% 0.8% 0.6% 0.4% -1.5% France United Kingdom Rest of Europe -5.0% -5.6% 9
Slide 10: Asia-Pacific Now the 2nd Largest Region
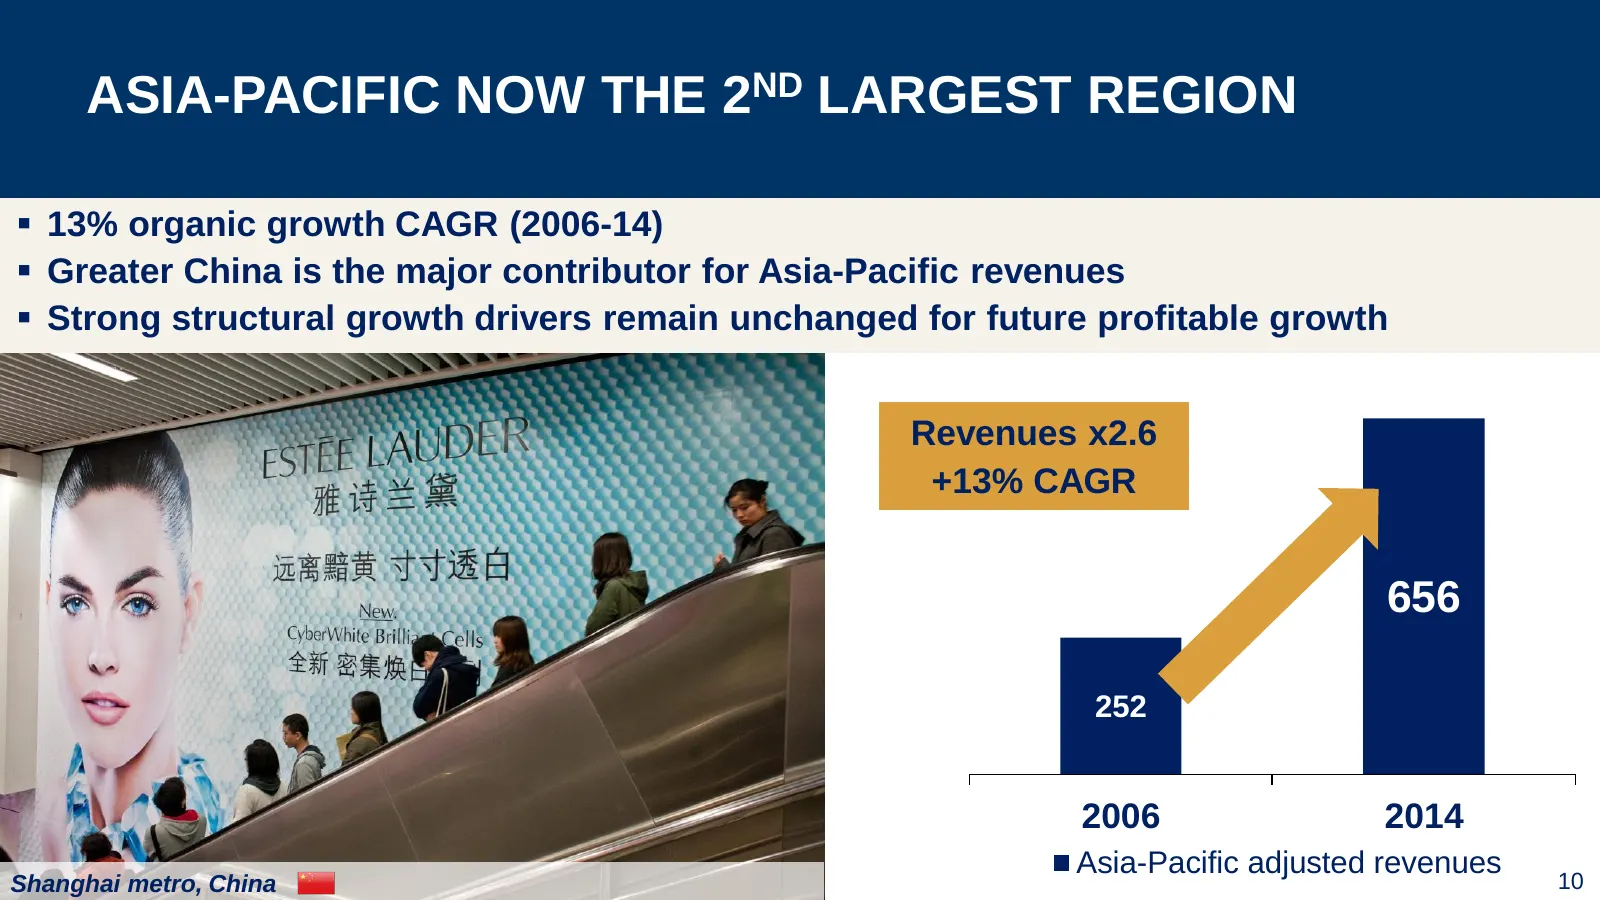
ASIA-PACIFIC NOW THE 2ND LARGEST REGION 13% organic growth CAGR (2006-14) Greater China is the major contributor for Asia-Pacific revenues Strong structural growth drivers remain unchanged for future profitable growth Revenues x2.6 +13% CAGR 656 252 2006 2014 Asia-Pacific adjusted revenues Sha
Slide 11: 2014 Top Client Categories
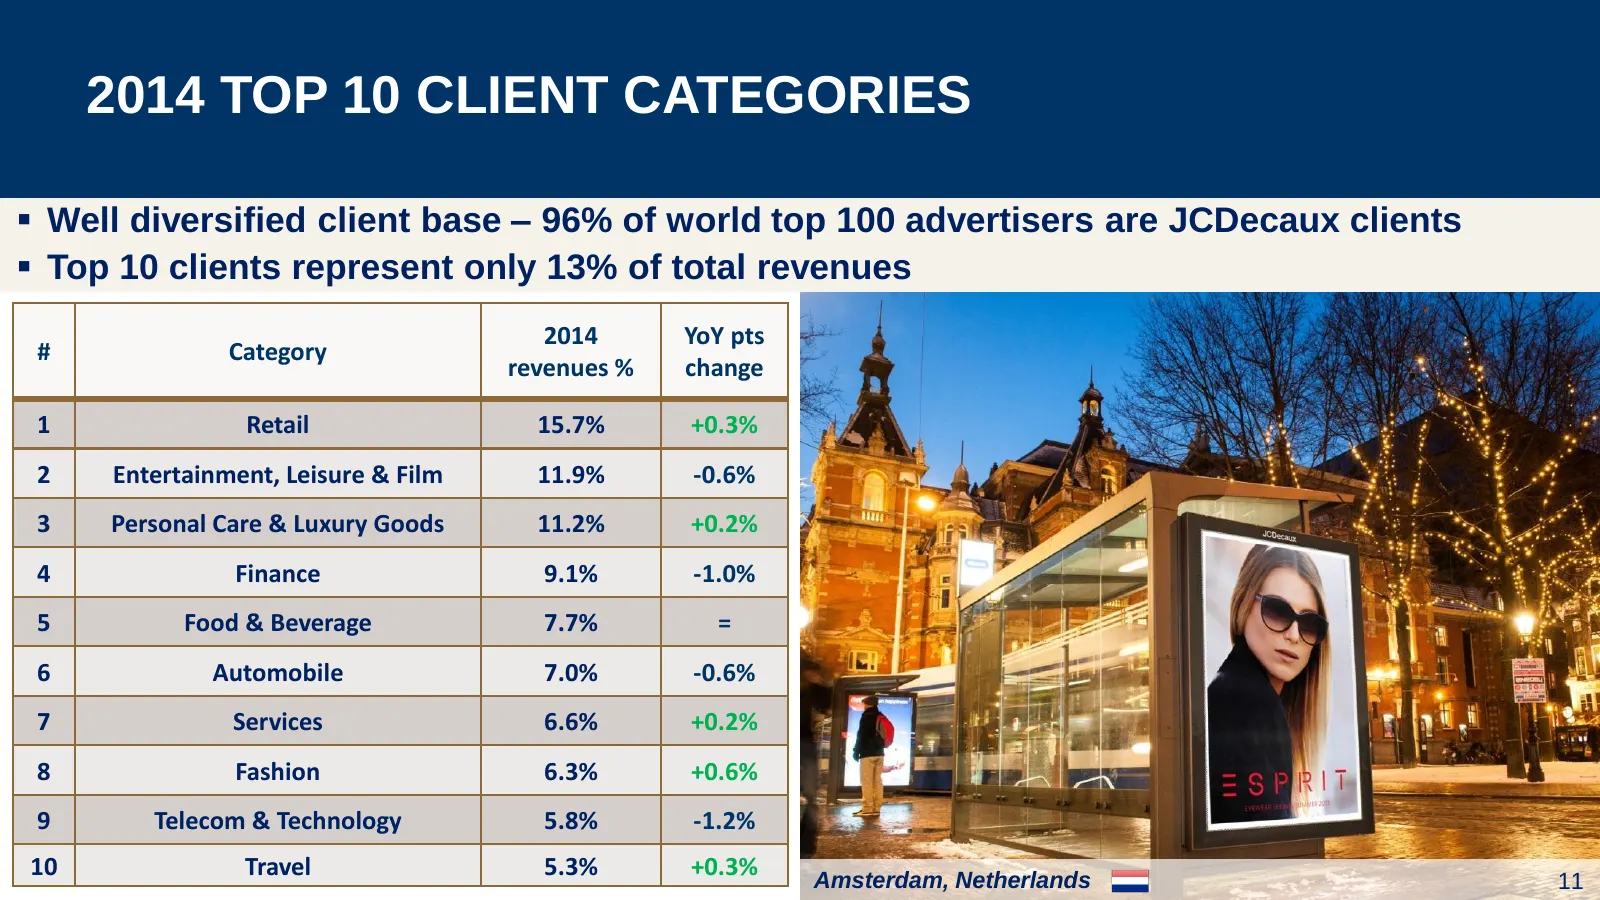
2014 TOP 10 CLIENT CATEGORIES Well diversified client base – 96% of world top 100 advertisers are JCDecaux clients Top 10 clients represent only 13% of total revenues 2014 YoY pts # Category revenues % change 1 Retail 15.7% +0.3% 2 Entertainment, Leisure & Film 11.9% -0.6% 3 Personal Care & Luxu
Slide 12: Business Highlights
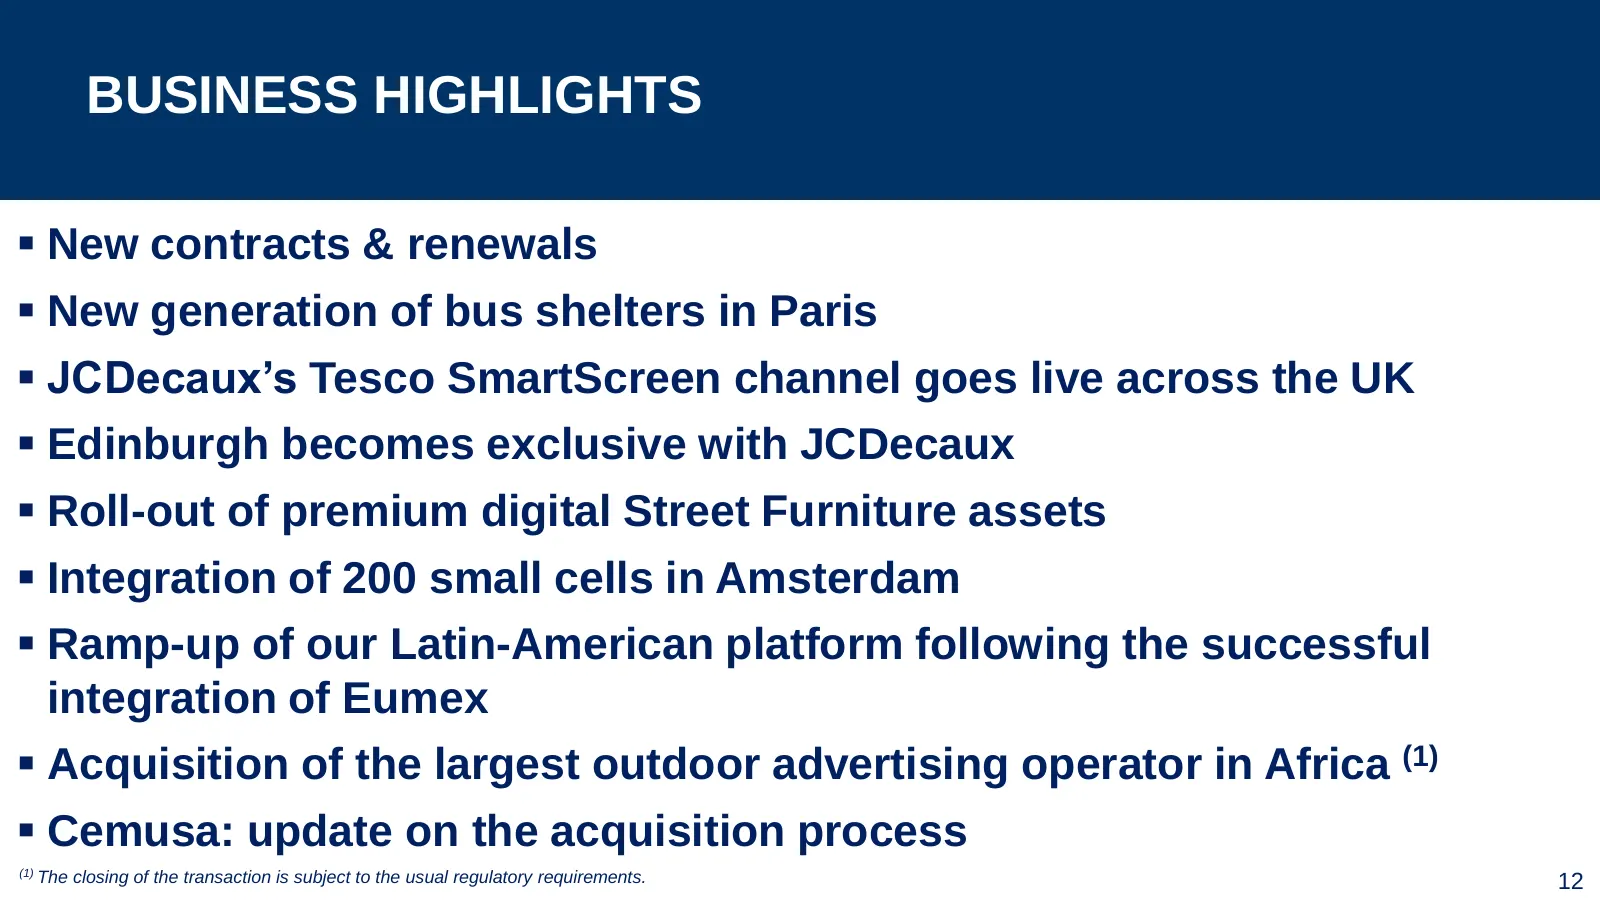
BUSINESS HIGHLIGHTS New contracts & renewals New generation of bus shelters in Paris JCDecaux’s Tesco SmartScreen channel goes live across the UK Edinburgh becomes exclusive with JCDecaux Roll-out of premium digital Street Furniture assets Integration of 200 small cells in Amsterdam Ra
Slide 13: Recent Contract Wins & Renewals
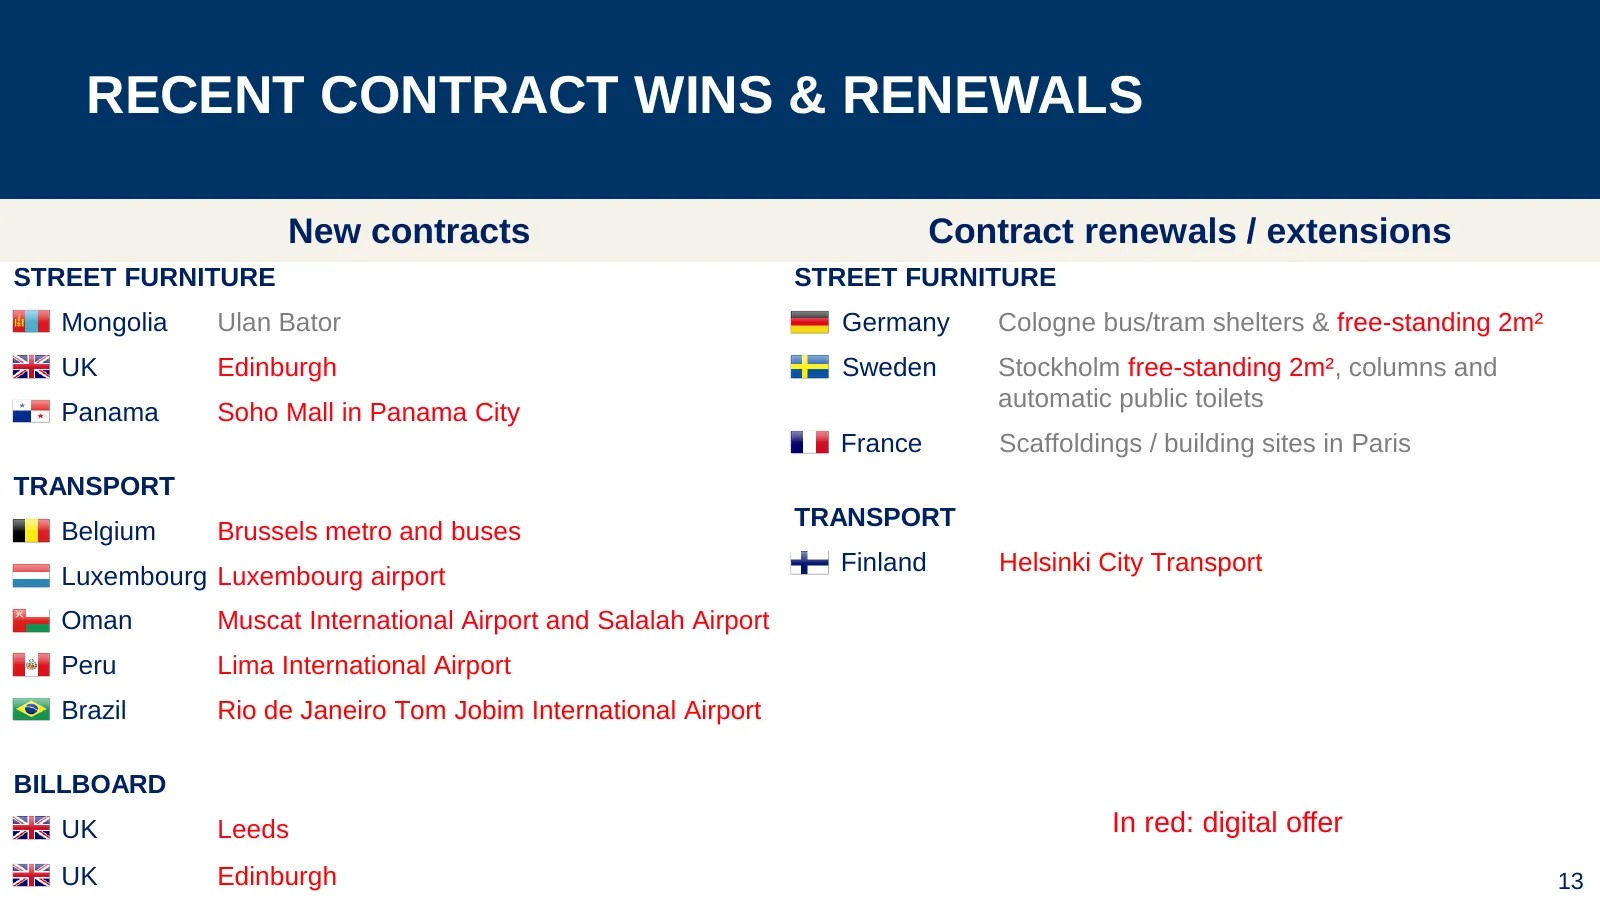
RECENT CONTRACT WINS & RENEWALS New contracts Contract renewals / extensions STREET FURNITURE STREET FURNITURE Mongolia Ulan Bator Germany Cologne bus/tram shelters & free-standing 2m² UK Edinburgh Sweden Stockholm free-standing 2m², columns and automatic public toilets Panama Soho Mall in Panama Ci
Slide 14: New Generation of Bus Shelters in Paris
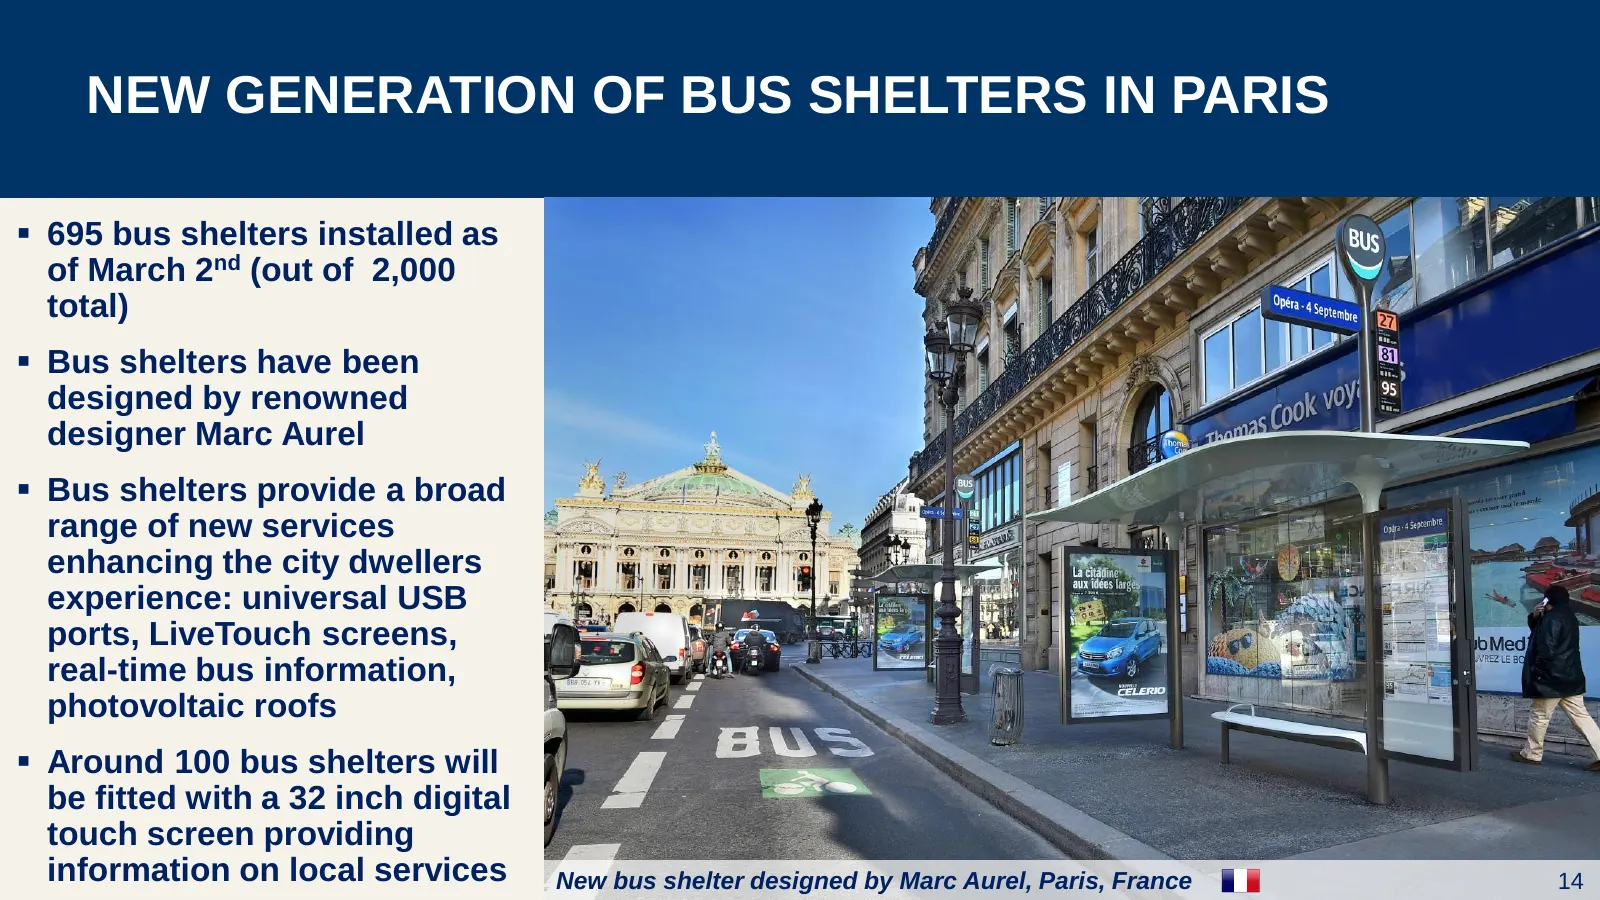
NEW GENERATION OF BUS SHELTERS IN PARIS 695 bus shelters installed as of March 2nd (out of 2,000 total) Bus shelters have been designed by renowned designer Marc Aurel Bus shelters provide a broad range of new services enhancing the city dwellers experience: universal USB ports, LiveTouch scre
Slide 15: A Fully Optimized Network of Digital Screens
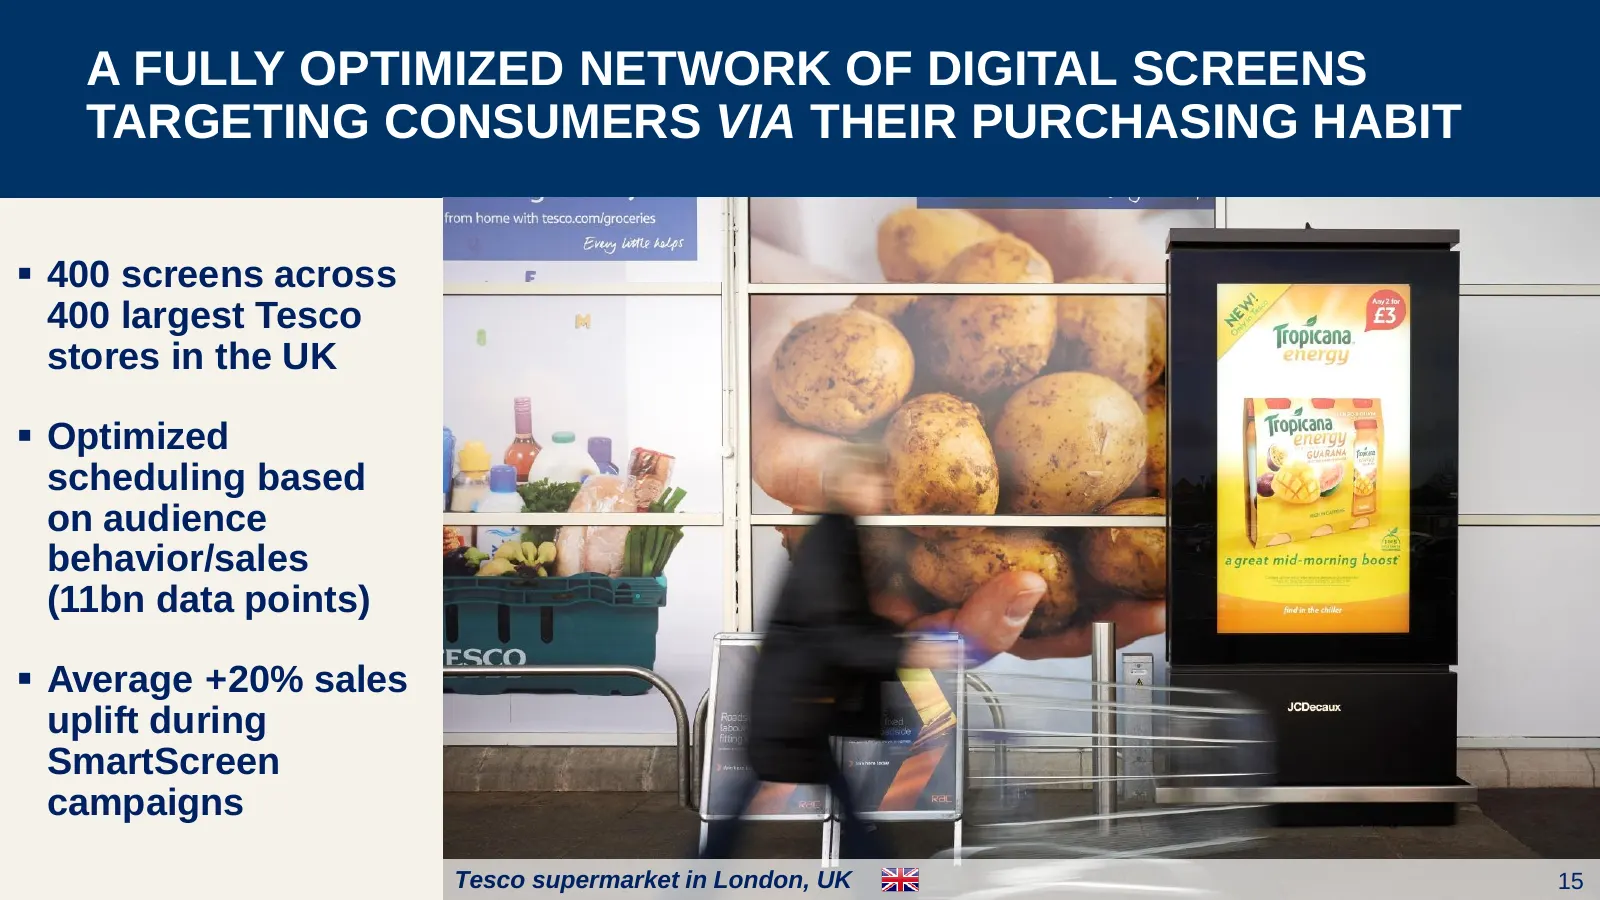
A FULLY OPTIMIZED NETWORK OF DIGITAL SCREENS TARGETING CONSUMERS VIA THEIR PURCHASING HABIT 400 screens across 400 largest Tesco stores in the UK Optimized scheduling based on audience behavior/sales (11bn data points) Average +20% sales uplift during SmartScreen campaigns Tesco supermarket in
Slide 16: Edinburgh Becomes Exclusive with JCDecaux
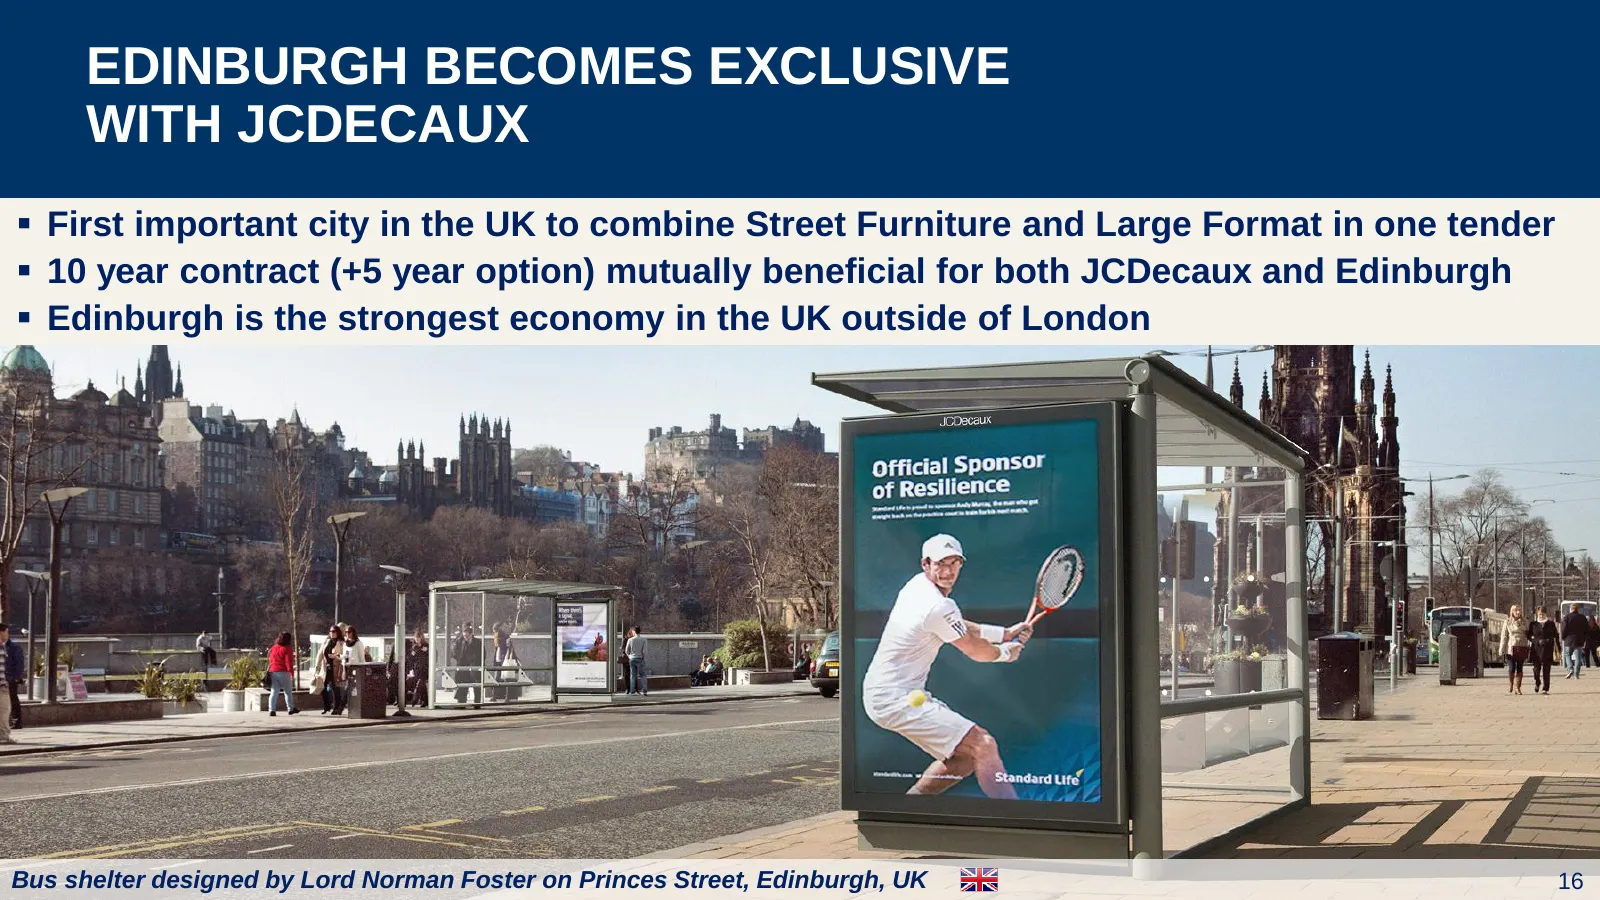
EDINBURGH BECOMES EXCLUSIVE WITH JCDECAUX First important city in the UK to combine Street Furniture and Large Format in one tender 10 year contract (+5 year option) mutually beneficial for both JCDecaux and Edinburgh Edinburgh is the strongest economy in the UK outside of London Bus shelter d

Slide 17: Roll-out of Premium Digital Street Furniture Assets
ROLL-OUT OF PREMIUM DIGITAL STREET FURNITURE ASSETS An increasing number of cities wants digital to be part of their Street Furniture core program São Paulo, Paris-La Défense, Edinburgh, Cologne, Stockholm, etc… are recent examples Digital panels in La Défense, Paris’ business district, France 1
Slide 18: Integration of Small Cells in Amsterdam
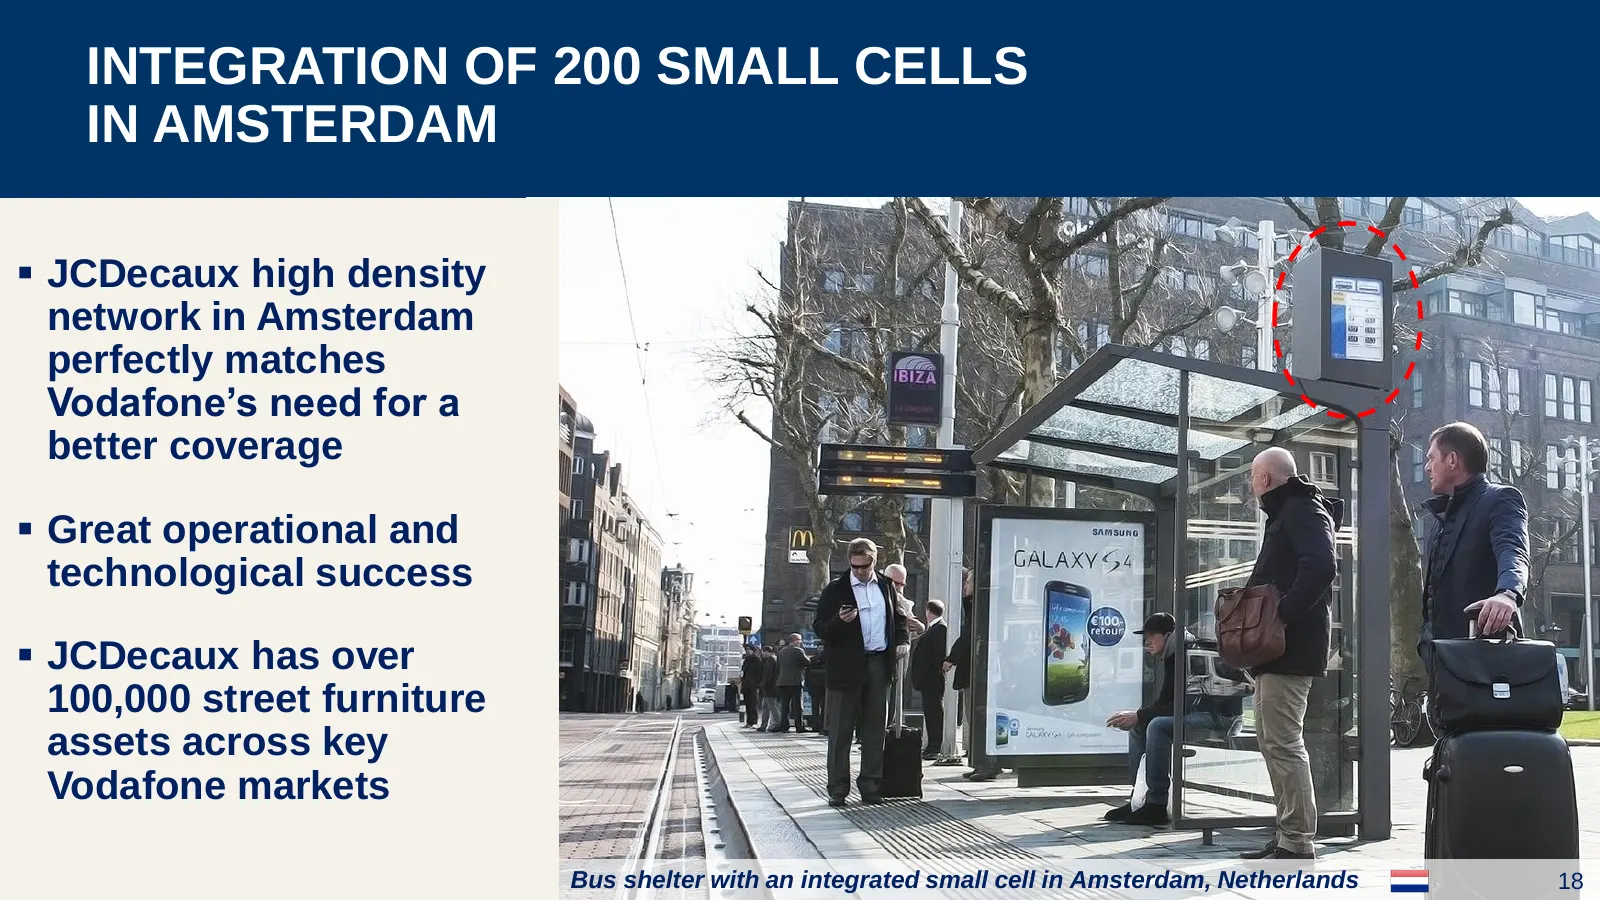
INTEGRATION OF 200 SMALL CELLS IN AMSTERDAM JCDecaux high density network in Amsterdam perfectly matches Vodafone’s need for a better coverage Great operational and technological success JCDecaux has over 100,000 street furniture assets across key Vodafone markets Bus shelter with an integrate
Slide 19: LatAm Platform Driving Organic Growth
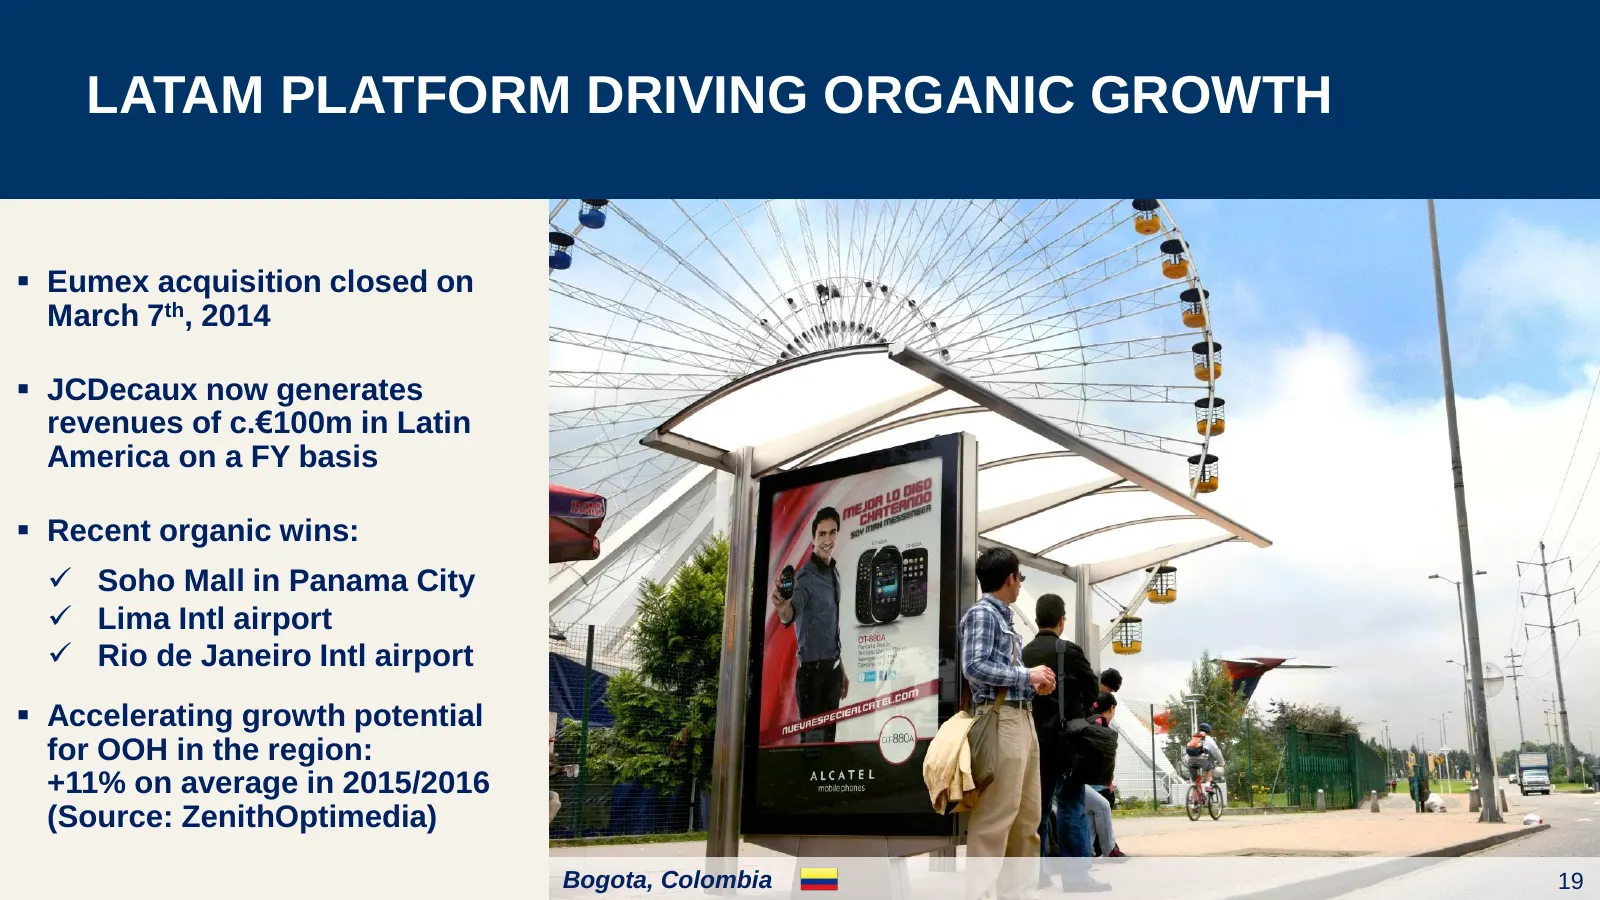
LATAM PLATFORM DRIVING ORGANIC GROWTH Eumex acquisition closed on March 7th, 2014 JCDecaux now generates revenues of c.€100m in Latin America on a FY basis Recent organic wins: Soho Mall in Panama City Lima Intl airport Rio de Janeiro Intl airport Accelerating growth potential for OOH
Slide 20: Acquisition of the Largest Outdoor Advertising Operator in Africa
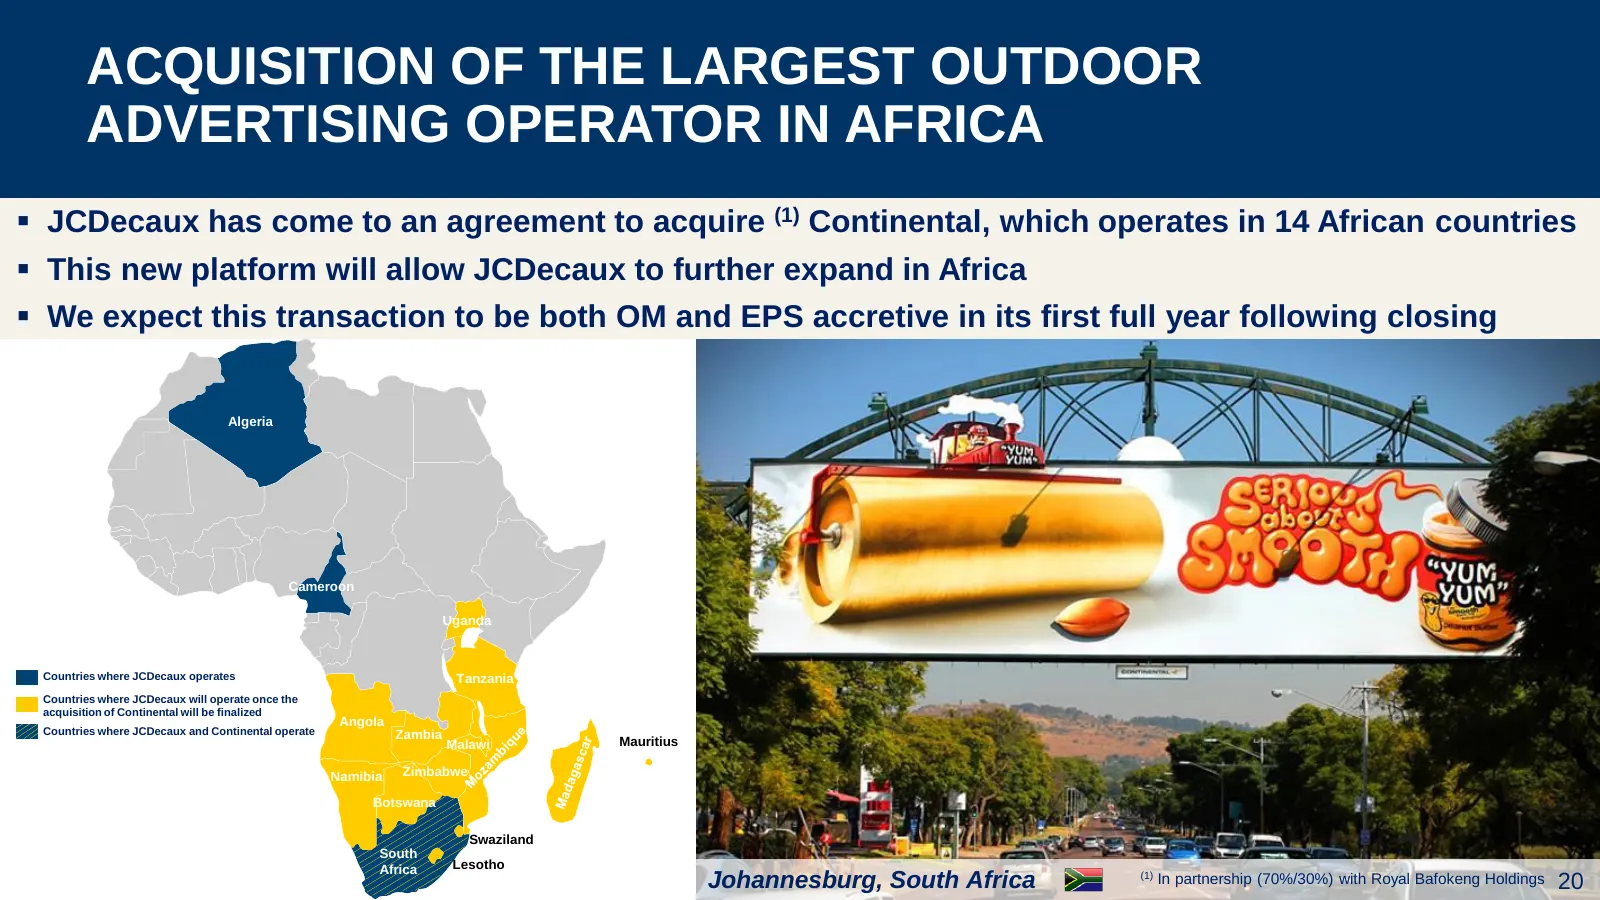
ACQUISITION OF THE LARGEST OUTDOOR ADVERTISING OPERATOR IN AFRICA JCDecaux has come to an agreement to acquire (1) Continental, which operates in 14 African countries This new platform will allow JCDecaux to further expand in Africa We expect this transaction to be both OM and EPS accretive in
Slide 21: Strong Prospects for Outdoor Advertising in Africa
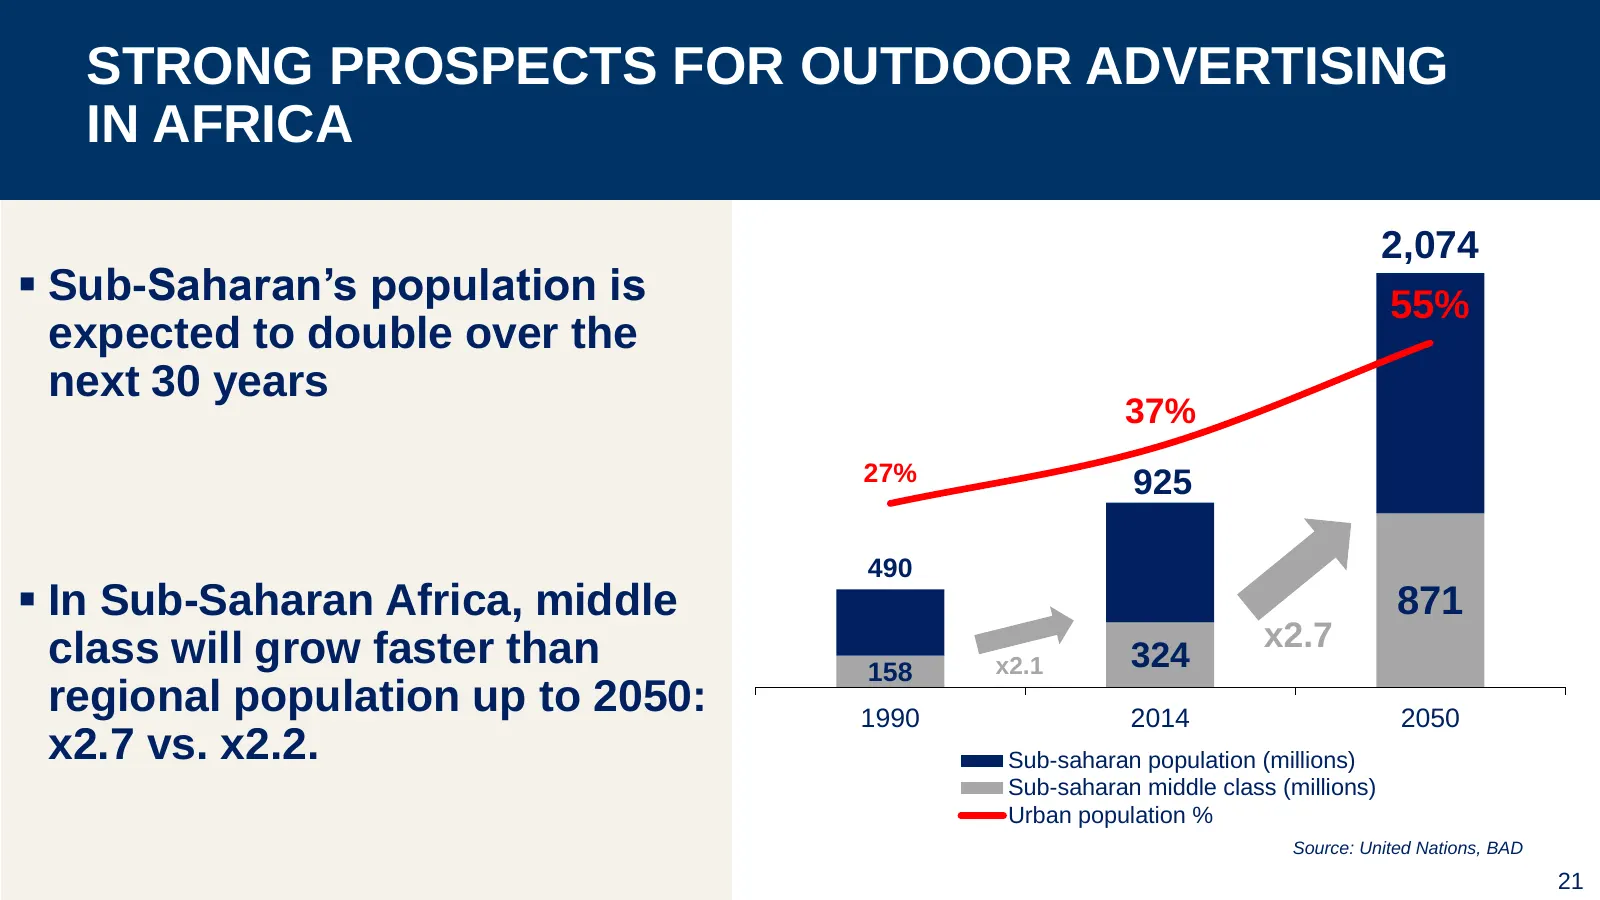
STRONG PROSPECTS FOR OUTDOOR ADVERTISING IN AFRICA 2,074 Sub-Saharan’s population is 55% expected to double over the next 30 years 37% 27% 925 490 In Sub-Saharan Africa, middle 871 class will grow faster than x2.7 158 x2.1 324 regional population up to 2050: 1990 2014 2050 x2.7 vs. x2.2. Sub-sah
Slide 22: Cemusa: Update on the Acquisition Process
CEMUSA: UPDATE ON THE ACQUISITION PROCESS Approval from the Spanish regulators obtained in October 2014 On-going change of control discussions with New York City Portugal: Acquisition under review by the Portuguese competition authorities 22

Slide 23: Financial Highlights
FINANCIAL HIGHLIGHTS
Slide 24: 2014 Results
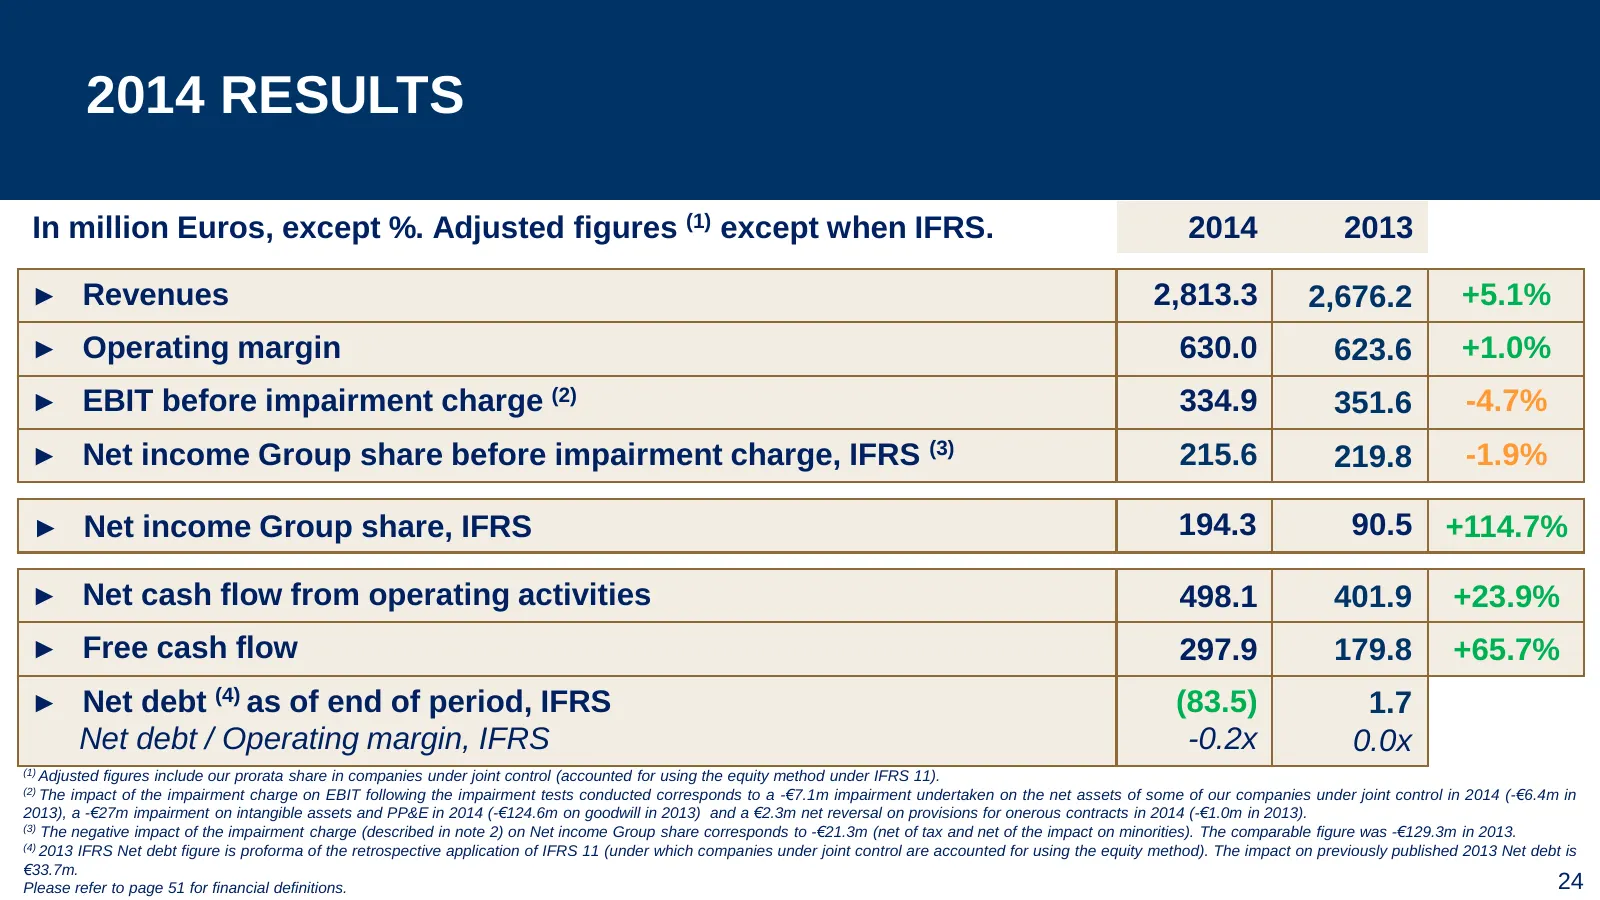
2014 RESULTS In million Euros, except %. Adjusted figures (1) except when IFRS. 2014 2013 ► Revenues 2,813.3 2,676.2 +5.1% ► Operating margin 630.0 623.6 +1.0% ► EBIT before impairment charge (2) 334.9 351.6 -4.7% ► Net income Group share before impairment charge, IFRS (3) 215.6 219.8 -1.9% ► Net in
Slide 25: Analysis of Operating Margin
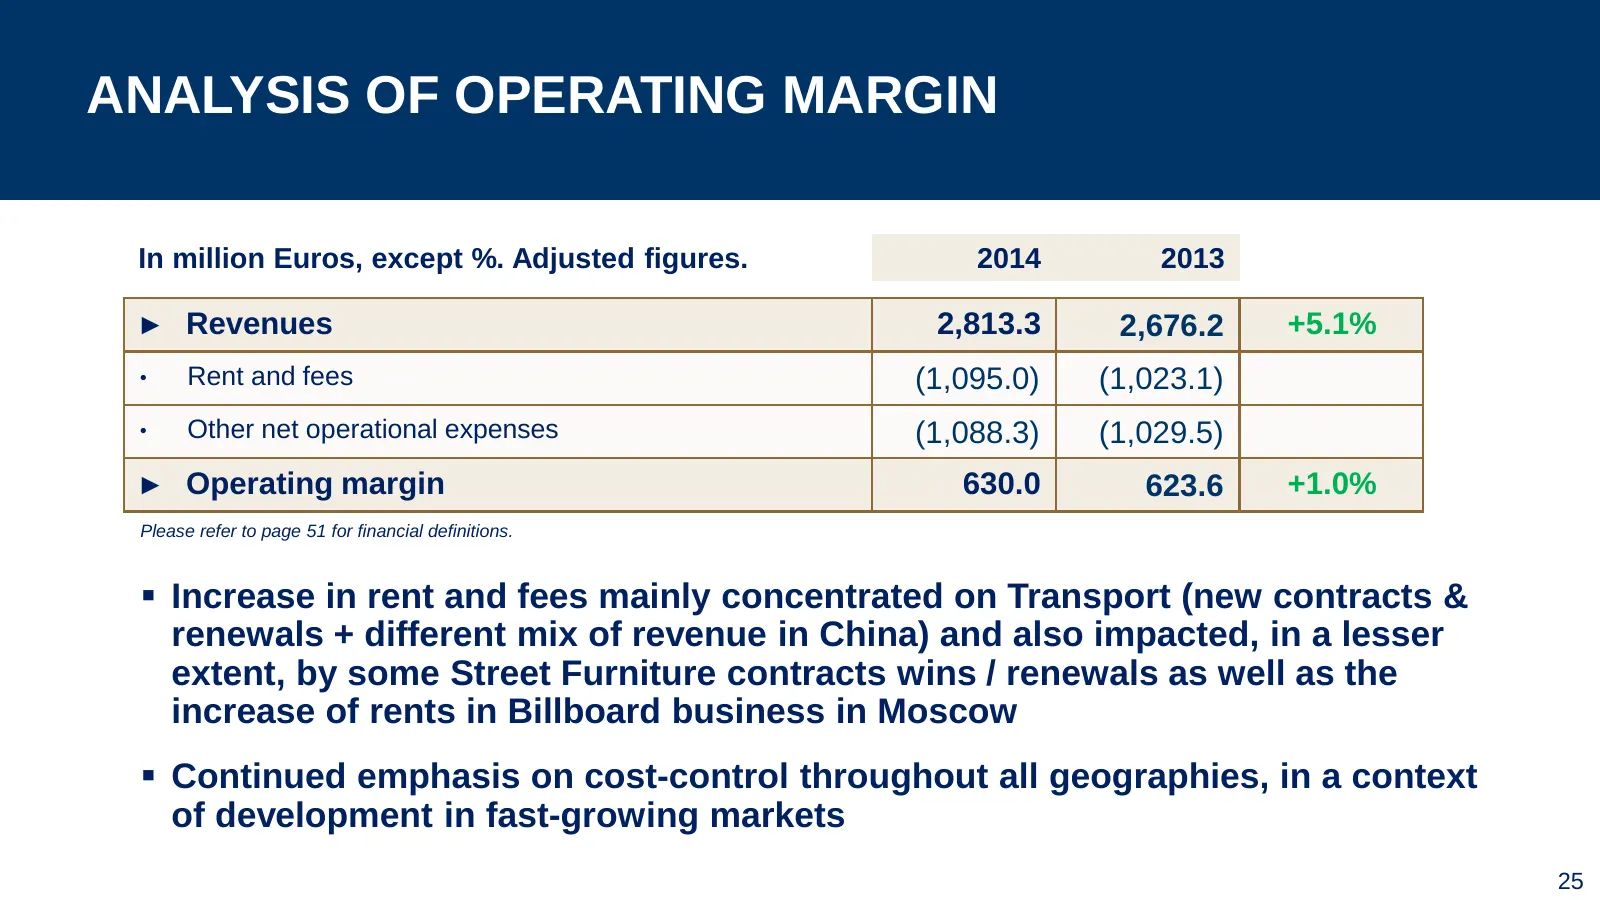
ANALYSIS OF OPERATING MARGIN In million Euros, except %. Adjusted figures. 2014 2013 ► Revenues 2,813.3 2,676.2 +5.1% • Rent and fees (1,095.0) (1,023.1) • Other net operational expenses (1,088.3) (1,029.5) ► Operating margin 630.0 623.6 +1.0% Please refer to page 51 for financial definitions. Inc
Slide 26: Operating Margin to EBIT
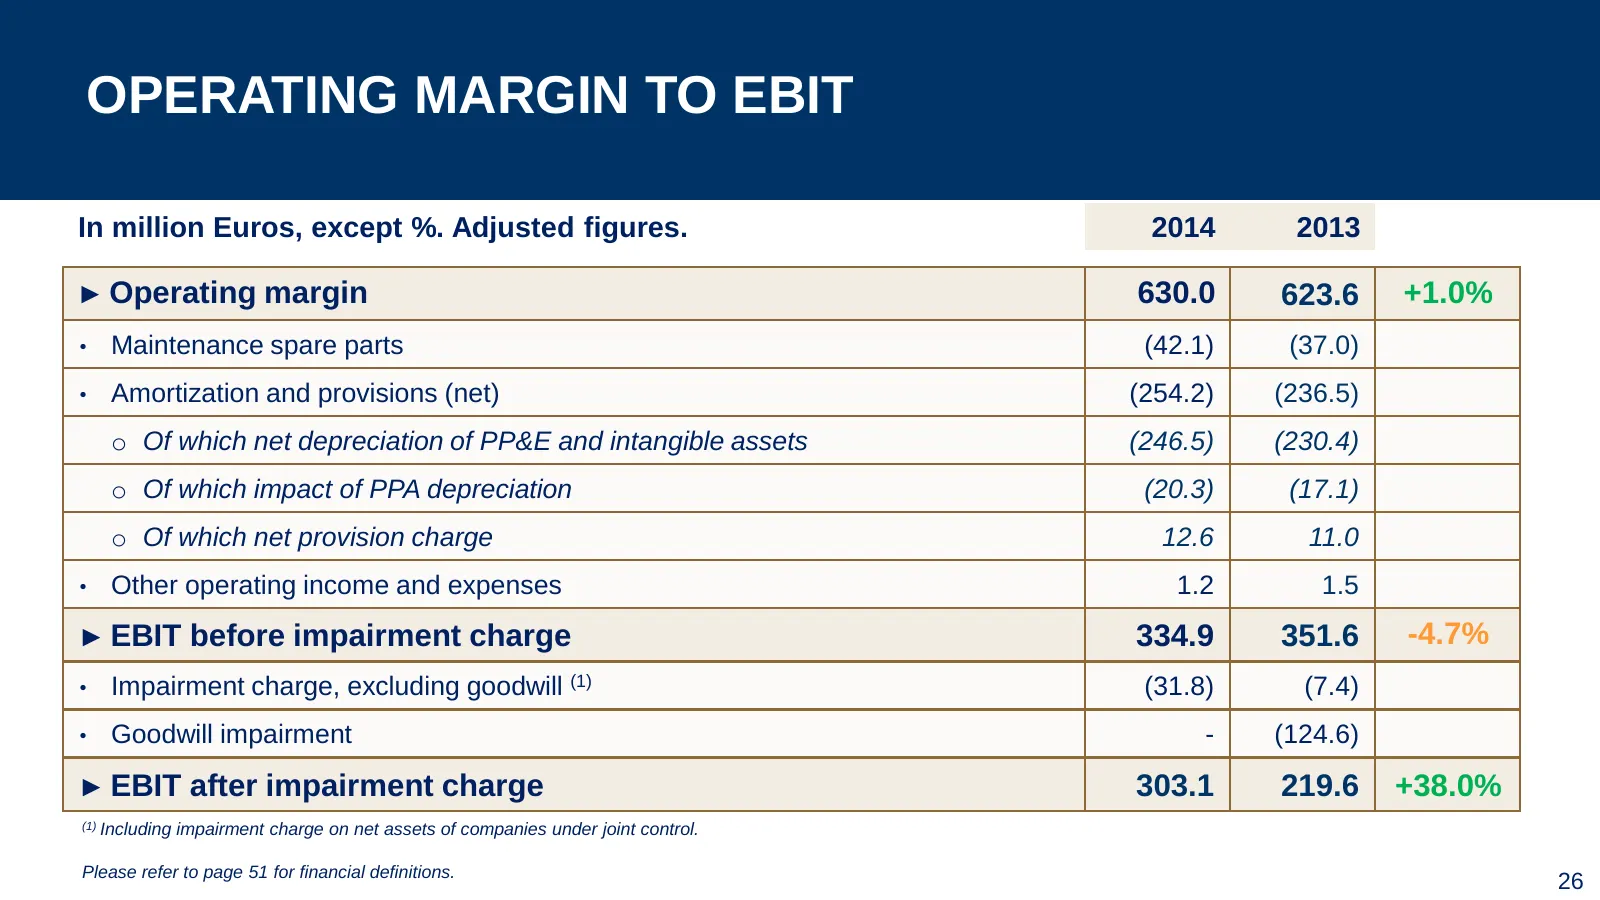
OPERATING MARGIN TO EBIT In million Euros, except %. Adjusted figures. 2014 2013 ► Operating margin 630.0 623.6 +1.0% • Maintenance spare parts (42.1) (37.0) • Amortization and provisions (net) (254.2) (236.5) o Of which net depreciation of PP&E and intangible assets (246.5) (230.4) o Of which impac
Slide 27: Margins by Segment
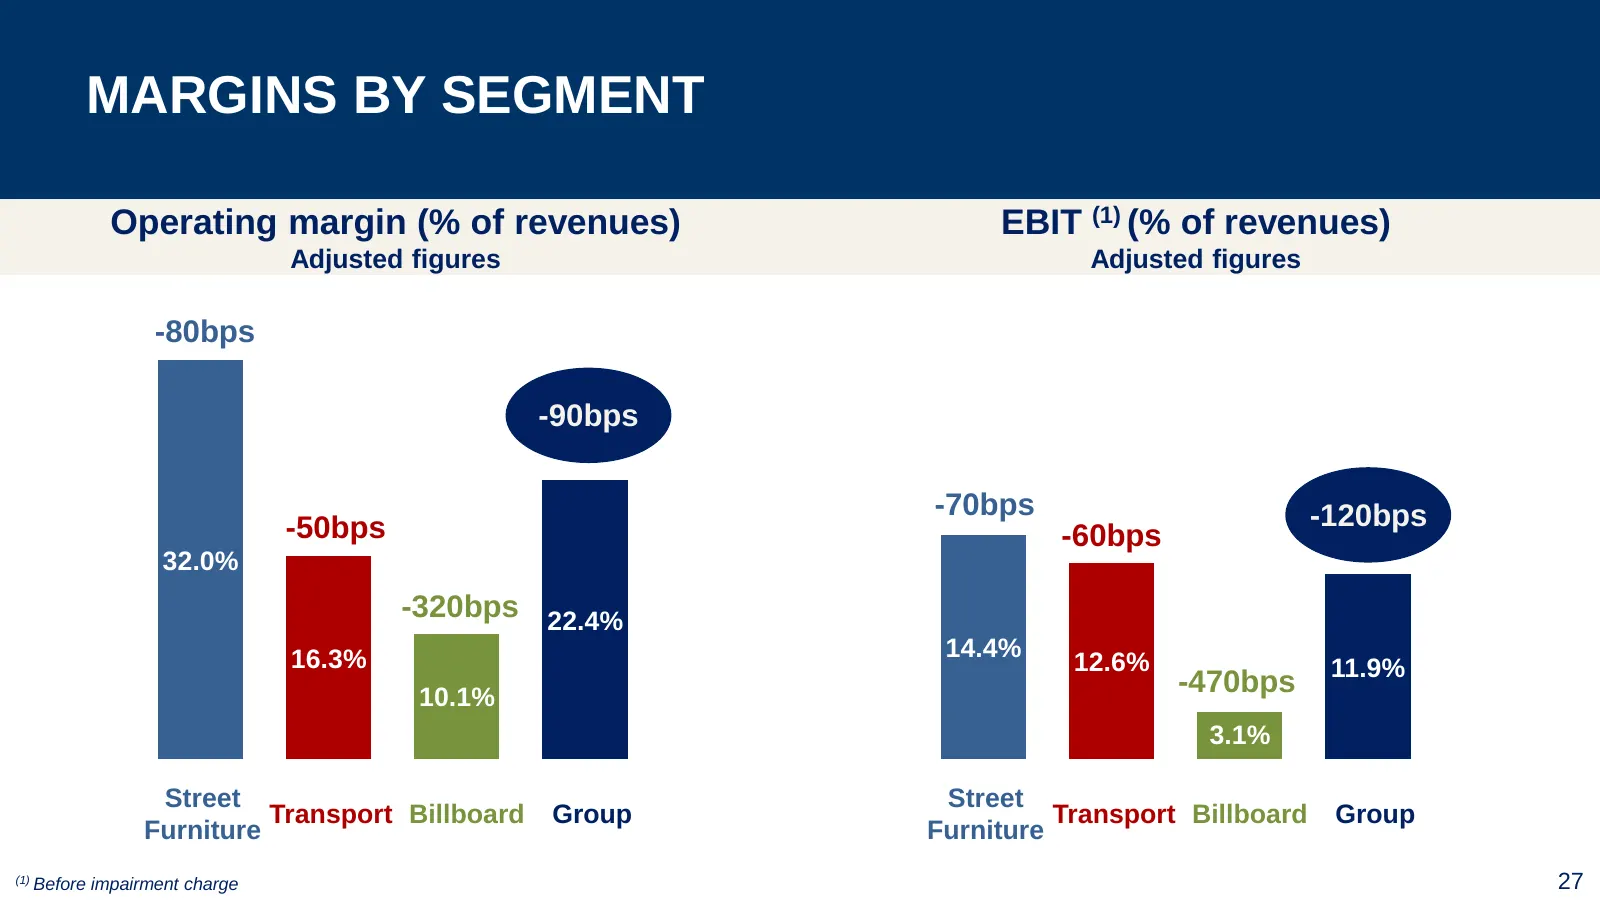
MARGINS BY SEGMENT Operating margin (% of revenues) EBIT (1) (% of revenues) Adjusted figures Adjusted figures -80bps -90bps -70bps -120bps -50bps -60bps 32.0% -320bps 22.4% 16.3% 14.4% 12.6% 11.9% 10.1% -470bps 3.1% Street Street Transport Billboard Group Transport Billboard Group Furniture Furnitu
Slide 28: EBIT to Net Income
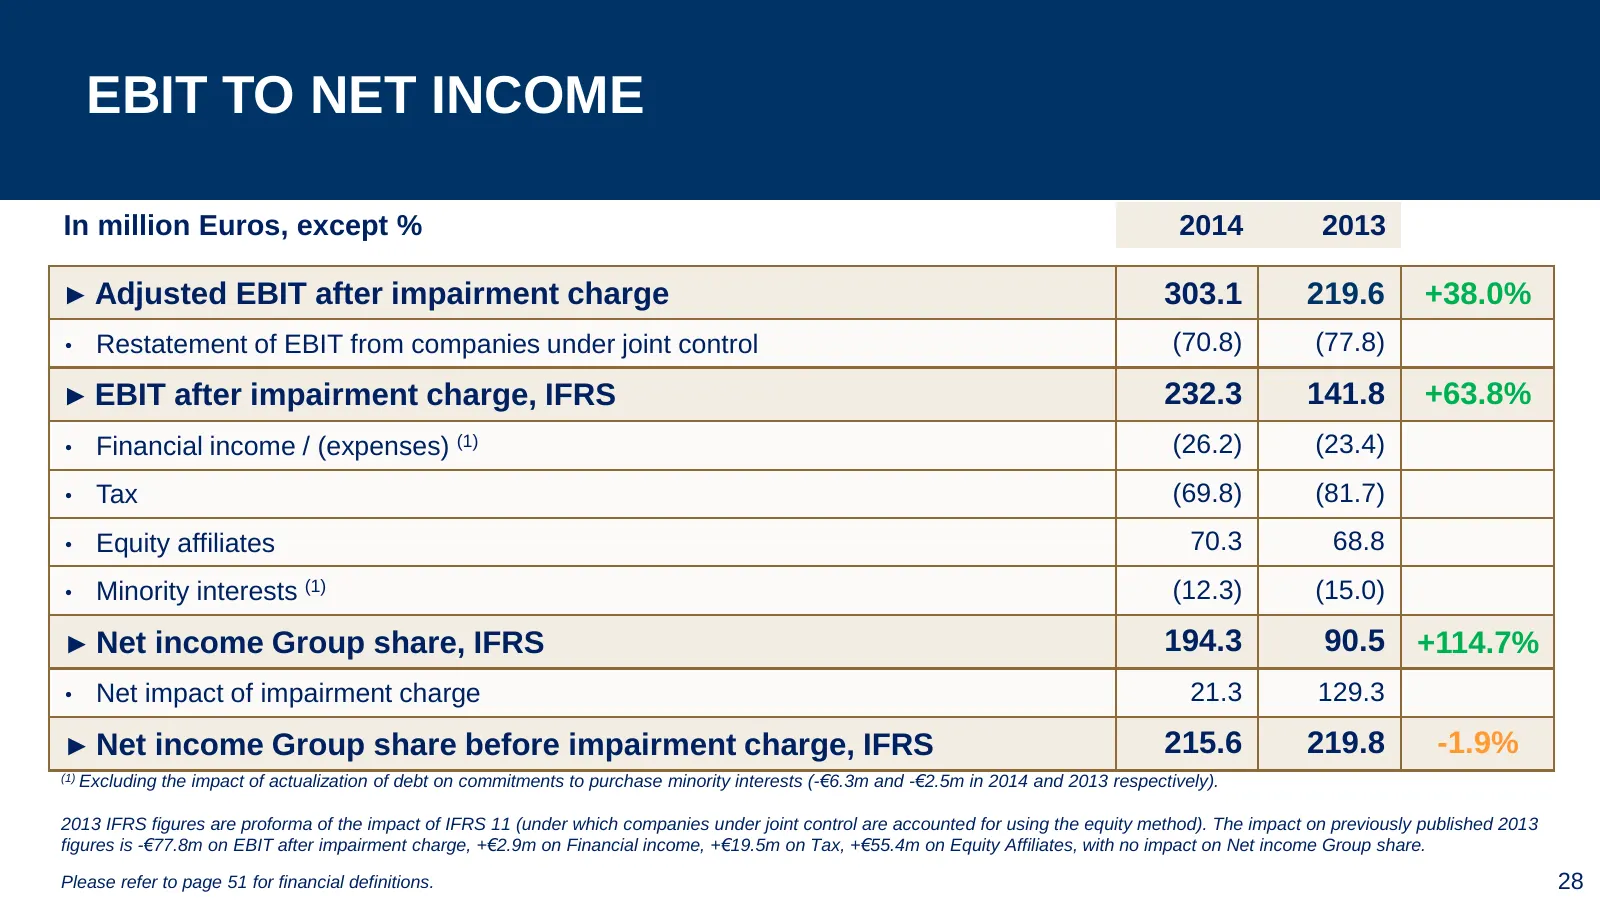
EBIT TO NET INCOME In million Euros, except % 2014 2013 ► Adjusted EBIT after impairment charge 303.1 219.6 +38.0% • Restatement of EBIT from companies under joint control (70.8) (77.8) ► EBIT after impairment charge, IFRS 232.3 141.8 +63.8% • Financial income / (expenses) (1) (26.2) (23.4) • Tax (6
Slide 29: Cash Flow Statement
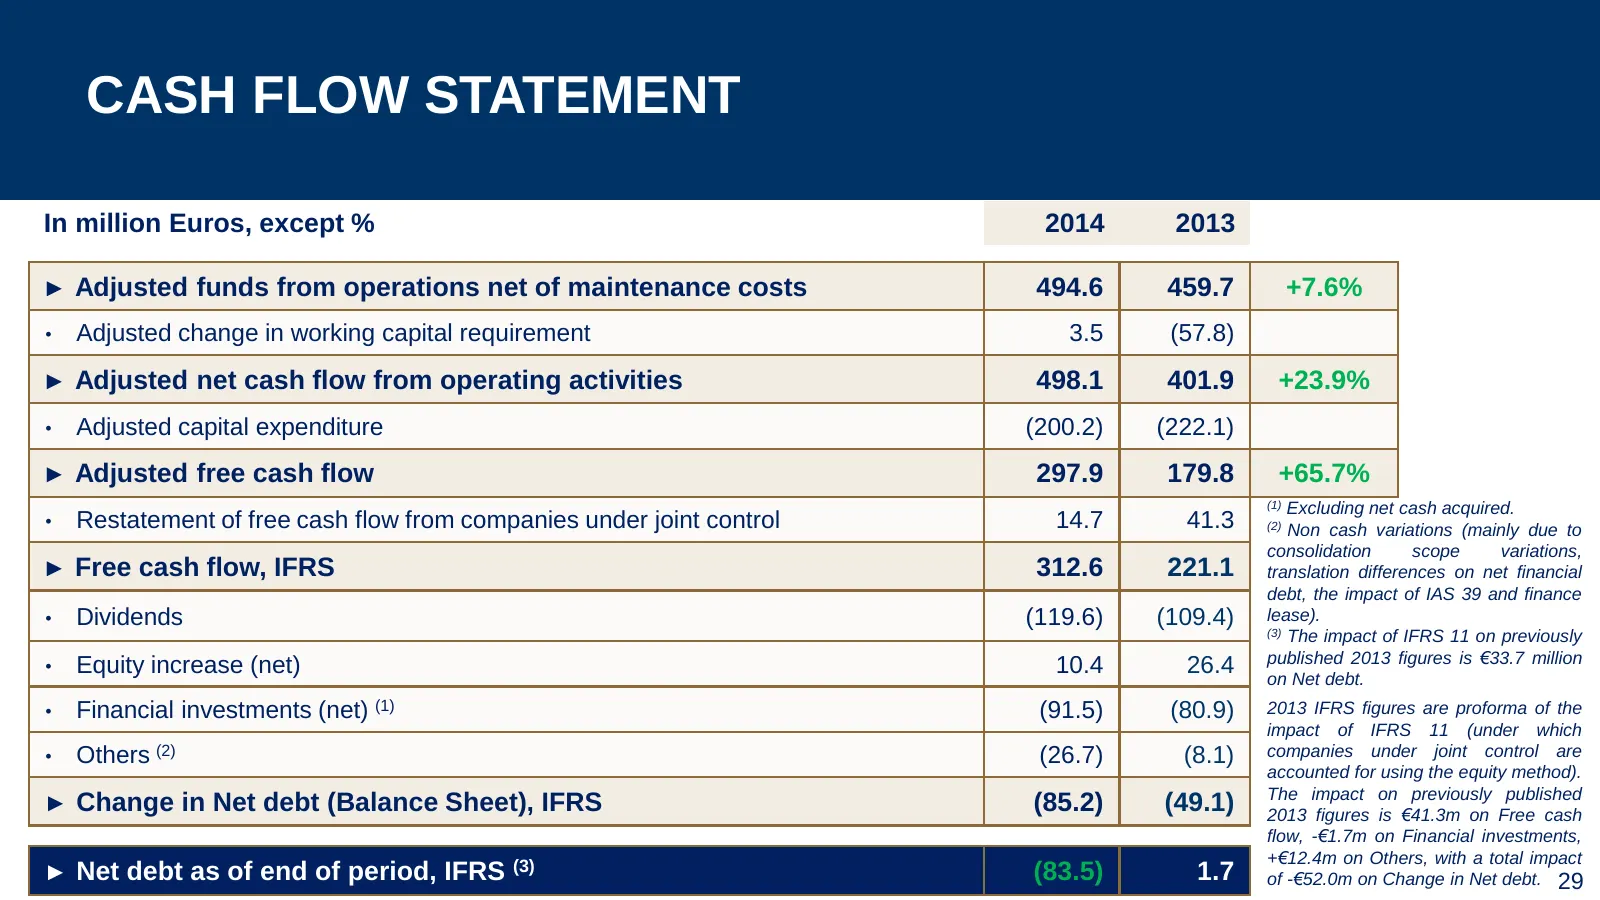
CASH FLOW STATEMENT In million Euros, except % 2014 2013 ► Adjusted funds from operations net of maintenance costs 494.6 459.7 +7.6% • Adjusted change in working capital requirement 3.5 (57.8) ► Adjusted net cash flow from operating activities 498.1 401.9 +23.9% • Adjusted capital expenditure (200.2
Slide 30: Breakdown of Capex
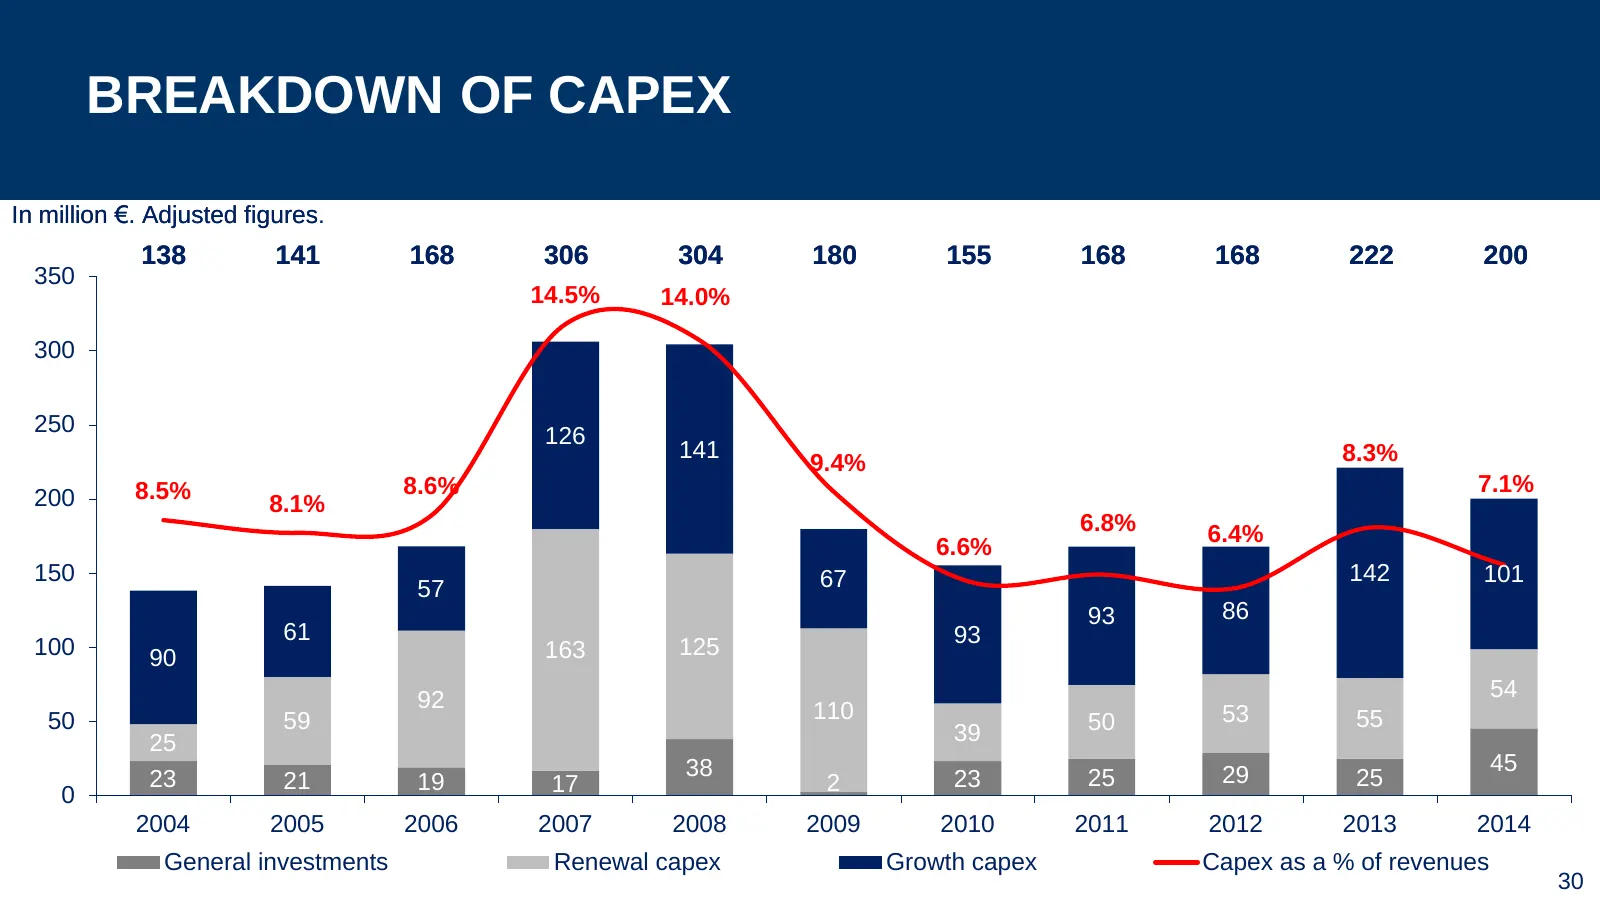
BREAKDOWN OF CAPEX In million €. Adjusted figures. figures 138 141 168 306 304 180 155 168 168 222 200 350 14.5% 14.0% 300 250 126 141 8.3% 9.4% 8.5% 8.6% 7.1% 200 8.1% 6.8% 6.4% 6.6% 150 67 142 101 57 93 86 61 93 100 90 163 125 92 54 50 59 110 50 53 55 25 39 38 29 45 23 21 19 17 2 23 25 25 0 2004 2

Slide 31: 2014 Financial Highlights
2014 FINANCIAL HIGHLIGHTS Record revenues and operating margin A solid free cash flow generation A very strong balance sheet with a net positive cash position giving us the flexibility to allocate our resources in the future 31

Slide 32: Growth Strategy and Outlook
GROWTH STRATEGY AND OUTLOOK
Slide 33: On-going Urbanization
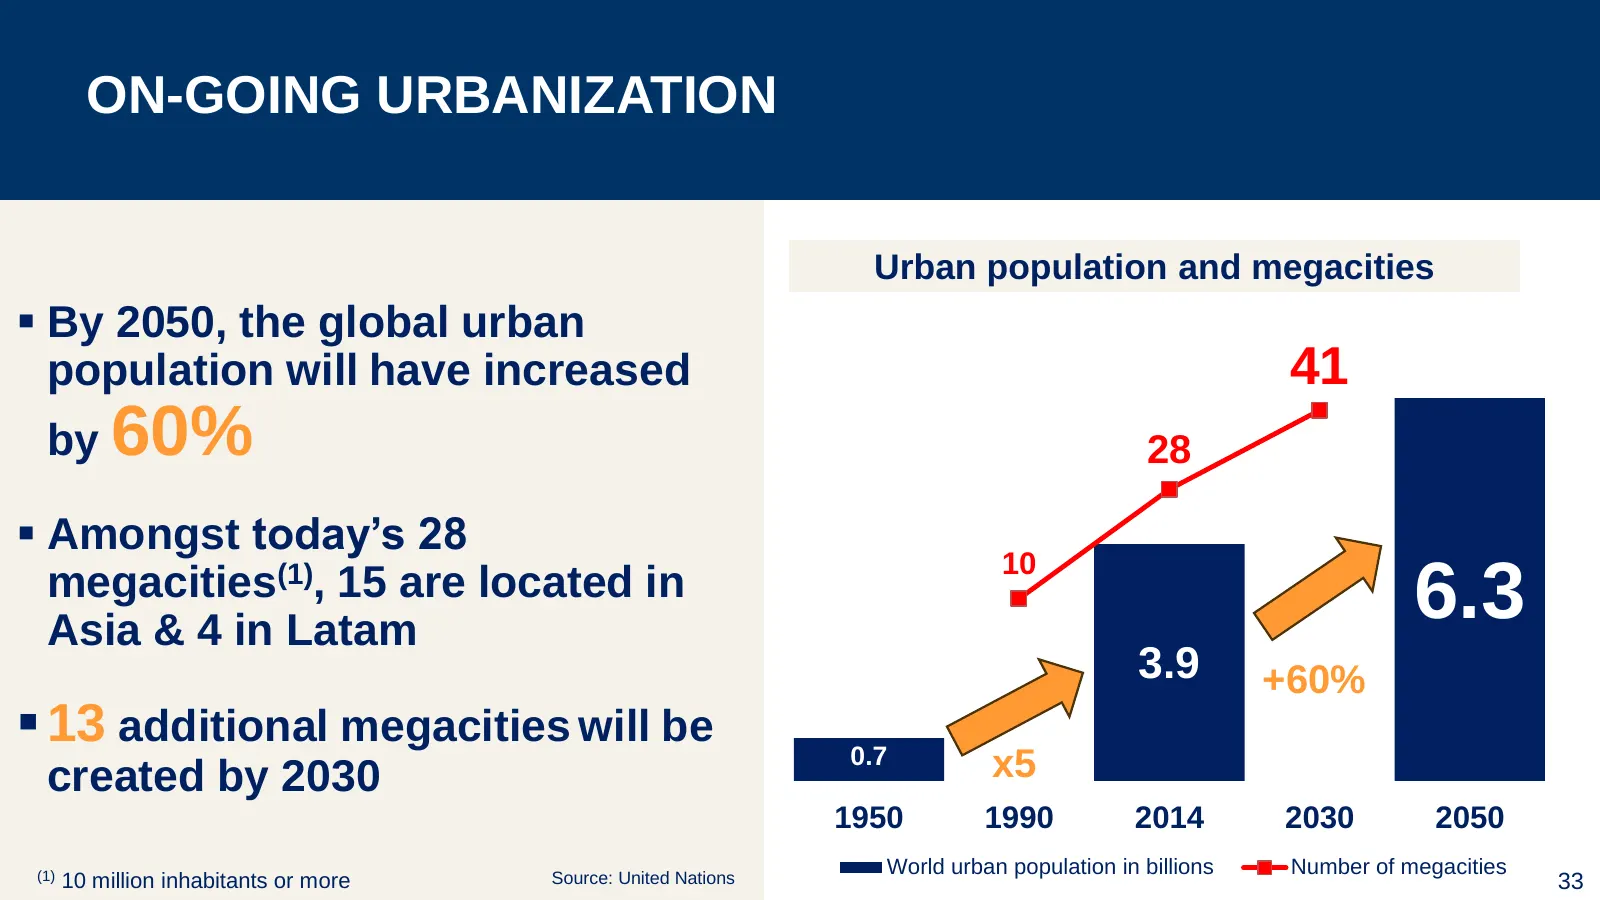
ON-GOING URBANIZATION Urban population and megacities By 2050, the global urban population will have increased 41 by 60% 28 Amongst today’s 28 10 megacities(1), 15 are located in Asia & 4 in Latam 6.3 3.9 +60% 13 additional megacities will be 0.7 created by 2030 x5 1950 1990 2014 2030 2050 (1)
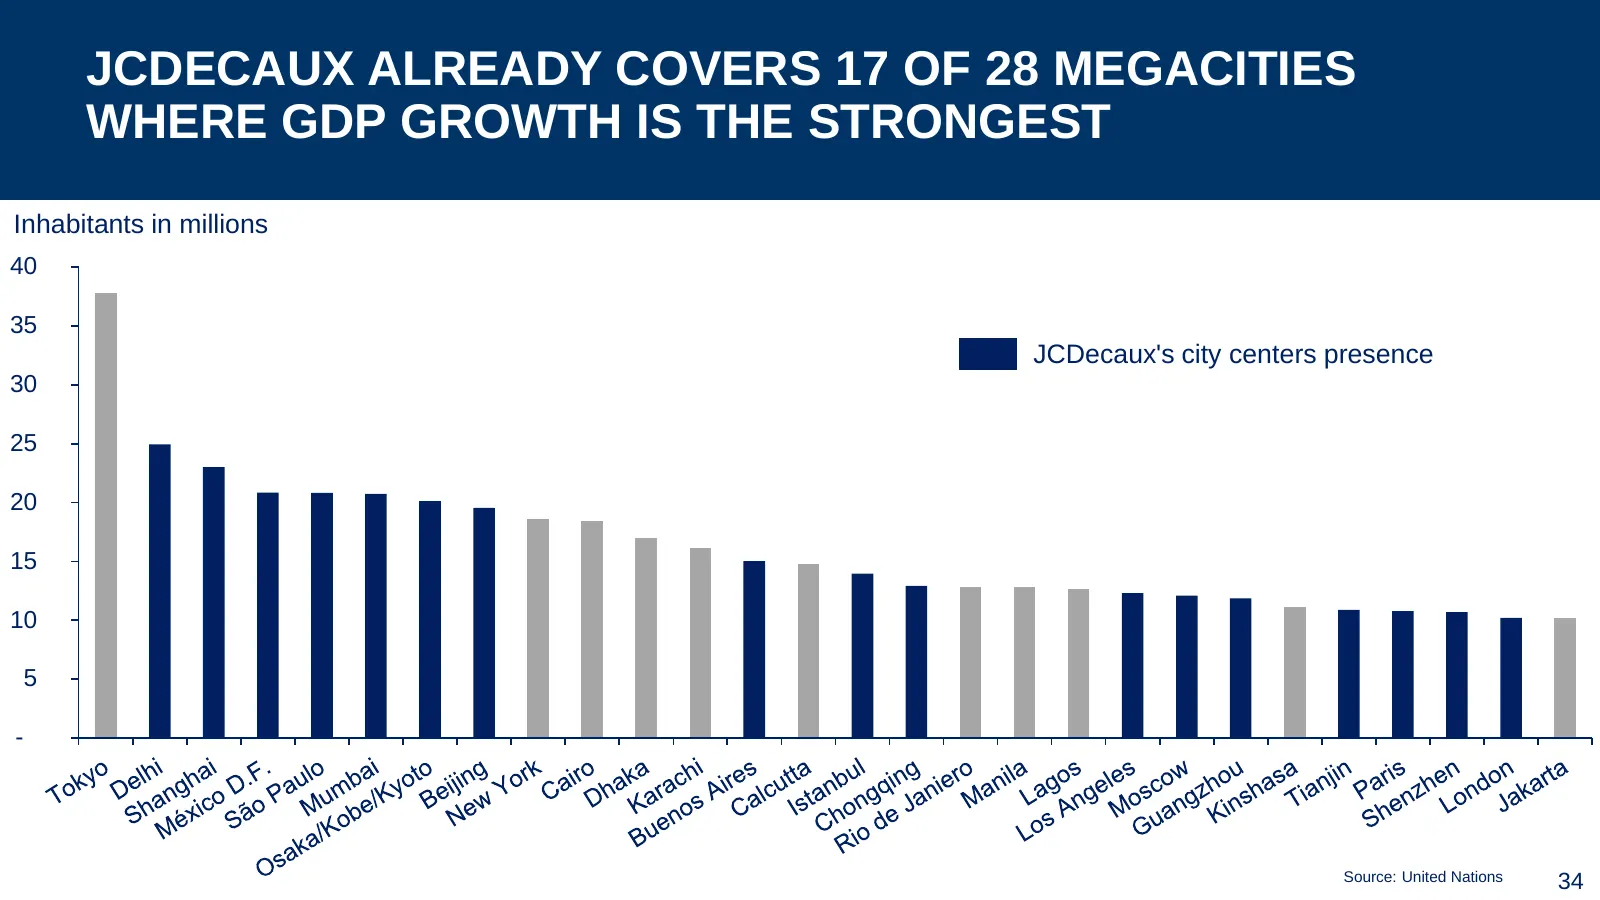
Slide 34: JCDecaux Already Covers 17 of 28 Megacities
JCDECAUX ALREADY COVERS 17 OF 28 MEGACITIES WHERE GDP GROWTH IS THE STRONGEST Inhabitants in millions 40 35 JCDecaux's city centers presence 30 25 20 15 10 5 - Source: United Nations 34
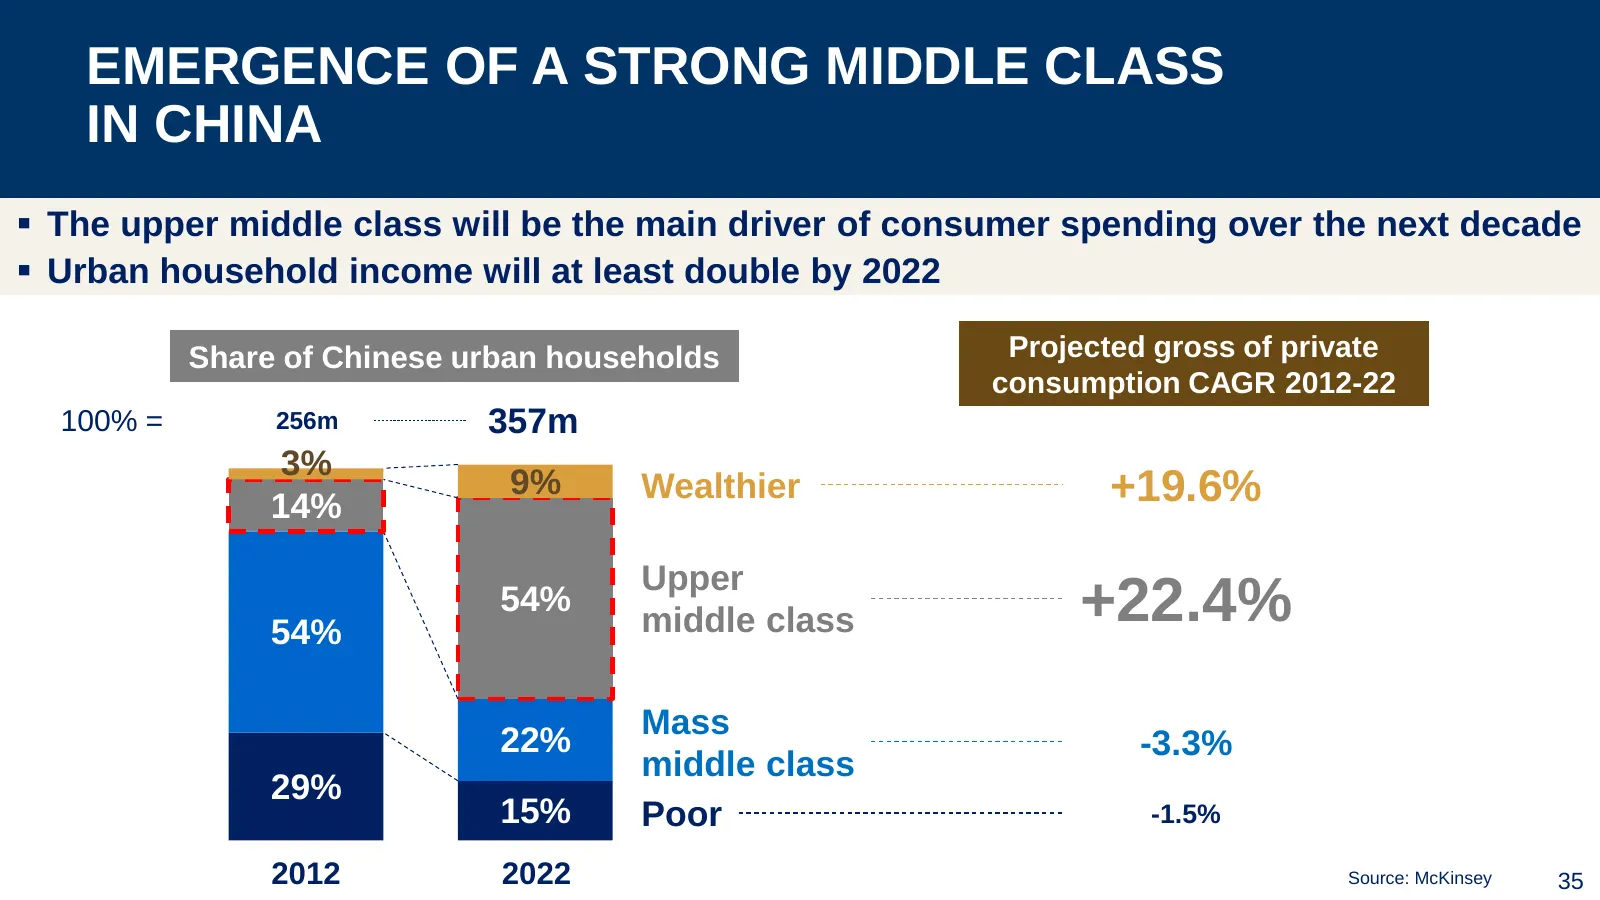
Slide 35: Emergence of a Strong Middle Class in China
EMERGENCE OF A STRONG MIDDLE CLASS IN CHINA The upper middle class will be the main driver of consumer spending over the next decade Urban household income will at least double by 2022 Share of Chinese urban households Projected gross of private consumption CAGR 2012-22 100% = 256m 357m 3% 9% We
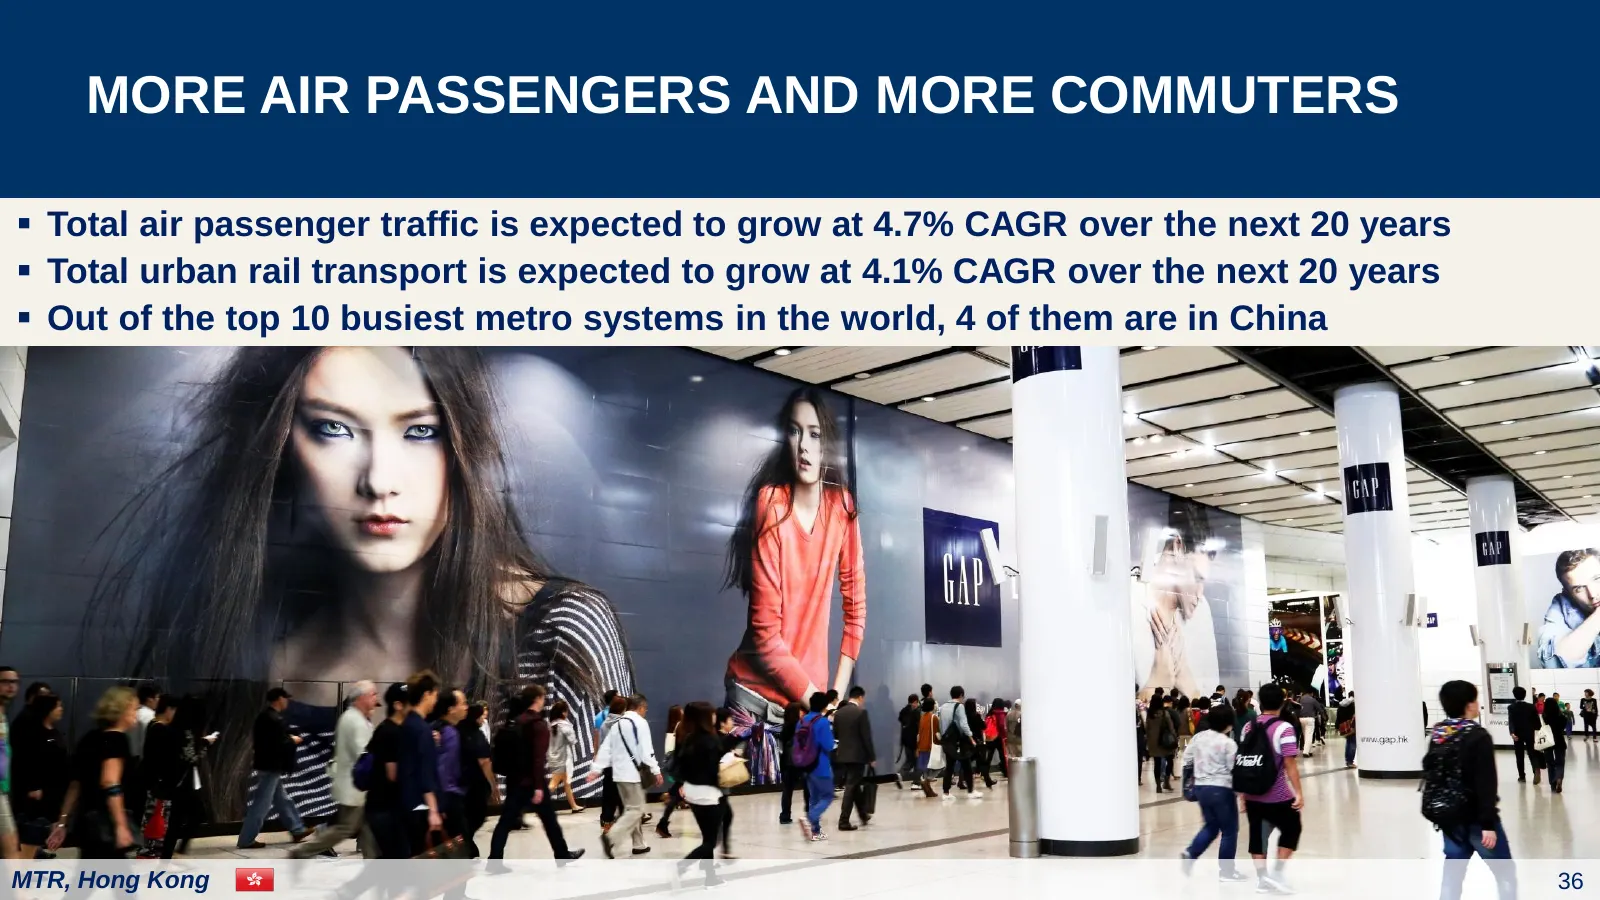
Slide 36: More Air Passengers and More Commuters
MORE AIR PASSENGERS AND MORE COMMUTERS Total air passenger traffic is expected to grow at 4.7% CAGR over the next 20 years Total urban rail transport is expected to grow at 4.1% CAGR over the next 20 years Out of the top 10 busiest metro systems in the world, 4 of them are in China MTR, Hong K
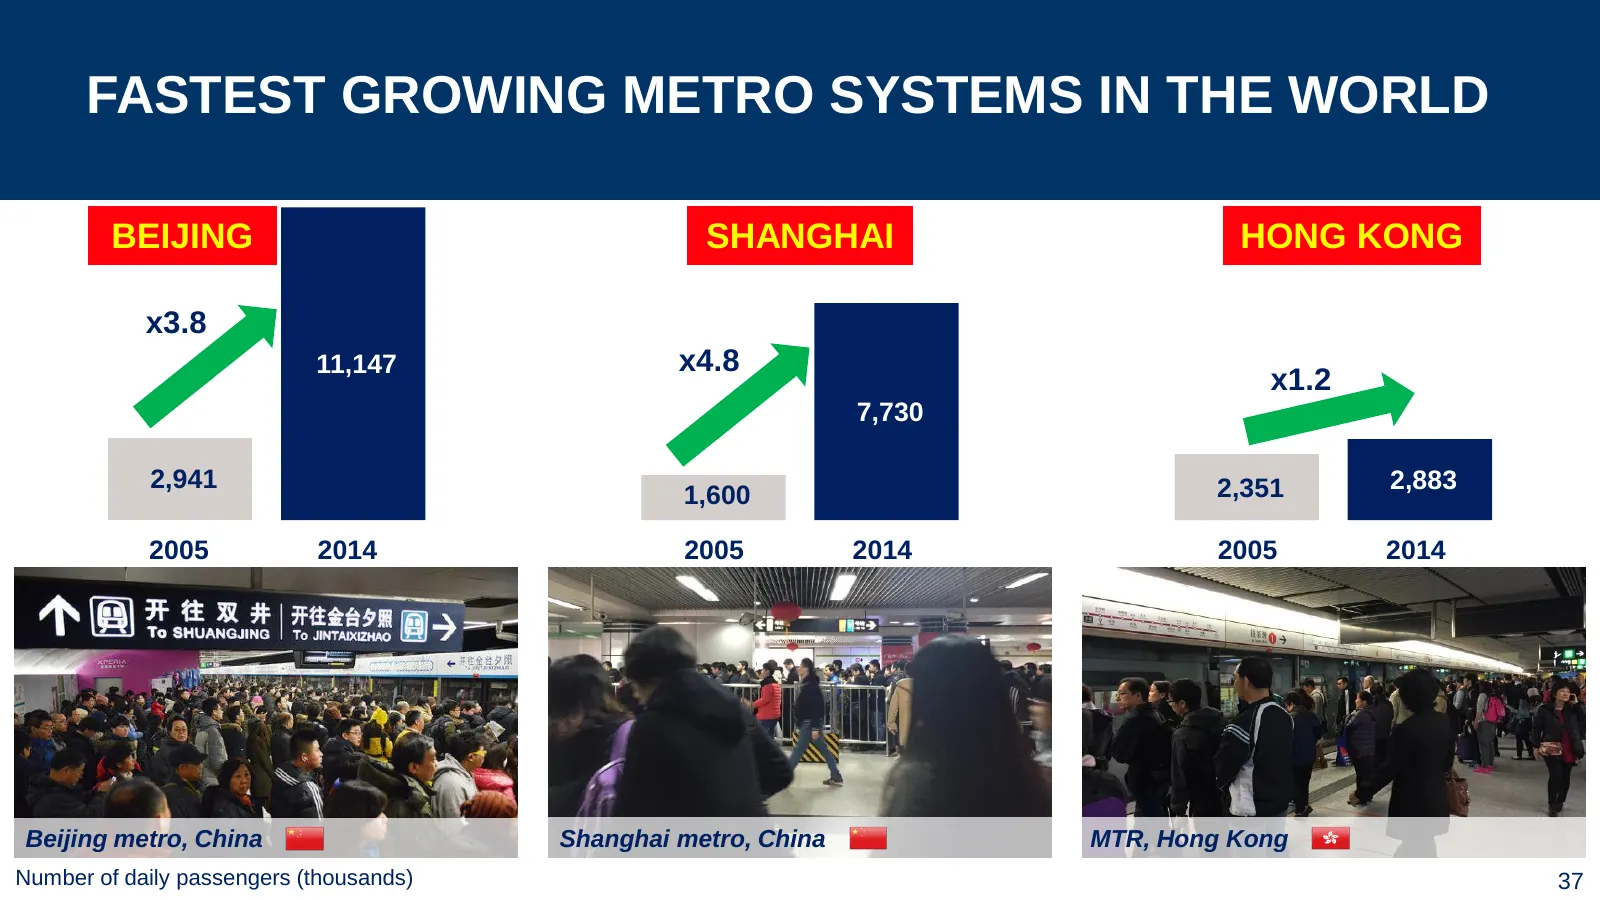
Slide 37: Fastest Growing Metro Systems in the World
FASTEST GROWING METRO SYSTEMS IN THE WORLD BEIJING SHANGHAI HONG KONG x3.8 11,147 x4.8 x1.2 7,730 2,941 2,351 2,883 1,600 2005 2014 2005 2014 2005 2014 Beijing metro, China Shanghai metro, China MTR, Hong Kong Number of daily passengers (thousands) 37
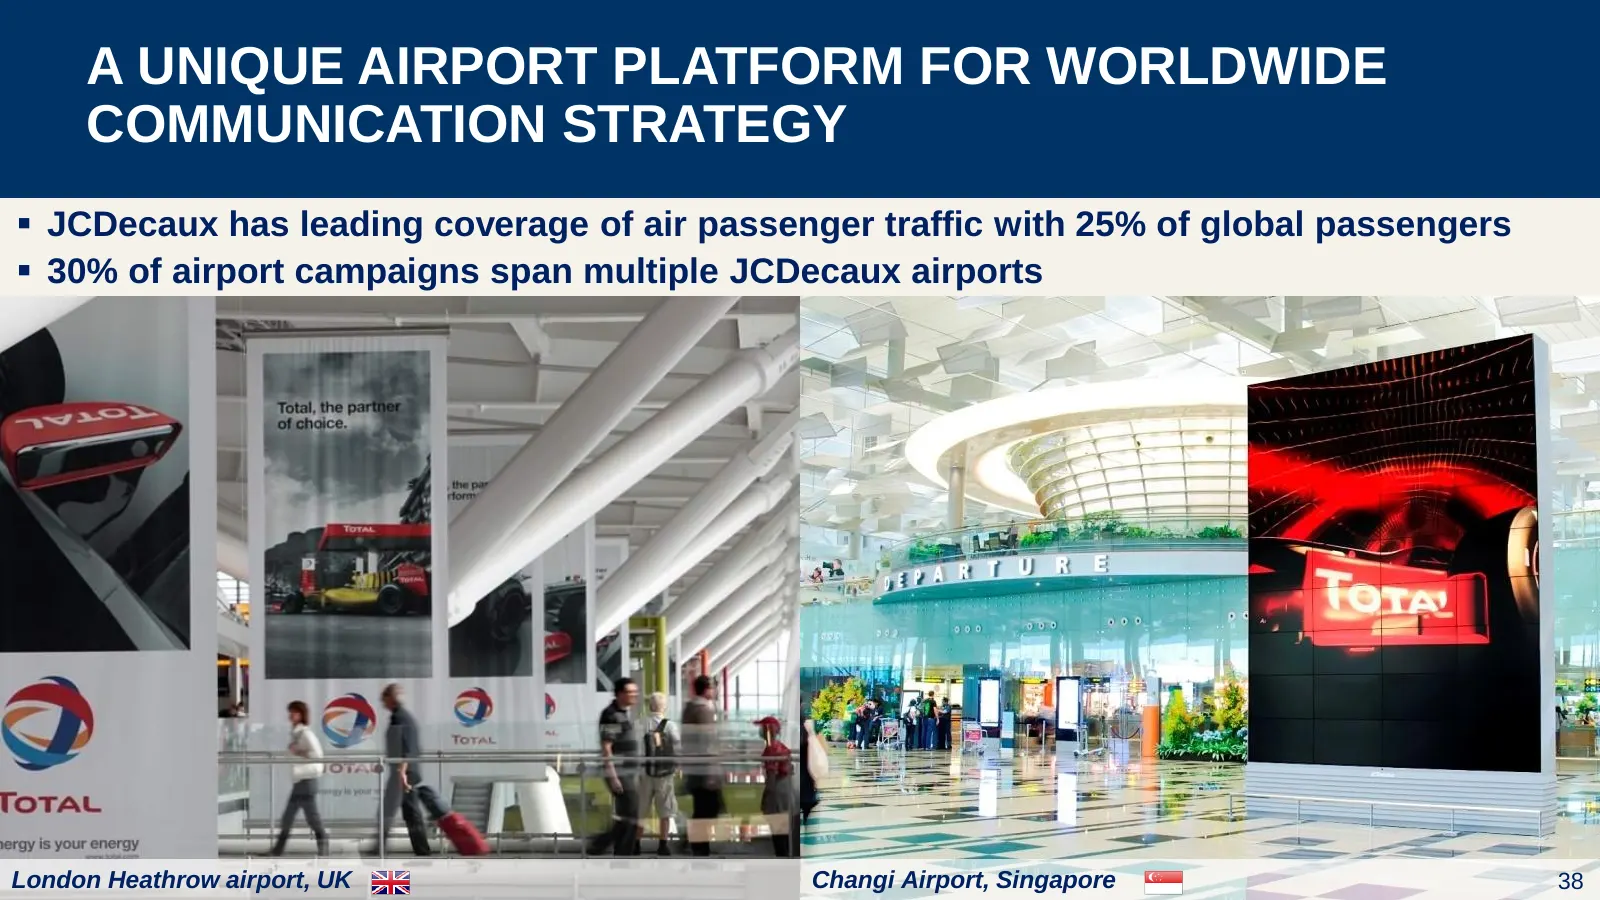
Slide 38: A Unique Airport Platform for Worldwide Communication Strategy
A UNIQUE AIRPORT PLATFORM FOR WORLDWIDE COMMUNICATION STRATEGY JCDecaux has leading coverage of air passenger traffic with 25% of global passengers 30% of airport campaigns span multiple JCDecaux airports London Heathrow airport, UK Changi Airport, Singapore 38
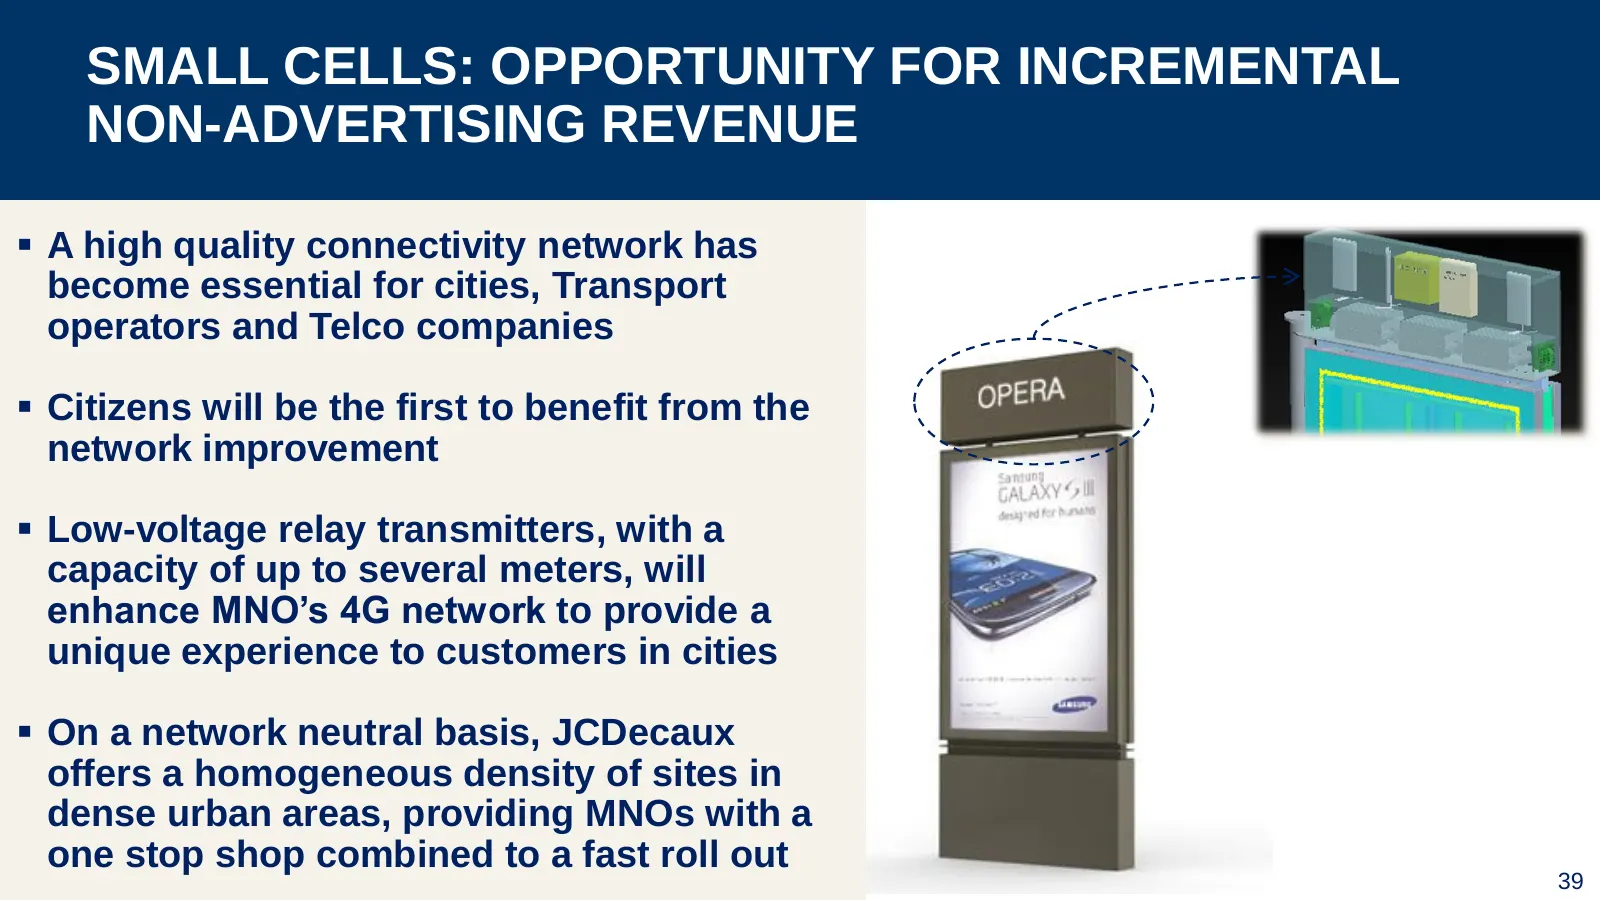
Slide 39: Small Cells: Opportunity for Incremental Non-Advertising Revenue
SMALL CELLS: OPPORTUNITY FOR INCREMENTAL NON-ADVERTISING REVENUE A high quality connectivity network has become essential for cities, Transport operators and Telco companies Citizens will be the first to benefit from the network improvement Low-voltage relay transmitters, with a capacity of up

Slide 40: Free WiFi in ADP Paris Airports, Sponsored by Advertising
FREE WIFI IN “ADP” (PARIS AIRPORTS), SPONSORED BY ADVERTISING THROUGH JCDECAUX Marketing between July 1st, 2014 and June 30th, 2015 A master contract sponsored by “Hello bank!” 3 other advertisers: L’Oréal: targeting Brazilian, Russian and Chinese passengers Huawei (Online + Offline) Air
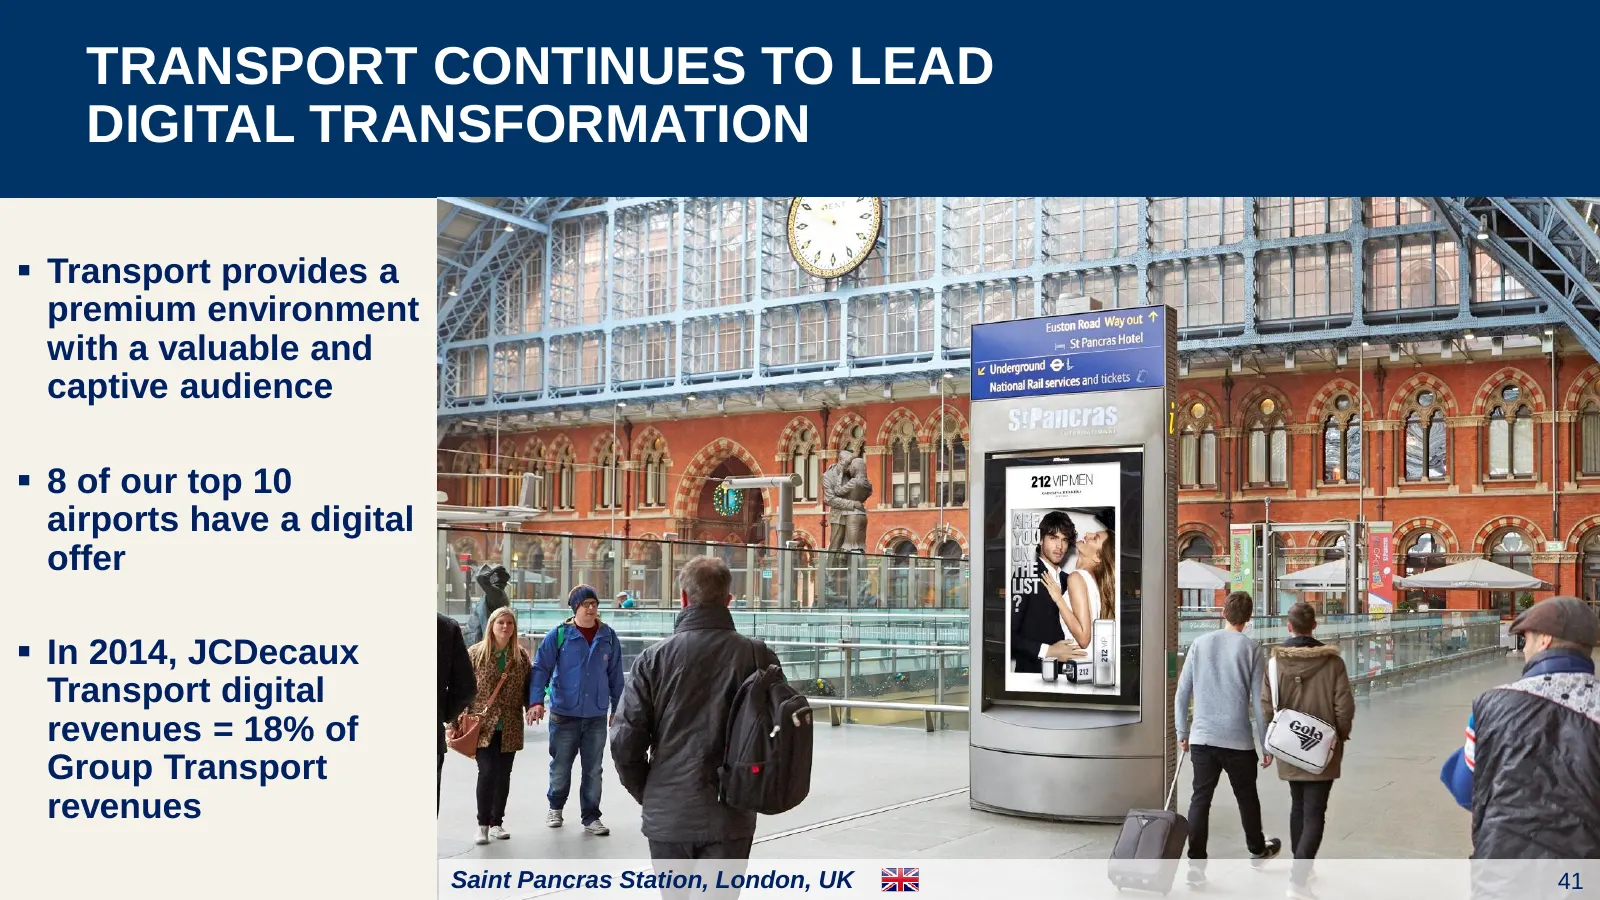
Slide 41: Transport Continues to Lead Digital Transformation
TRANSPORT CONTINUES TO LEAD DIGITAL TRANSFORMATION Transport provides a premium environment with a valuable and captive audience 8 of our top 10 airports have a digital offer In 2014, JCDecaux Transport digital revenues = 18% of Group Transport revenues Saint Pancras Station, London, UK 41
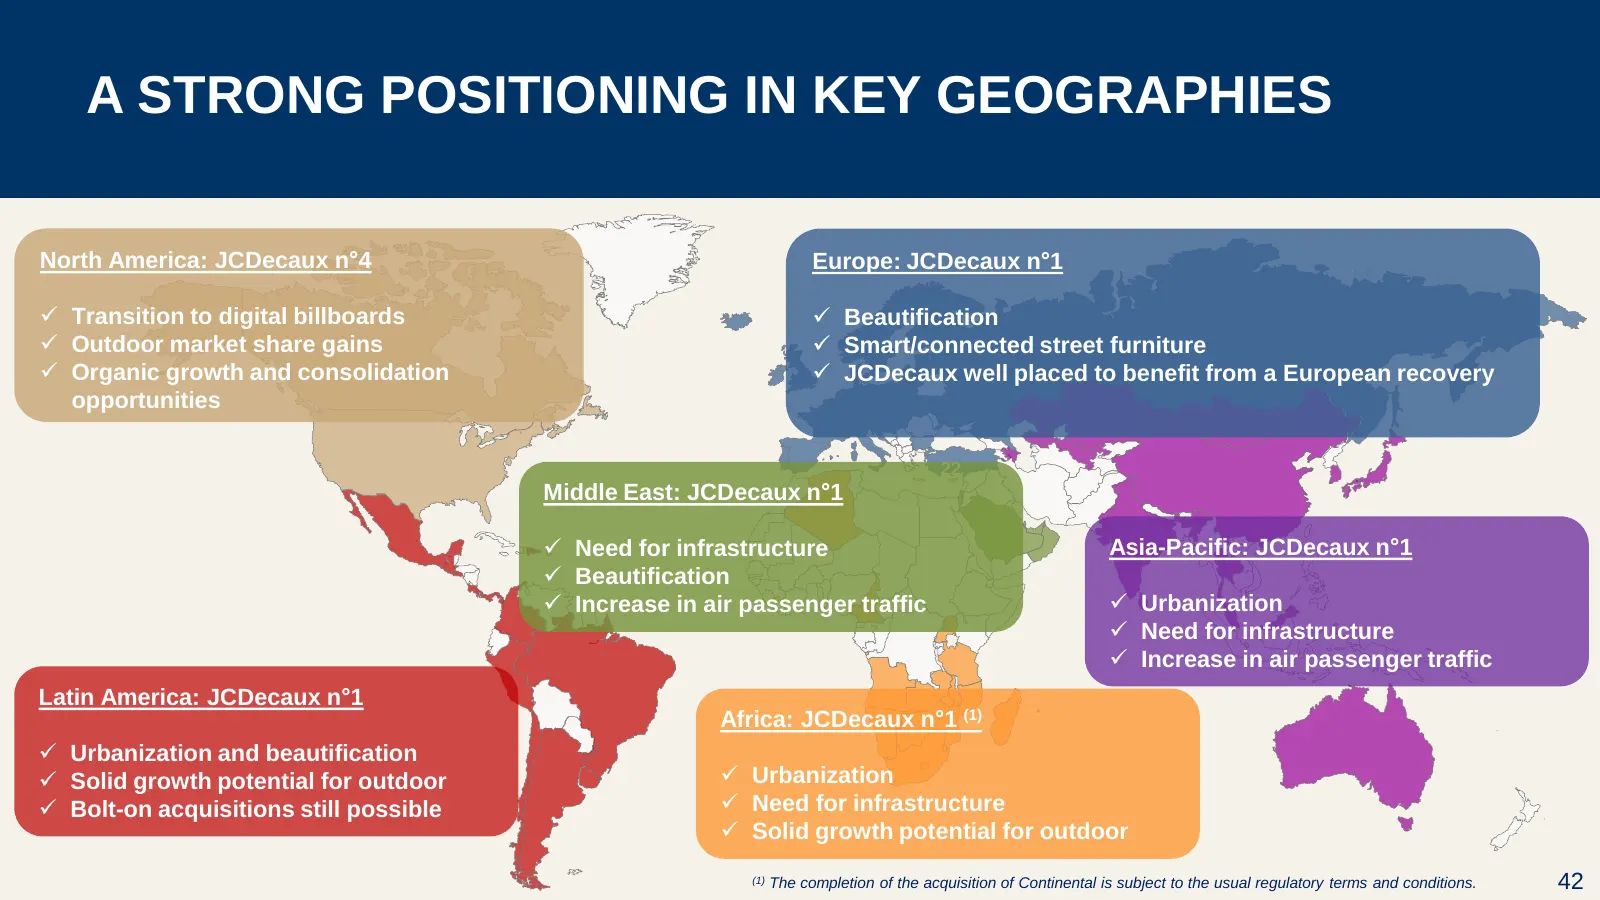
Slide 42: A Strong Positioning in Key Geographies
A STRONG POSITIONING IN KEY GEOGRAPHIES North America: JCDecaux n°4 Europe: JCDecaux n°1 Transition to digital billboards Beautification Outdoor market share gains Smart/connected street furniture Organic growth and consolidation JCDecaux well placed to benefit from a European recovery o
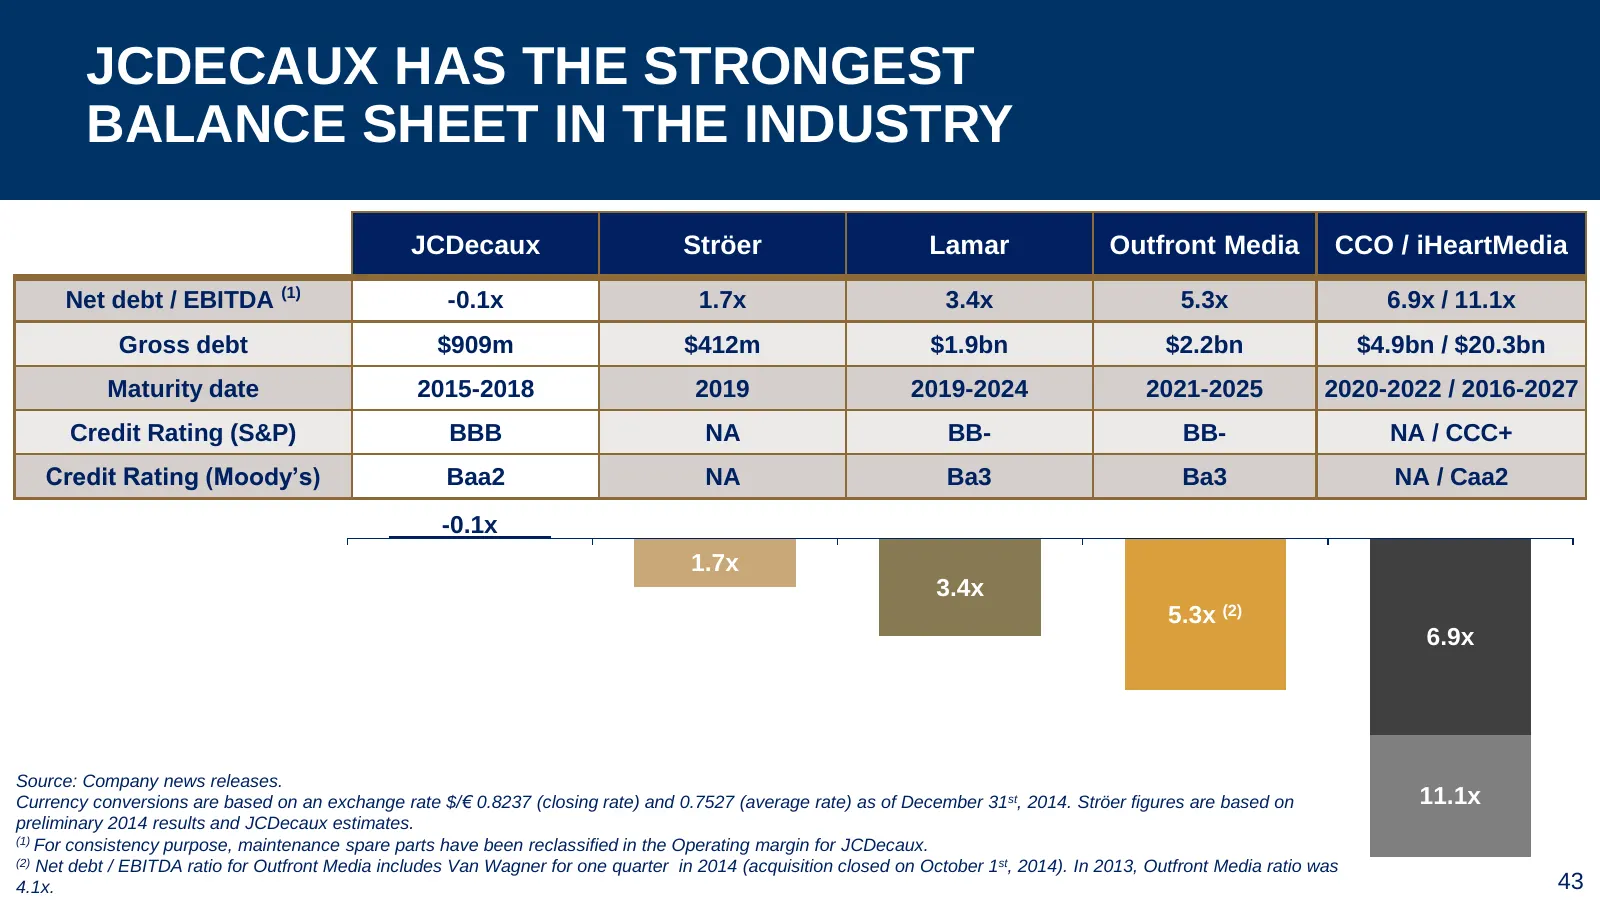
Slide 43: JCDecaux Has the Strongest Balance Sheet in the Industry
JCDECAUX HAS THE STRONGEST BALANCE SHEET IN THE INDUSTRY JCDecaux Ströer Lamar Outfront Media CCO / iHeartMedia Net debt / EBITDA (1) -0.1x 1.7x 3.4x 5.3x 6.9x / 11.1x Gross debt $909m $412m $1.9bn $2.2bn $4.9bn / $20.3bn Maturity date 2015-2018 2019 2019-2024 2021-2025 2020-2022 / 2016-2027 Credit
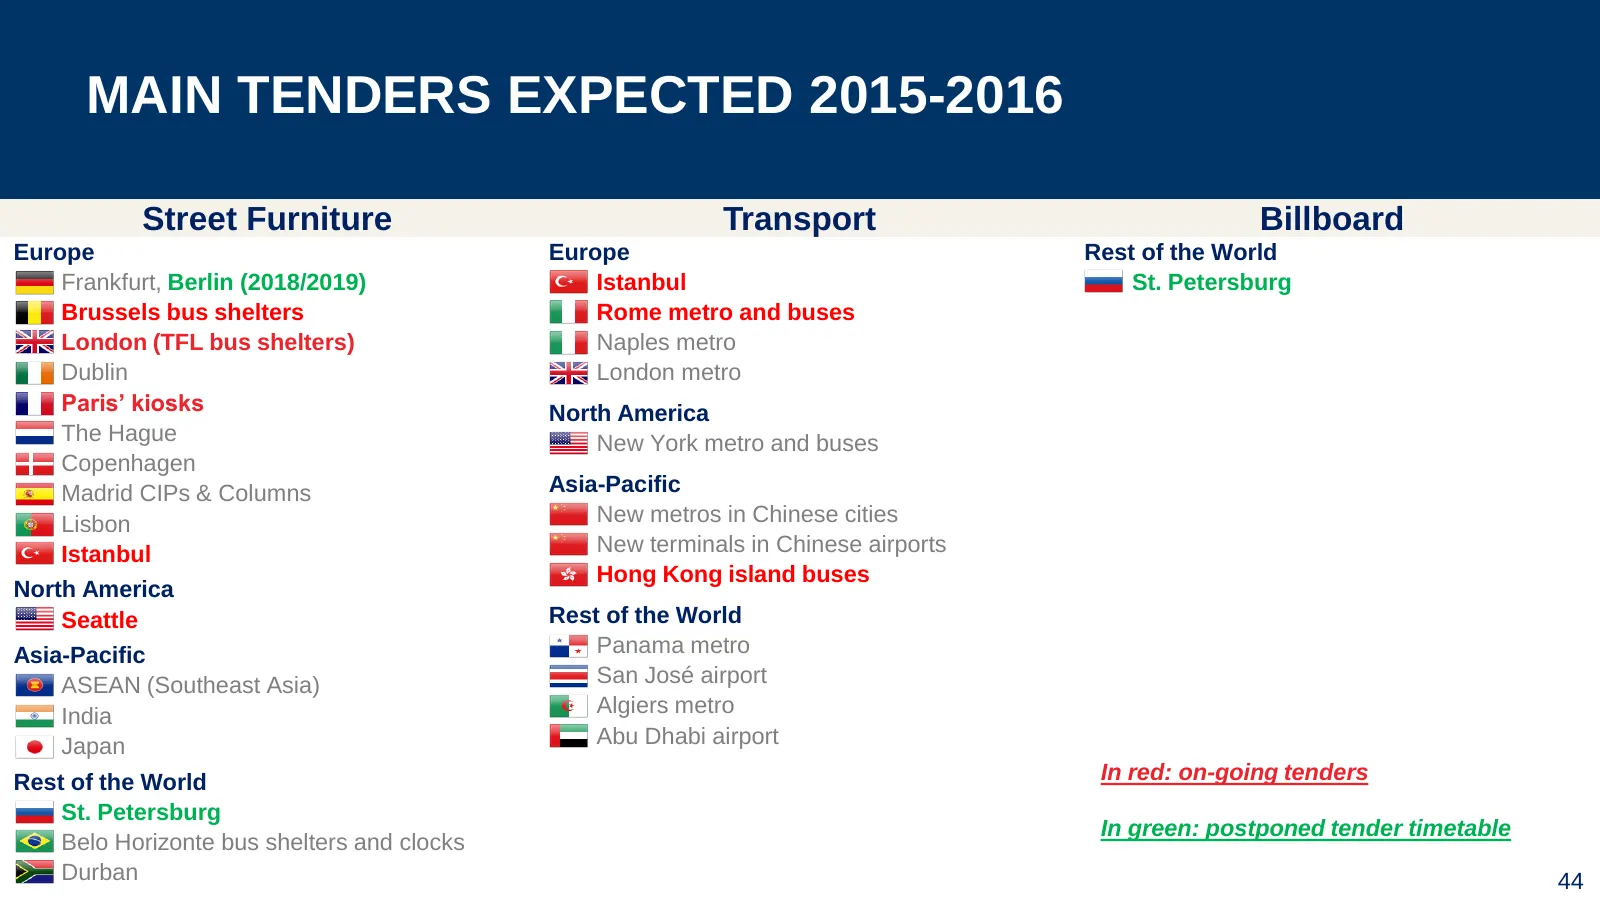
Slide 44: Main Tenders Expected 2015-2016
MAIN TENDERS EXPECTED 2015-2016 Street Furniture Transport Billboard Europe Europe Rest of the World Frankfurt, Berlin (2018/2019) Istanbul St. Petersburg Brussels bus shelters Rome metro and buses London (TFL bus shelters) Naples metro Dublin London metro Paris’ kiosks North America The Hague New Y
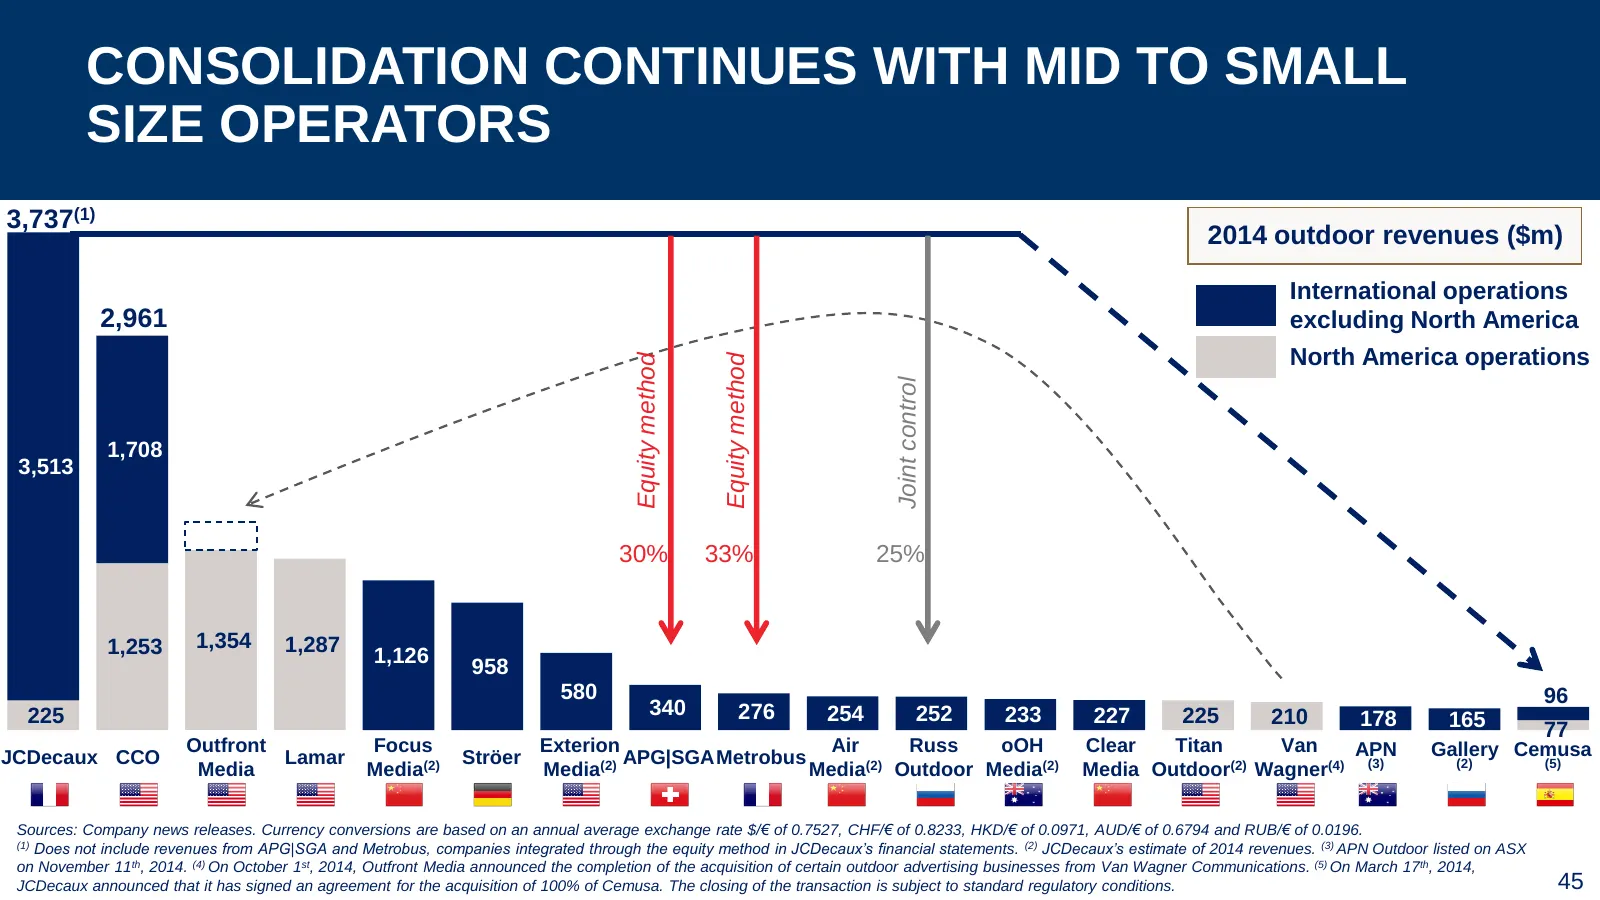
Slide 45: Consolidation Continues with Mid to Small Size Operators
CONSOLIDATION CONTINUES WITH MID TO SMALL SIZE OPERATORS 3,737(1) 2014 outdoor revenues ($m) International operations 2,961 excluding North America North America operations Equity method Equity method Joint control 1,708 3,513 30% 33% 25% 1,253 1,354 1,287 1,126 958 580 96 225 340 276 254 252 233 22
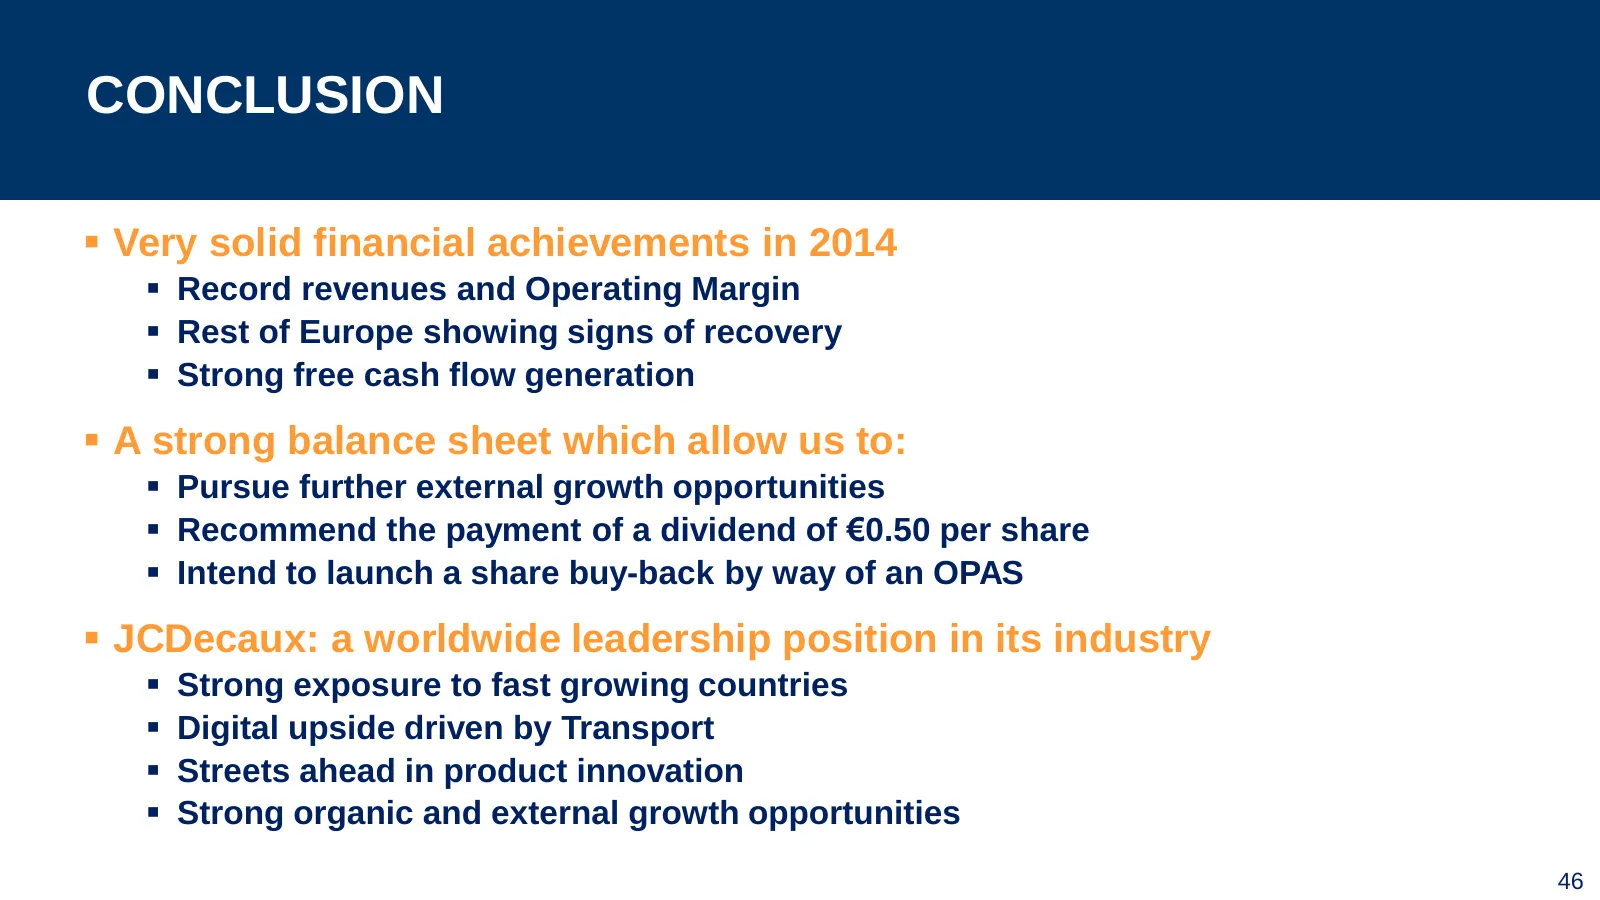
Slide 46: Conclusion
CONCLUSION Very solid financial achievements in 2014 Record revenues and Operating Margin Rest of Europe showing signs of recovery Strong free cash flow generation A strong balance sheet which allow us to: Pursue further external growth opportunities Recommend the payment of a dividend
Slide 47: Q1 2015 Outlook
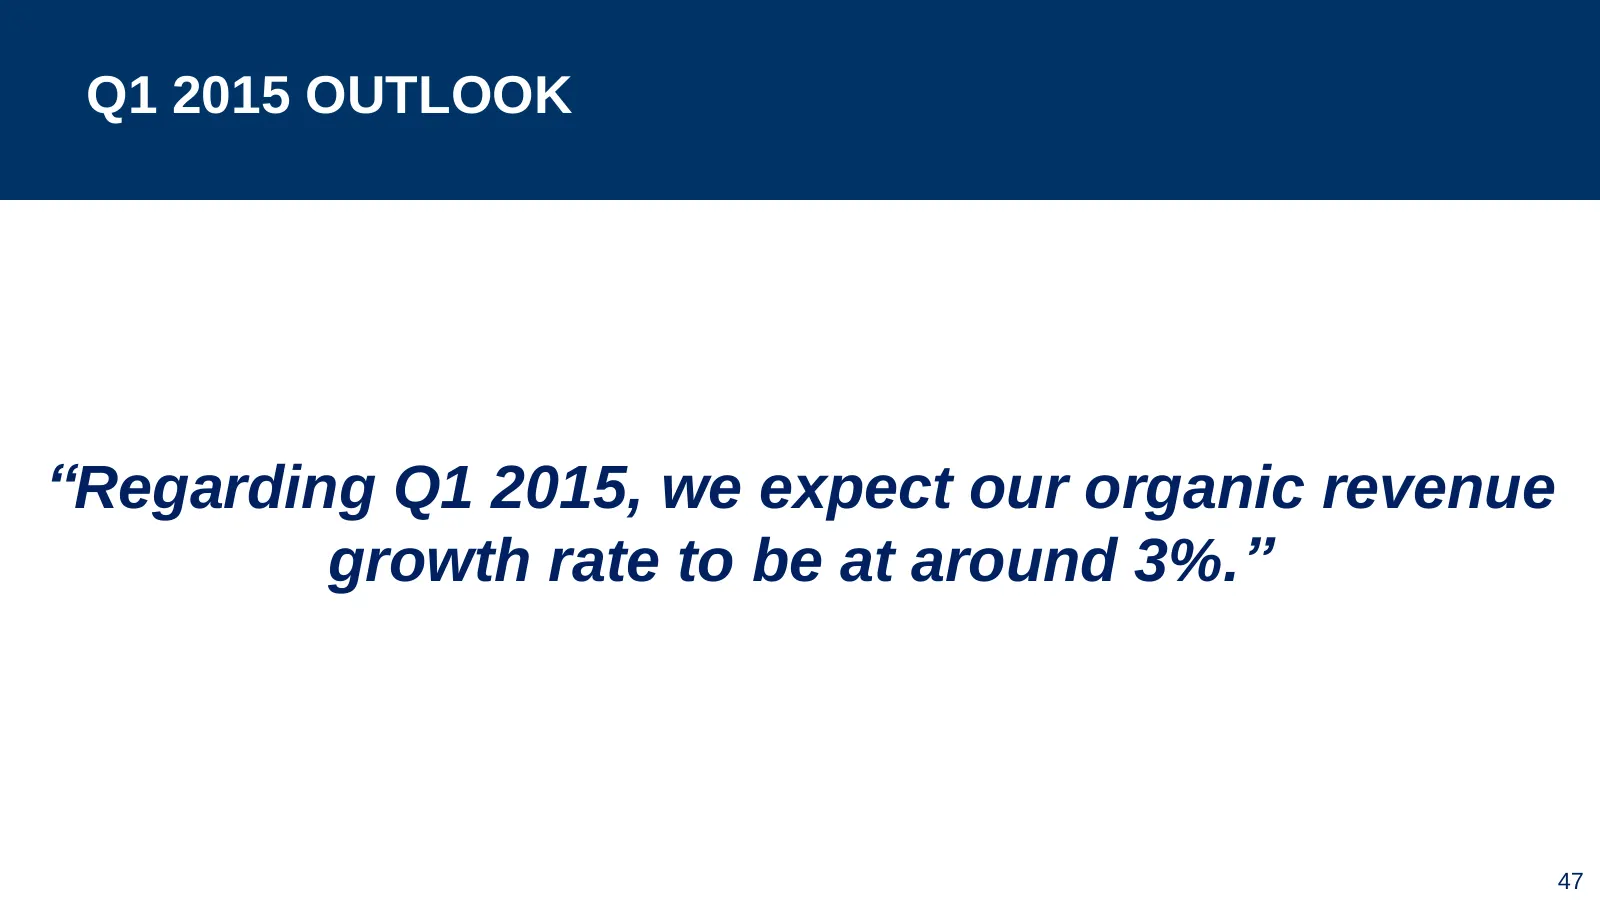
Q1 2015 OUTLOOK “Regarding Q1 2015, we expect our organic revenue growth rate to be at around 3%.” 47
Slide 48: Implementation of IFRS 11
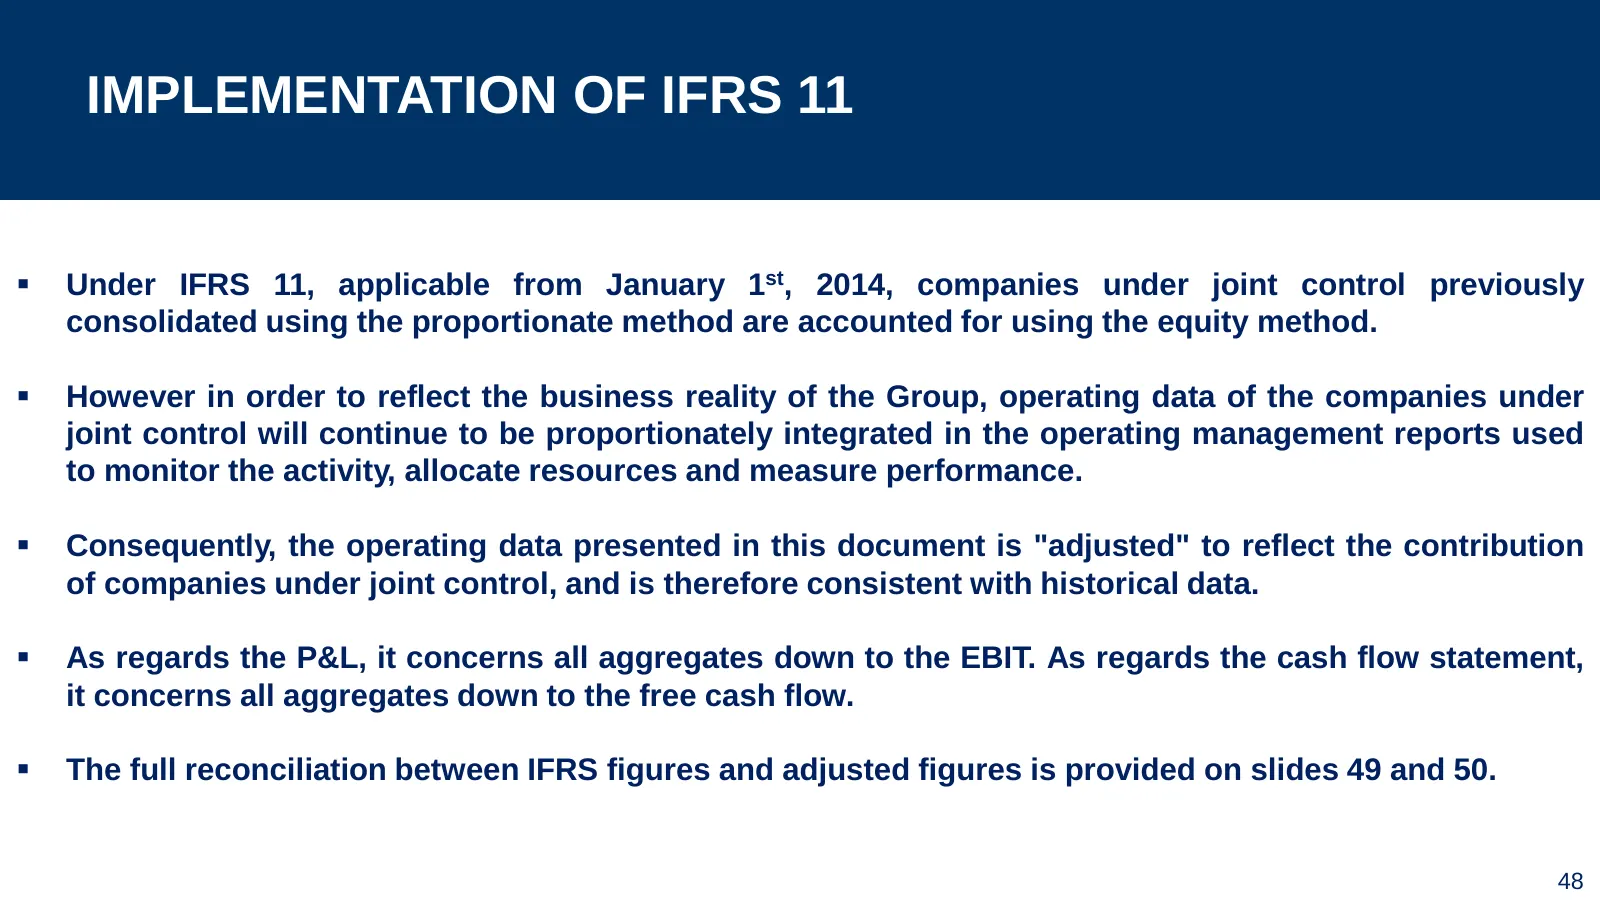
IMPLEMENTATION OF IFRS 11 Under IFRS 11, applicable from January 1st, 2014, companies under joint control previously consolidated using the proportionate method are accounted for using the equity method. However in order to reflect the business reality of the Group, operating data of the compani
Slide 49: Reconciliation Between IFRS and Adjusted Figures – Profit & Loss
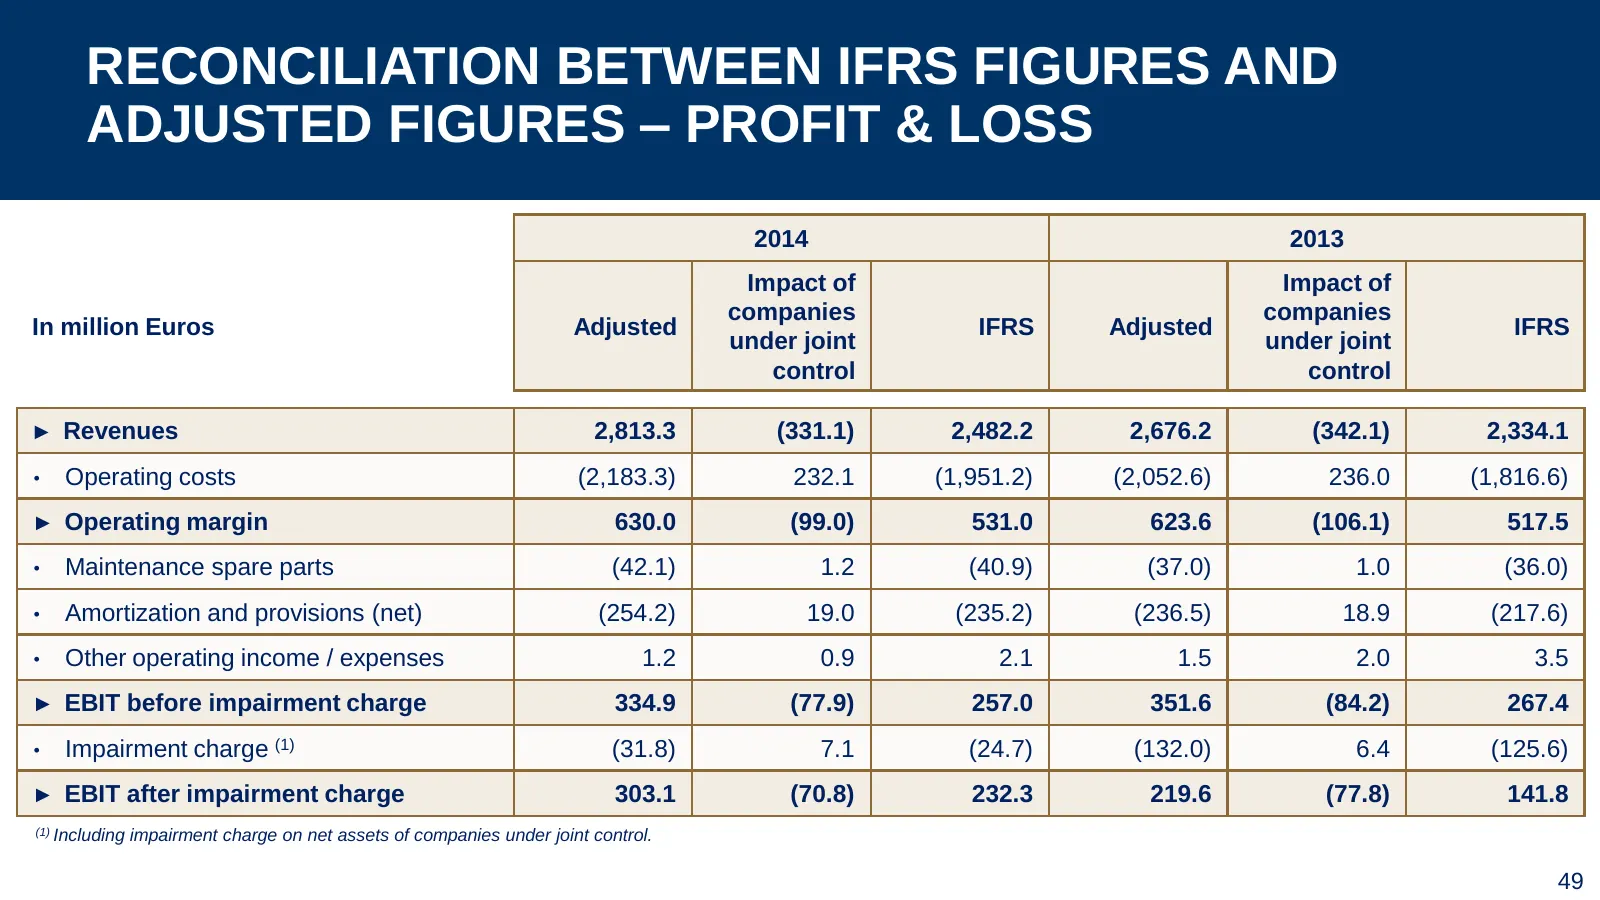
RECONCILIATION BETWEEN IFRS FIGURES AND ADJUSTED FIGURES – PROFIT & LOSS 2014 2013 Impact of Impact of companies companies In million Euros Adjusted IFRS Adjusted IFRS under joint under joint control control ► Revenues 2,813.3 (331.1) 2,482.2 2,676.2 (342.1) 2,334.1 • Operating costs (2,183.3) 232.1
Slide 50: Reconciliation Between IFRS and Adjusted Figures – Cash Flow Statement
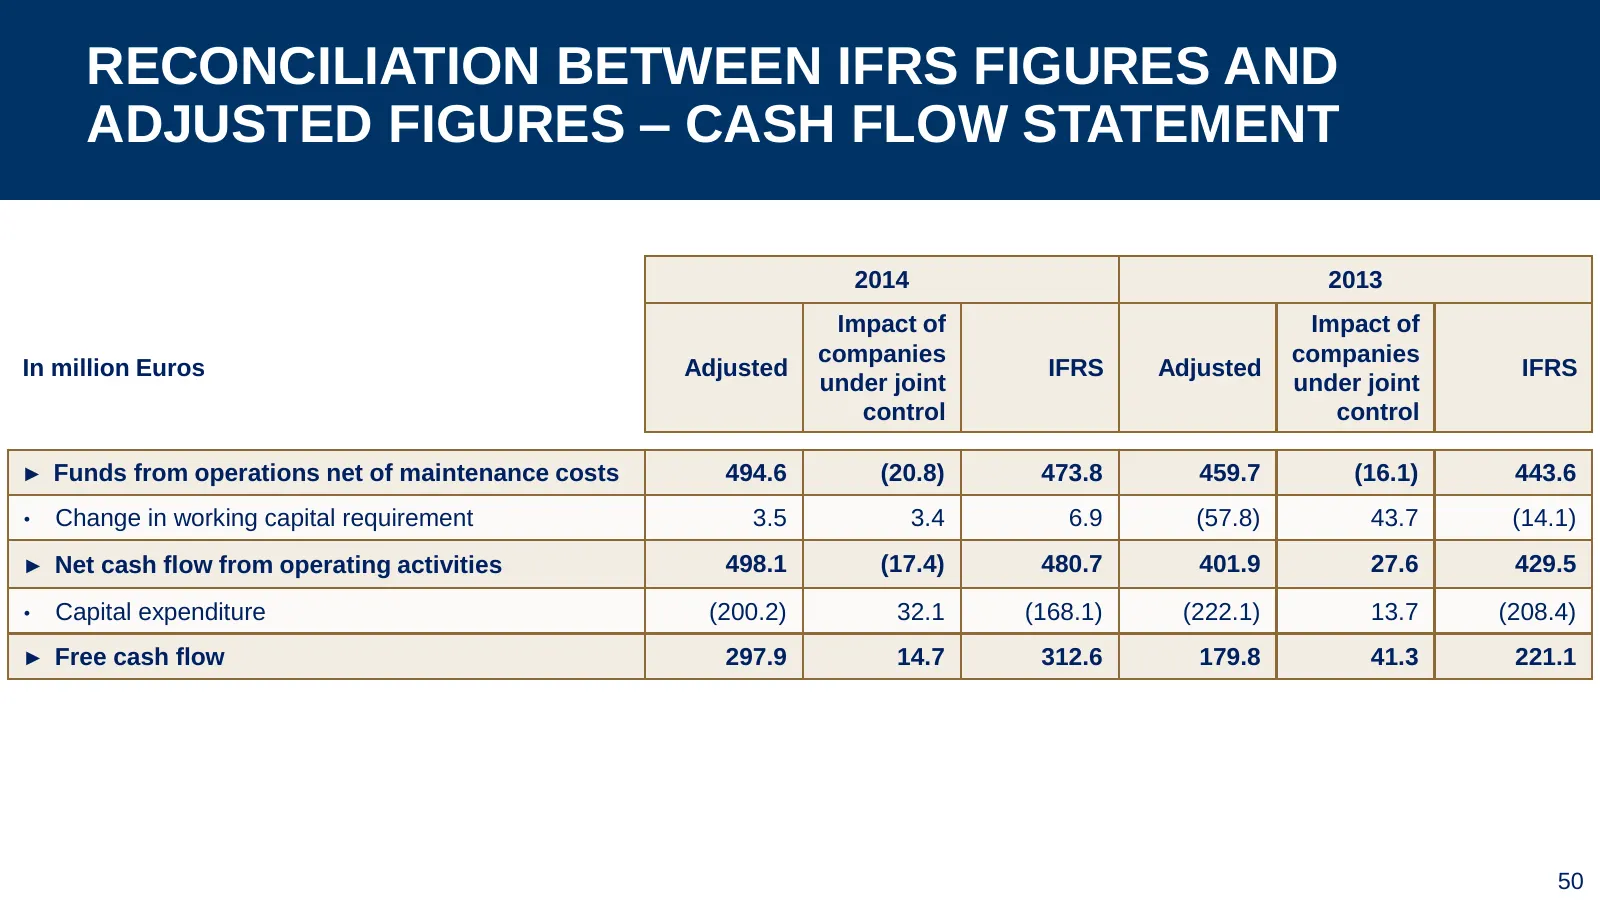
RECONCILIATION BETWEEN IFRS FIGURES AND ADJUSTED FIGURES – CASH FLOW STATEMENT 2014 2013 Impact of Impact of companies companies In million Euros Adjusted IFRS Adjusted IFRS under joint under joint control control ► Funds from operations net of maintenance costs 494.6 (20.8) 473.8 459.7 (16.1) 443.6
Slide 51: Financial Definitions
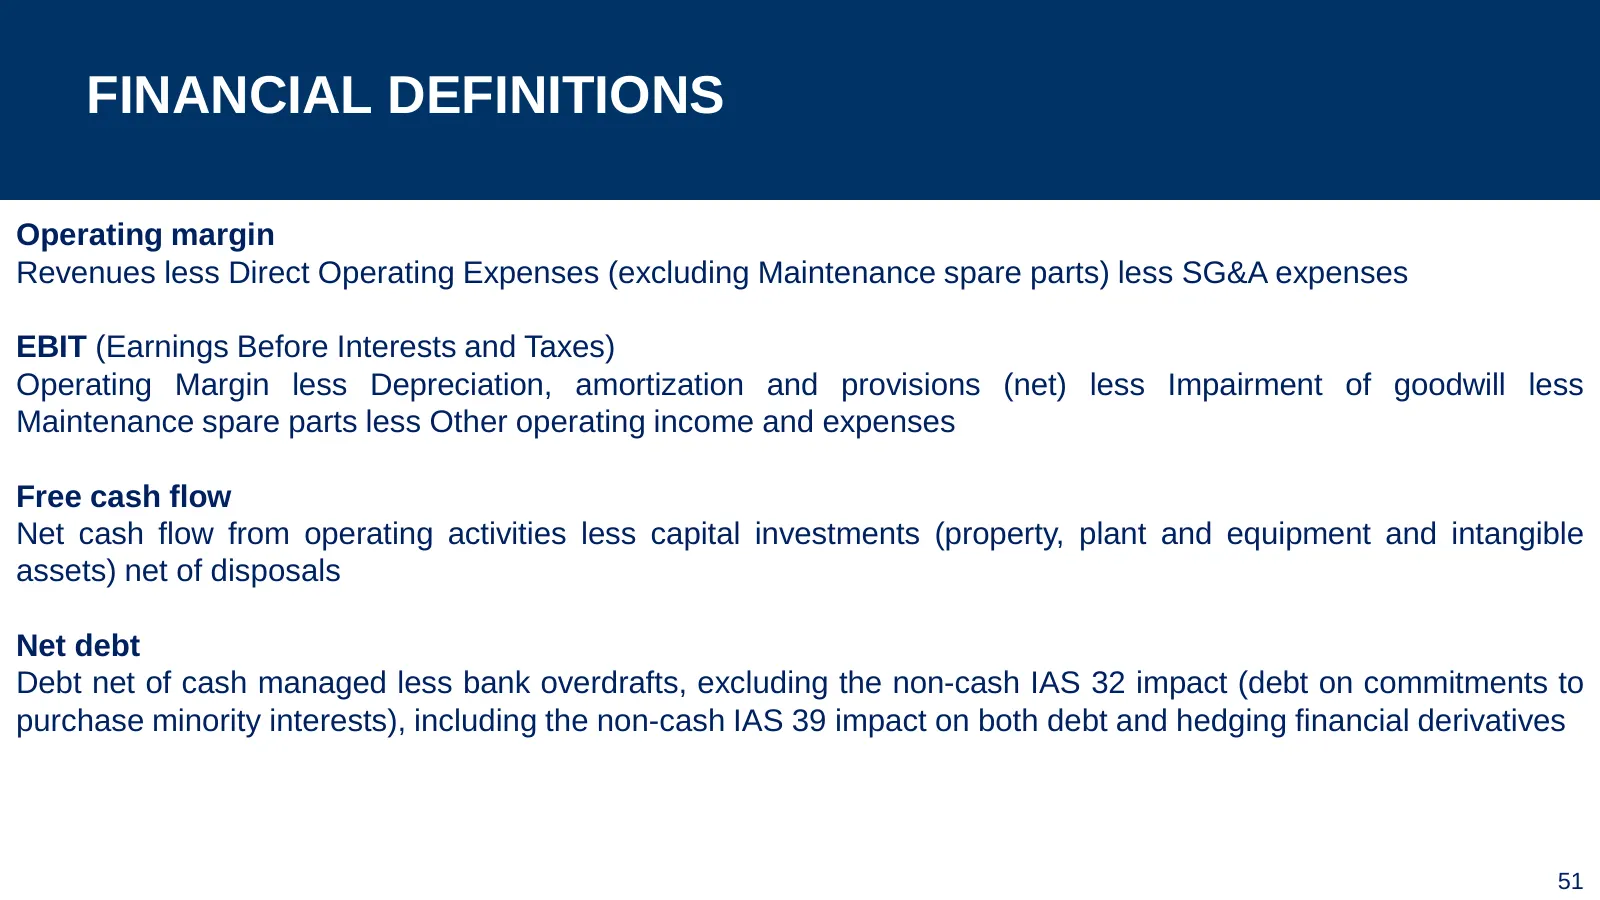
FINANCIAL DEFINITIONS Operating margin Revenues less Direct Operating Expenses (excluding Maintenance spare parts) less SG&A expenses EBIT (Earnings Before Interests and Taxes) Operating Margin less Depreciation, amortization and provisions (net) less Impairment of goodwill less Maintenance spare pa

Slide 52: Forward Looking Statements
FORWARD LOOKING STATEMENTS This presentation may contain some forward-looking statements. These statements are not undertakings as to the future performance of the Company. Although the Company considers that such statements are based on reasonable expectations and assumptions on the date of publica

Slide 53: JCDecaux
[_ JCDecaux
Source: Internet Archive copy of jcdecaux.com
More decks from JCDecaux SE
 Q2 2026 Earnings Presentation45 slides · Jul 30, 2026
 Shareholder Meeting (May 2026)97 slides · May 13, 2026
 FY2025 Earnings Presentation48 slides · Mar 12, 2026
 H1 2025 Earnings Presentation43 slides · Jul 31, 2025
 FY2024 Earnings Presentation47 slides · Mar 6, 2025
 H1 2024 Earnings Presentation48 slides · Jul 25, 2024