Yadkin Financial — Q1 2015 Earnings Presentation
12 slides from Yadkin Financial's earnings presentation, Apr 23, 2015
Slide 1: 2015 Q1 Earnings Call
2015 Q1 Earnings Call April 23, 2015
Slide 2: Forward Looking Statements
Forward Looking Statements Information in this presentation contains forward-looking statements within the meaning of the Private Securities Litigation Reform Act of 1995. These statements involve risks and uncertainties that could cause actual results to differ materially, including without limitat
Slide 3: Q1 2015 Highlights
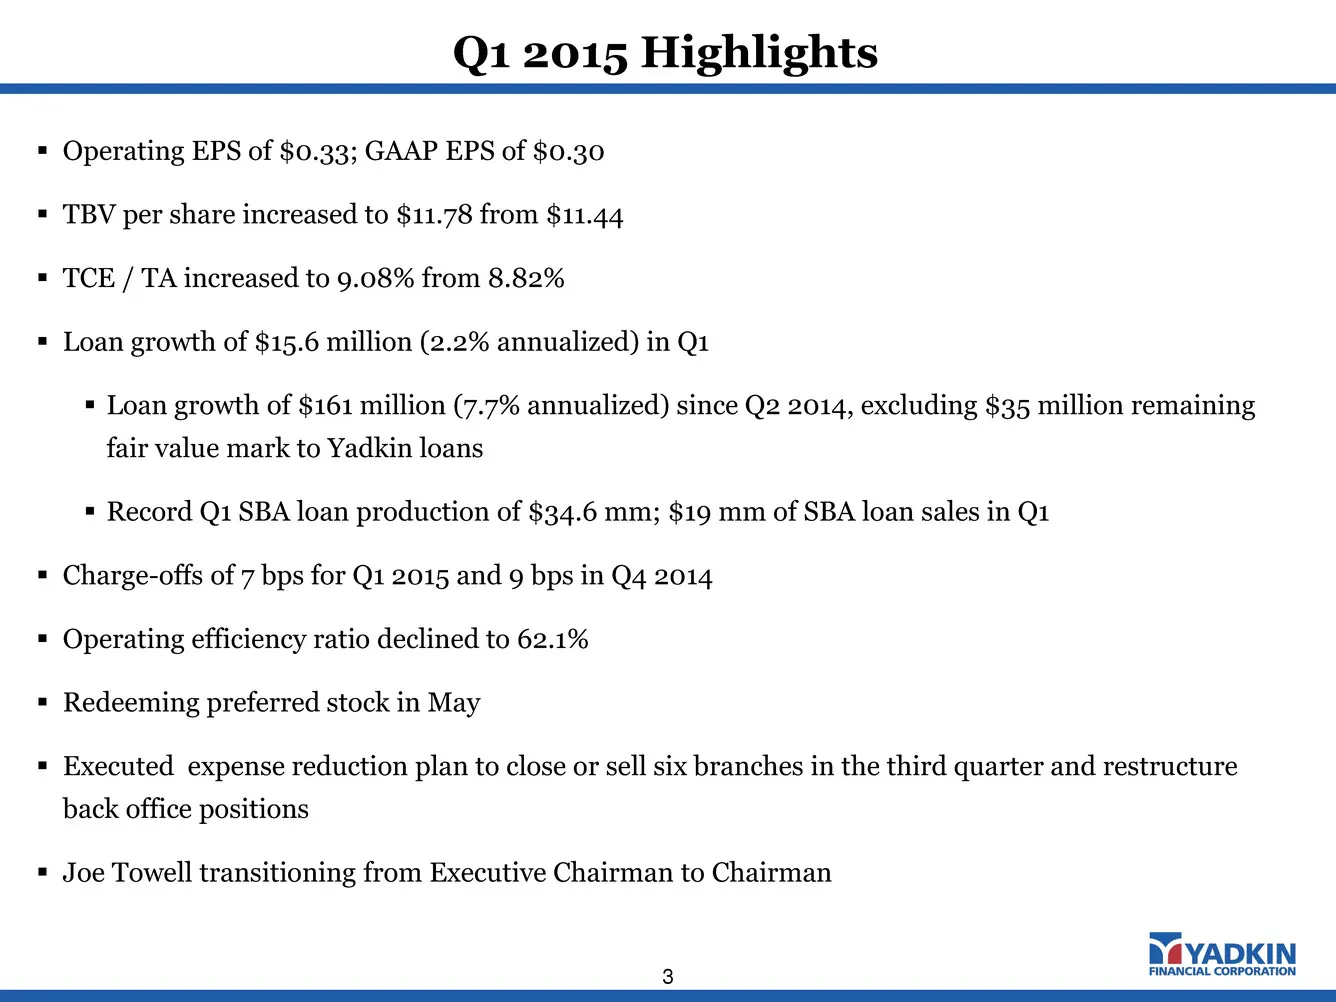
Q1 2015 Highlights 3 Operating EPS of $0.33; GAAP EPS of $0.30 TBV per share increased to $11.78 from $11.44 TCE / TA increased to 9.08% from 8.82% Loan growth of $15.6 million (2.2% annualized) in Q1 Loan growth of $161 million (7.7% annualized) since Q2 2014, excluding $35 million remain
Slide 4: Positive Business Momentum Since Merger Announcement
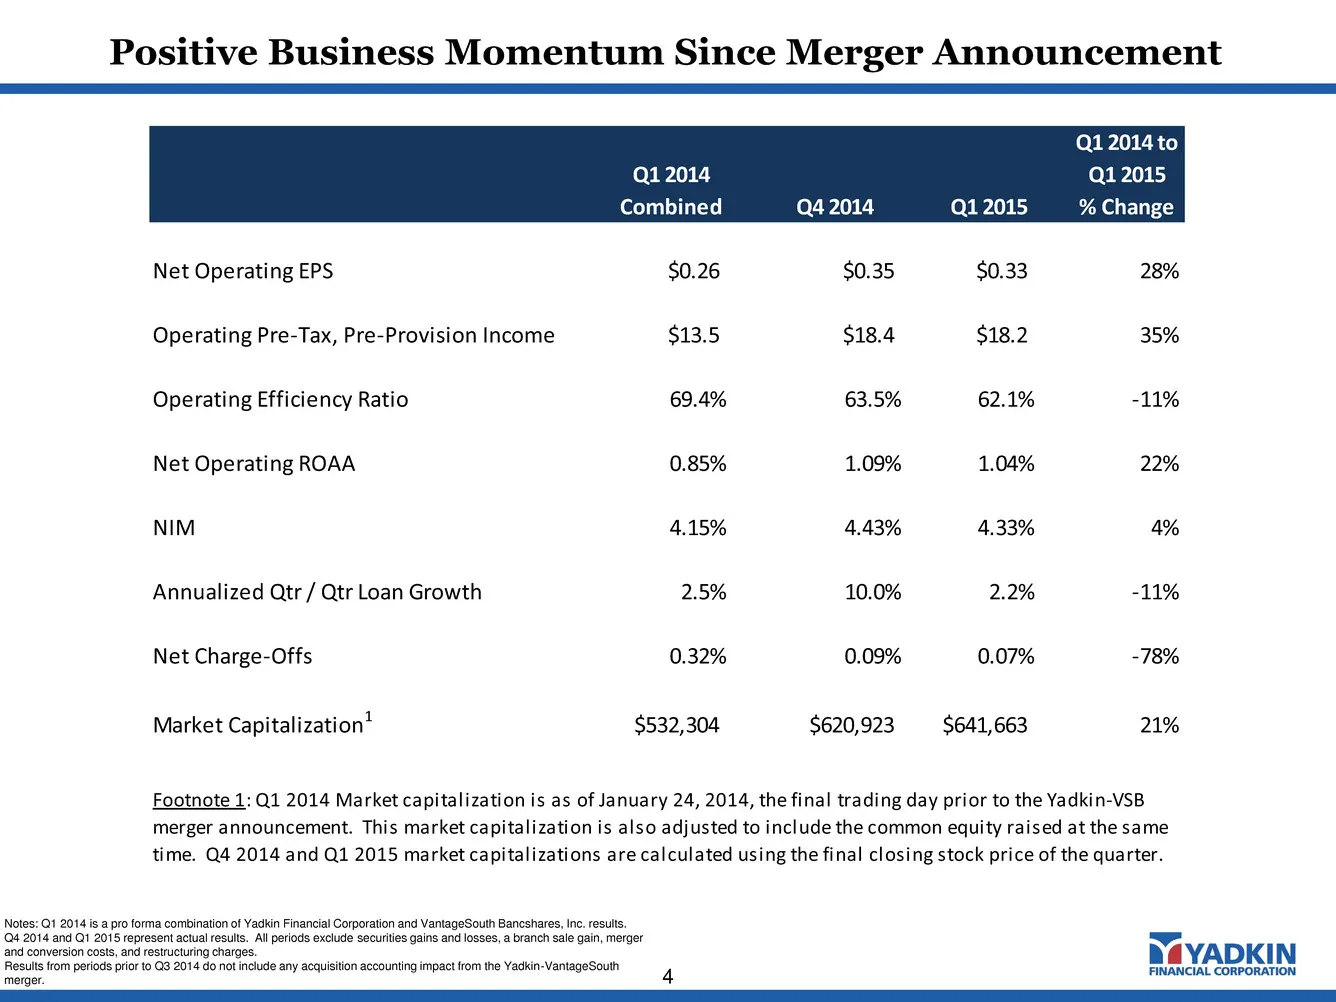
Positive Business Momentum Since Merger Announcement 4 Notes: Q1 2014 is a pro forma combination of Yadkin Financial Corporation and VantageSouth Bancshares, Inc. results. Q4 2014 and Q1 2015 represent actual results. All periods exclude securities gains and losses, a branch sale gain, merger and co
Slide 5: Earnings Profile
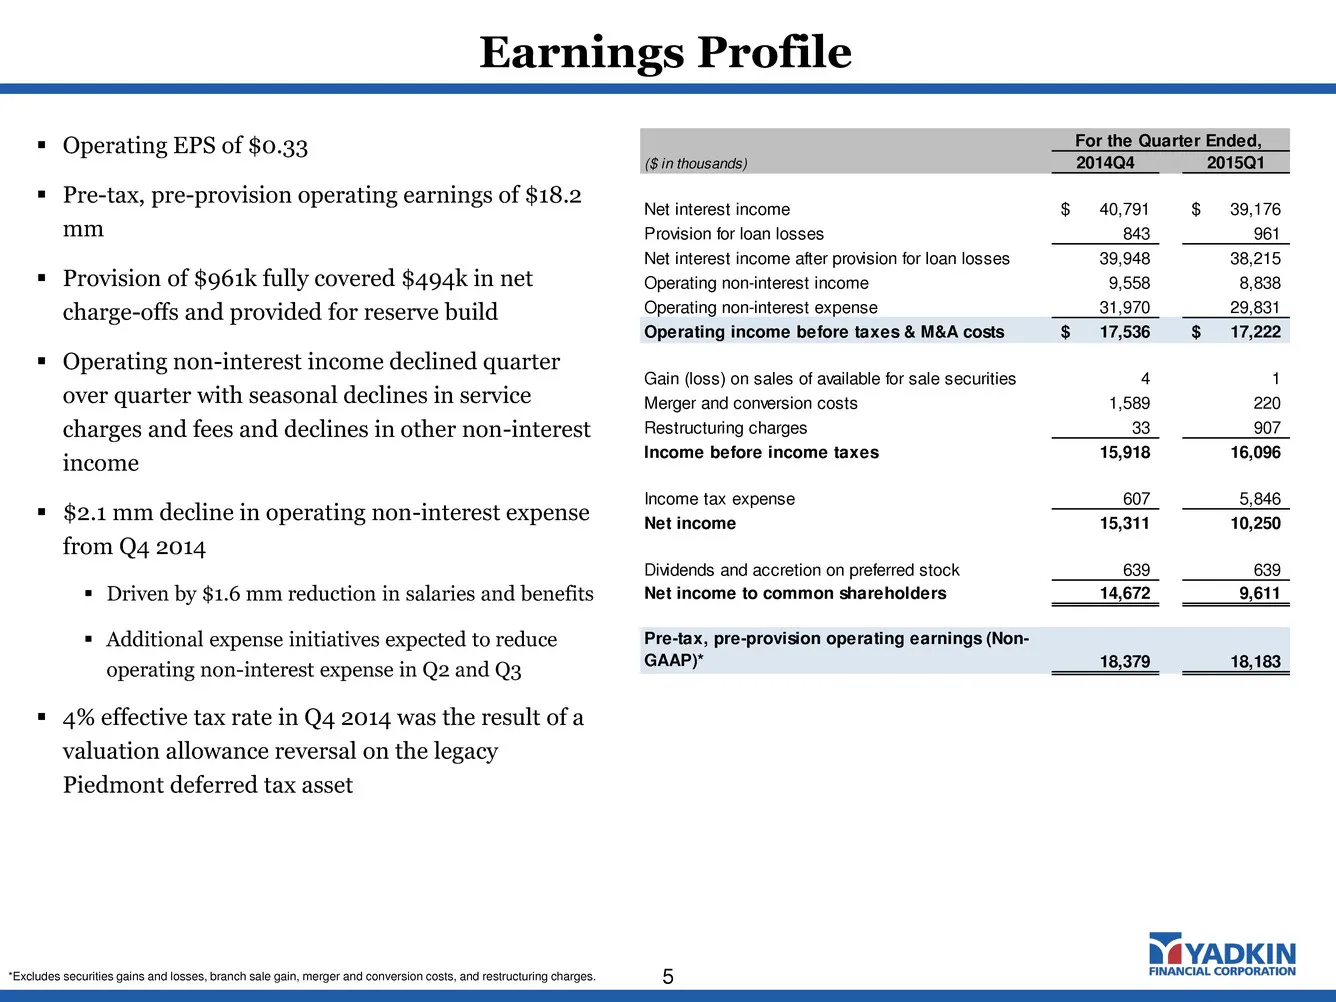
Operating EPS of $0.33 Pre-tax, pre-provision operating earnings of $18.2 mm Provision of $961k fully covered $494k in net charge-offs and provided for reserve build Operating non-interest income declined quarter over quarter with seasonal declines in service charges and fees and declines in
Slide 6: Net Interest Income
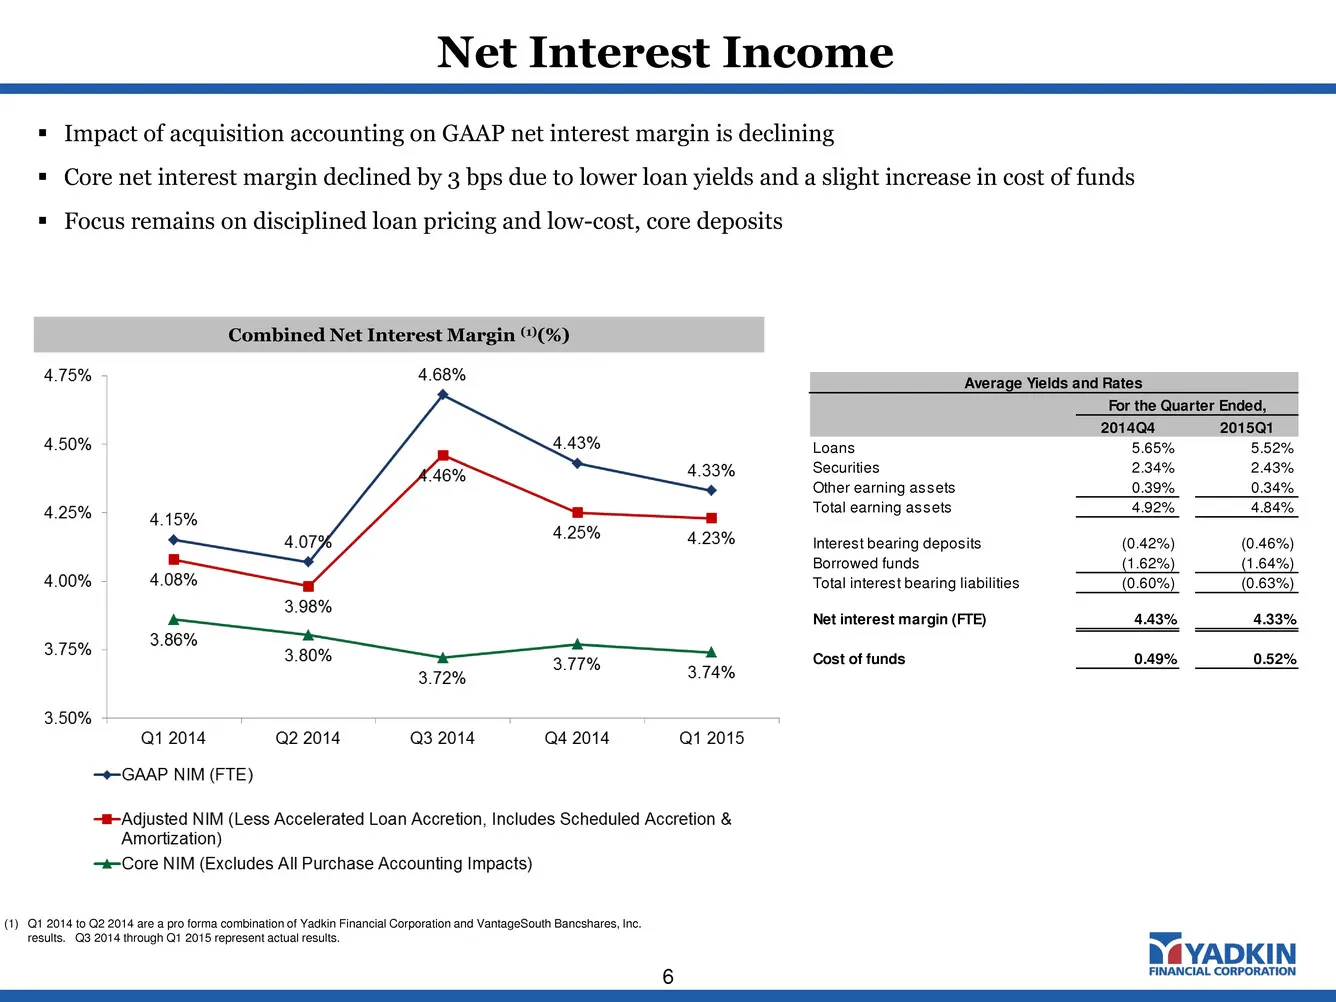
Net Interest Income 6 Combined Net Interest Margin (1)(%) Impact of acquisition accounting on GAAP net interest margin is declining Core net interest margin declined by 3 bps due to lower loan yields and a slight increase in cost of funds Focus remains on disciplined loan pricing and low-cost,
Slide 7: Diverse Drivers of Non-Interest Income Growth
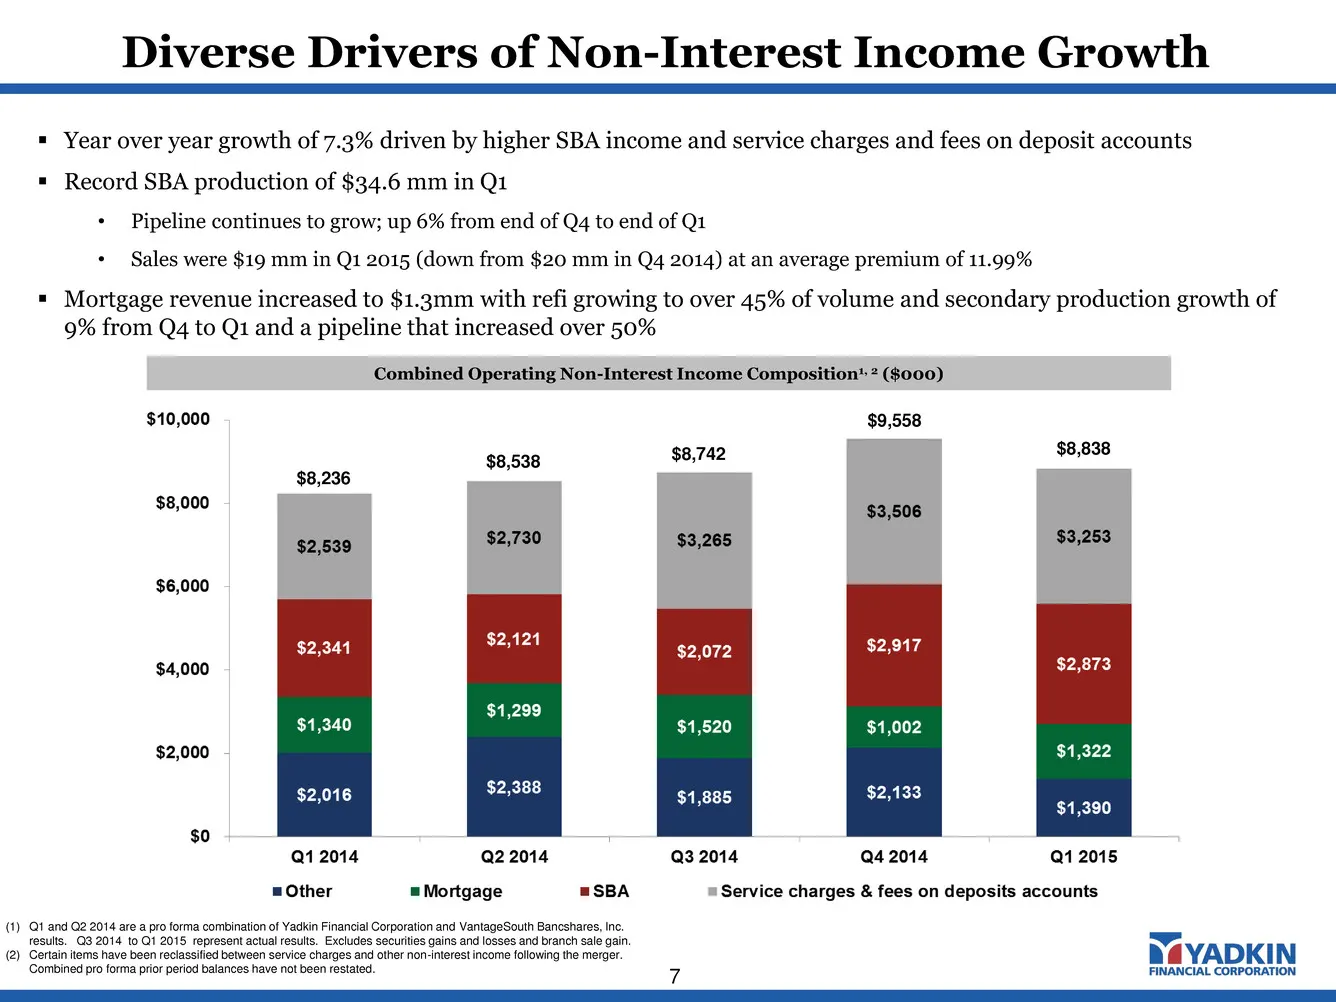
Diverse Drivers of Non-Interest Income Growth 7 Combined Operating Non-Interest Income Composition1, 2 ($000) $8,236 $8,538 $8,742 Year over year growth of 7.3% driven by higher SBA income and service charges and fees on deposit accounts Record SBA production of $34.6 mm in Q1 • Pipeline continu
Slide 8: Non-Interest Expense
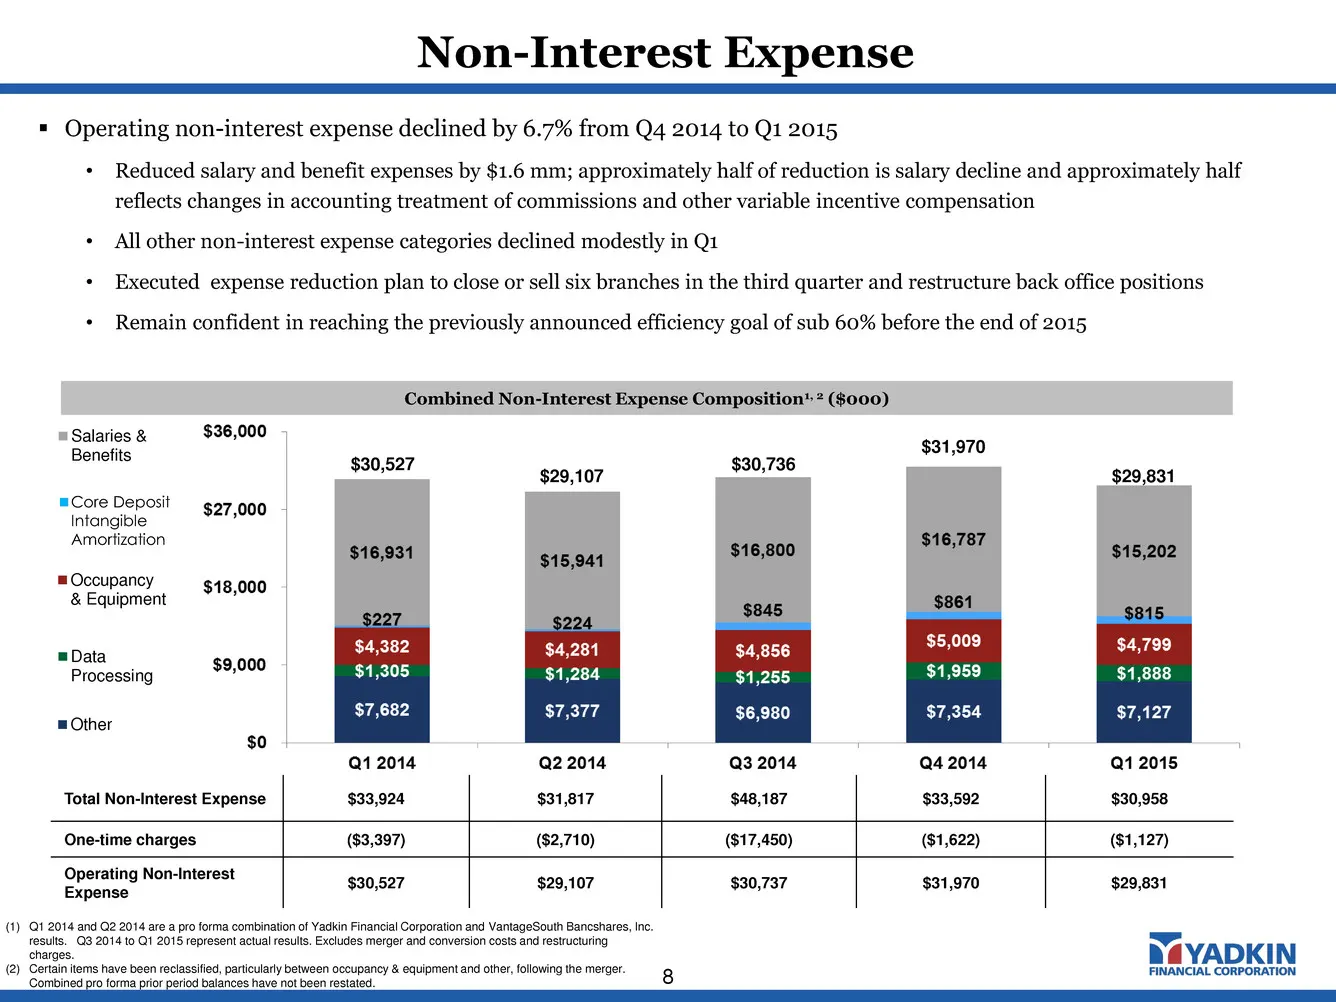
Non-Interest Expense 8 Combined Non-Interest Expense Composition1, 2 ($000) Operating non-interest expense declined by 6.7% from Q4 2014 to Q1 2015 • Reduced salary and benefit expenses by $1.6 mm; approximately half of reduction is salary decline and approximately half reflects changes in account
Slide 9: Balance Sheet
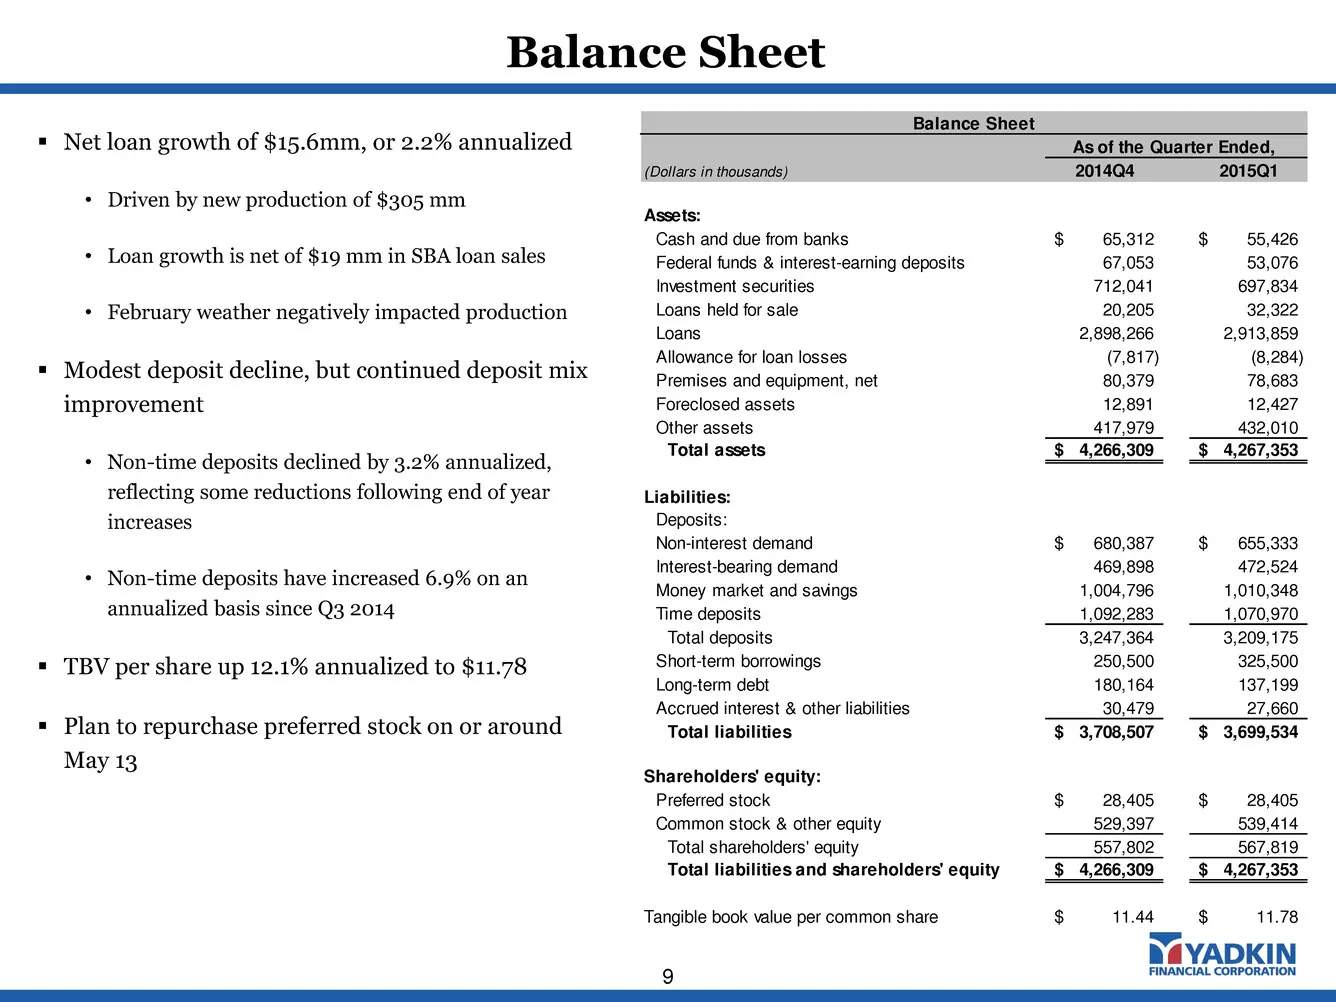
Balance Sheet 9 Net loan growth of $15.6mm, or 2.2% annualized • Driven by new production of $305 mm • Loan growth is net of $19 mm in SBA loan sales • February weather negatively impacted production Modest deposit decline, but continued deposit mix improvement • Non-time deposits declined by 3.
Slide 10: Strong Asset Quality
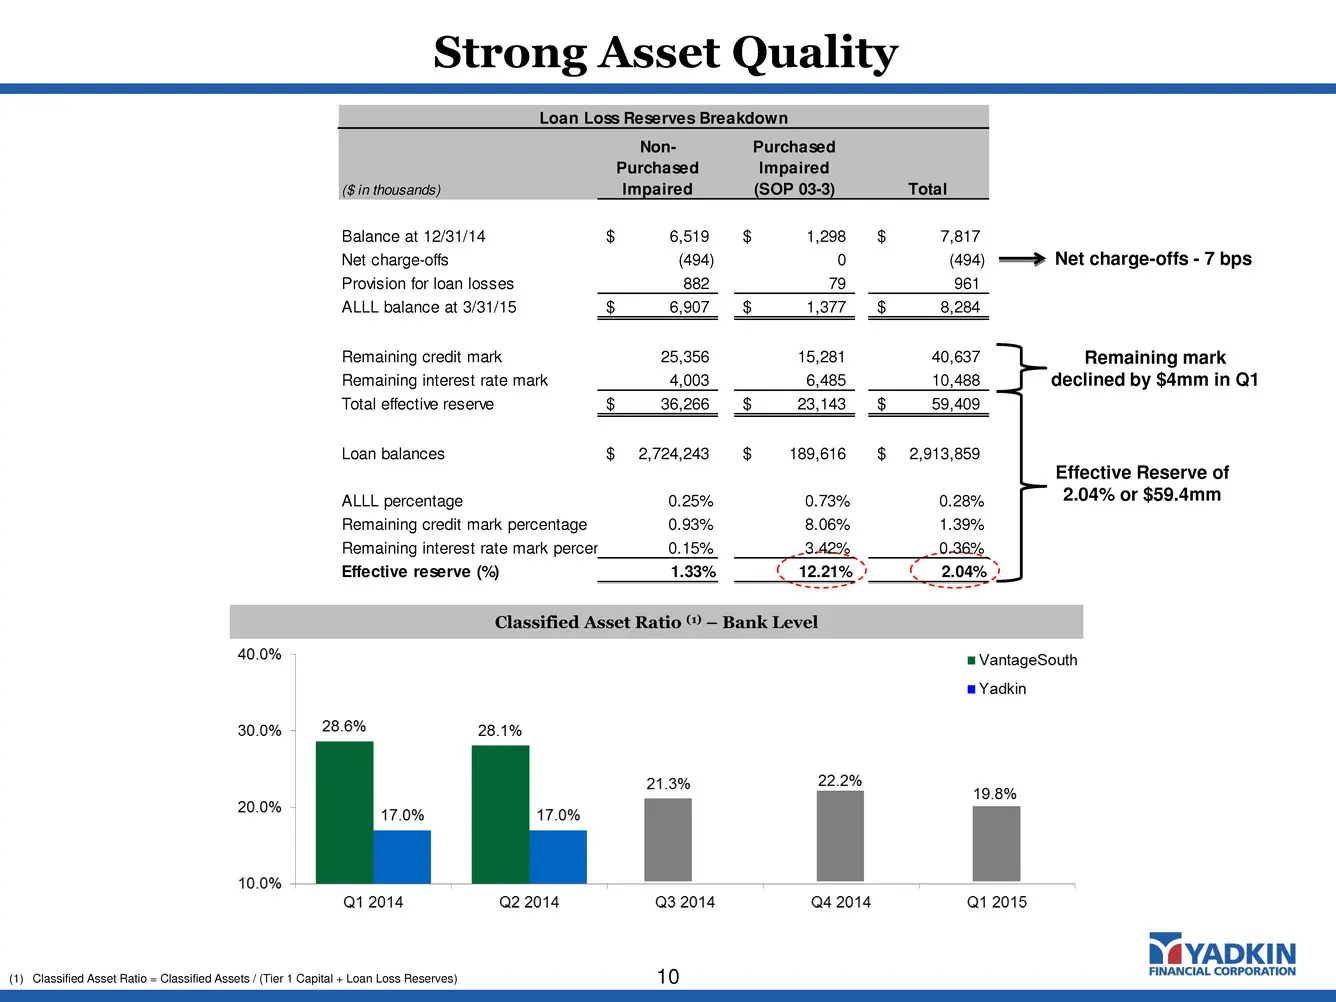
Strong Asset Quality 10 Effective Reserve of 2.04% or $59.4mm Classified Asset Ratio (1) – Bank Level (1) Classified Asset Ratio = Classified Assets / (Tier 1 Capital + Loan Loss Reserves) Loan Loss Reserves Breakdown ($ in thousands) Non- Purchased Impaired Purchased Impaired (SOP 03-3) Total Balan
Slide 11: Contact: Terry Earley
Contact: Terry Earley (919) 659-9015 terry.earley@yadkinbank.com
Slide 12: Operating Earnings Reconciliation
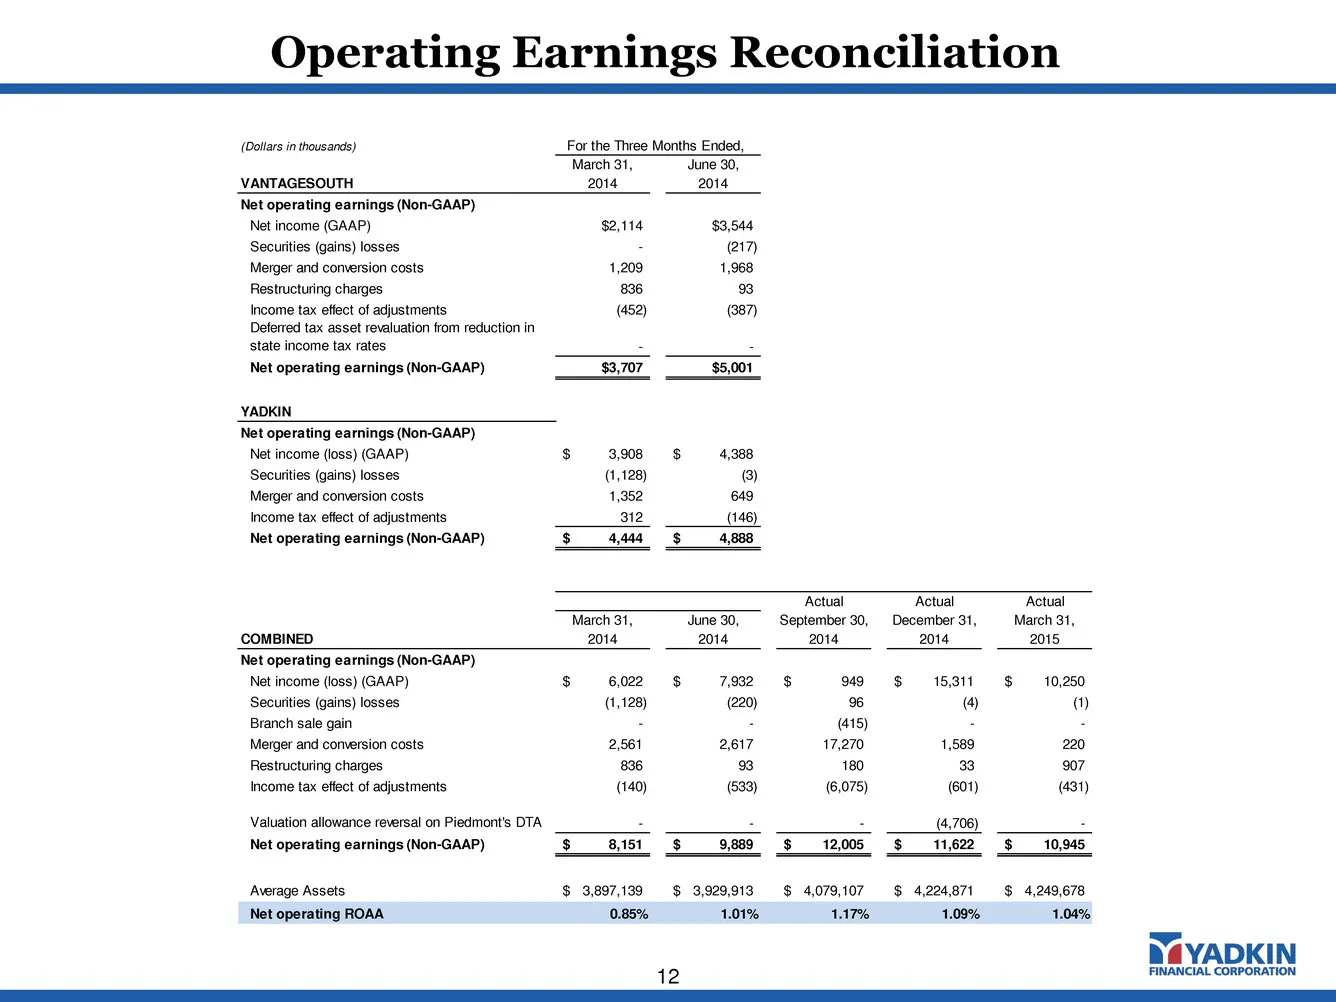
Operating Earnings Reconciliation 12 (Dollars in thousands) March 31, June 30, VANTAGESOUTH 2014 2014 Net operating earnings (Non-GAAP) Net income (GAAP) $2,114 $3,544 Securities (gains) losses - (217) Merger and conversion costs 1,209 1,968 Restructuring charges 836 93 Income tax effect of adjustme
Source: SEC EDGAR · 8-K filed Apr 23, 2015
More decks from Yadkin Financial Corp
 Merger or Acquisition (August 2016)38 slides · Aug 16, 2016
 Merger or Acquisition (July 2016)20 slides · Jul 21, 2016
 Gulf South Bank Conference 201624 slides · May 2, 2016
 Q1 2016 Earnings Presentation10 slides · Apr 21, 2016
 Q4 2015 Earnings Presentation13 slides · Jan 28, 2016
 Q3 2015 Earnings Presentation29 slides · Nov 10, 2015