Chemours Company (the) · NYSE:CC
Chemours Company (the) — Q3 2022 Earnings Presentation
21 slides from Chemours Company (the)'s earnings presentation, Oct 26, 2022
Slide 1: Chemours 3Q 2022 Earnings Presentation
Chemours 3Q 2022 Earnings Presentation October 25, 2022
Slide 2: Safe Harbor Statement and Other Matters
Safe Harbor Statement and Other Matters This presentation contains forward-looking statements, within the meaning of Section 27A of the Securities Act of 1933 and Section 21E of the Securities Exchange Act of 1934, which involve risks and uncertainties. Forward-looking statements provide current exp
Slide 3: Third Quarter 2022 Highlights
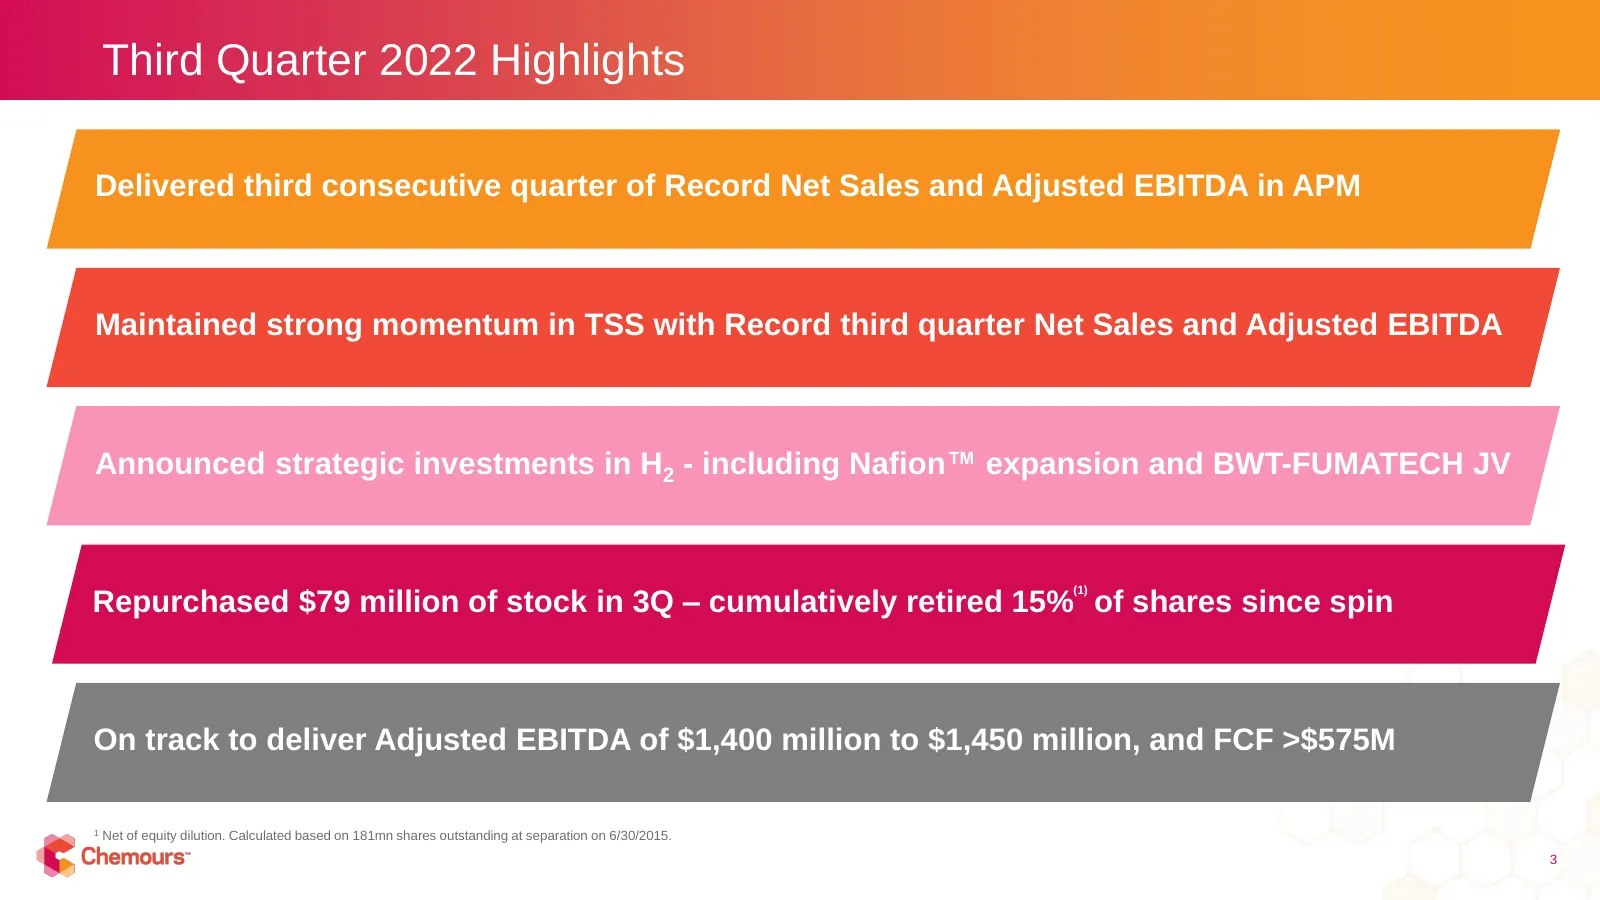
Third Quarter 2022 Highlights Delivered third consecutive quarter of Record Net Sales and Adjusted EBITDA in APM Maintained strong momentum in TSS with Record third quarter Net Sales and Adjusted EBITDA Announced strategic investments in H2 - including Nafion™ expansion and BWT-FUMATECH JV Repurchas
Slide 4: Third Quarter 2022 Financial Summary
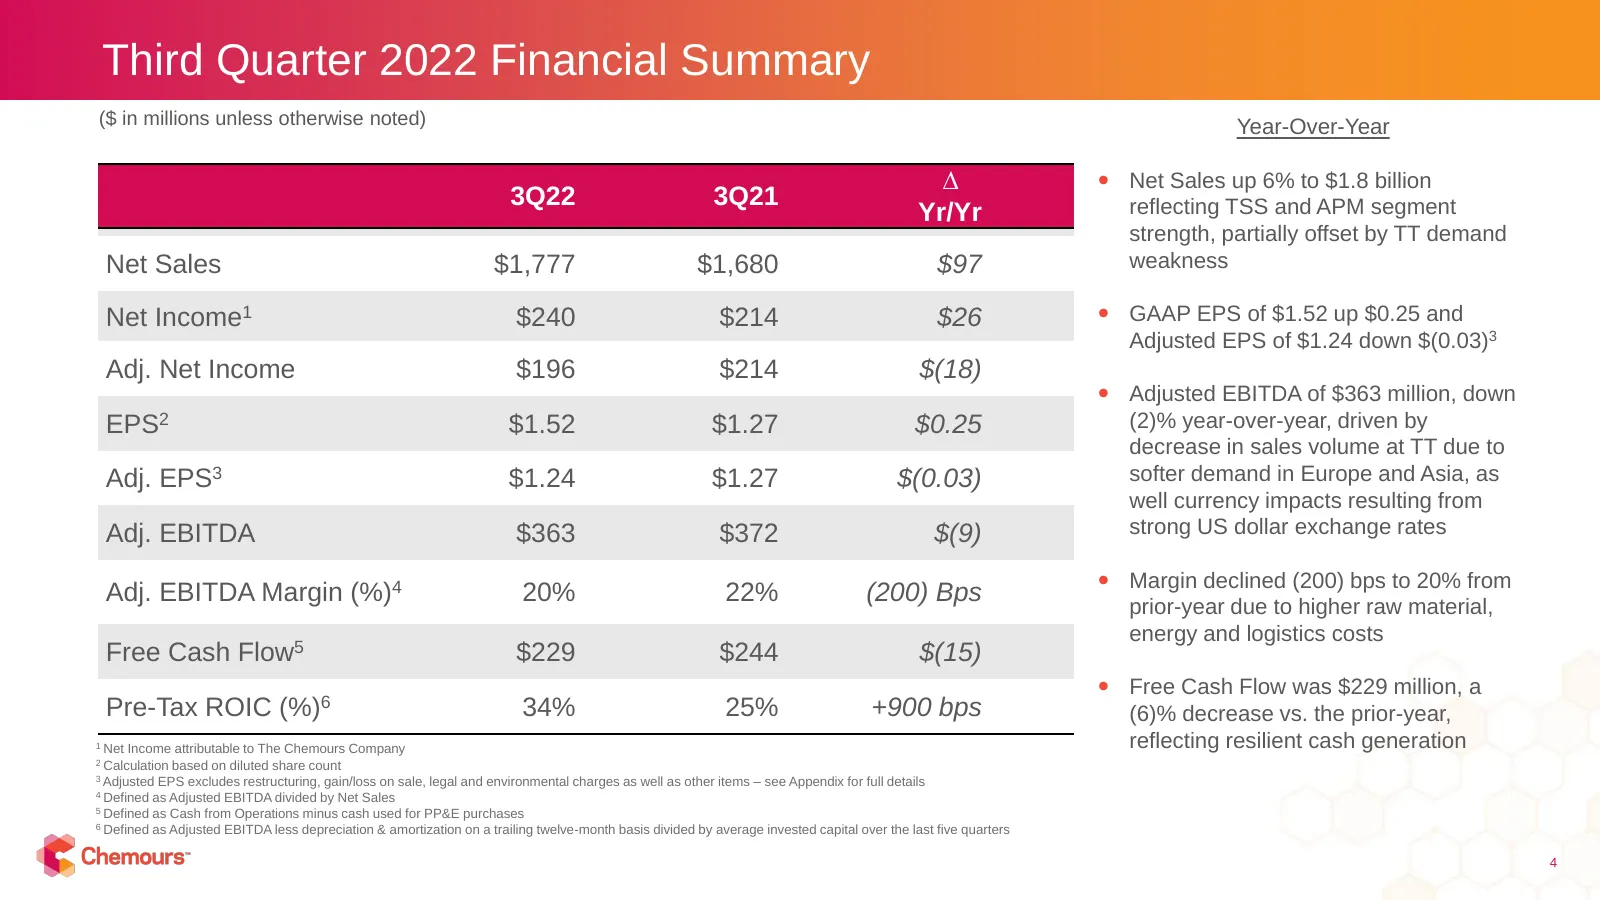
Third Quarter 2022 Financial Summary ($ in millions unless otherwise noted) Year-Over-Year ∆ Net Sales up 6% to $1.8 billion 3Q22 3Q21 reflecting TSS and APM segment Yr/Yr strength, partially offset by TT demand Net Sales $1,777 $1,680 $97 weakness Net Income1 $240 $214 $26 GAAP EPS of $1.52 up
Slide 5: Adjusted EBITDA Bridge: 3Q22 versus 3Q21
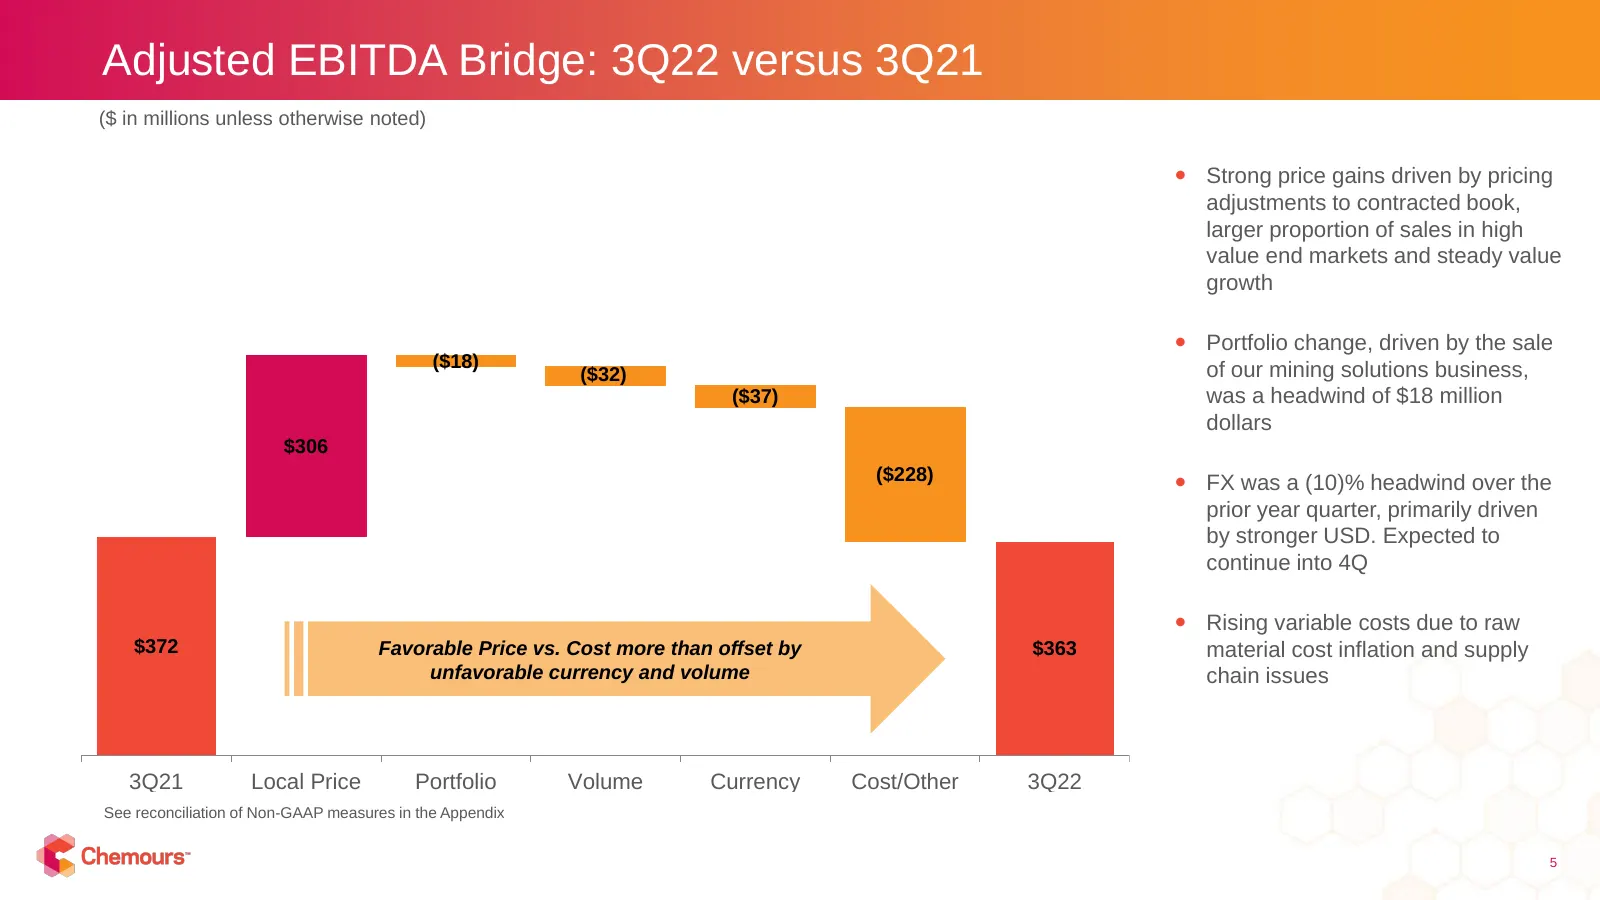
Adjusted EBITDA Bridge: 3Q22 versus 3Q21 ($ in millions unless otherwise noted) Strong price gains driven by pricing adjustments to contracted book, larger proportion of sales in high value end markets and steady value growth Portfolio change, driven by the sale ($18) of our mining solutions bus
Slide 6: Liquidity Position
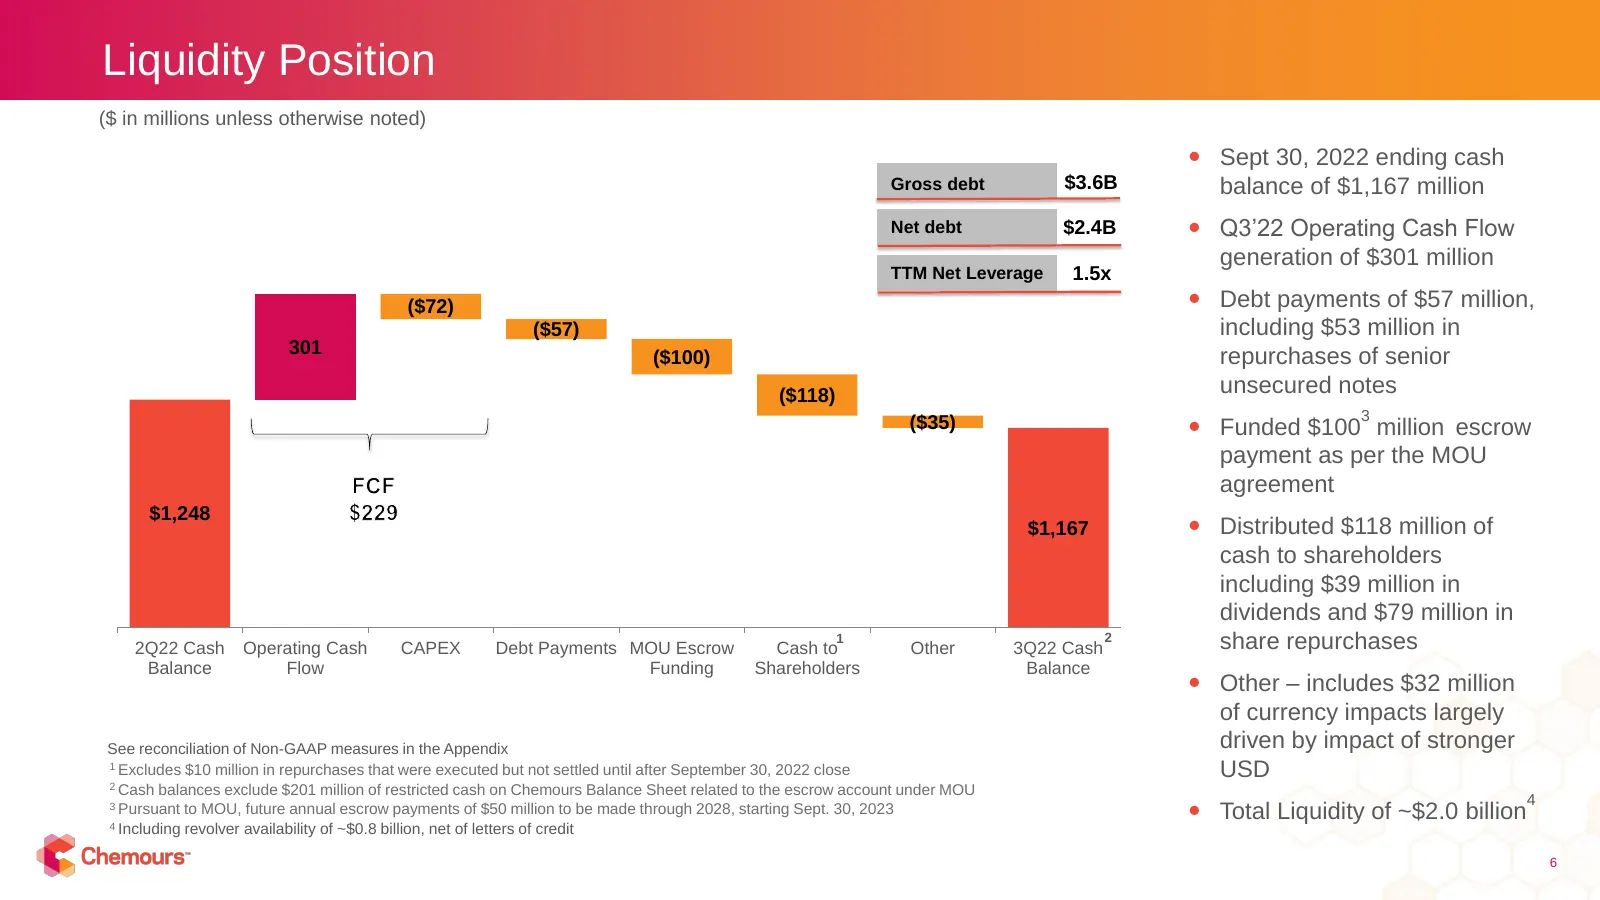
Liquidity Position ($ in millions unless otherwise noted) Sept 30, 2022 ending cash Gross debt $3.6B balance of $1,167 million Net debt $2.4B Q3’22 Operating Cash Flow generation of $301 million 1600 TTM Net Leverage 1.5x ($72) Debt payments of $57 million, ($57) including $53 million in 1400
Slide 7: Titanium Technologies Business Summary
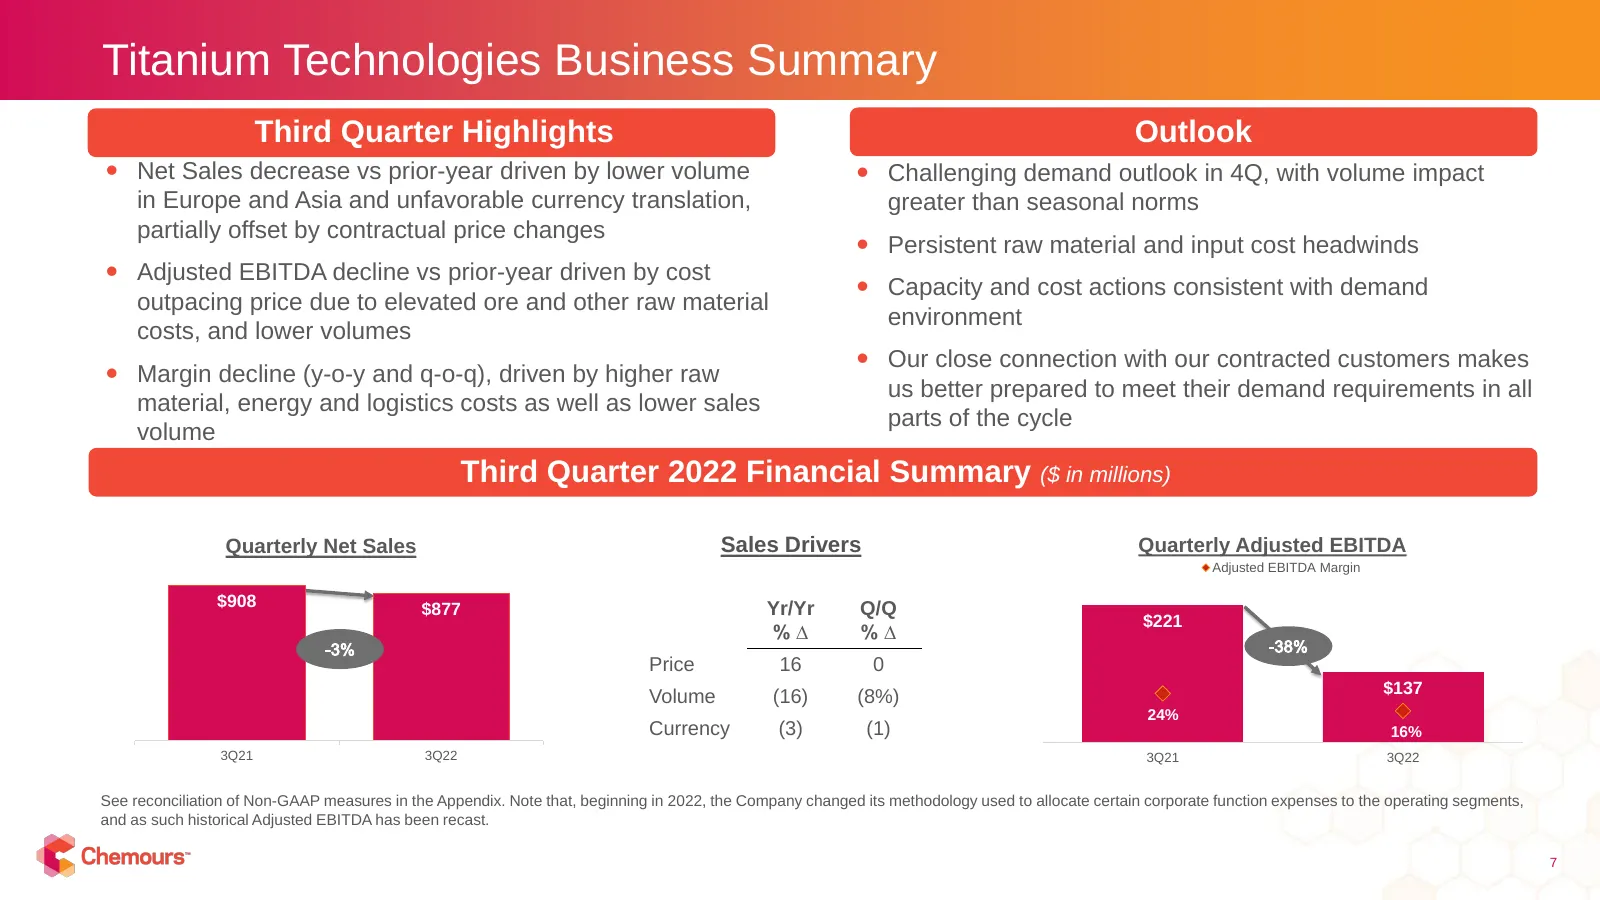
Titanium Technologies Business Summary Third Quarter Highlights Outlook Net Sales decrease vs prior-year driven by lower volume Challenging demand outlook in 4Q, with volume impact in Europe and Asia and unfavorable currency translation, greater than seasonal norms partially offset by contractua
Slide 8: Thermal & Specialized Solutions Business Summary
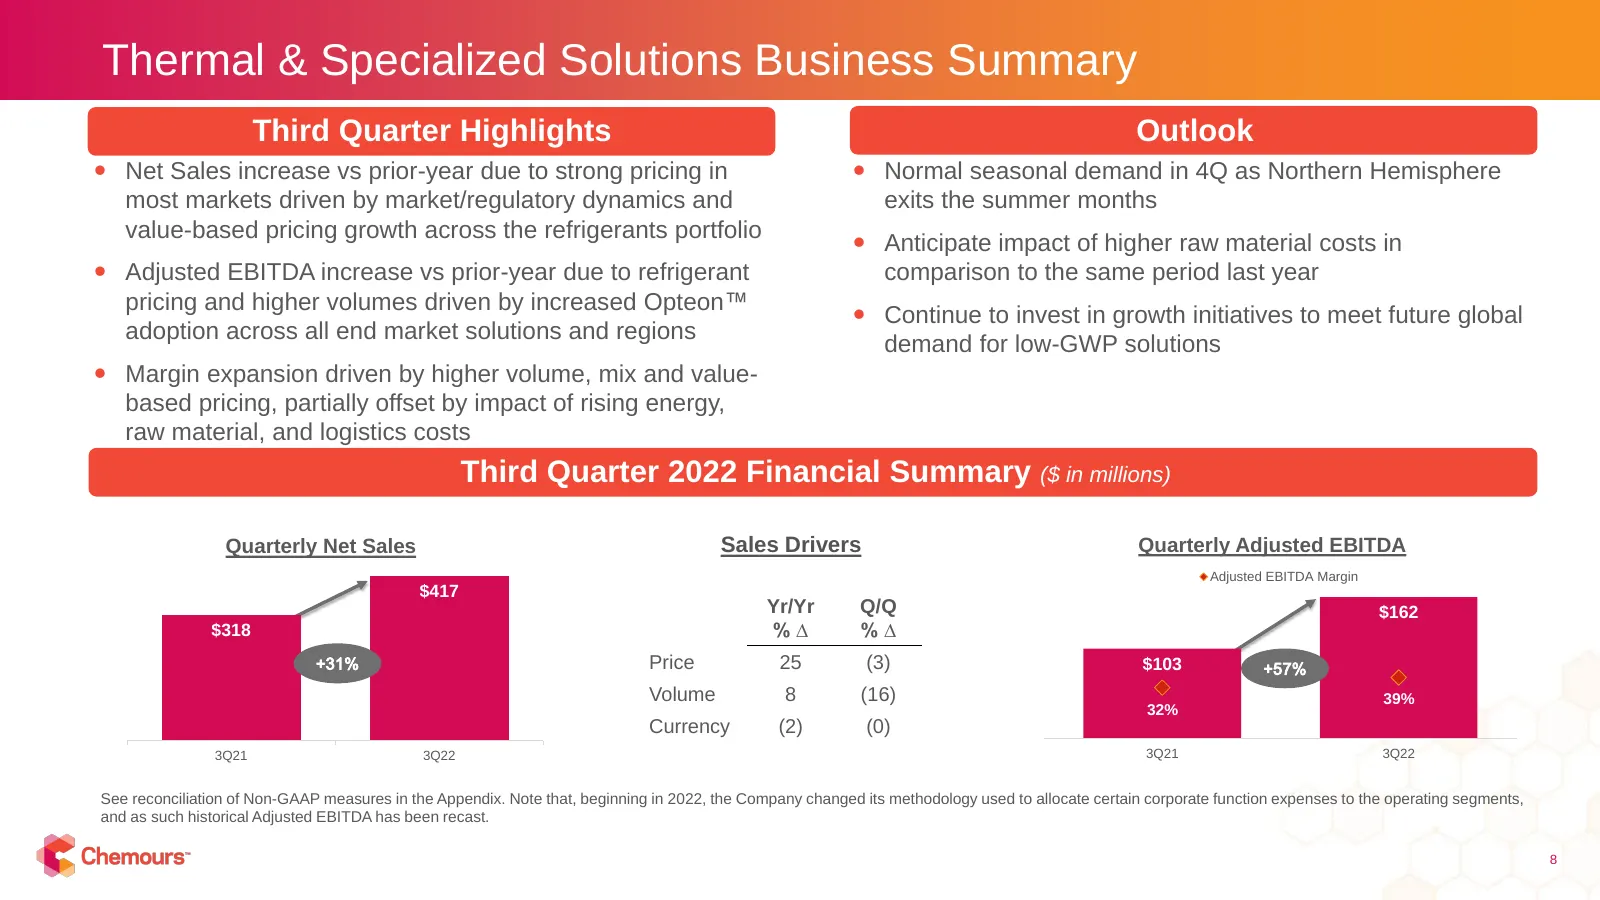
Thermal & Specialized Solutions Business Summary Third Quarter Highlights Outlook Net Sales increase vs prior-year due to strong pricing in Normal seasonal demand in 4Q as Northern Hemisphere most markets driven by market/regulatory dynamics and exits the summer months value-based pricing growth
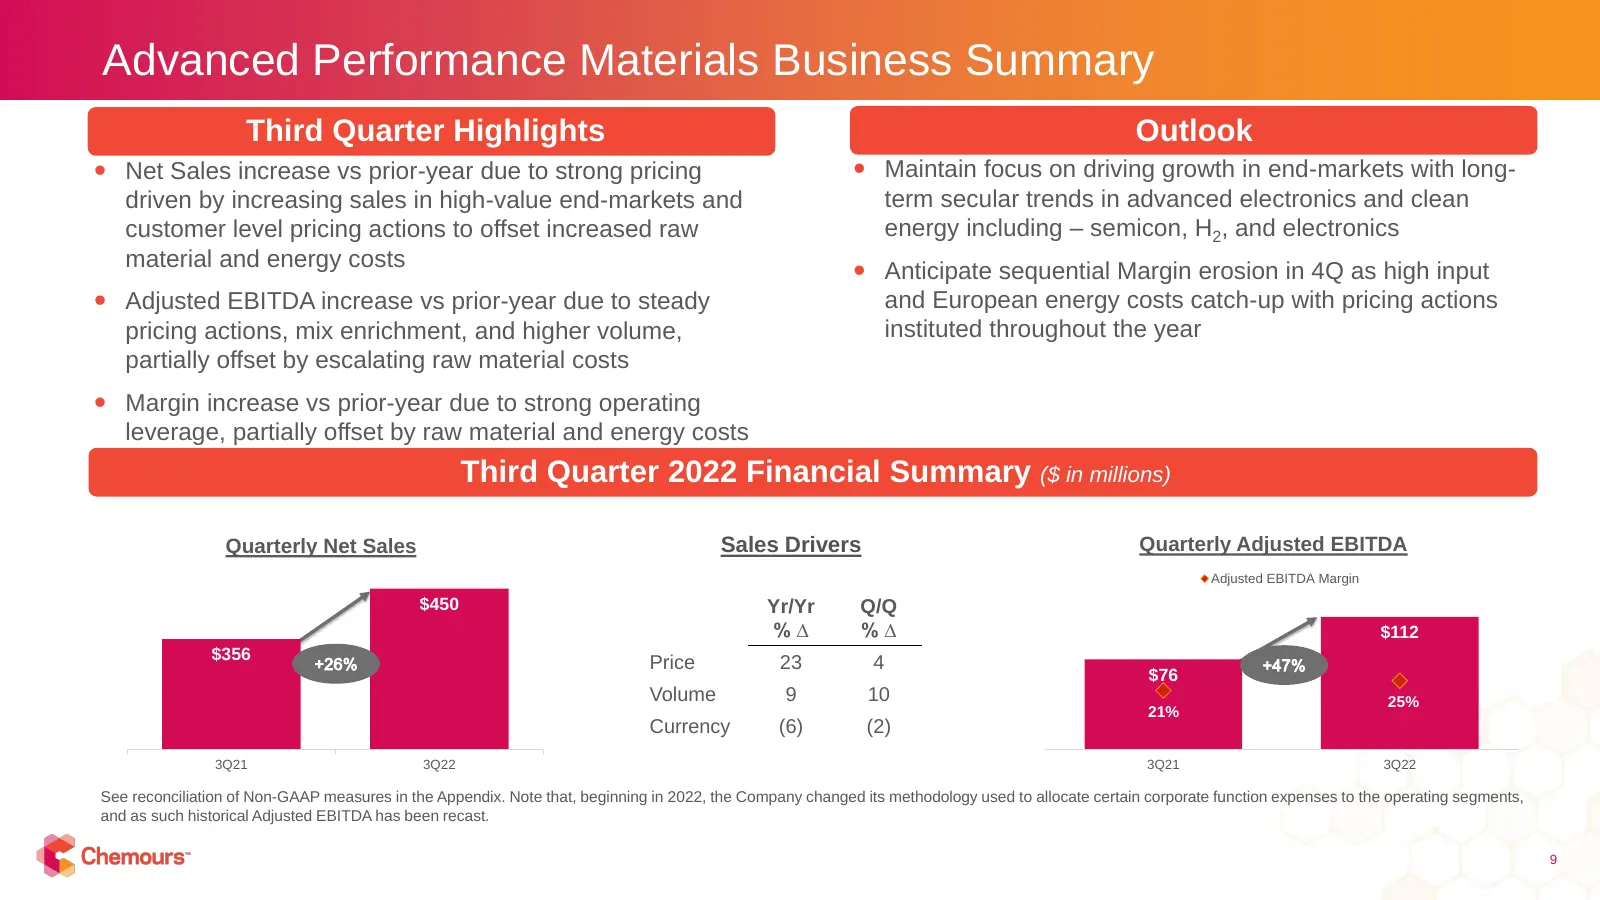
Slide 9: Advanced Performance Materials Business Summary
Advanced Performance Materials Business Summary Third Quarter Highlights Outlook Net Sales increase vs prior-year due to strong pricing Maintain focus on driving growth in end-markets with long- driven by increasing sales in high-value end-markets and term secular trends in advanced electronics
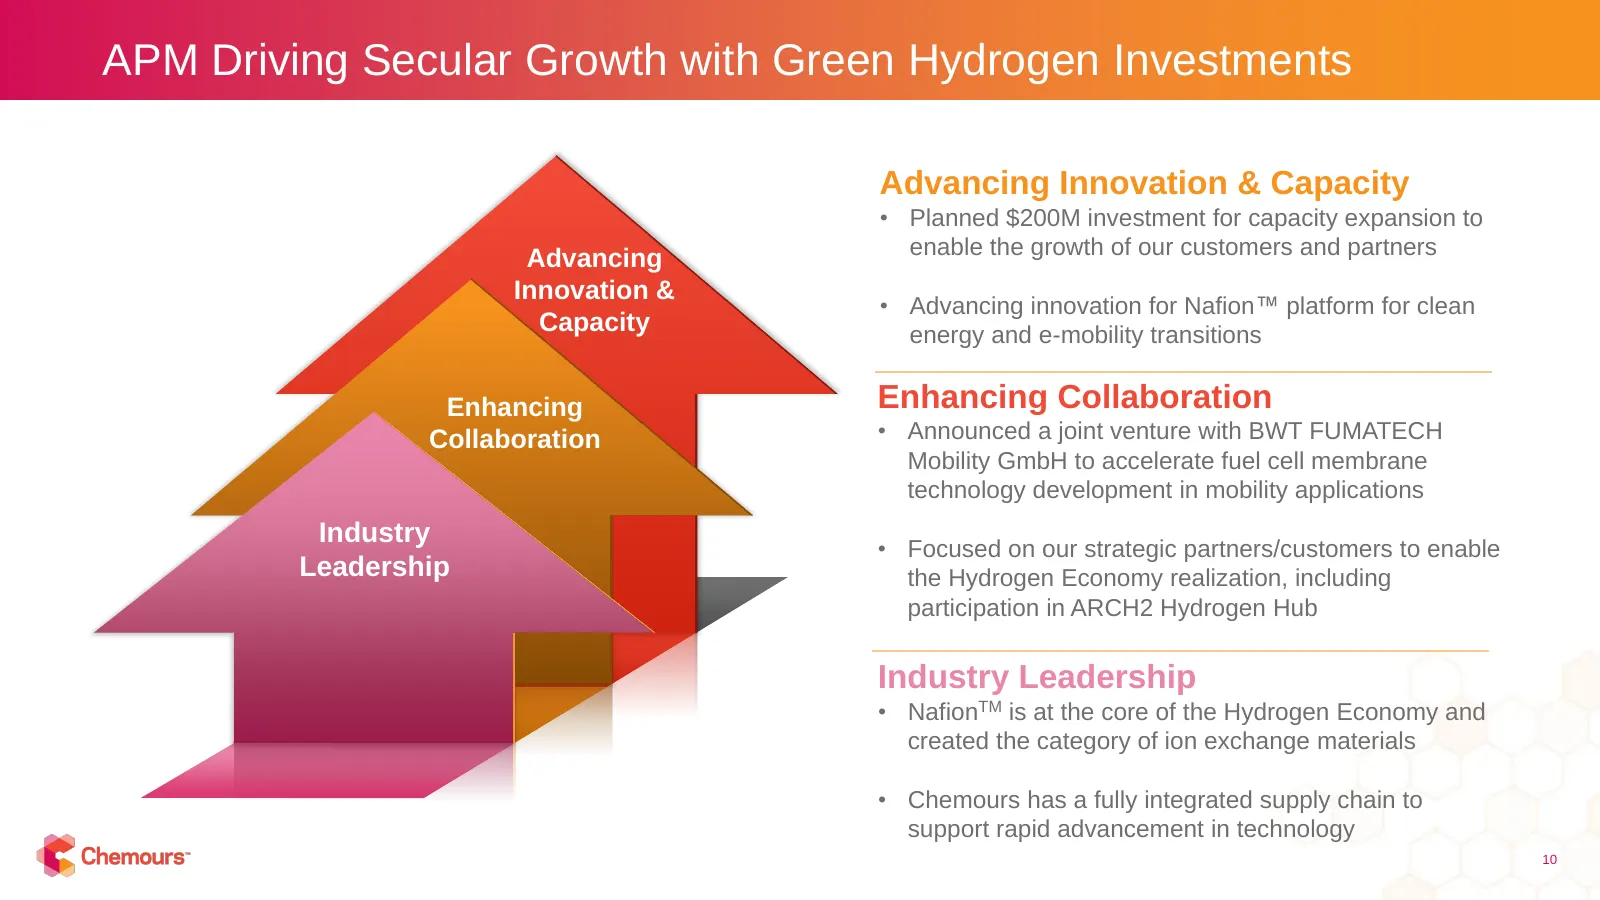
Slide 10: APM Driving Secular Growth with Green Hydrogen Investments
APM Driving Secular Growth with Green Hydrogen Investments Advancing Innovation & Capacity • Planned $200M investment for capacity expansion to Advancing enable the growth of our customers and partners Innovation & • Advancing innovation for Nafion™ platform for clean Capacity energy and e-mobility
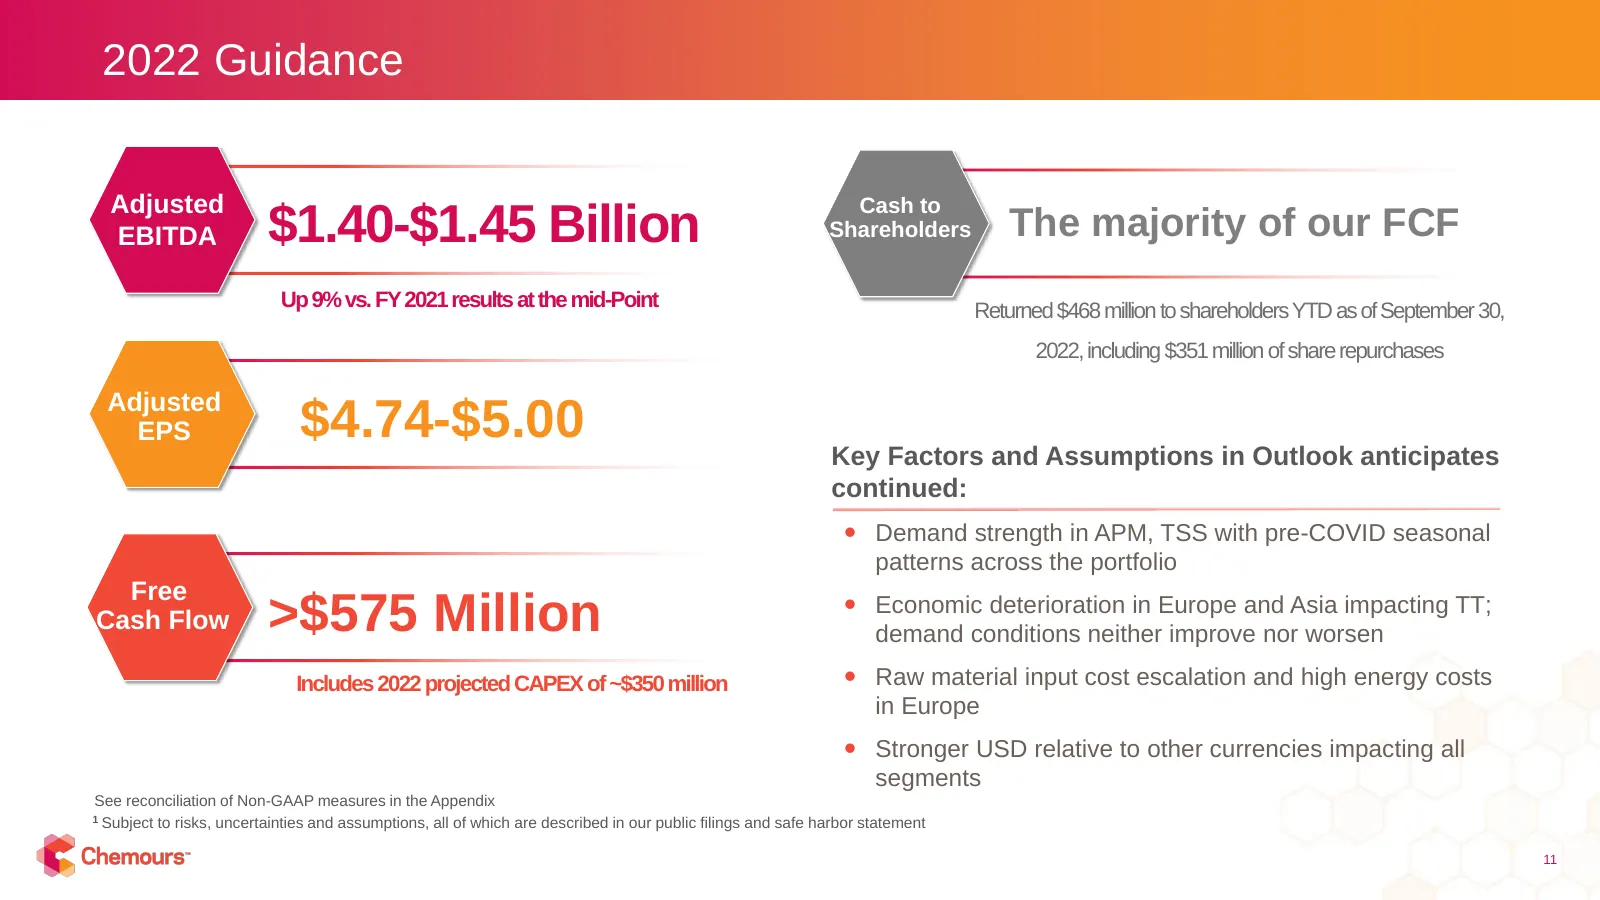
Slide 11: 2022 Guidance
2022 Guidance Adjusted Cash to EBITDA $1.40-$1.45 Billion Shareholders The majority of our FCF Up 9% vs. FY 2021 results at the mid-Point Returned $468 million to shareholders YTD as of September 30, 2022, including $351 million of share repurchases Adjusted EPS $4.74-$5.00 Key Factors and Assumptio
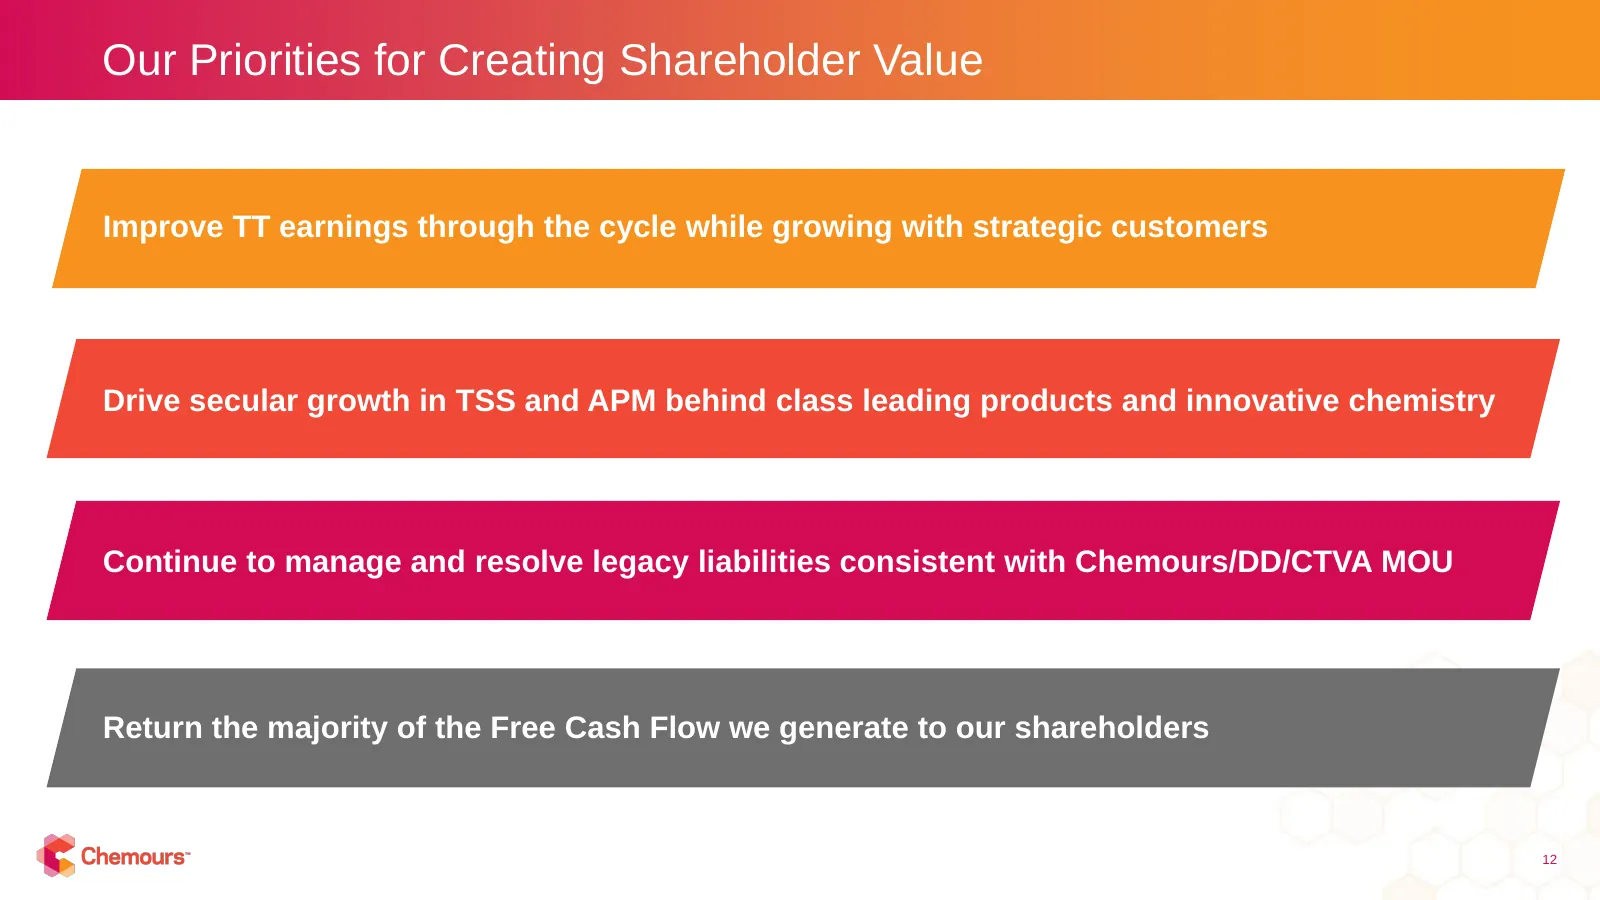
Slide 12: Our Priorities for Creating Shareholder Value
Our Priorities for Creating Shareholder Value Improve TT earnings through the cycle while growing with strategic customers Drive secular growth in TSS and APM behind class leading products and innovative chemistry Continue to manage and resolve legacy liabilities consistent with Chemours/DD/CTVA MOU
Slide 13: ©2022 The Chemours Company. Chemours™ and the Chemours Logo are trademarks or registered trademarks
©2022 The Chemours Company. Chemours™ and the Chemours Logo are trademarks or registered trademarks of The Chemours Company
Slide 14: Segment Net Sales and Adjusted EBITDA (Unaudited)
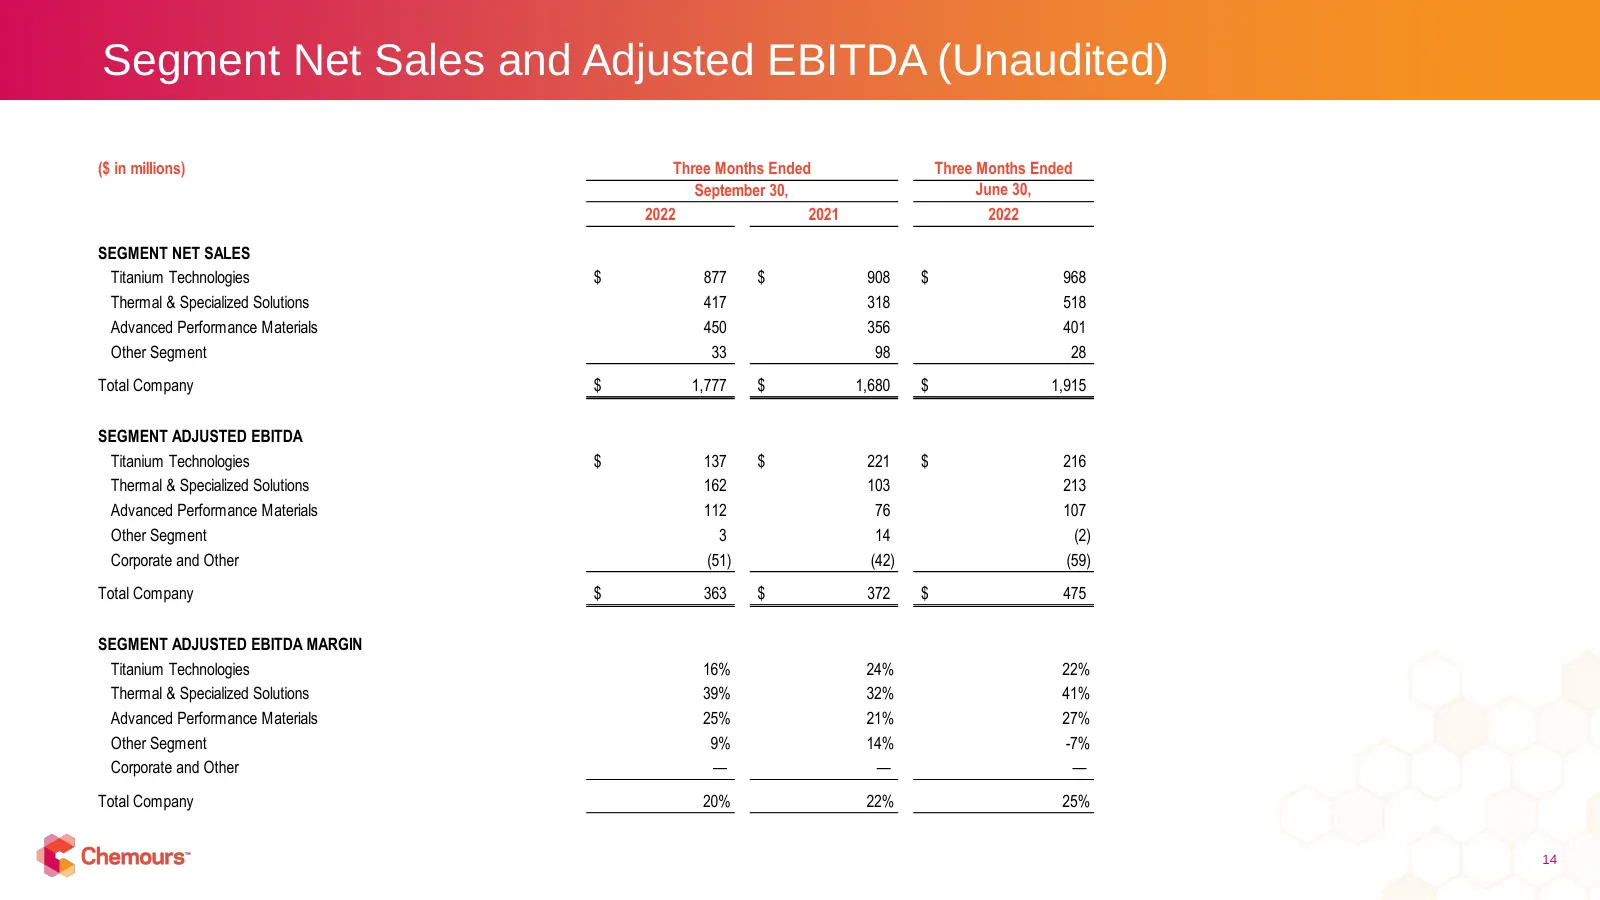
Segment Net Sales and Adjusted EBITDA (Unaudited) ($ in millions) Three Months Ended Three Months Ended September 30, June 30, 2022 2021 2022 SEGMENT NET SALES Titanium Technologies $ 877 $ 908 $ 968 Thermal & Specialized Solutions 417 318 518 Advanced Performance Materials 450 356 401 Other Segment
Slide 15: GAAP Net Income to Adjusted Net Income, Adjusted EBITDA, and Adjusted EPS Reconciliations
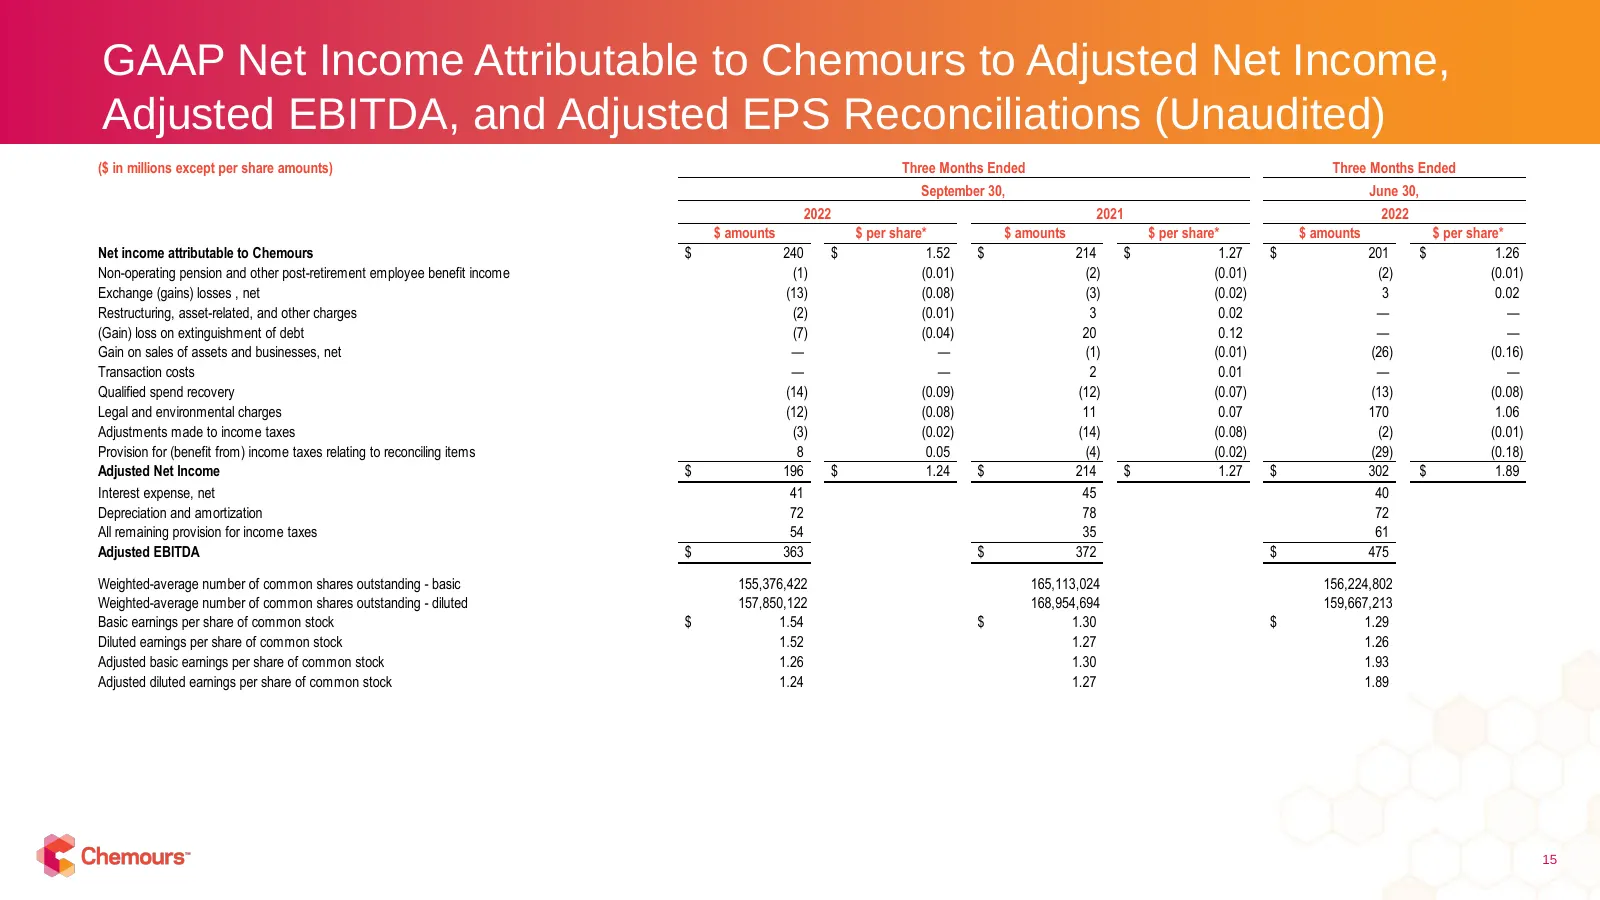
GAAP Net Income Attributable to Chemours to Adjusted Net Income, Adjusted EBITDA, and Adjusted EPS Reconciliations (Unaudited) ($ in millions except per share amounts) Three Months Ended Three Months Ended September 30, June 30, 2022 2021 2022 $ amounts $ per share* $ amounts $ per share* $ amounts
Slide 16: Free Cash Flow Reconciliations (Unaudited)
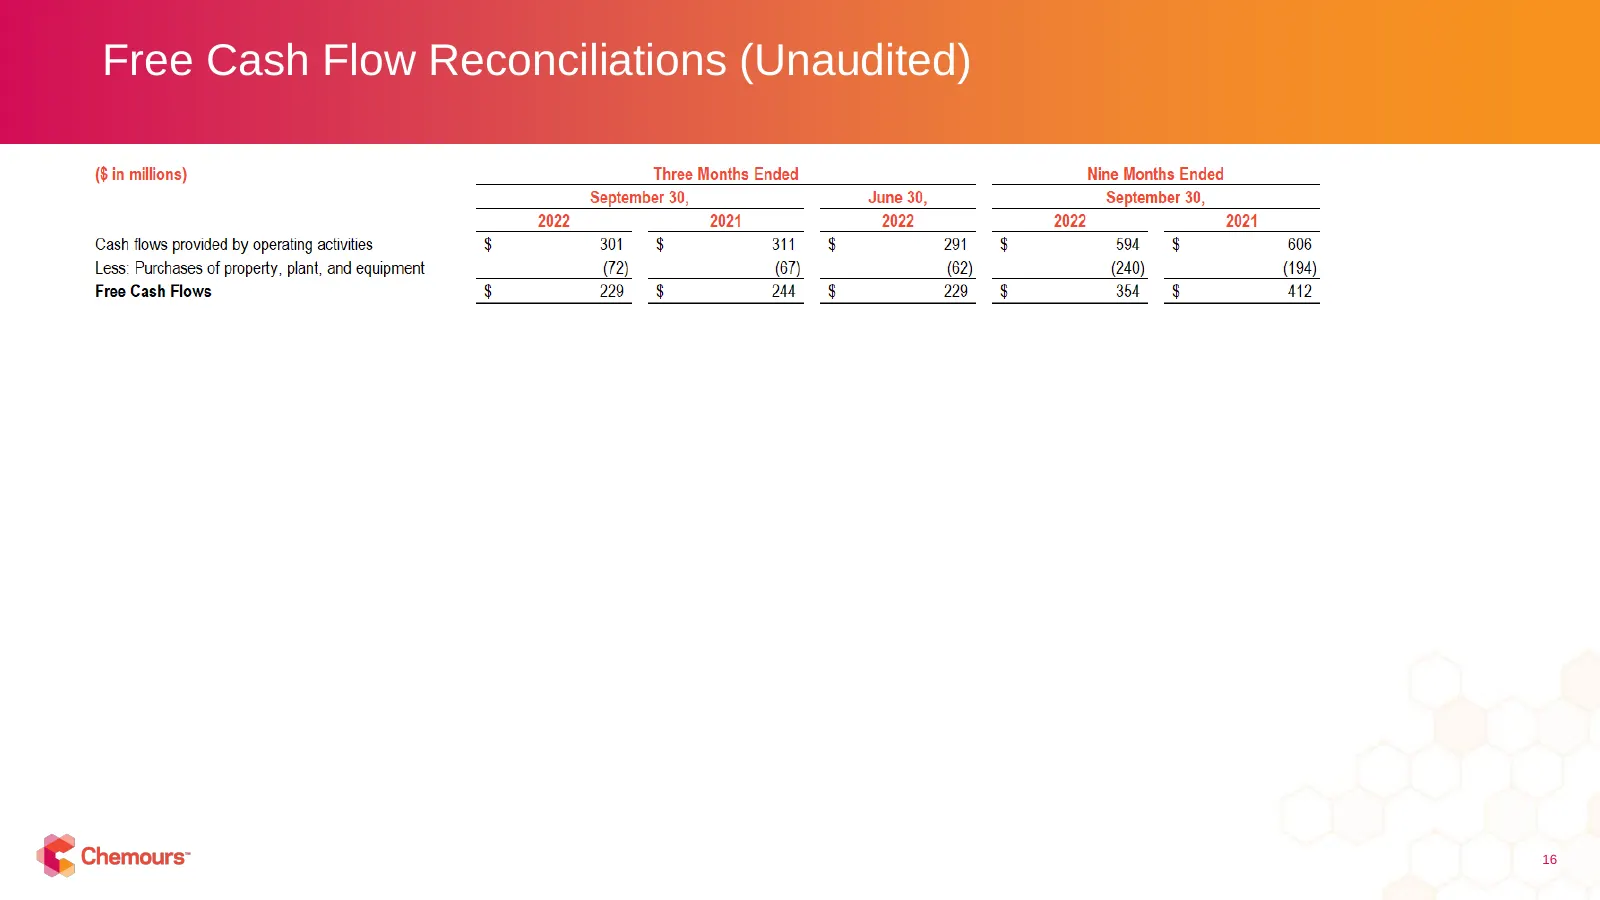
Free Cash Flow Reconciliations (Unaudited) 16
Slide 17: Net Leverage Ratio (Unaudited)
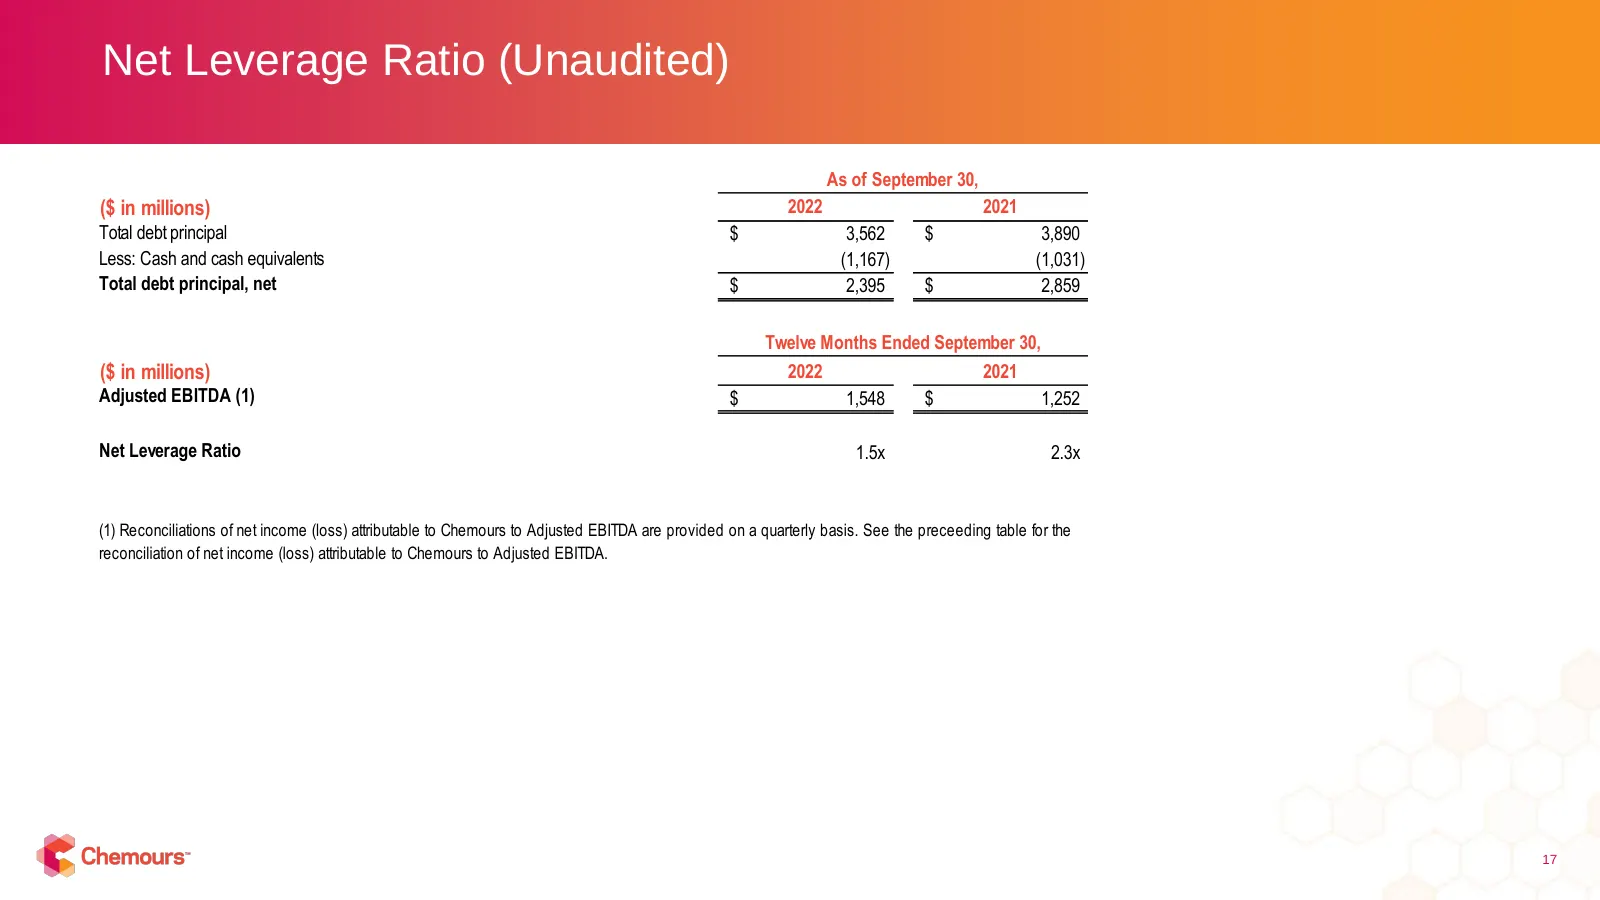
Net Leverage Ratio (Unaudited) As of September 30, ($ in millions) 2022 2021 Total debt principal $ 3,562 $ 3,890 Less: Cash and cash equivalents (1,167) (1,031) Total debt principal, net $ 2,395 $ 2,859 Twelve Months Ended September 30, ($ in millions) 2022 2021 Adjusted EBITDA (1) $ 1,548 $ 1,252
Slide 18: Return on Invested Capital (ROIC) (Unaudited)
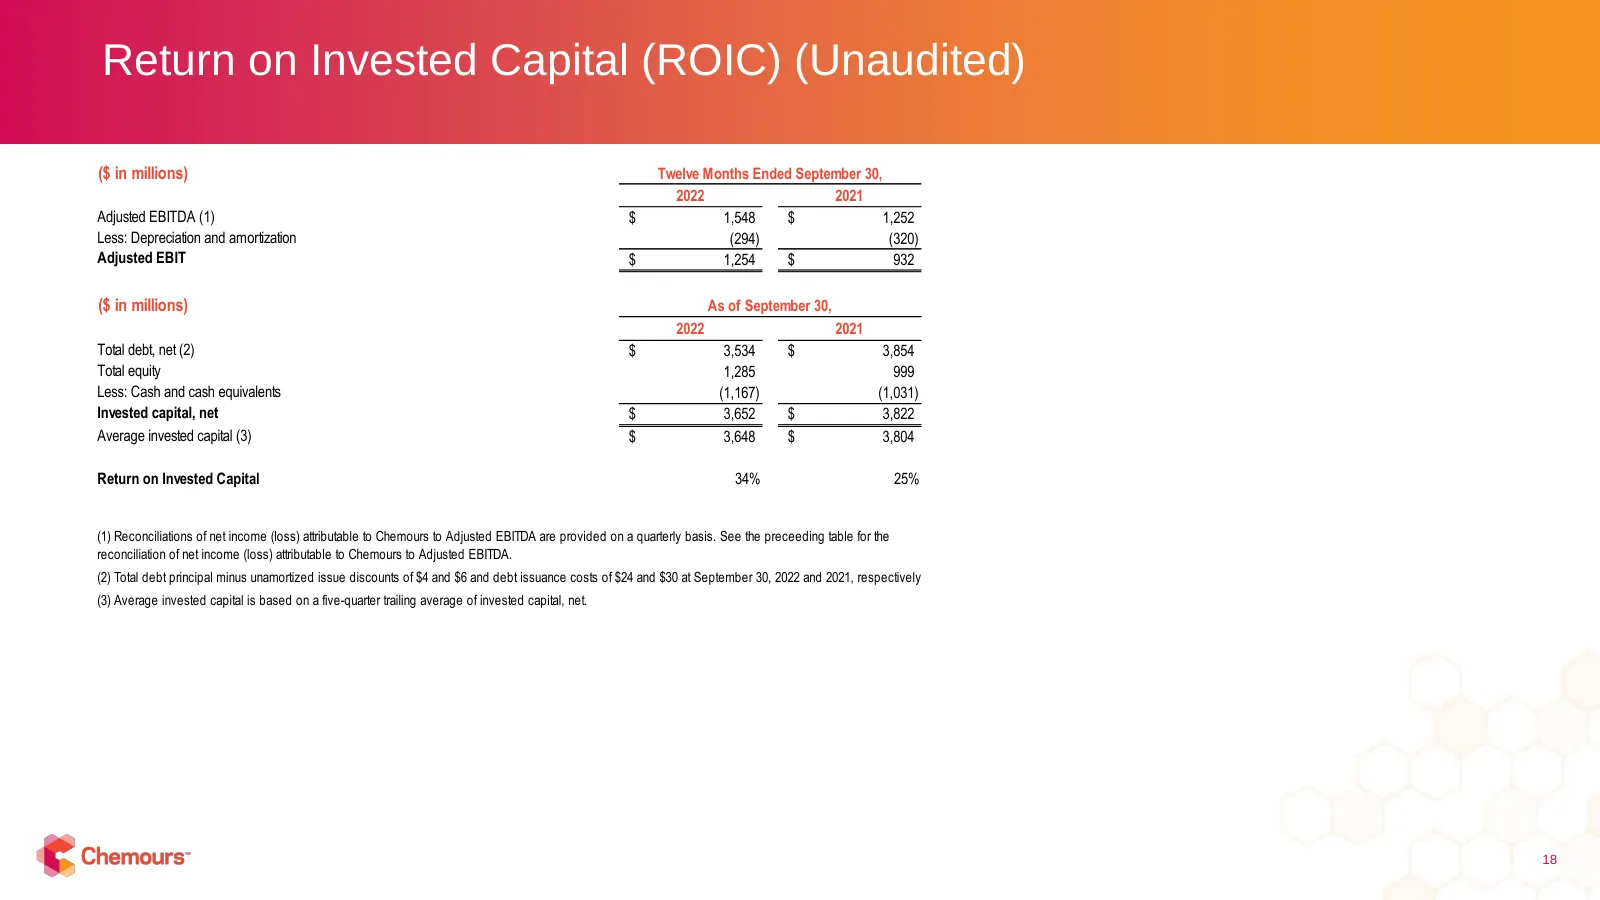
Return on Invested Capital (ROIC) (Unaudited) ($ in millions) Twelve Months Ended September 30, 2022 2021 Adjusted EBITDA (1) $ 1,548 $ 1,252 Less: Depreciation and amortization (294) (320) Adjusted EBIT $ 1,254 $ 932 ($ in millions) As of September 30, 2022 2021 Total debt, net (2) $ 3,534 $ 3,854
Slide 19: Estimated GAAP Net Income to Adjusted Net Income, Adjusted EBITDA and Adjusted EPS Reconciliation
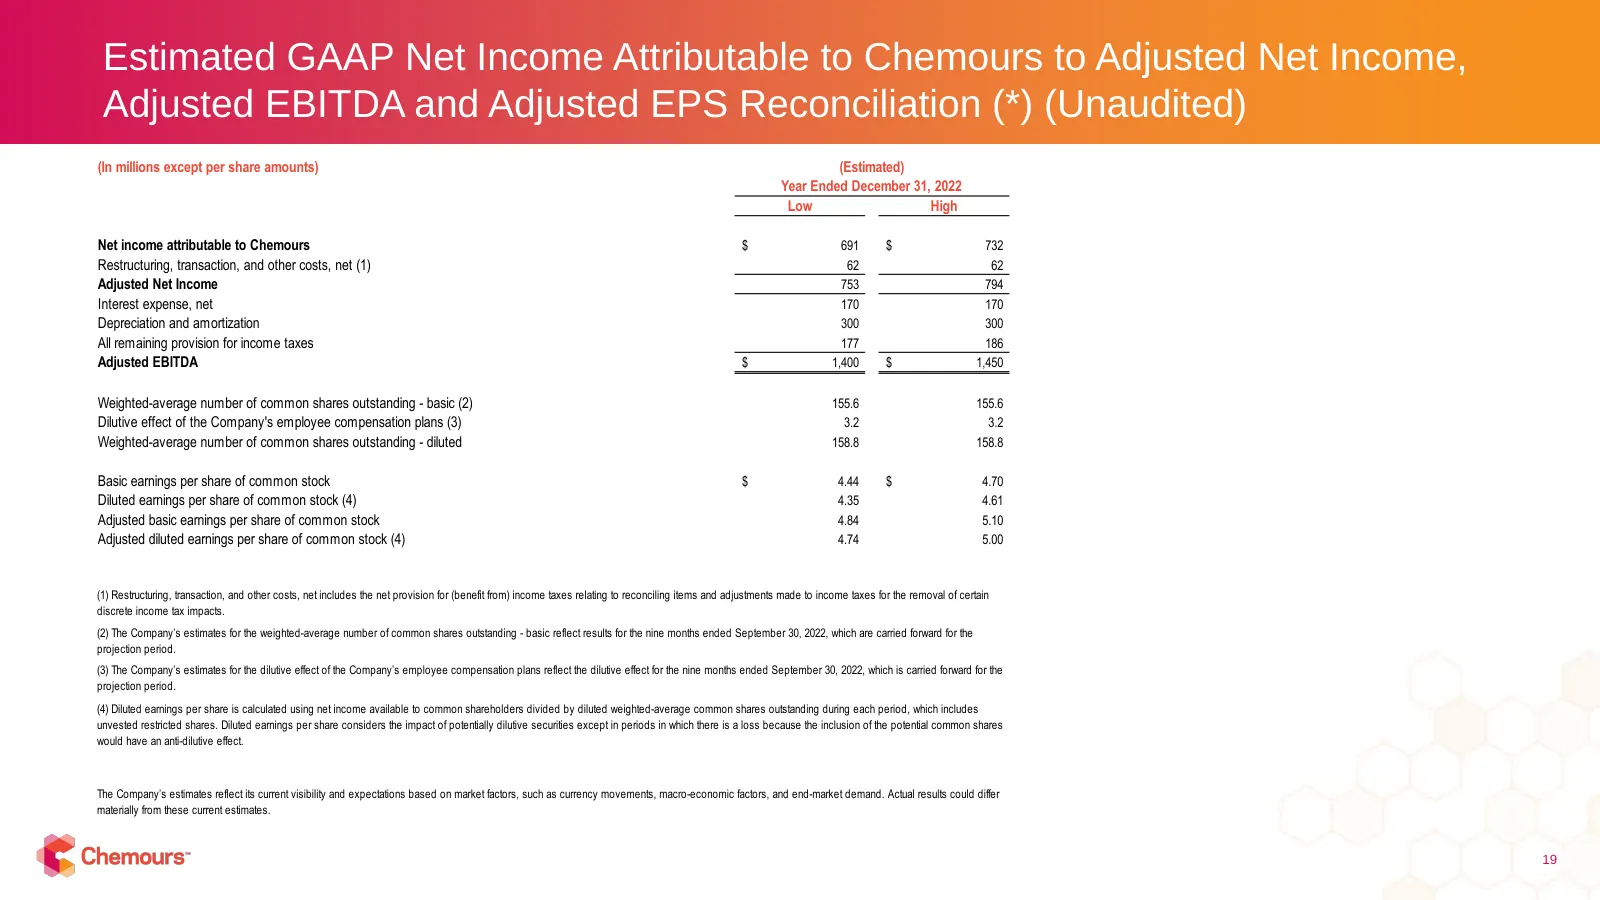
Estimated GAAP Net Income Attributable to Chemours to Adjusted Net Income, Adjusted EBITDA and Adjusted EPS Reconciliation (*) (Unaudited) (In millions except per share amounts) (Estimated) Year Ended December 31, 2022 Low High Net income attributable to Chemours $ 691 $ 732 Restructuring, transacti
Slide 20: Estimated GAAP Operating Cash Flows to Free Cash Flow Reconciliations
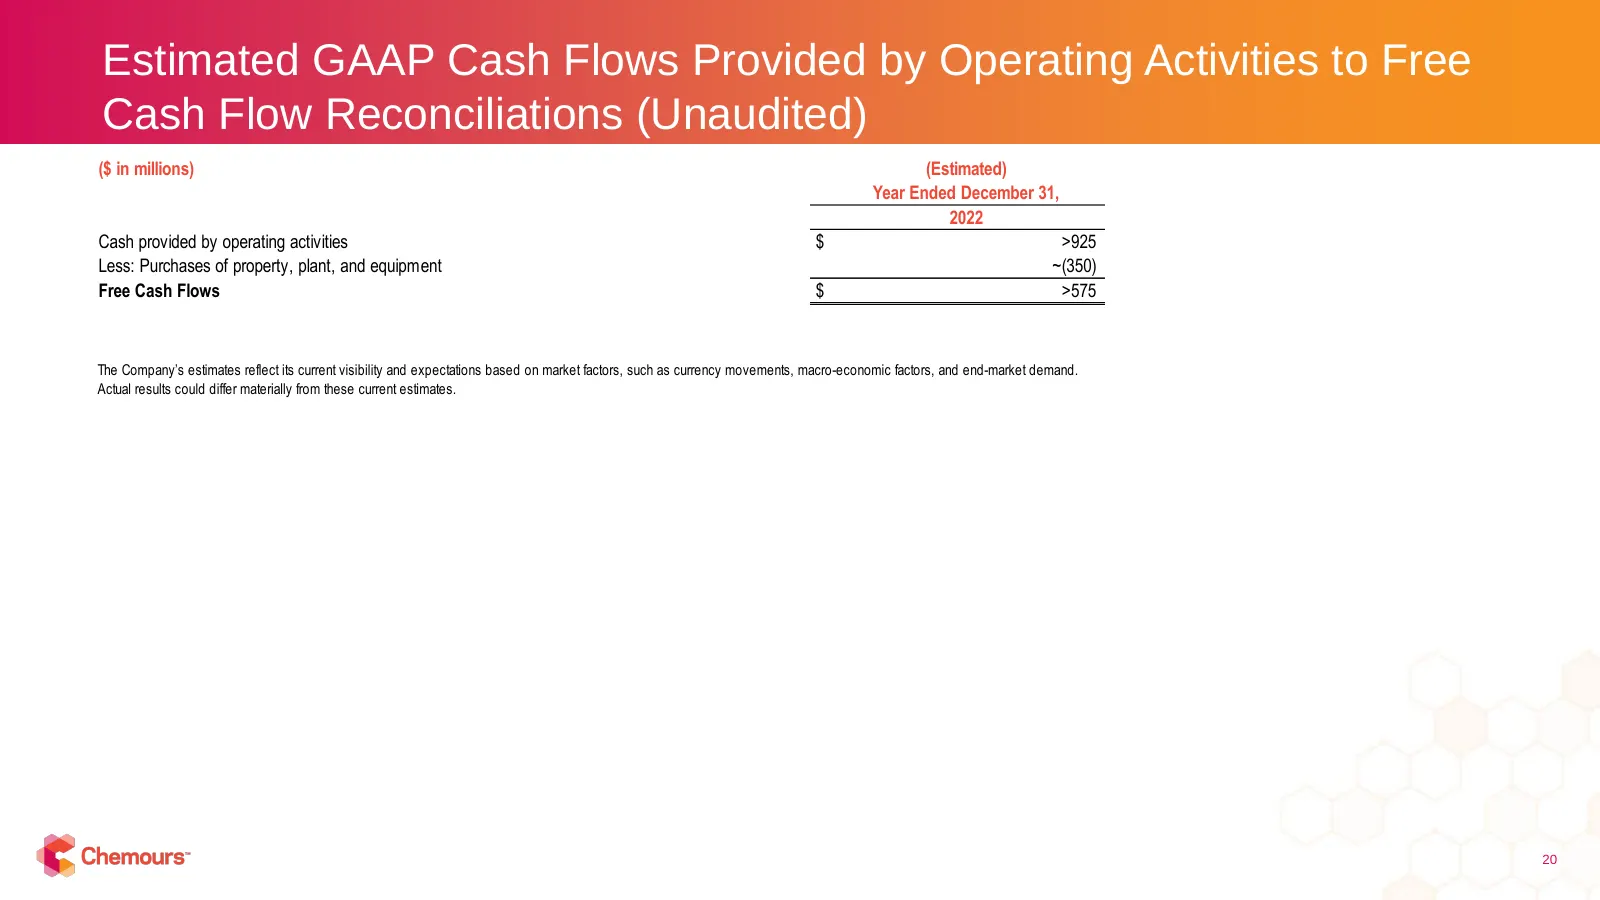
Estimated GAAP Cash Flows Provided by Operating Activities to Free Cash Flow Reconciliations (Unaudited) ($ in millions) (Estimated) Year Ended December 31, 2022 Cash provided by operating activities $ >925 Less: Purchases of property, plant, and equipment ~(350) Free Cash Flows $ >575 The Company’s
Slide 21: ©2022 The Chemours Company. Chemours™ and the Chemours Logo are trademarks or registered trademarks
©2022 The Chemours Company. Chemours™ and the Chemours Logo are trademarks or registered trademarks of The Chemours Company
Source: 6ix earnings call
More decks from Chemours Company (the)
 Q3 2026 Earnings Presentation27 slides · Nov 3, 2026
 Investor Presentation (September 2026)34 slides · Sep 9, 2026
 The Chemours Company — Investor Presentation (September 2026)34 slides · September 2026
 The Chemours Company — Q2 2026 Earnings Presentation26 slides · Aug 5, 2026
 Q1 2026 Earnings Presentation24 slides · May 6, 2026
 The Chemours Company — Technical Presentation (April 2026)54 slides · Apr 13, 2026