Chemours Company (the) · NYSE:CC
Chemours Company (the) — Q3 2026 Earnings Presentation
27 slides from Chemours Company (the)'s earnings presentation, Nov 3, 2026
Slide 1: Q3 2026 Earnings Presentation
Q3 2026 EARNINGS PRESENTATION November 3, 2026
Slide 2: Safe Harbor Statement and Other Matters
Safe Harbor Statement and Other Matters This presentation contains forward-looking statements, within the meaning of Section 27A of the Securities Act of 1933 and Section 21E of the Securities Exchange Act of 1934, which involve risks and uncertainties. Forward-looking statements provide current exp
Slide 3: Third Quarter 2026 Highlights
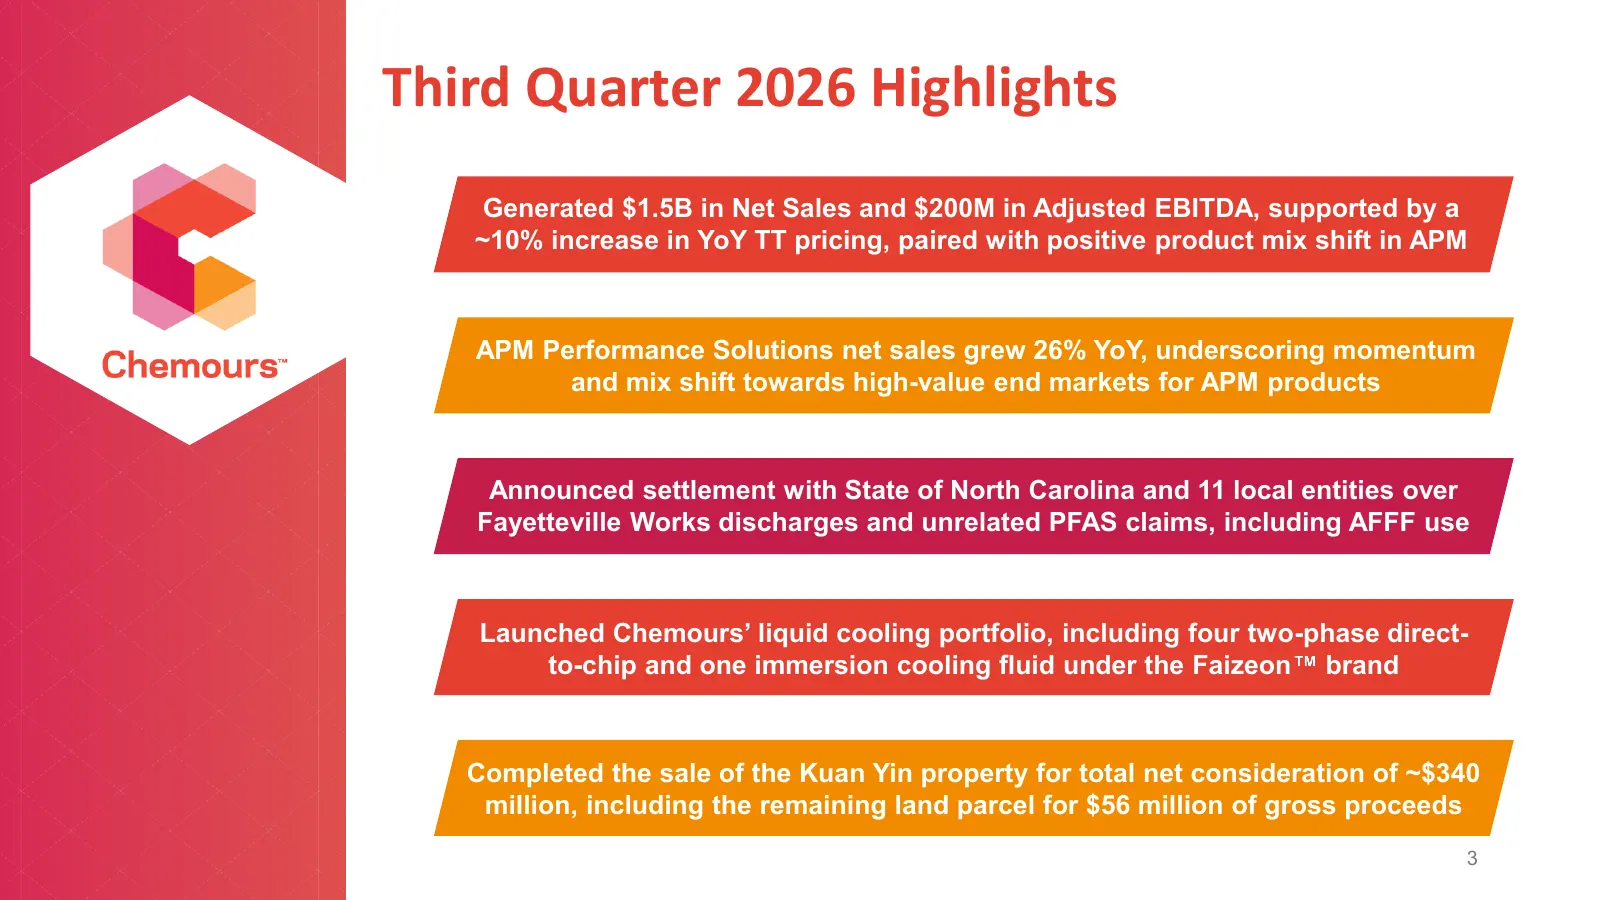
Third Quarter 2026 Highlights Generated $1.5B in Net Sales and $200M in Adjusted EBITDA, supported by a ~10% increase in YoY TT pricing, paired with positive product mix shift in APM APM Performance Solutions net sales grew 26% YoY, underscoring momentum and mix shift towards high-value end markets
Slide 4: Third Quarter 2026 Financial Summary
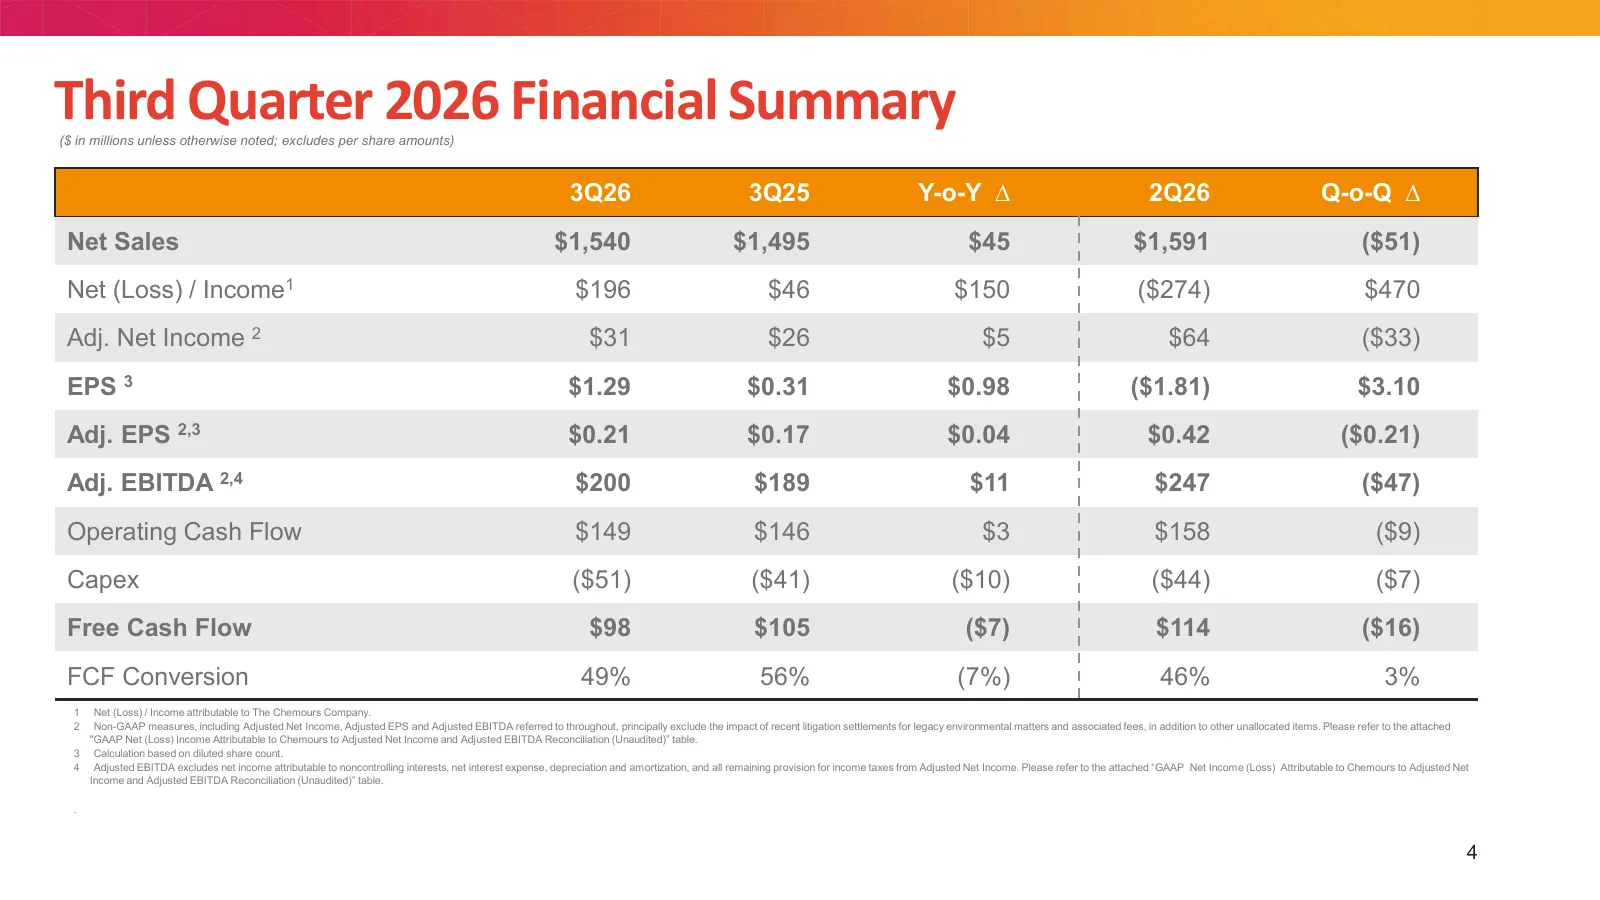
Third Quarter 2026 Financial Summary ($ in millions unless otherwise noted; excludes per share amounts) 3Q26 3Q25 Y-o-Y ∆ 2Q26 Q-o-Q ∆ Net Sales $1,540 $1,495 $45 $1,591 ($51) Net (Loss) / Income1 $196 $46 $150 ($274) $470 Adj. Net Income 2 $31 $26 $5 $64 ($33) EPS 3 $1.29 $0.31 $0.98 ($1.81) $3.10
Slide 5: Adjusted EBITDA Bridge: 3Q26 versus 3Q25
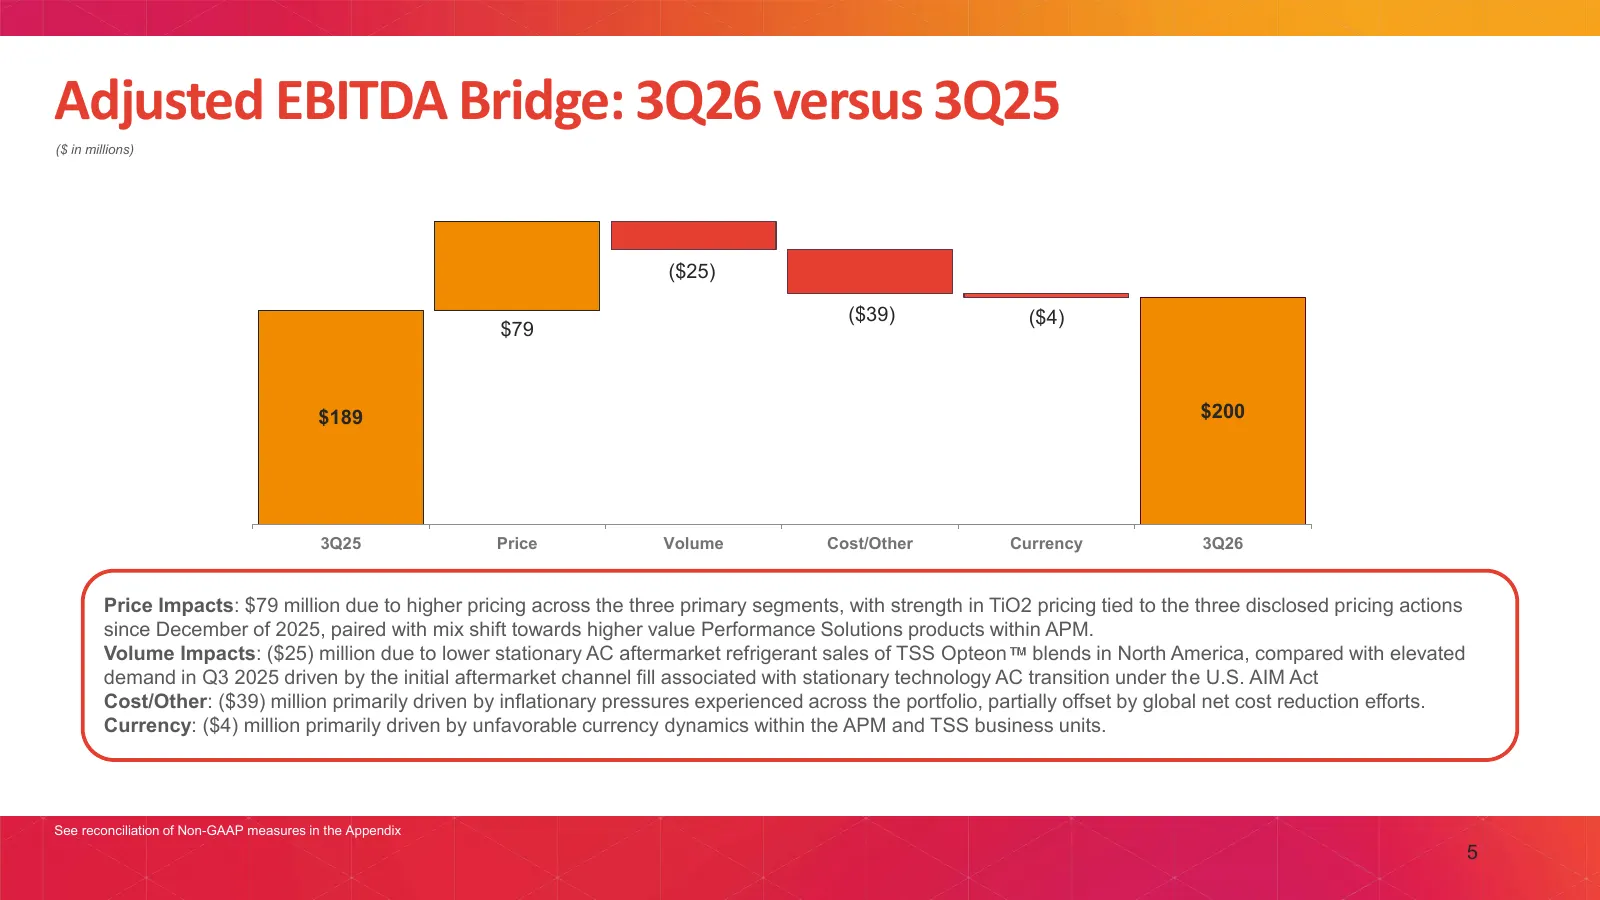
Adjusted EBITDA Bridge: 3Q26 versus 3Q25 ($ in millions) ($25) ($39) ($4) $79 $189 $200 3Q25 Price Volume Cost/Other Currency 3Q26 Price Impacts: $79 million due to higher pricing across the three primary segments, with strength in TiO2 pricing tied to the three disclosed pricing actions since Decem
Slide 6: Quarterly Segment Summary
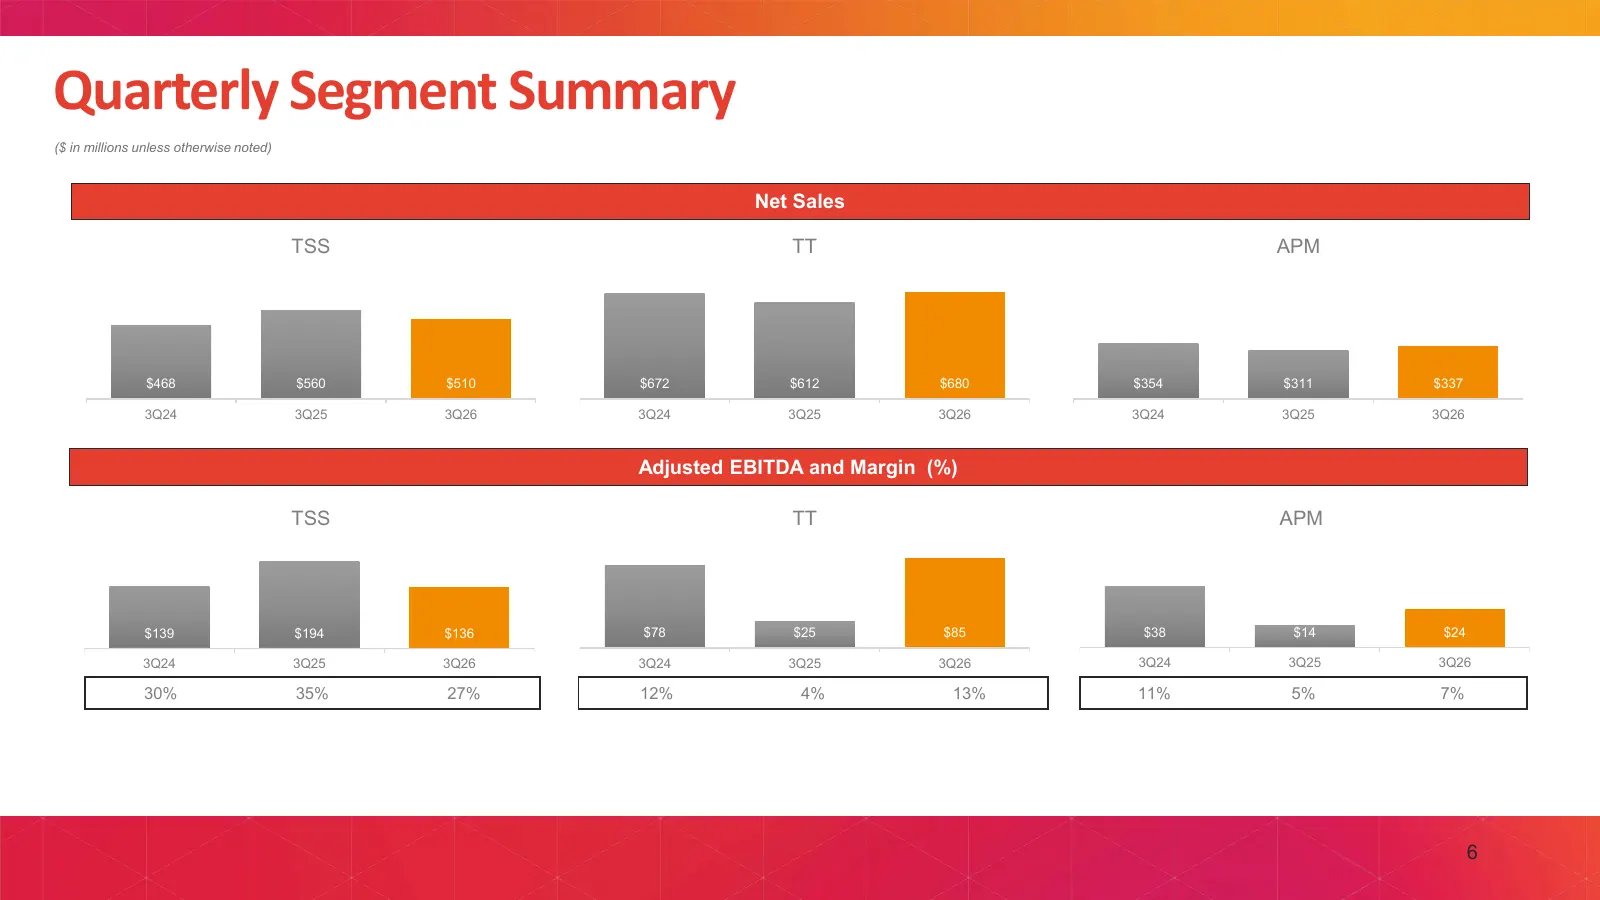
Quarterly Segment Summary ($ in millions unless otherwise noted) Net Sales TSS TT APM $468 $560 $510 $672 $612 $680 $354 $311 $337 3Q24 3Q25 3Q26 3Q24 3Q25 3Q26 3Q24 3Q25 3Q26 Adjusted EBITDA and Margin (%) TSS TT APM $139 $194 $136 $78 $25 $85 $38 $14 $24 3Q24 3Q25 3Q26 3Q24 3Q25 3Q26 3Q24 3Q25 3Q2
Slide 7: Liquidity Position as of September 30, 2026
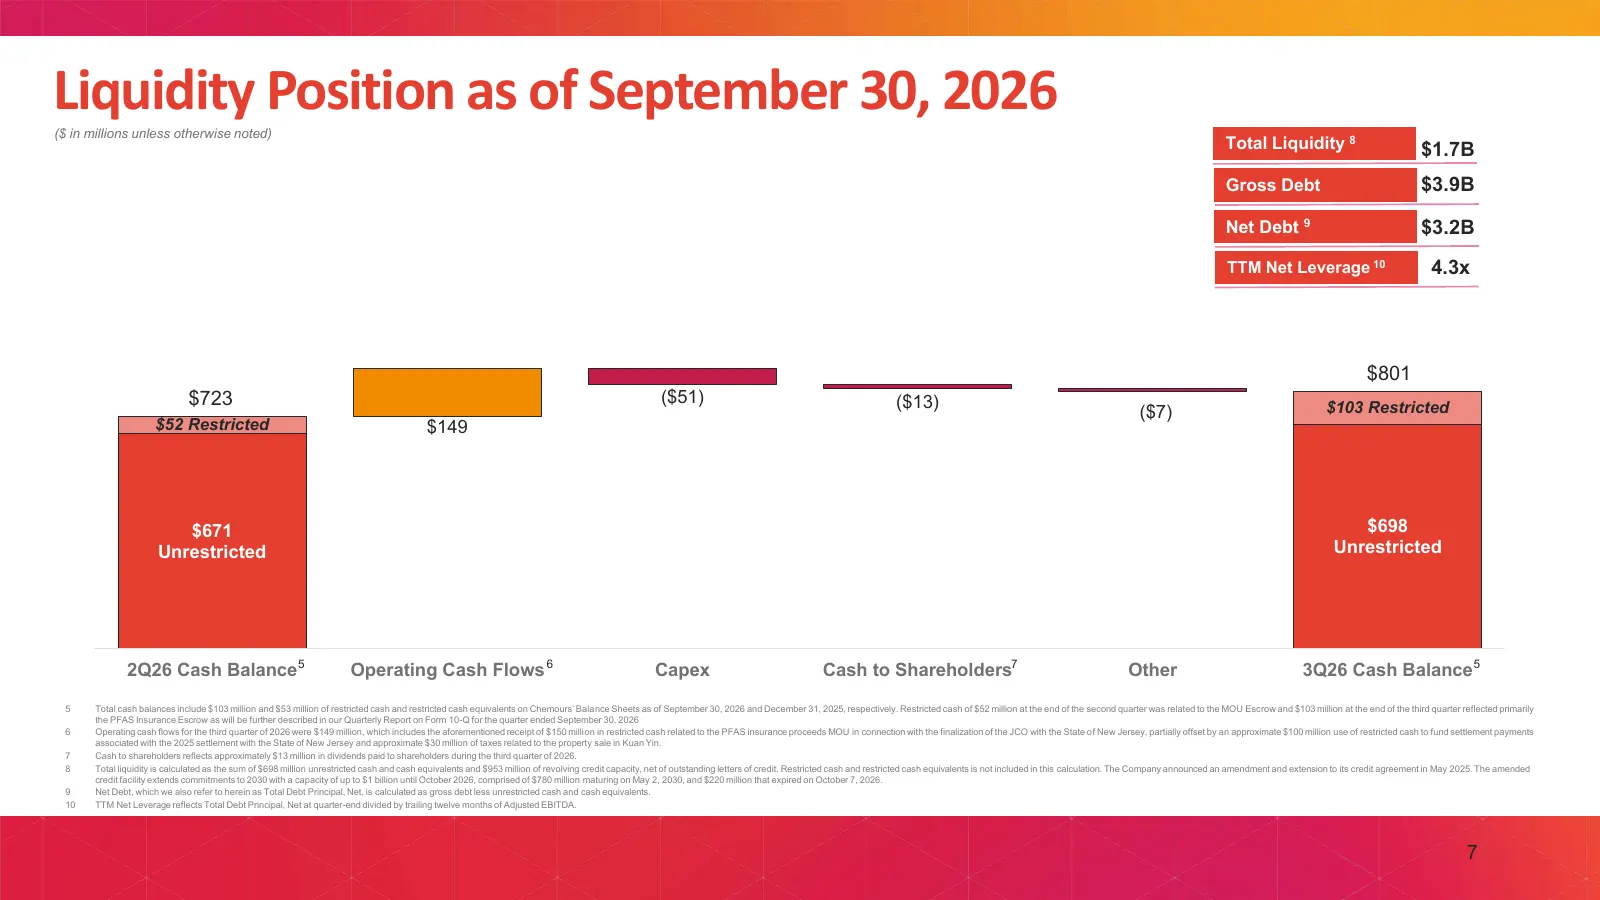
Liquidity Position as of September 30, 2026 ($ in millions unless otherwise noted) Total Liquidity 8 $1.7B Gross Debt $3.9B Net Debt 9 $3.2B TTM Net Leverage 10 4.3x $801 $723 ($51) ($13) ($7) $103 Restricted $52 Restricted $149 $671 $698 Unrestricted Unrestricted 2Q26 Cash Balance 5 Operating Cash
Slide 8: Strategic Progress
STRATEGIC PROGRESS PATHWAY TO THRIVE
Slide 9: Our Strategy
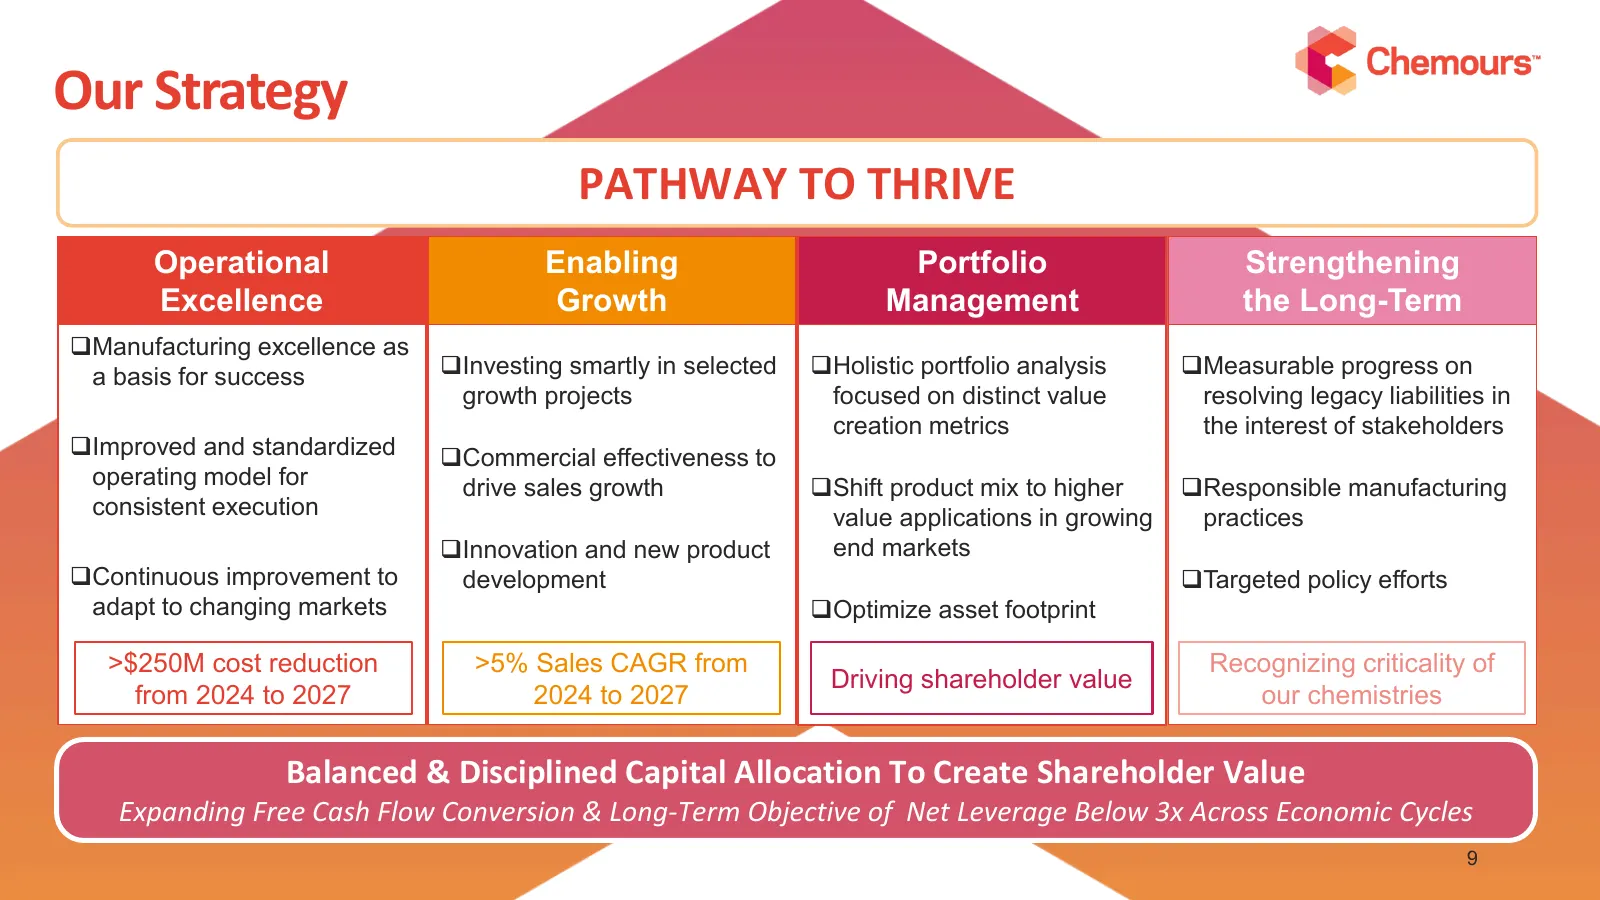
Our Strategy PATHWAY TO THRIVE Operational Enabling Portfolio Strengthening Excellence Growth Management the Long-Term ❑Manufacturing excellence as a basis for success ❑Investing smartly in selected ❑Holistic portfolio analysis ❑Measurable progress on growth projects focused on distinct value resolv
Slide 10: Progress Achieved to Date
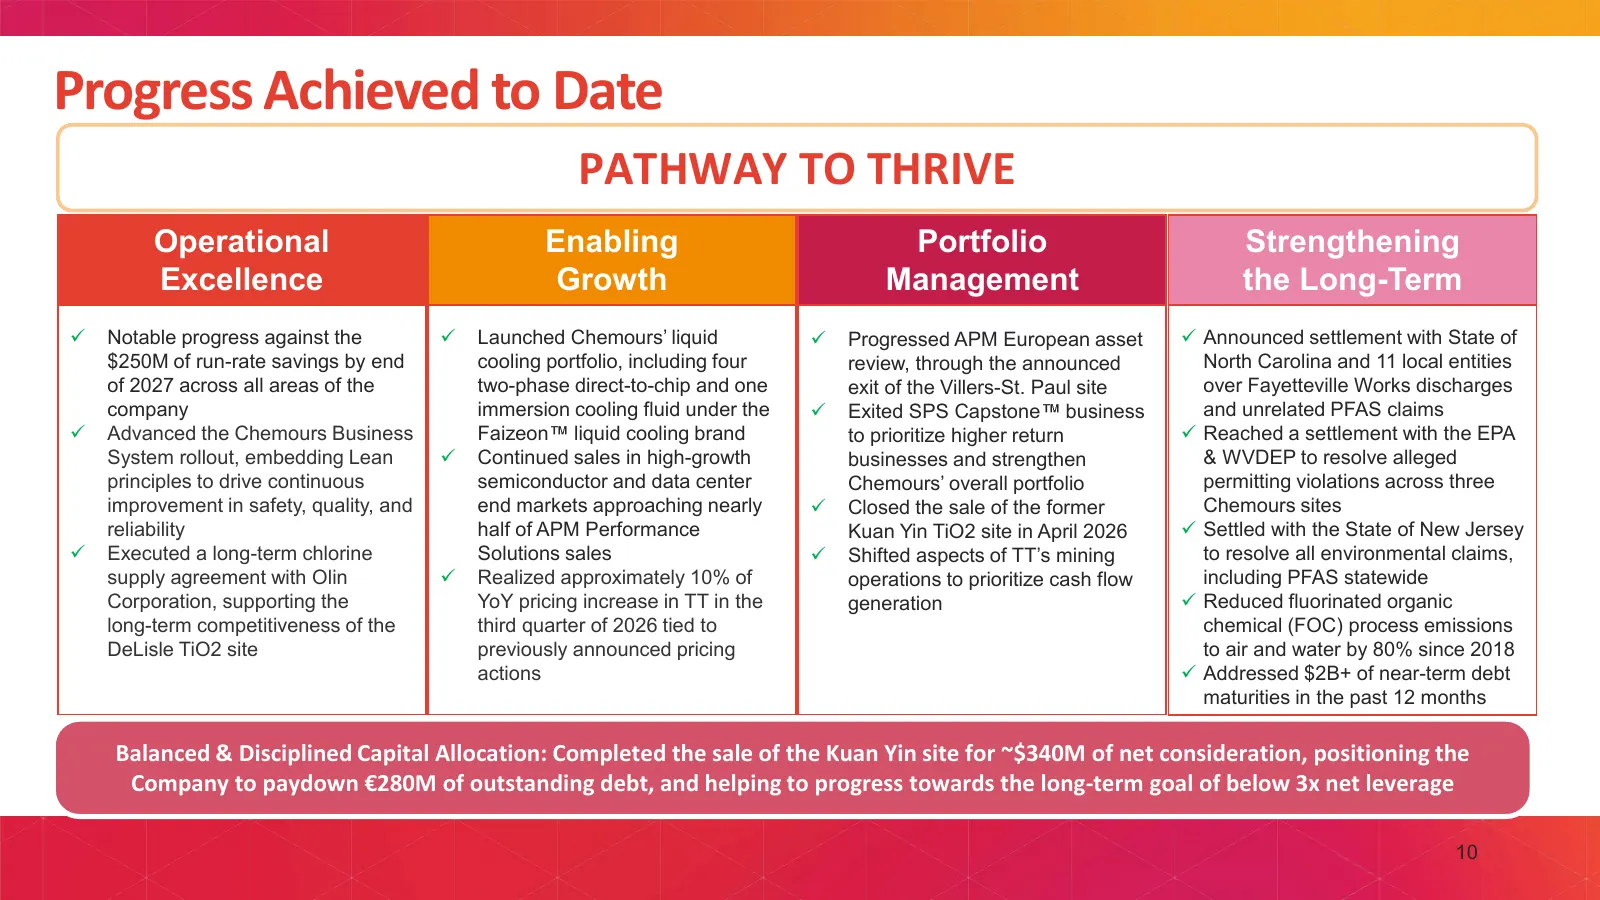
Progress Achieved to Date PATHWAY TO THRIVE Operational Enabling Portfolio Strengthening Excellence Growth Management the Long-Term ✓ Notable progress against the ✓ Launched Chemours’ liquid ✓ Progressed APM European asset ✓ Announced settlement with State of $250M of run-rate savings by end cooling
Slide 11: Introducing: Faizeon
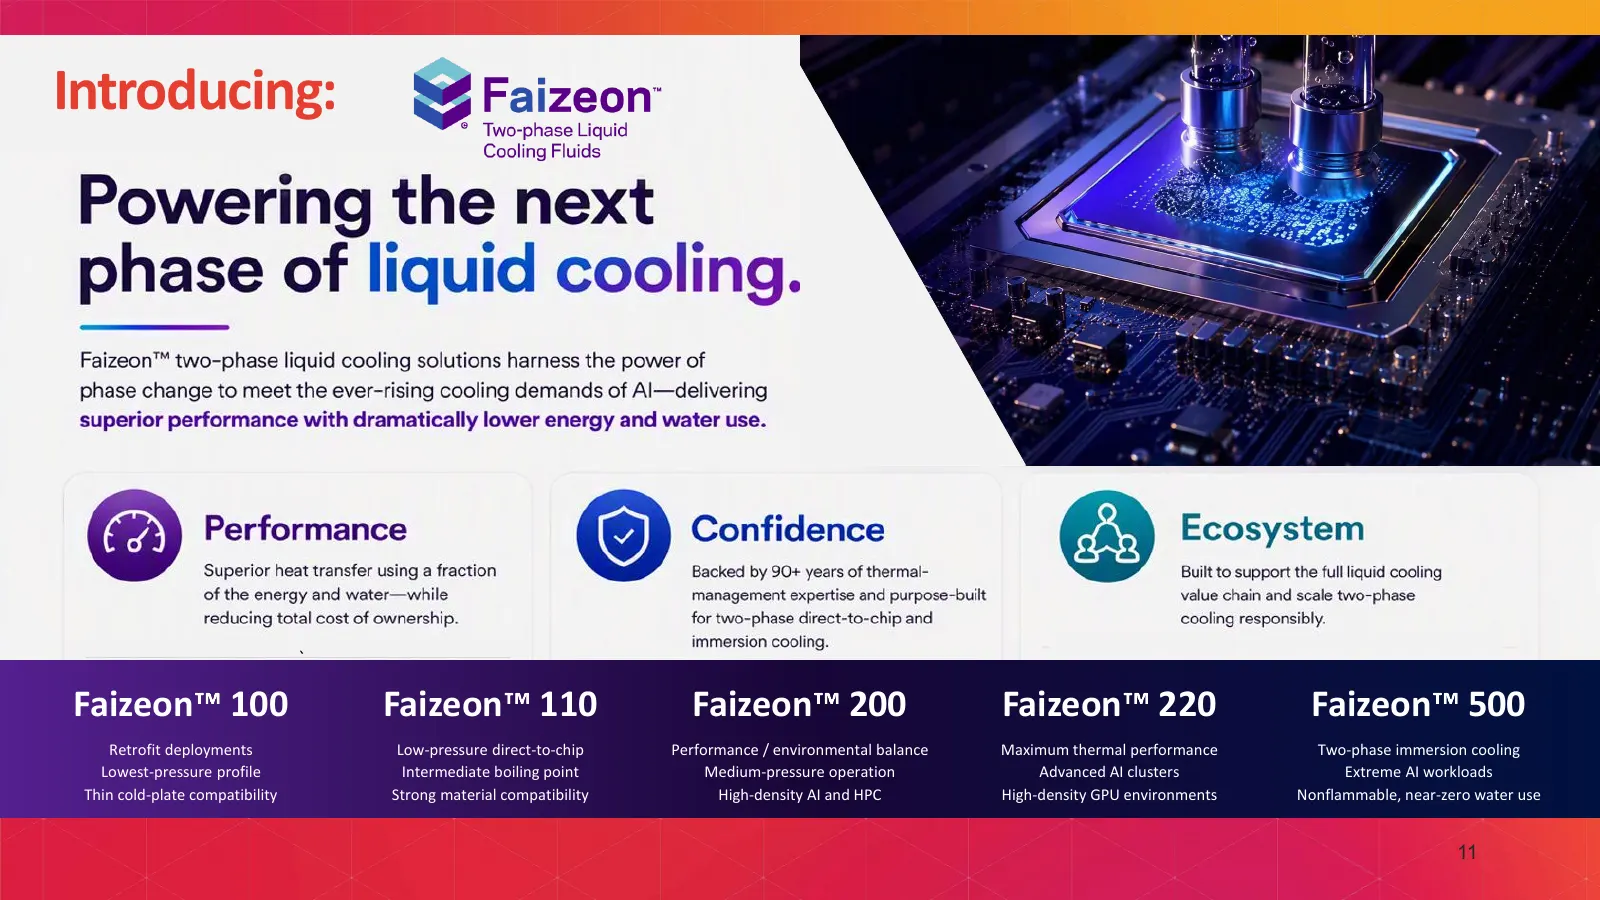
Introducing: ` Faizeon 100 Faizeon 110 Faizeon 200 Faizeon 220 Faizeon 500 Retrofit deployments Low-pressure direct-to-chip Performance / environmental balance Maximum thermal performance Two-phase immersion cooling Lowest-pressure profile Intermediate boiling point Medium-pressure operation Advance
Slide 12: Strengthening the Long-Term: Resolving Legacy Liabilities
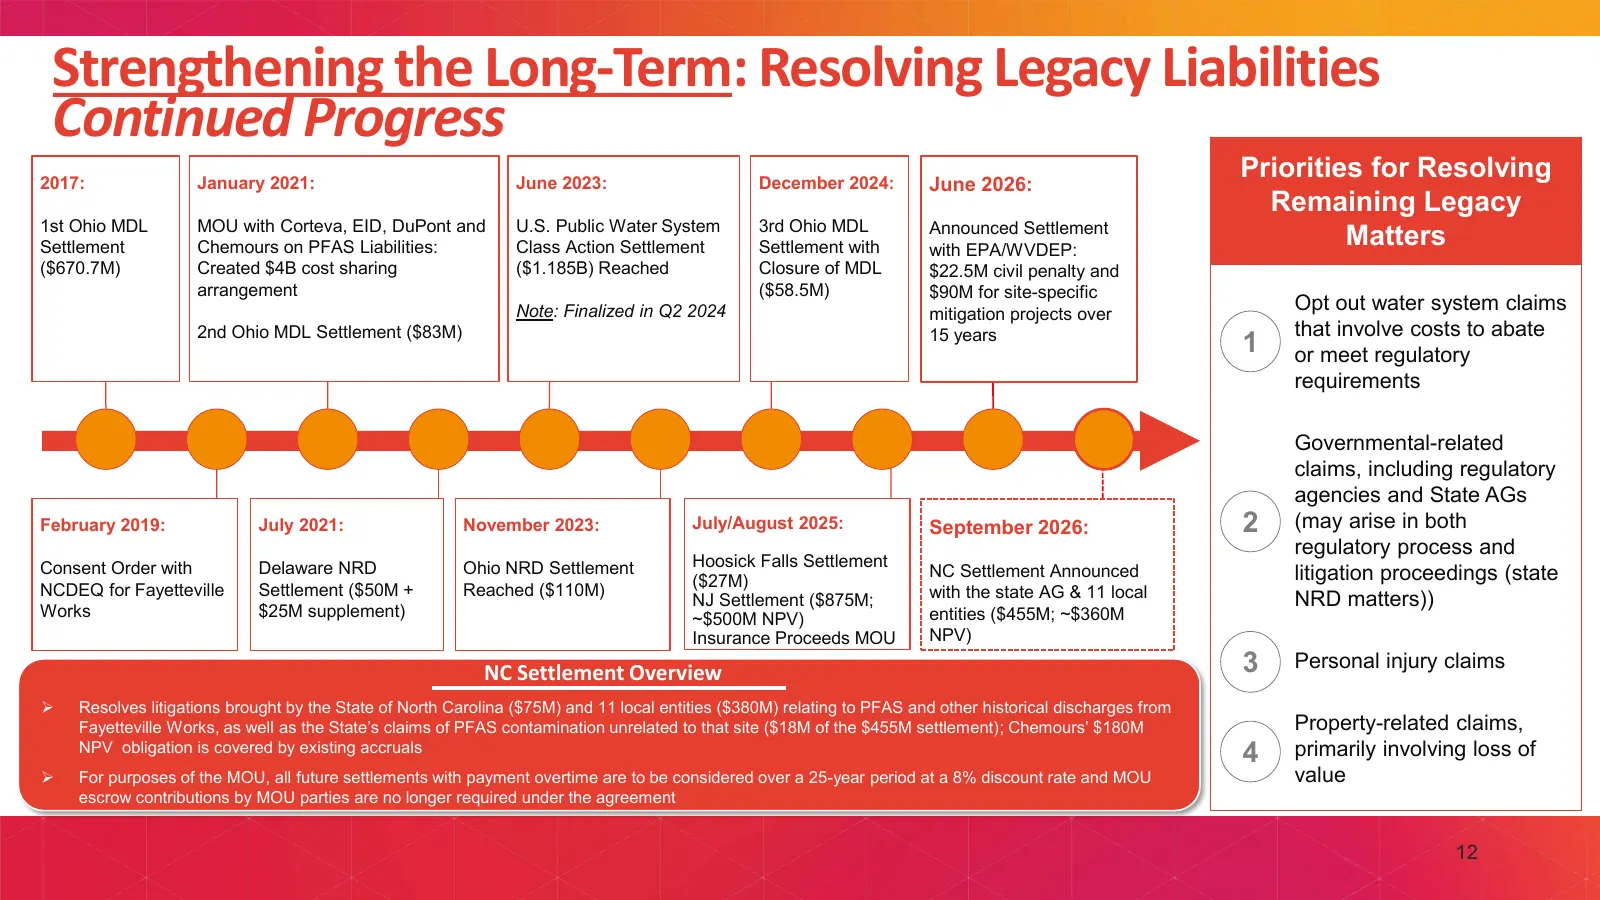
Strengthening the Long-Term: Resolving Legacy Liabilities Continued Progress 2017: January 2021: June 2023: December 2024: June 2026: Priorities for Resolving Remaining Legacy 1st Ohio MDL MOU with Corteva, EID, DuPont and U.S. Public Water System 3rd Ohio MDL Announced Settlement Settlement Chemour
Slide 13: Fourth Quarter Guidance
FOURTH QUARTER GUIDANCE
Slide 14: Fourth Quarter and Full Year 2026 Guidance
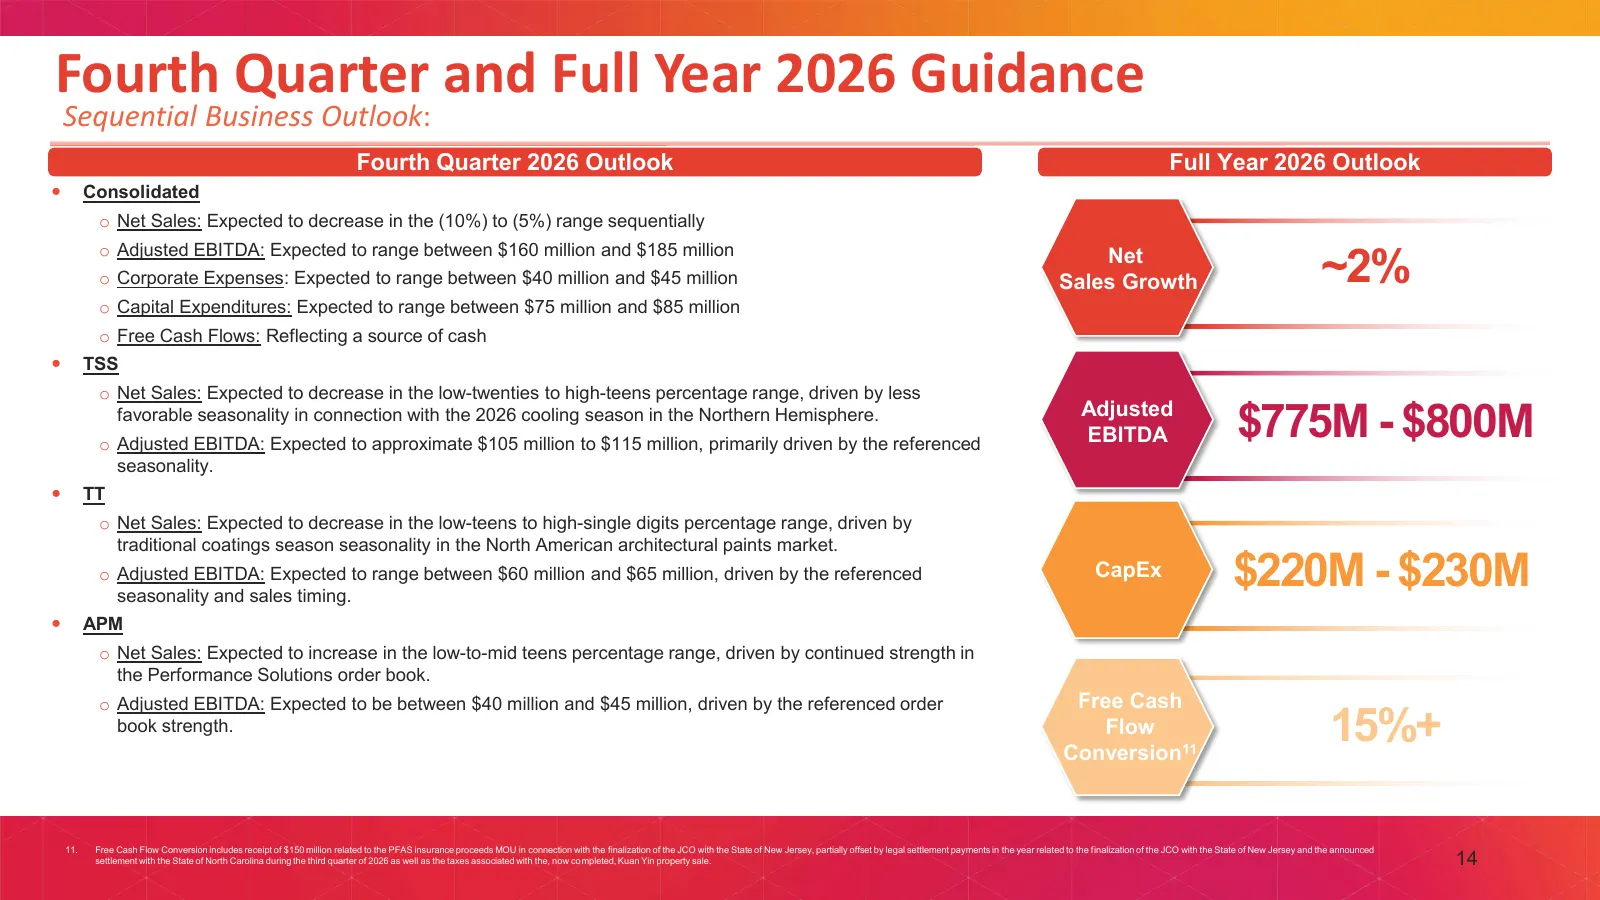
Fourth Quarter and Full Year 2026 Guidance Sequential Business Outlook: Fourth Quarter 2026 Outlook Full Year 2026 Outlook Consolidated o Net Sales: Expected to decrease in the (10%) to (5%) range sequentially o Adjusted EBITDA: Expected to range between $160 million and $185 million o Corporate E
Slide 15: Appendix
APPENDIX 15
Slide 16: TSS Segment Net Sales and Adjusted EBITDA
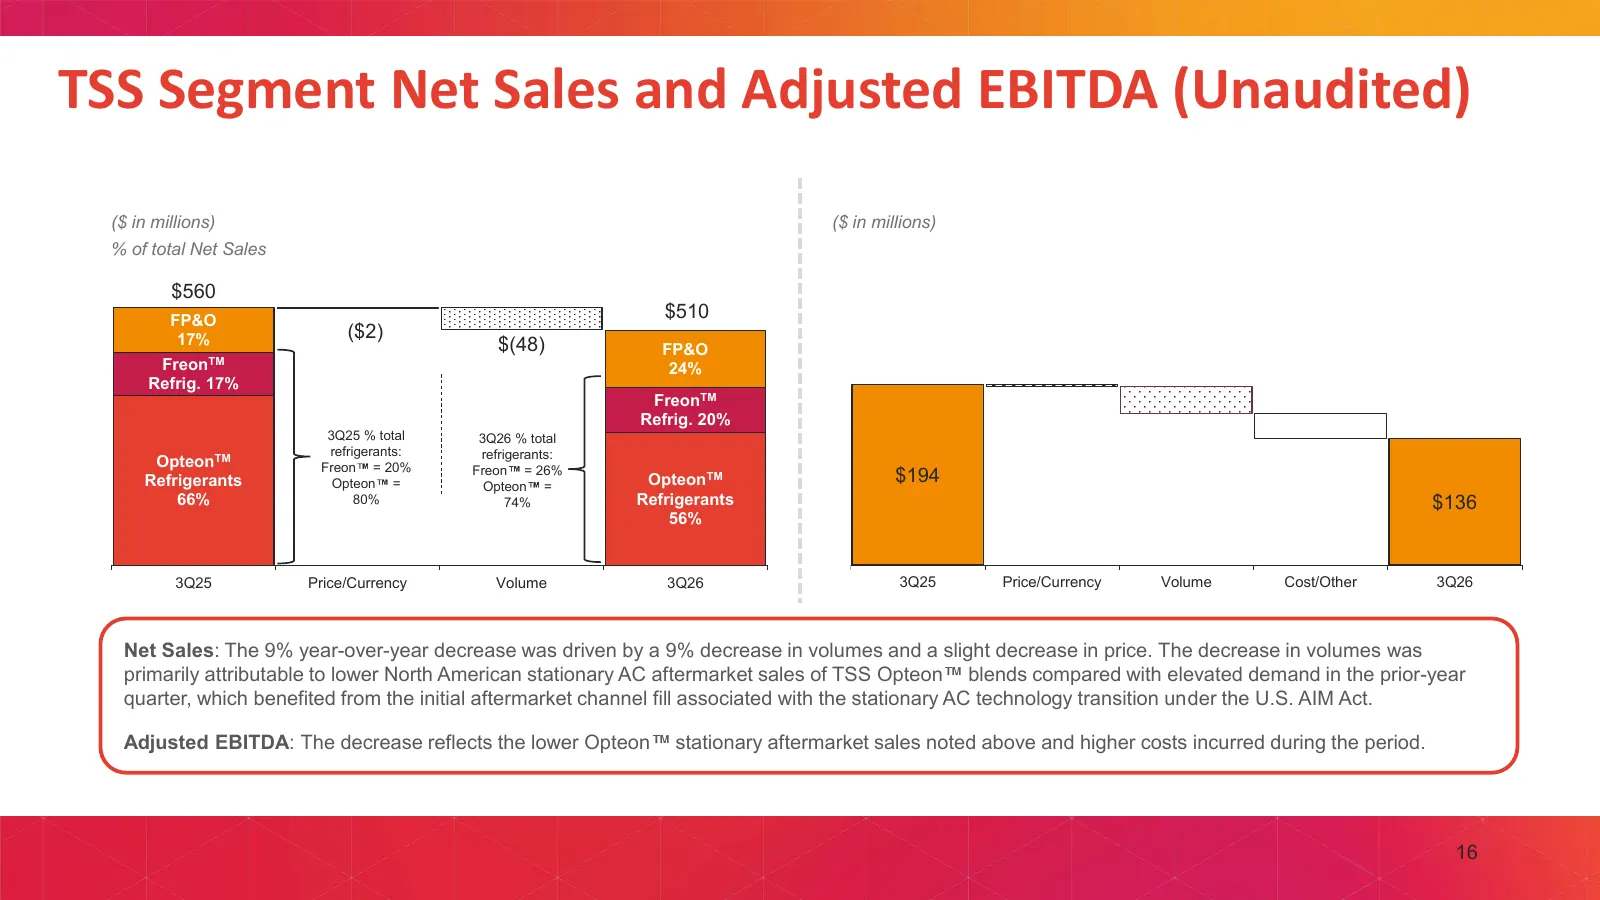
TSS Segment Net Sales and Adjusted EBITDA (Unaudited) ($ in millions) ($ in millions) % of total Net Sales $560 FP&O $510 17% ($2) $(48) FP&O FreonTM 24% Refrig. 17% FreonTM Refrig. 20% 3Q25 % total 3Q26 % total refrigerants: refrigerants: OpteonTM Freon = 20% Freon = 26% Refrigerants Opteon = Opteo
Slide 17: TT Segment Net Sales and Adjusted EBITDA
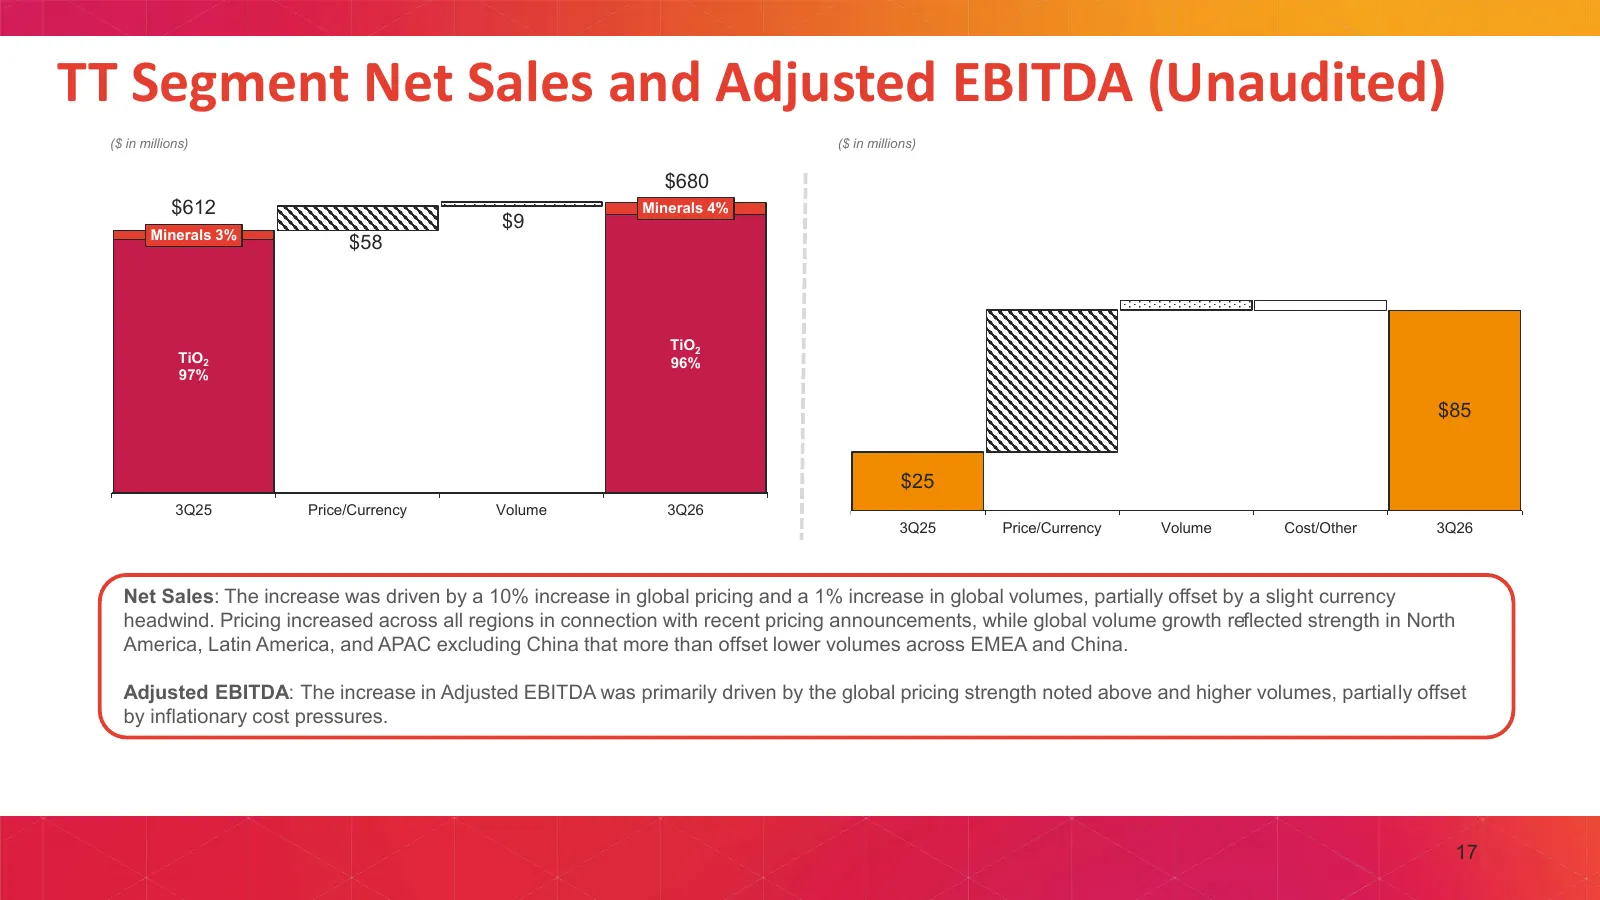
TT Segment Net Sales and Adjusted EBITDA (Unaudited) ($ in millions) ($ in millions) $680 $612 Minerals 4% $9 Minerals 3% $58 TiO2 TiO2 96% 97% $85 $25 3Q25 Price/Currency Volume 3Q26 3Q25 Price/Currency Volume Cost/Other 3Q26 Net Sales: The increase was driven by a 10% increase in global pricing an
Slide 18: APM Segment Net Sales and Adjusted EBITDA
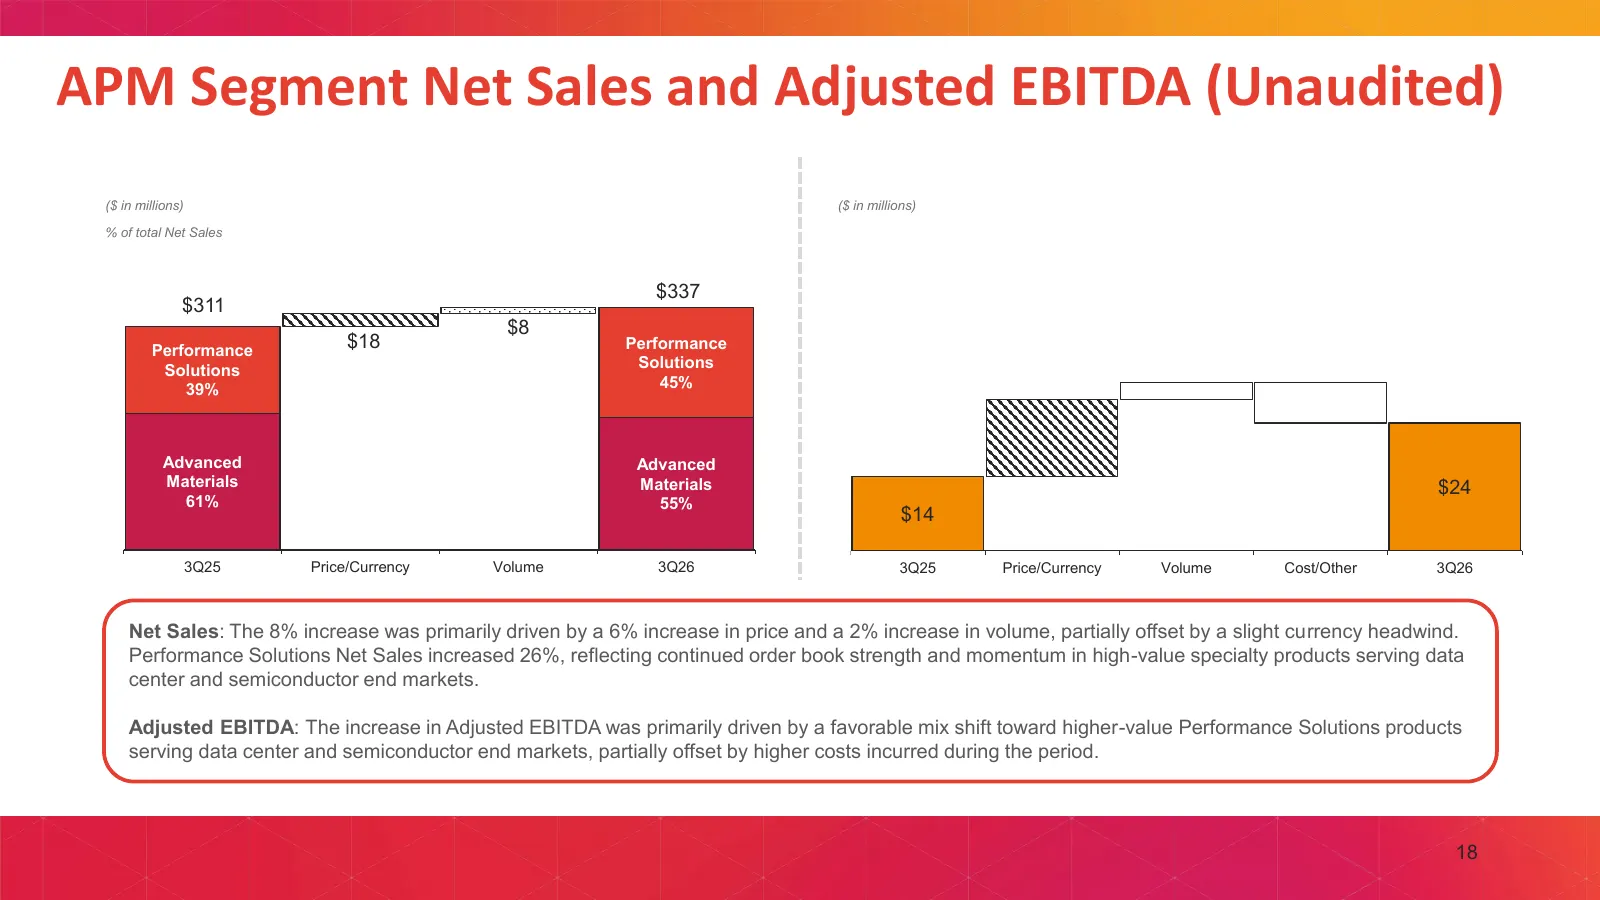
APM Segment Net Sales and Adjusted EBITDA (Unaudited) ($ in millions) ($ in millions) % of total Net Sales $337 $311 $8 Performance $18 Performance Solutions Solutions 39% 45% Advanced Advanced Materials Materials $24 61% 55% $14 3Q25 Price/Currency Volume 3Q26 3Q25 Price/Currency Volume Cost/Other
Slide 19: Segment Net Sales
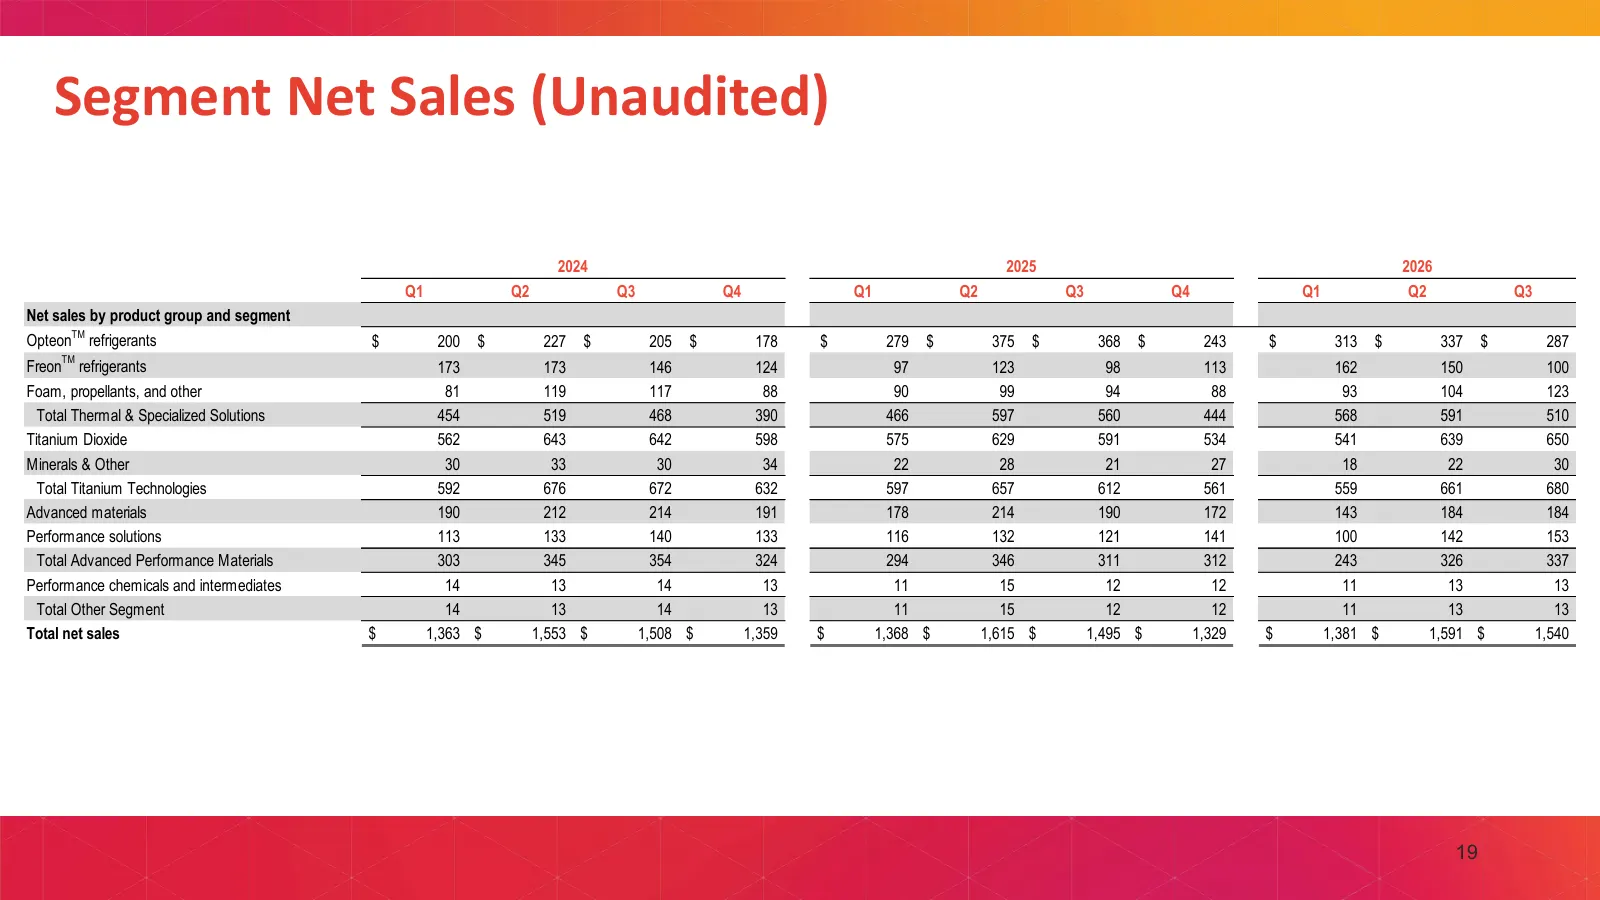
Segment Net Sales (Unaudited) 2024 2025 2026 Q1 Q2 Q3 Q4 Q1 Q2 Q3 Q4 Q1 Q2 Q3 Net sales by product group and segment TM Opteon refrigerants $ 200 $ 227 $ 205 $ 178 $ 279 $ 375 $ 368 $ 243 $ 313 $ 337 $ 287 TM Freon refrigerants 173 173 146 124 97 123 98 113 162 150 100 Foam, propellants, and other 8
Slide 20: Segment Net Sales by Region
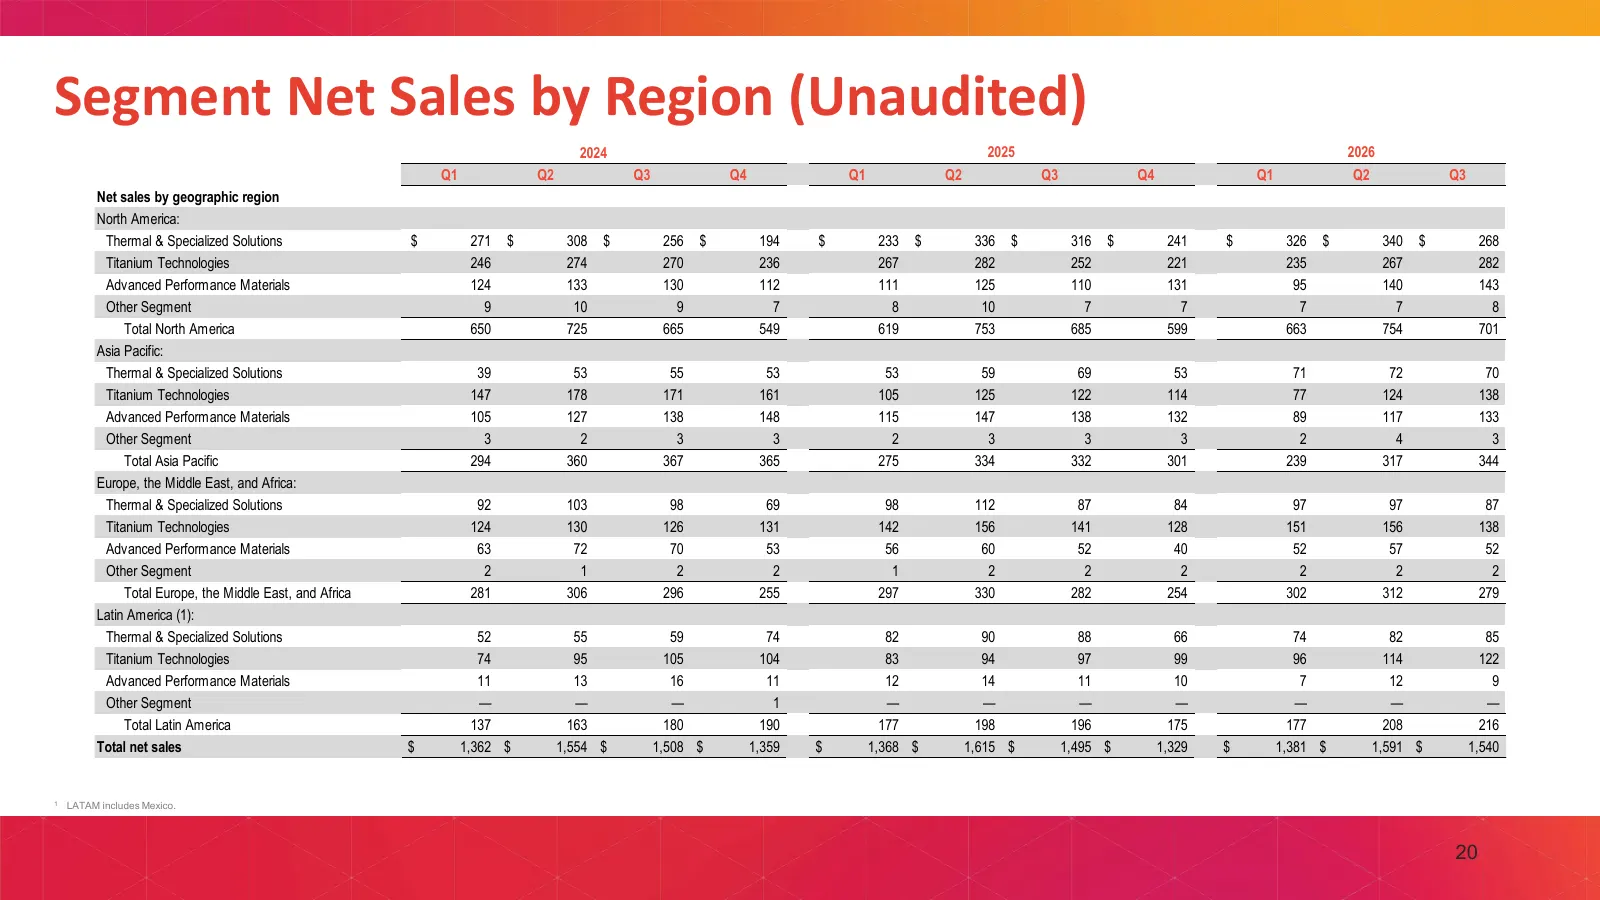
Segment Net Sales by Region (Unaudited) 2024 2025 2026 Q1 Q2 Q3 Q4 Q1 Q2 Q3 Q4 Q1 Q2 Q3 Net sales by geographic region North America: Thermal & Specialized Solutions $ 271 $ 308 $ 256 $ 194 $ 233 $ 336 $ 316 $ 241 $ 326 $ 340 $ 268 Titanium Technologies 246 274 270 236 267 282 252 221 235 267 282 Ad
Slide 21: Segment Net Sales & Adjusted EBITDA
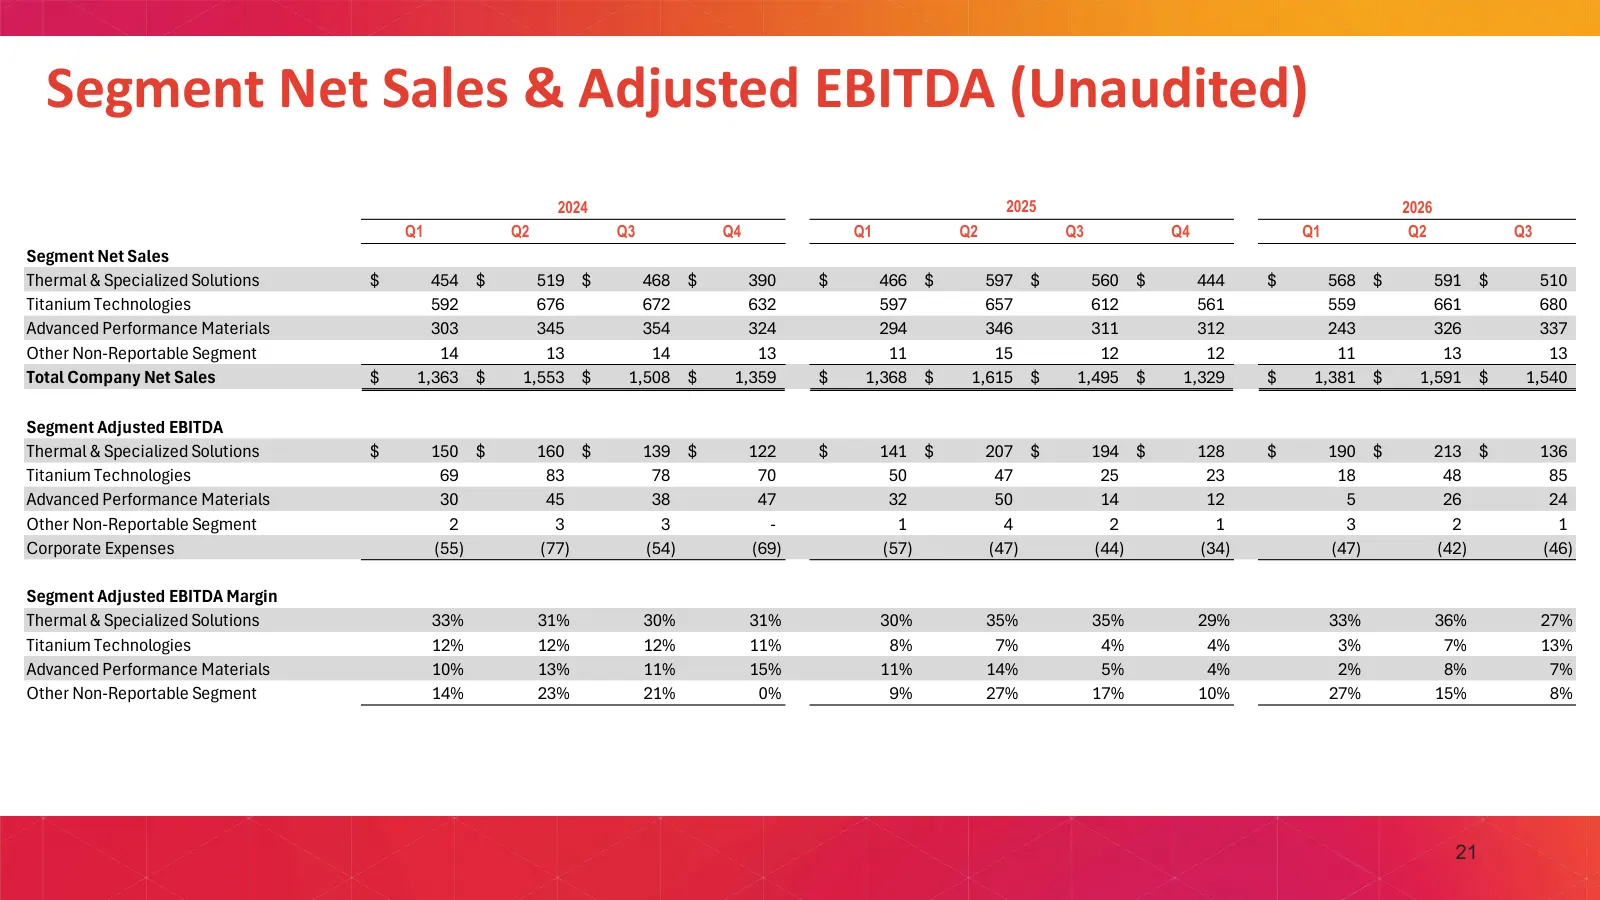
Segment Net Sales & Adjusted EBITDA (Unaudited) 2024 2025 2026 Q1 Q2 Q3 Q4 Q1 Q2 Q3 Q4 Q1 Q2 Q3 Segment Net Sales Thermal & Specialized Solutions $ 454 $ 519 $ 468 $ 390 $ 466 $ 597 $ 560 $ 444 $ 568 $ 591 $ 510 Titanium Technologies 592 676 672 632 597 657 612 561 559 661 680 Advanced Performance M
Slide 22: GAAP Net Income to Adjusted Net Income and Adjusted EBITDA Reconciliation
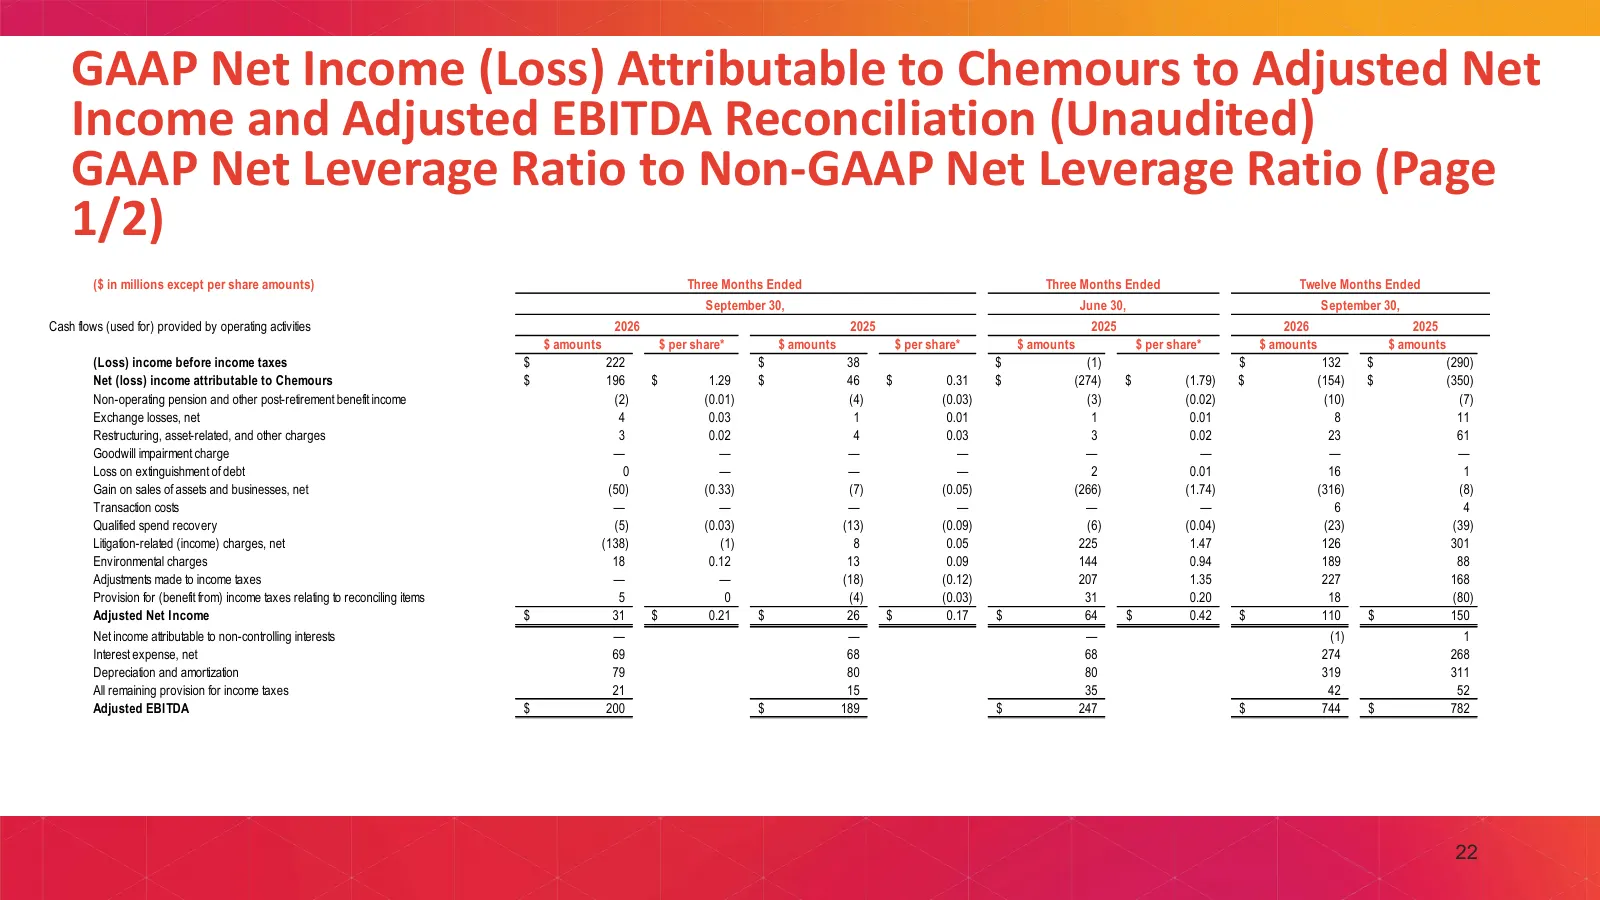
GAAP Net Income (Loss) Attributable to Chemours to Adjusted Net Income and Adjusted EBITDA Reconciliation (Unaudited) GAAP Net Leverage Ratio to Non-GAAP Net Leverage Ratio (Page 1/2) ($ in millions except per share amounts) Three Months Ended Three Months Ended Twelve Months Ended September 30, Jun
Slide 23: GAAP Net Income to Adjusted Net Income and Adjusted EBITDA Reconciliation (2/2)
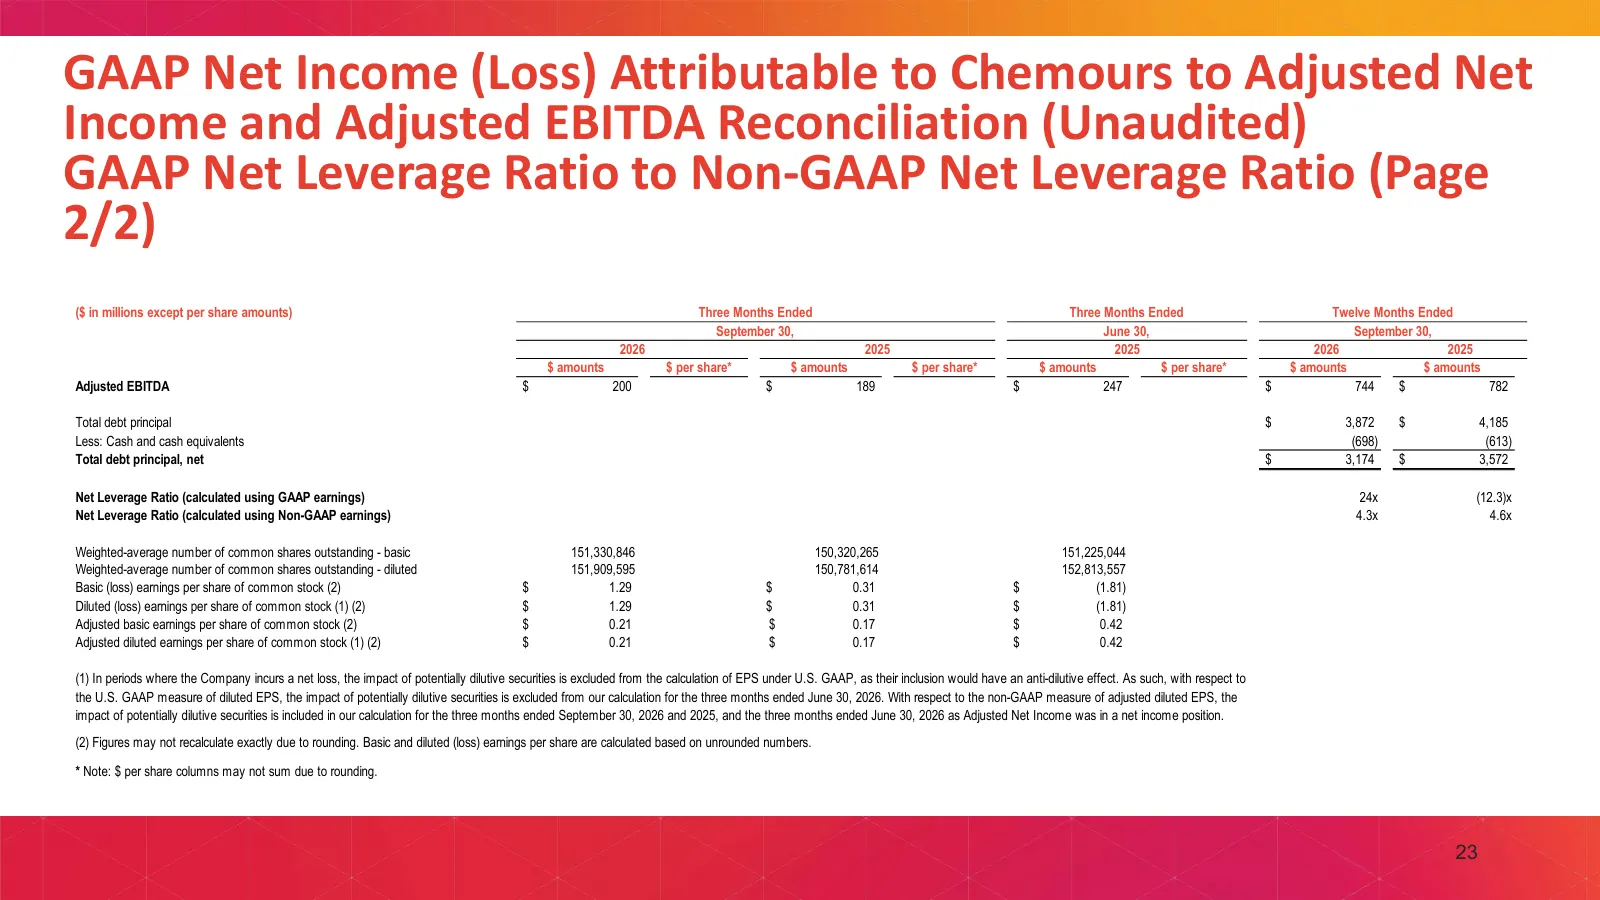
GAAP Net Income (Loss) Attributable to Chemours to Adjusted Net Income and Adjusted EBITDA Reconciliation (Unaudited) GAAP Net Leverage Ratio to Non-GAAP Net Leverage Ratio (Page 2/2) ($ in millions except per share amounts) Three Months Ended Three Months Ended Twelve Months Ended September 30, Jun
Slide 24: Operating Cash Flow to Free Cash Flows Reconciliation
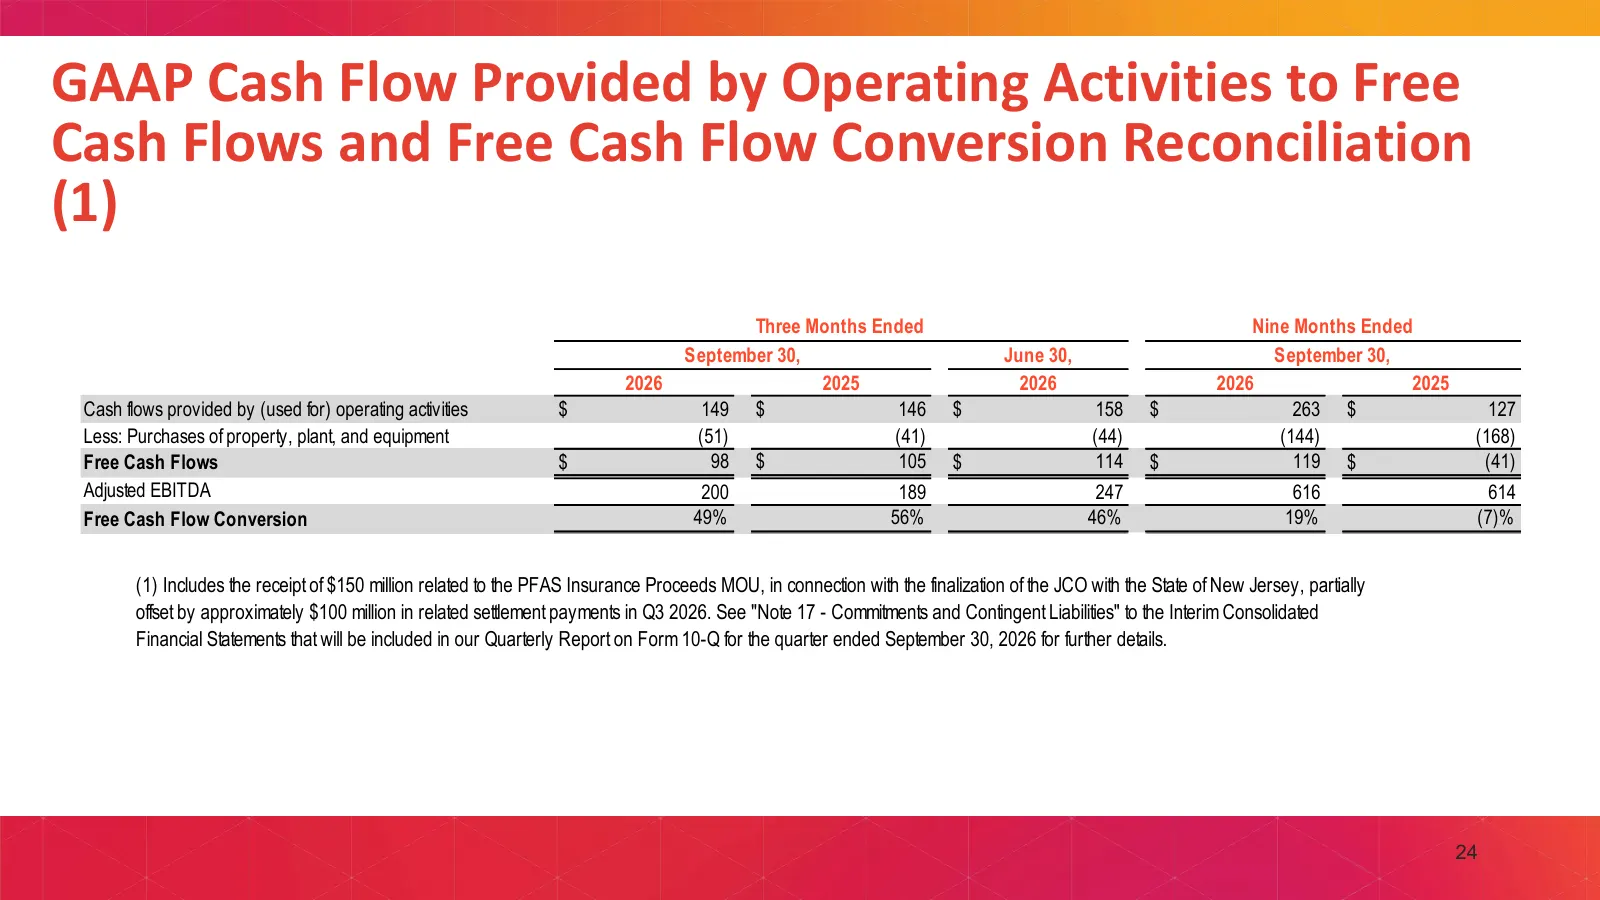
GAAP Cash Flow Provided by Operating Activities to Free Cash Flows and Free Cash Flow Conversion Reconciliation (1) Three Months Ended Nine Months Ended September 30, June 30, September 30, 2026 2025 2026 2026 2025 Cash flows provided by (used for) operating activities $ 149 $ 146 $ 158 $ 263 $ 127
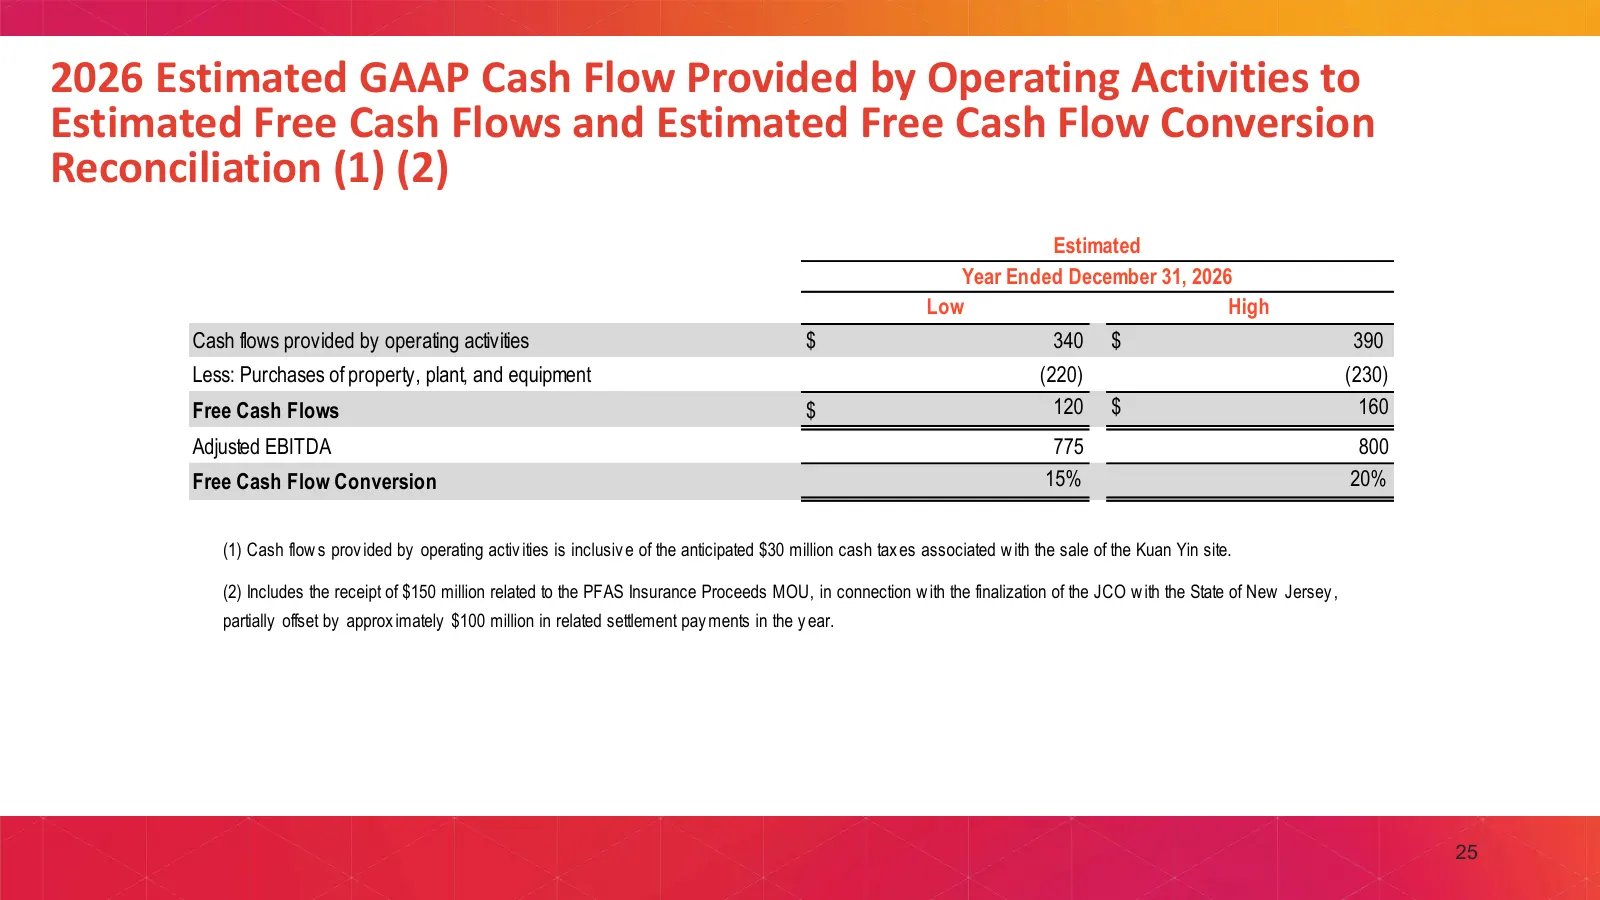
Slide 25: 2026 Estimated Operating Cash Flow to Free Cash Flows
2026 Estimated GAAP Cash Flow Provided by Operating Activities to Estimated Free Cash Flows and Estimated Free Cash Flow Conversion Reconciliation (1) (2) Estimated Year Ended December 31, 2026 Low High Cash flows provided by operating activities $ 340 $ 390 Less: Purchases of property, plant, and e
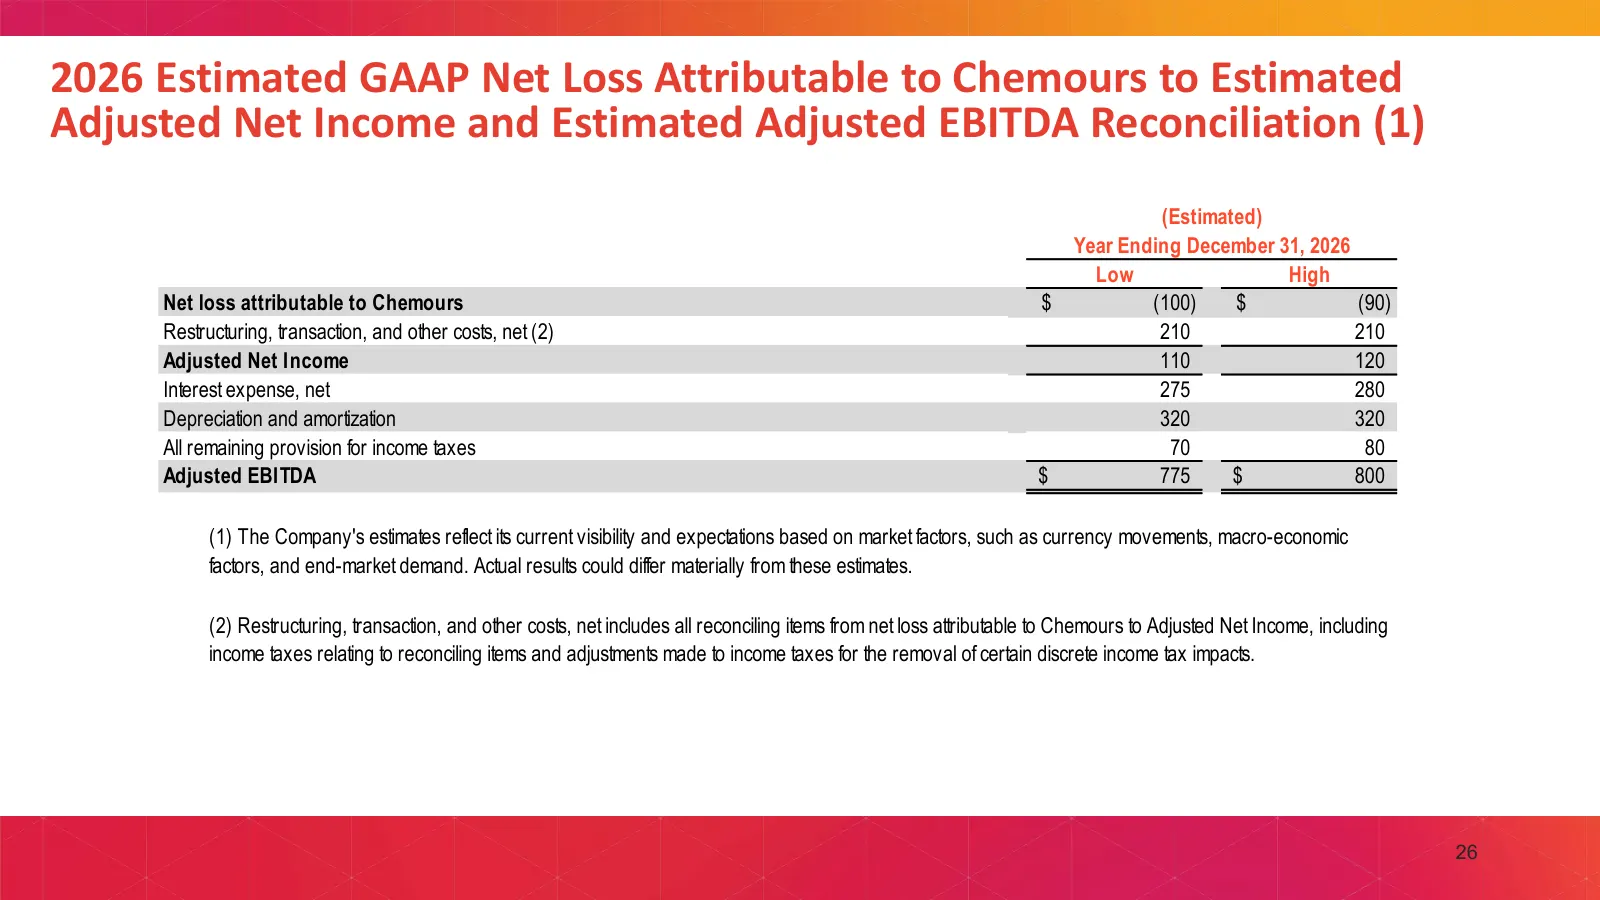
Slide 26: 2026 Estimated Net Loss to Adjusted Net Income and Adjusted EBITDA
2026 Estimated GAAP Net Loss Attributable to Chemours to Estimated Adjusted Net Income and Estimated Adjusted EBITDA Reconciliation (1) (Estimated) Year Ending December 31, 2026 Low High Net loss attributable to Chemours $ (100) $ (90) Restructuring, transaction, and other costs, net (2) 210 210 Adj
Slide 27: 2026 Chemours. All Rights Reserved
® 2026 CHEMOURS. ALL RIGHTS RESERVED
Source: 6ix earnings call
More decks from Chemours Company (the)
 Investor Presentation (September 2026)34 slides · Sep 9, 2026
 The Chemours Company — Investor Presentation (September 2026)34 slides · September 2026
 The Chemours Company — Q2 2026 Earnings Presentation26 slides · Aug 5, 2026
 Q1 2026 Earnings Presentation24 slides · May 6, 2026
 The Chemours Company — Technical Presentation (April 2026)54 slides · Apr 13, 2026
 The Chemours Company — Investor Presentation (March 2026)27 slides · March 2026