Ambuja Cements Limited · NSE:AMBUJACEM
Ambuja Cements — Investor Presentation (June 2017)
18 slides from Ambuja Cements's investor presentation, Jun 27, 2017
Slide 1: Ambuja Cement filing letter to stock exchanges
Ambuja Cement ACL:SEC: The Secretary Bombay Stock Exchange Limited Phiroz Jeejeebhoy Towers, Dalal Street, Mumbai - 400 023 BSE Scrip Code: 500425 Deutsche Bank Trust Company Americas Winchester House 1 Great Winchester Street London EC2N 2DB Ctas Documents <ctas.documents@db.com. Dear Sir, June 27,
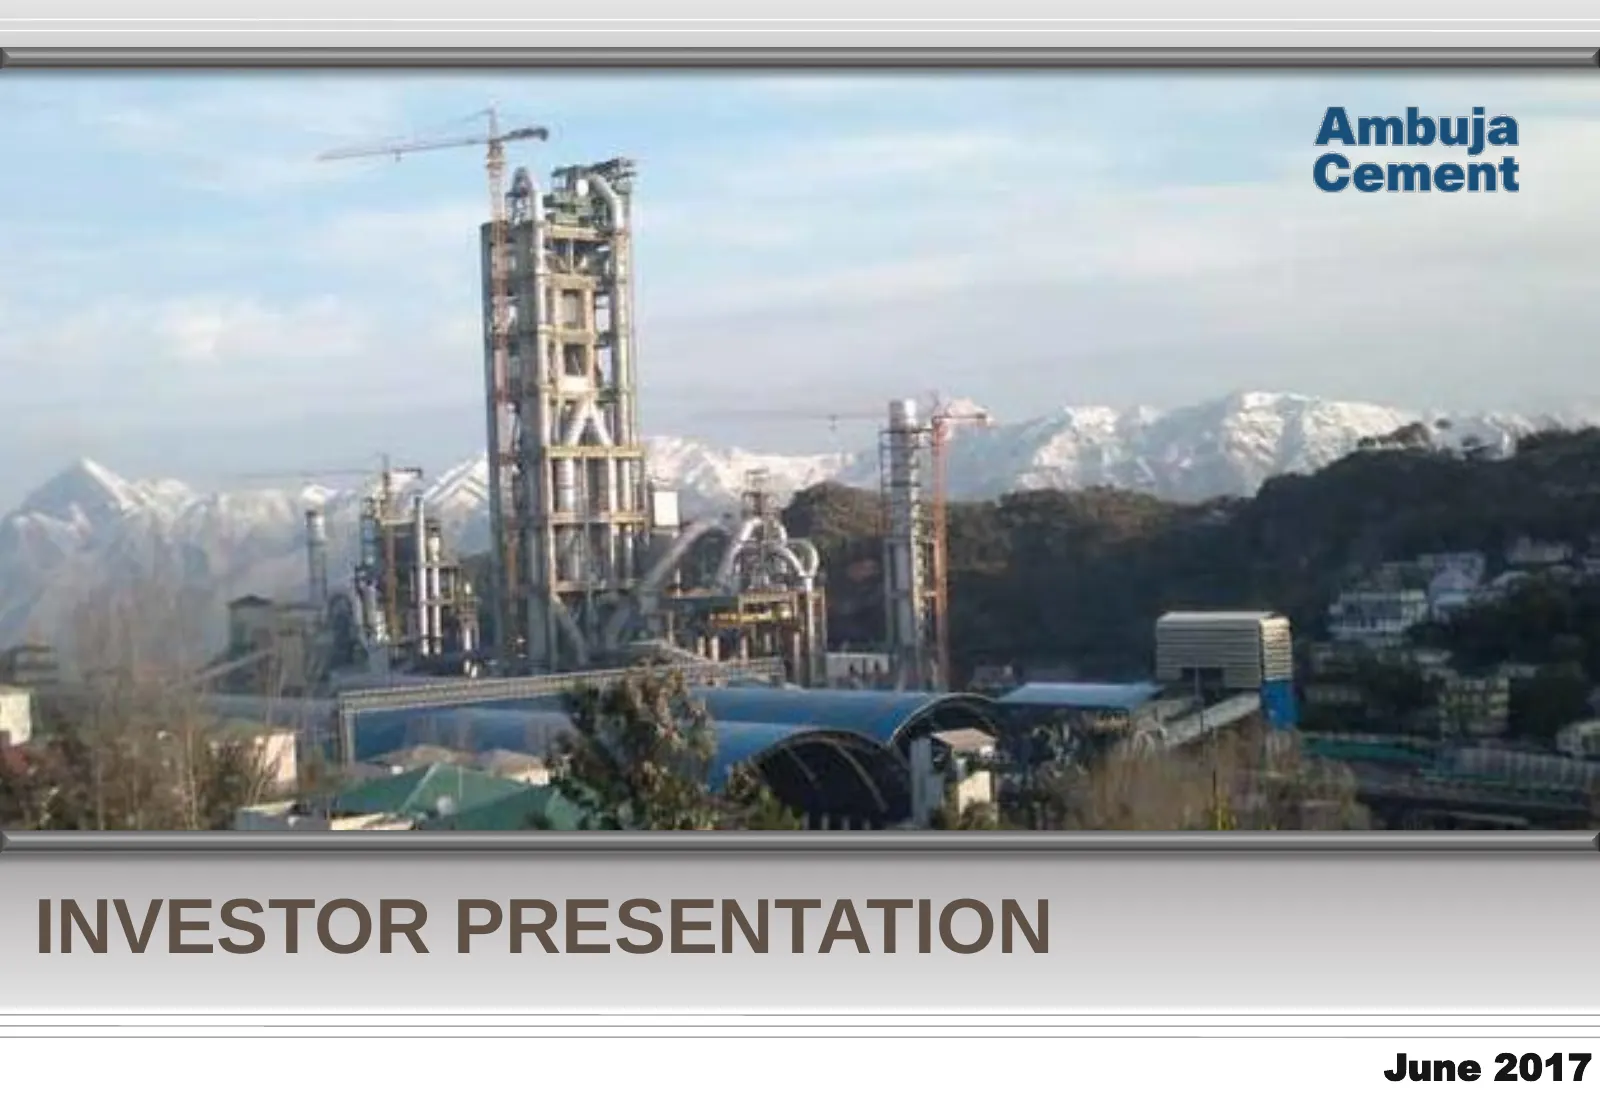
Slide 2: Investor Presentation June 2017
INVESTOR PRESENTATION June 2017
Slide 3: Disclaimer / Safe Harbor
Disclaimer / Safe Harbor Cautionary statement regarding forward-looking statements This presentation may contain certain forward-looking statements relating to Ambuja Cements Ltd. (“Ambuja”, or “Company”) and its future business, development and economic performance. These statements include descrip
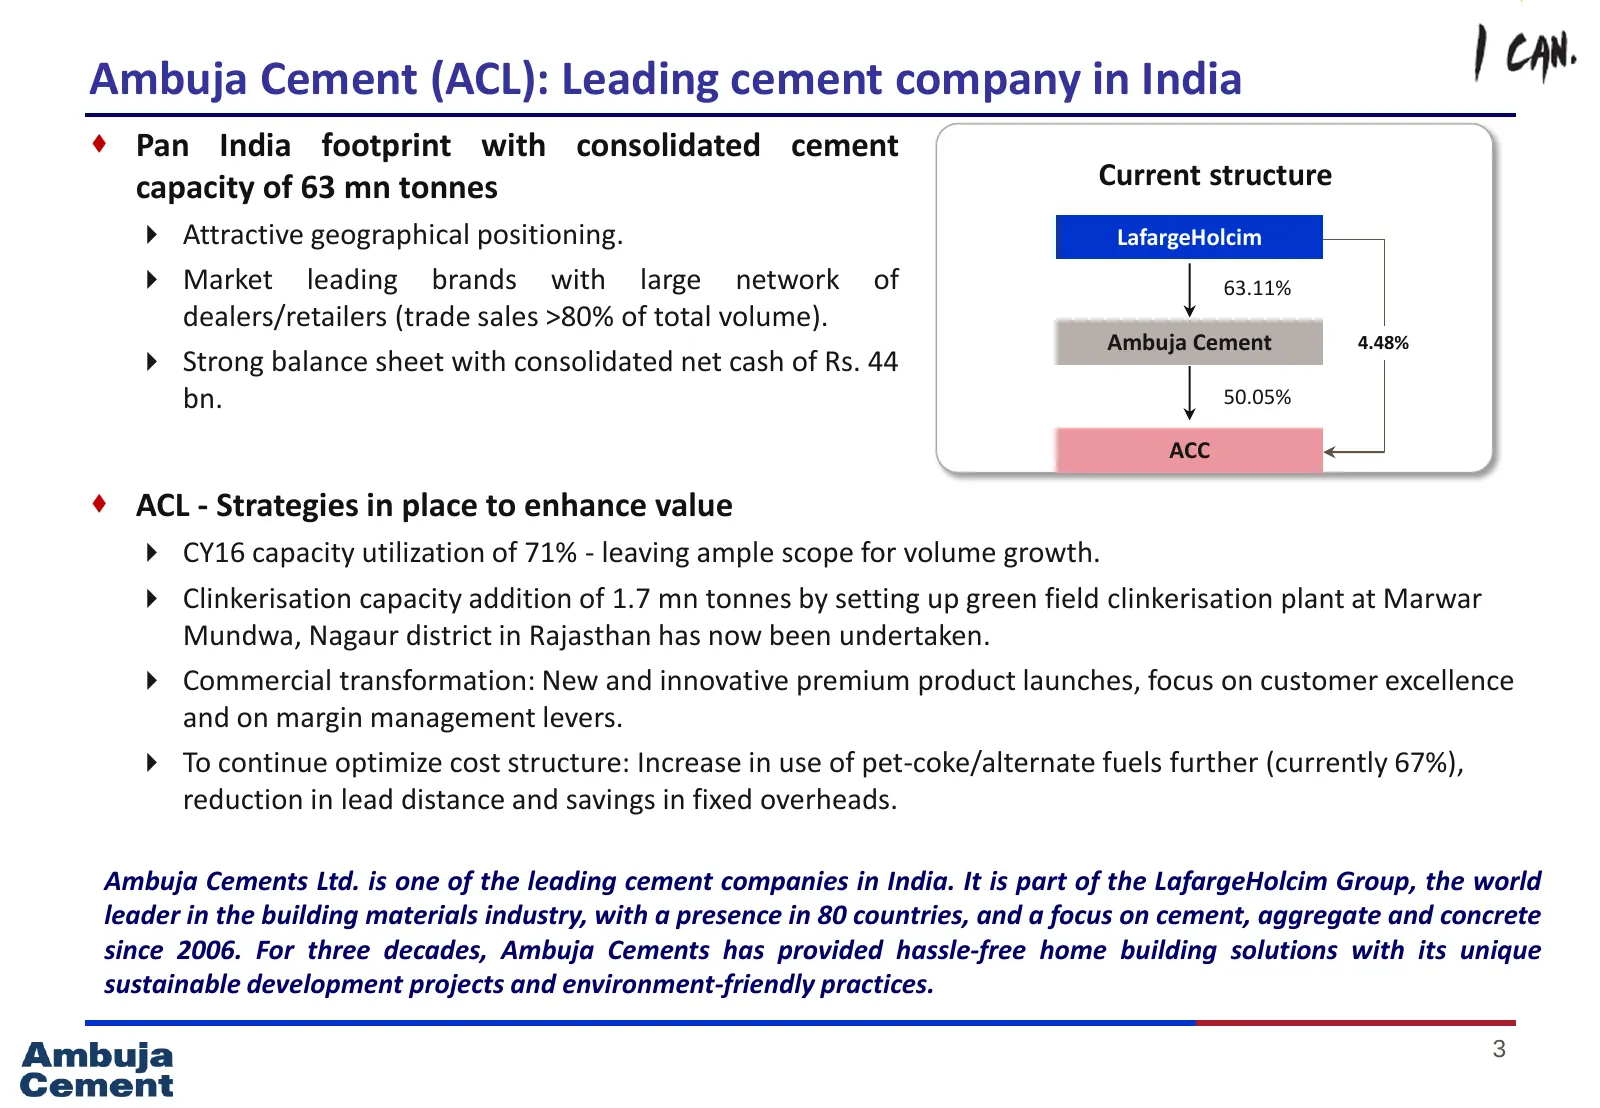
Slide 4: Ambuja Cement (ACL): Leading cement company in India
Ambuja Cement (ACL): Leading cement company in India Pan India footprint with consolidated cement capacity of 63 mn tonnes Current structure Attractive geographical positioning. LafargeHolcim Market leading brands with large network of 63.11% dealers/retailers (trade sales >80% of total volume
Slide 5: ACL – Standalone Asset Footprint
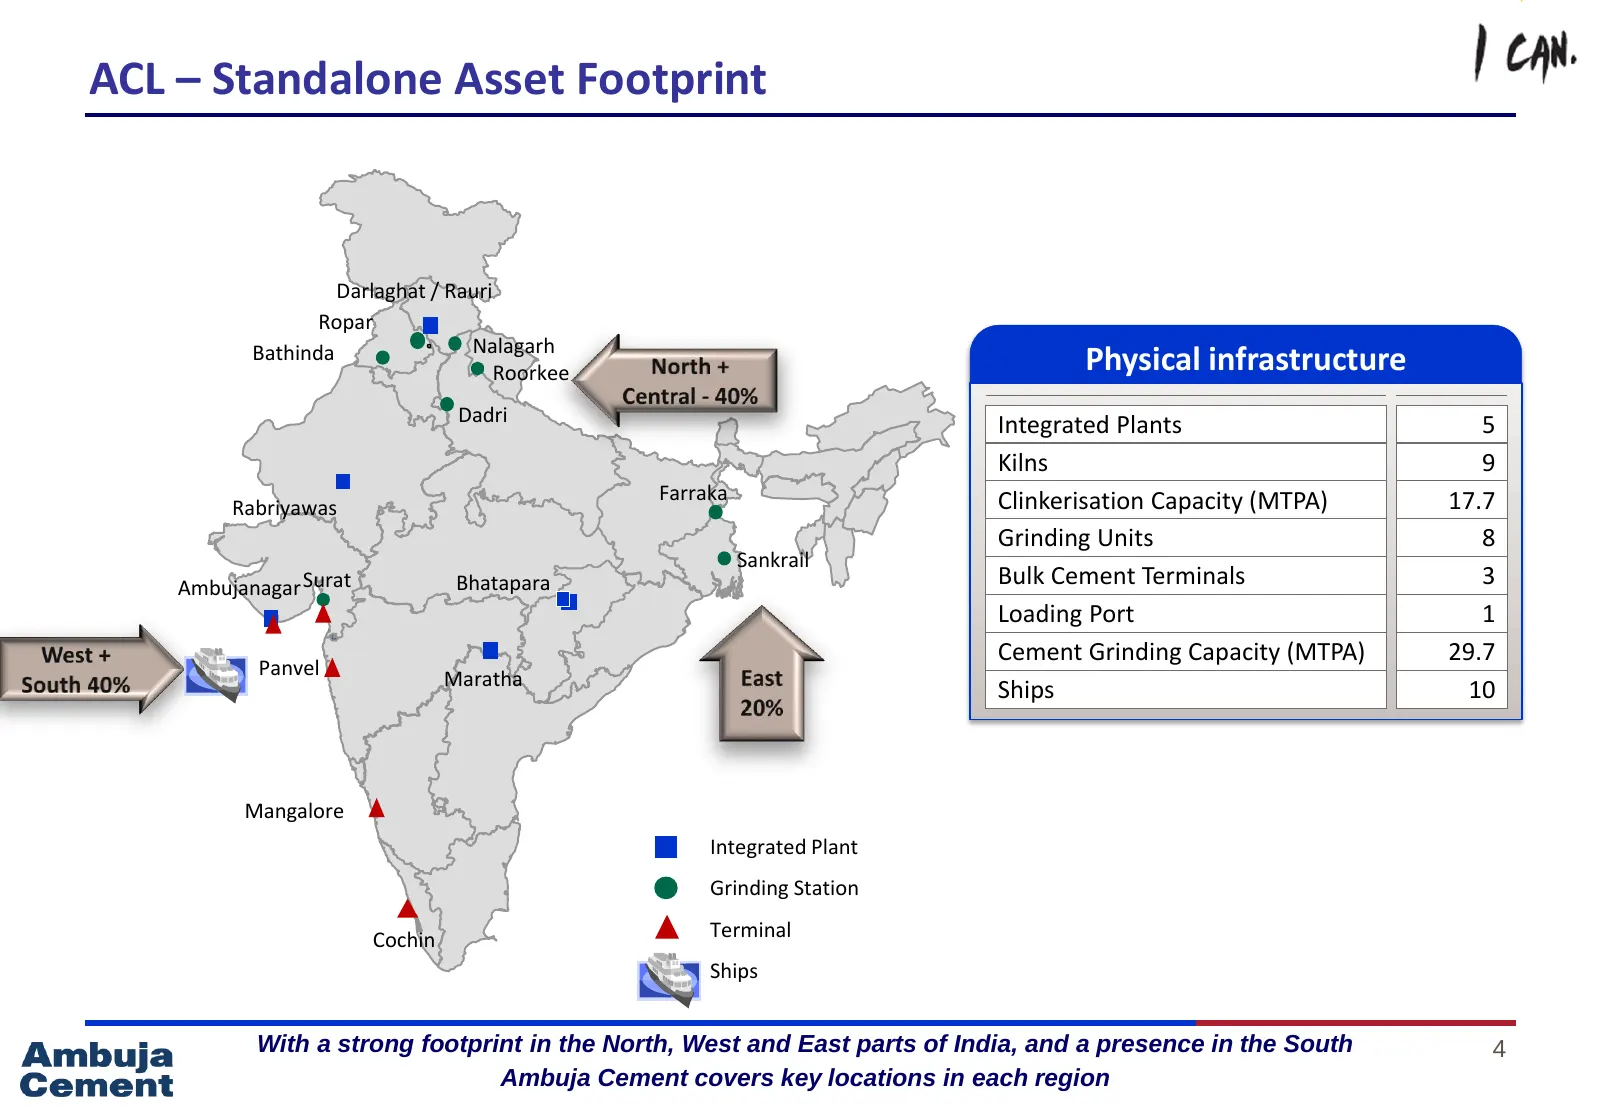
ACL – Standalone Asset Footprint Darlaghat / Rauri Ropar Bathinda Ro Nalagarh Bat pa Roorkee Physical infrastructure hindr a Dadri Integrated Plants 5 Tik Kilns 9 P Lak Farraka Rabriyawas a ari Clinkerisation Capacity (MTPA) 17.7 her li i Ky a Grinding Units 8 mo Sankrail Ambujanagar Surat Bhatapara
Slide 6: India – Macroeconomic context
India – Macroeconomic context India on the growth path trajectory India growth story continues - GDP : $2.1 trillion; Annual GDP growth: > 7% India is currently 7th largest country in terms of GDP (nominal value) & 3rd largest GDP in terms of PPP (purchasing power parity). The long-term grow
Slide 7: Demand drivers for cement industry
Demand drivers for cement industry Government capex : PMAY to achieve housing for all by the year 2022, 20 mn in Urban and 30 mn houses in Rural areas AMRUT to ensure that every household has access to a tap with assured supply of water and a sewerage connection; (ii) increase the amenity valu
Slide 8: Cement industry – Demand / Supply Scenario
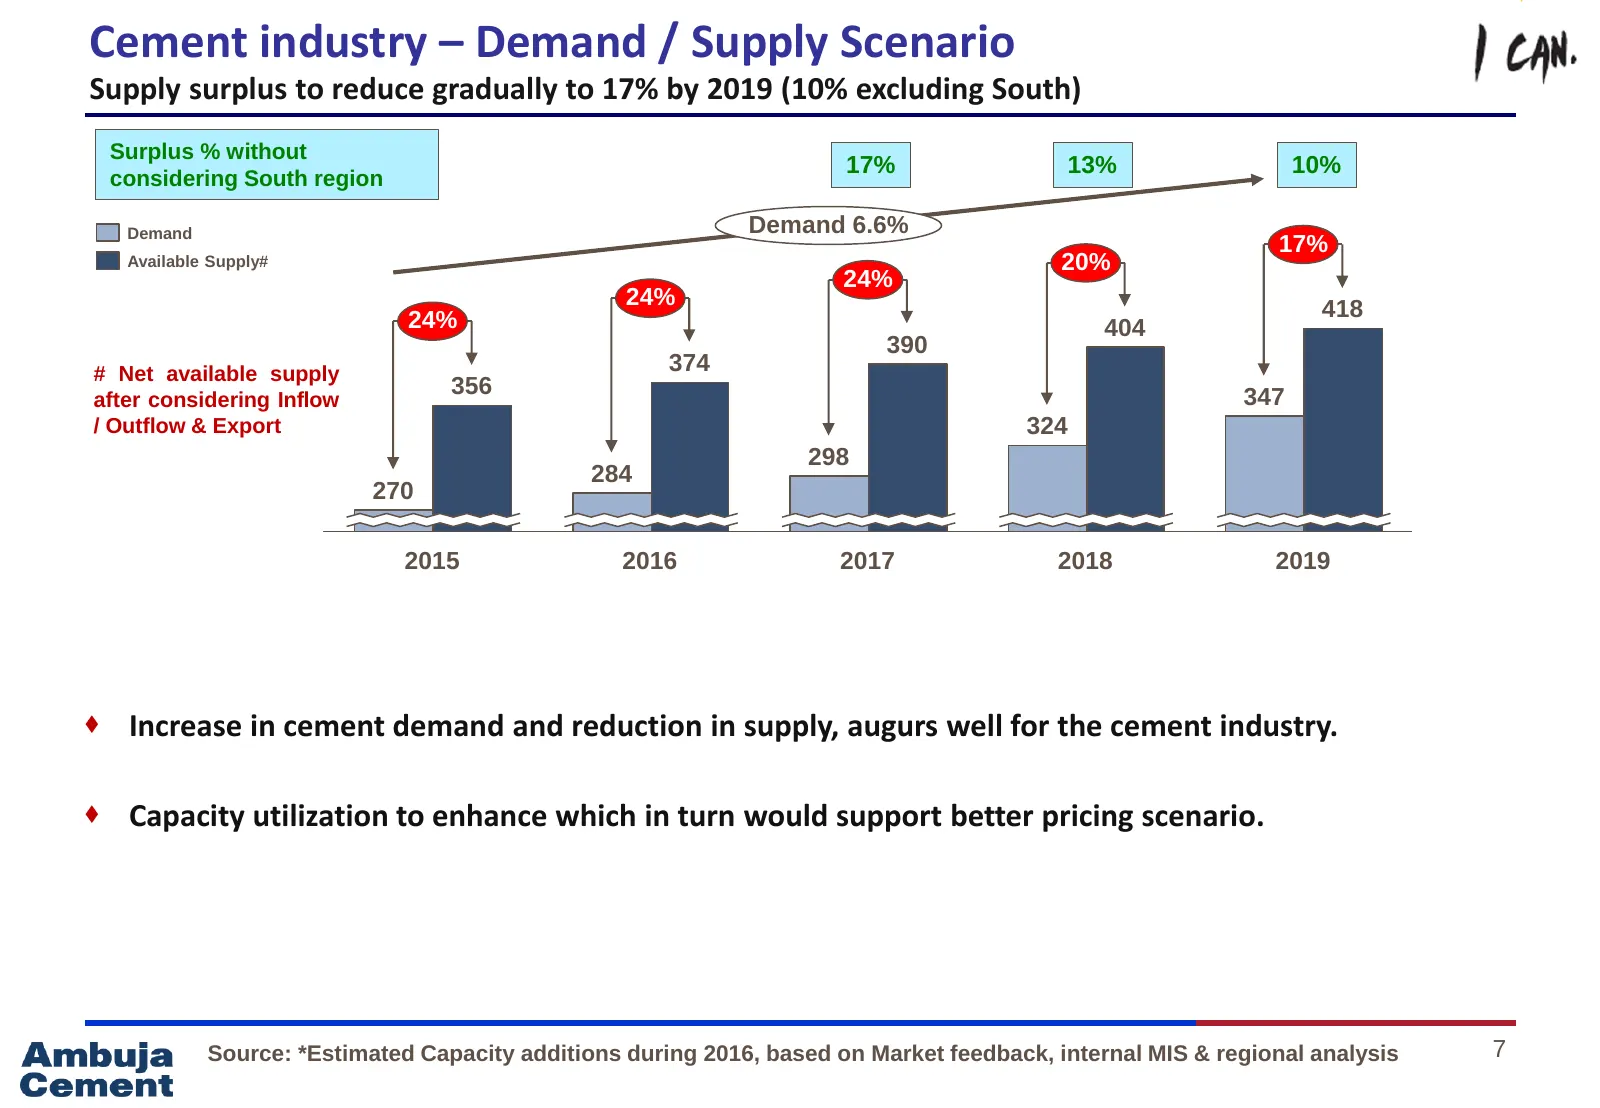
Cement industry – Demand / Supply Scenario Supply surplus to reduce gradually to 17% by 2019 (10% excluding South) Surplus % without 17% 13% 10% considering South region Demand Demand 6.6% 17% Available Supply# 20% 24% 24% 418 24% 404 390 # Net available supply 374 356 347 after considering Inflow /
Slide 9: Brand Architecture
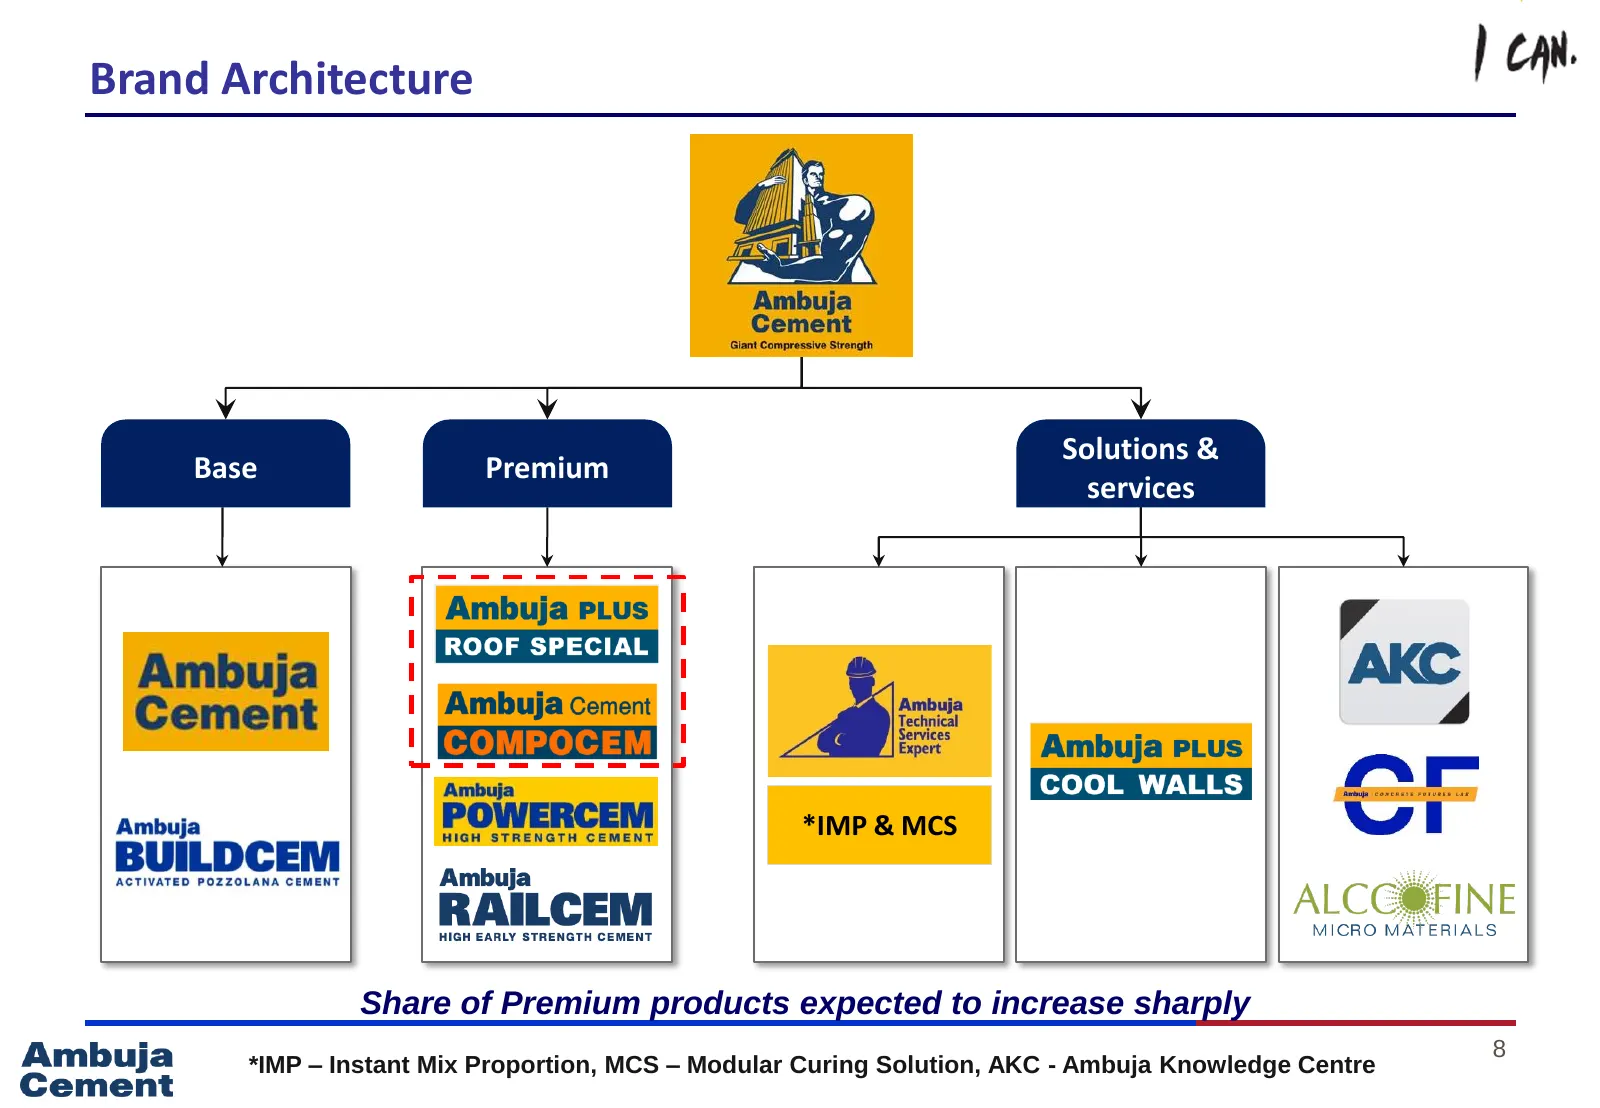
Brand Architecture Solutions & Base Premium services *IMP & MCS Share of Premium products expected to increase sharply 8 *IMP – Instant Mix Proportion, MCS – Modular Curing Solution, AKC - Ambuja Knowledge Centre
Slide 10: Ambuja Knowledge Centre network 27 AKCs @ 25 locations
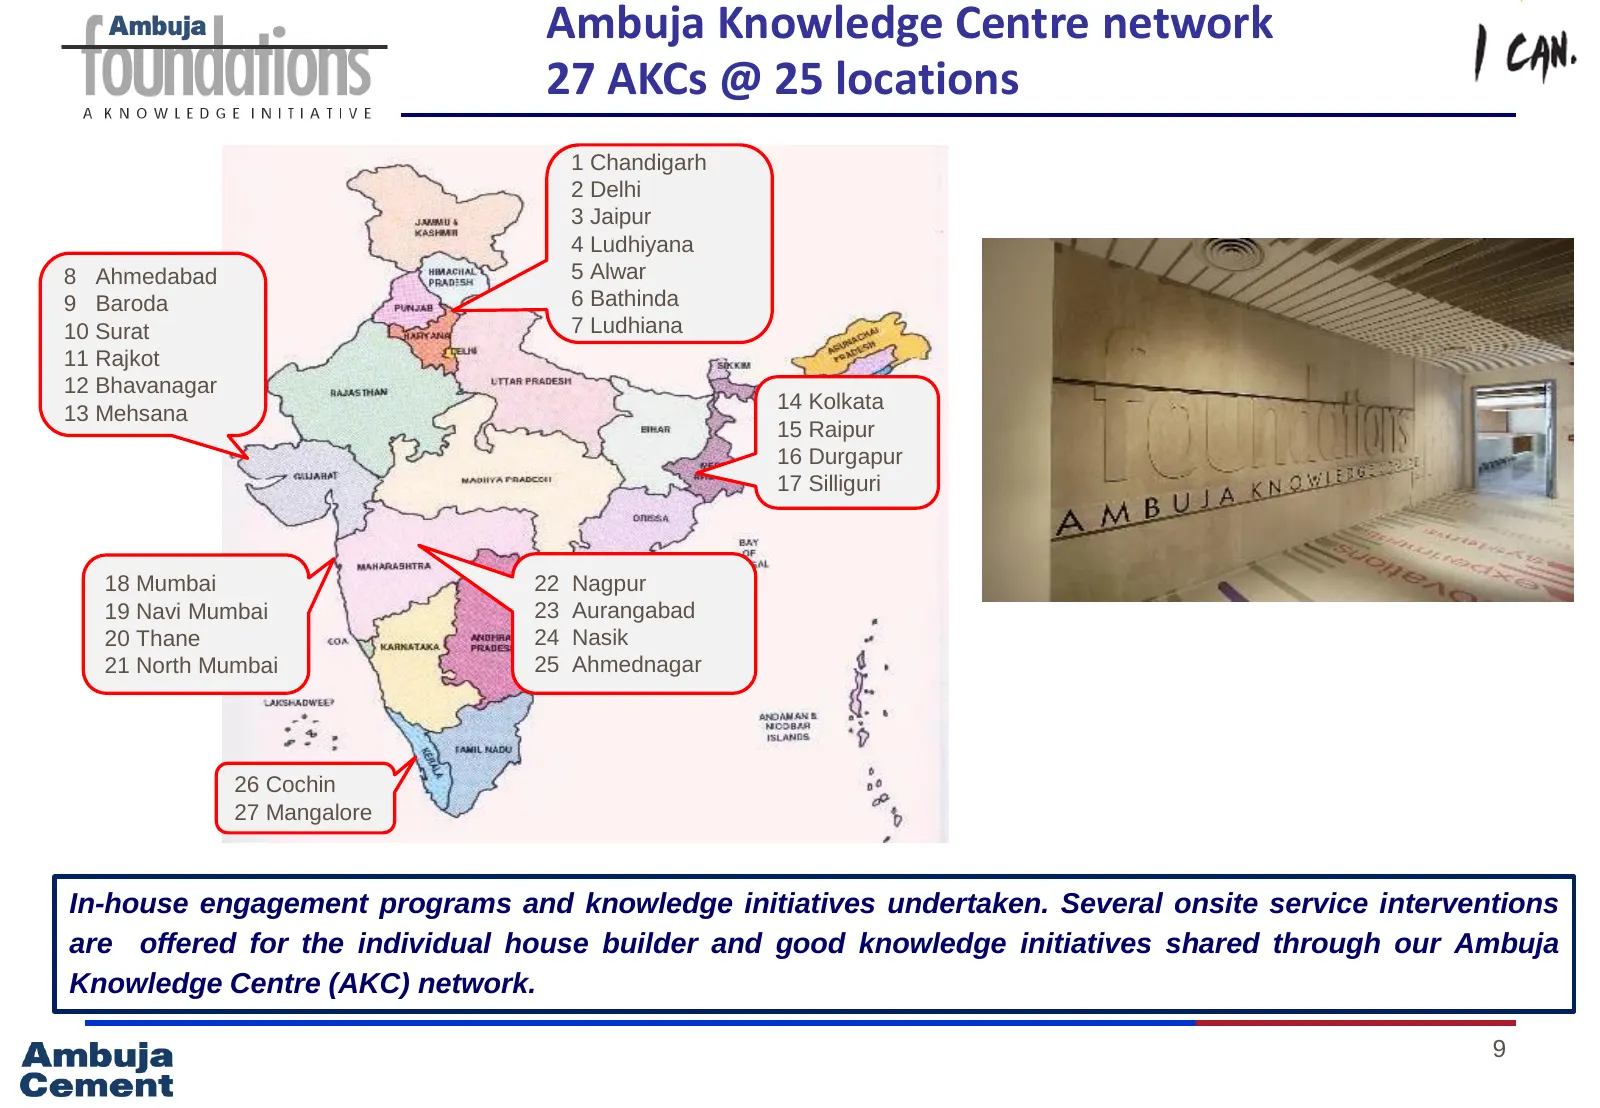
Ambuja Knowledge Centre network 27 AKCs @ 25 locations 1 Chandigarh 2 Delhi 3 Jaipur 4 Ludhiyana 8 Ahmedabad 5 Alwar 9 Baroda 6 Bathinda 10 Surat 7 Ludhiana 11 Rajkot 12 Bhavanagar 13 Mehsana 14 Kolkata 15 Raipur 16 Durgapur 17 Silliguri 18 Mumbai 22 Nagpur 19 Navi Mumbai 23 Aurangabad 20 Thane 24 N
Slide 11: Ambuja: Financial highlights (CY2016)
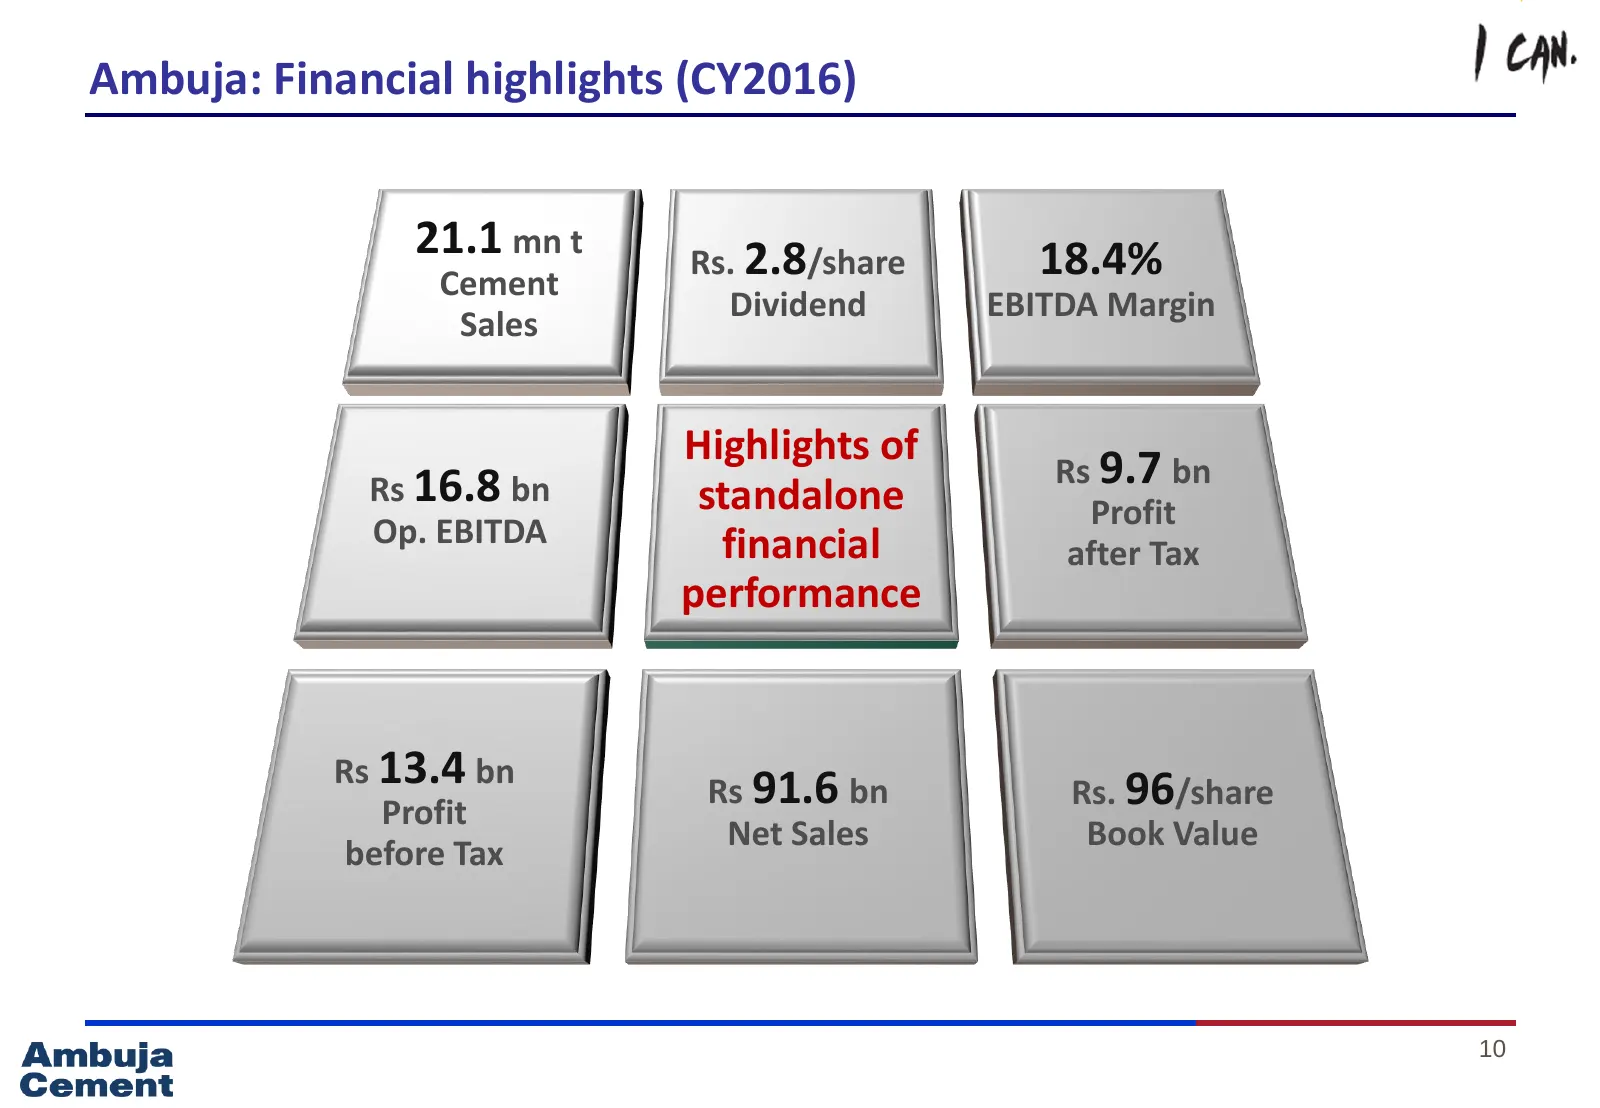
Ambuja: Financial highlights (CY2016) 21.1 mn t Rs. 2.8/share 18.4% Cement Dividend EBITDA Margin Sales Highlights of Rs 16.8 bn Rs 9.7 bn standalone Profit Op. EBITDA financial after Tax performance Rs 13.4 bn Rs 91.6 bn Rs. 96/share Profit Net Sales Book Value before Tax 10
Slide 12: ACL: Consistent financial performance
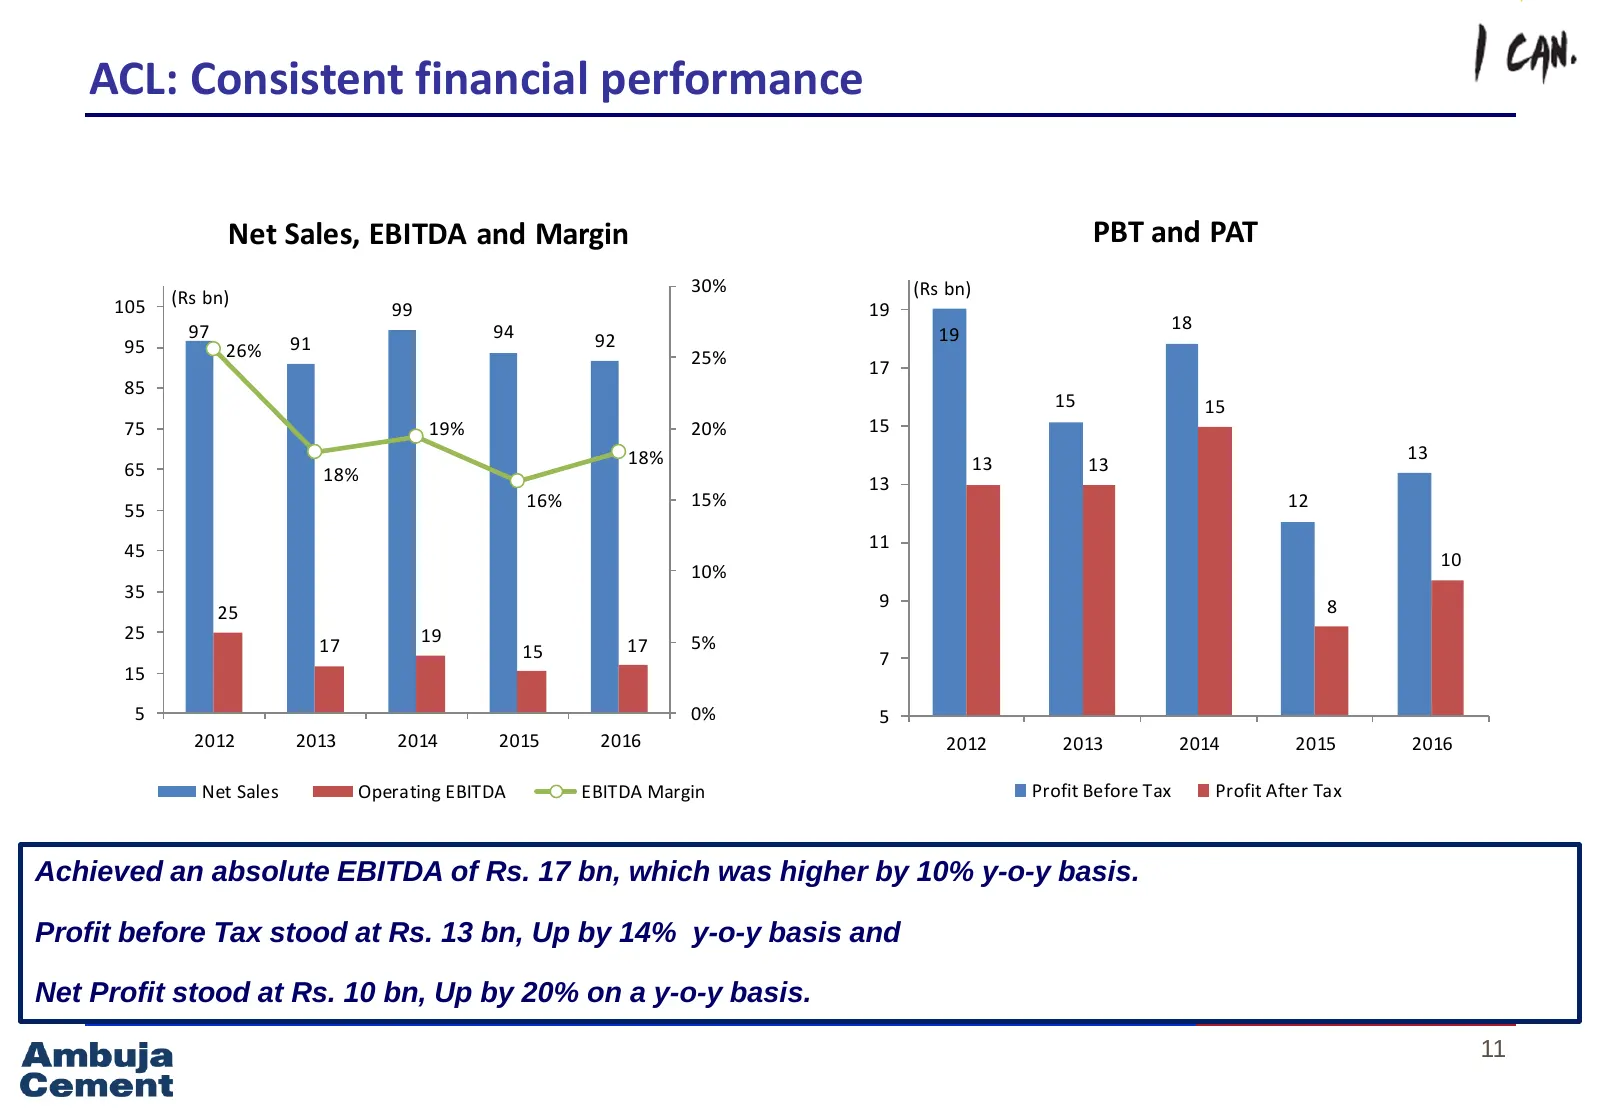
ACL: Consistent financial performance Net Sales, EBITDA and Margin PBT and PAT 30% (Rs bn) 105 (Rs bn) 99 19 97 94 18 91 92 19 95 26% 25% 17 85 15 15 75 19% 20% 15 18% 13 65 13 13 18% 13 16% 15% 12 55 45 11 10 10% 35 9 25 8 25 19 17 15 17 5% 7 15 5 0% 5 2012 2013 2014 2015 2016 2012 2013 2014 2015 2
Slide 13: Dividends per share /EPS/Dividends Pay-out ratio
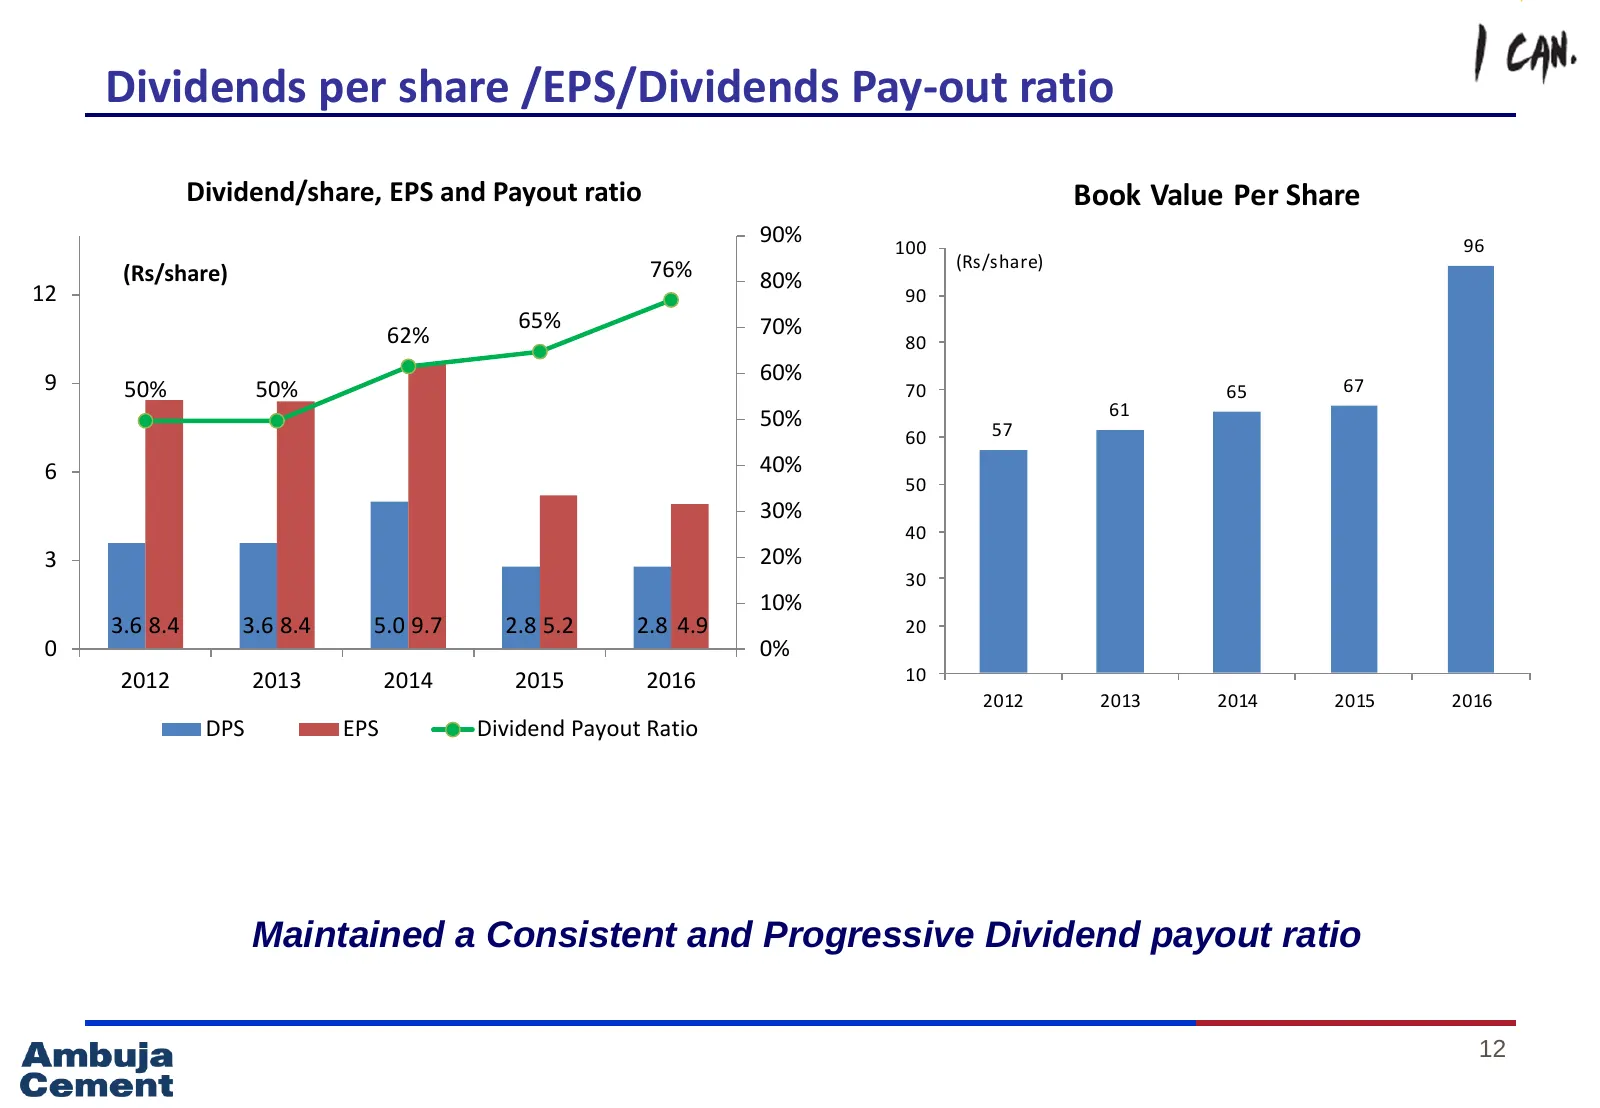
Dividends per share /EPS/Dividends Pay-out ratio Dividend/share, EPS and Payout ratio Book Value Per Share 90% 100 96 76% (Rs/share) (Rs/share) 80% 12 90 65% 70% 62% 80 9 60% 67 50% 50% 70 65 50% 61 60 57 6 40% 50 30% 40 3 20% 30 10% 3.6 8.4 3.6 8.4 5.0 9.7 2.8 5.2 2.8 4.9 20 0 0% 2012 2013 2014 201
Slide 14: ACL: Our plan to enhance value
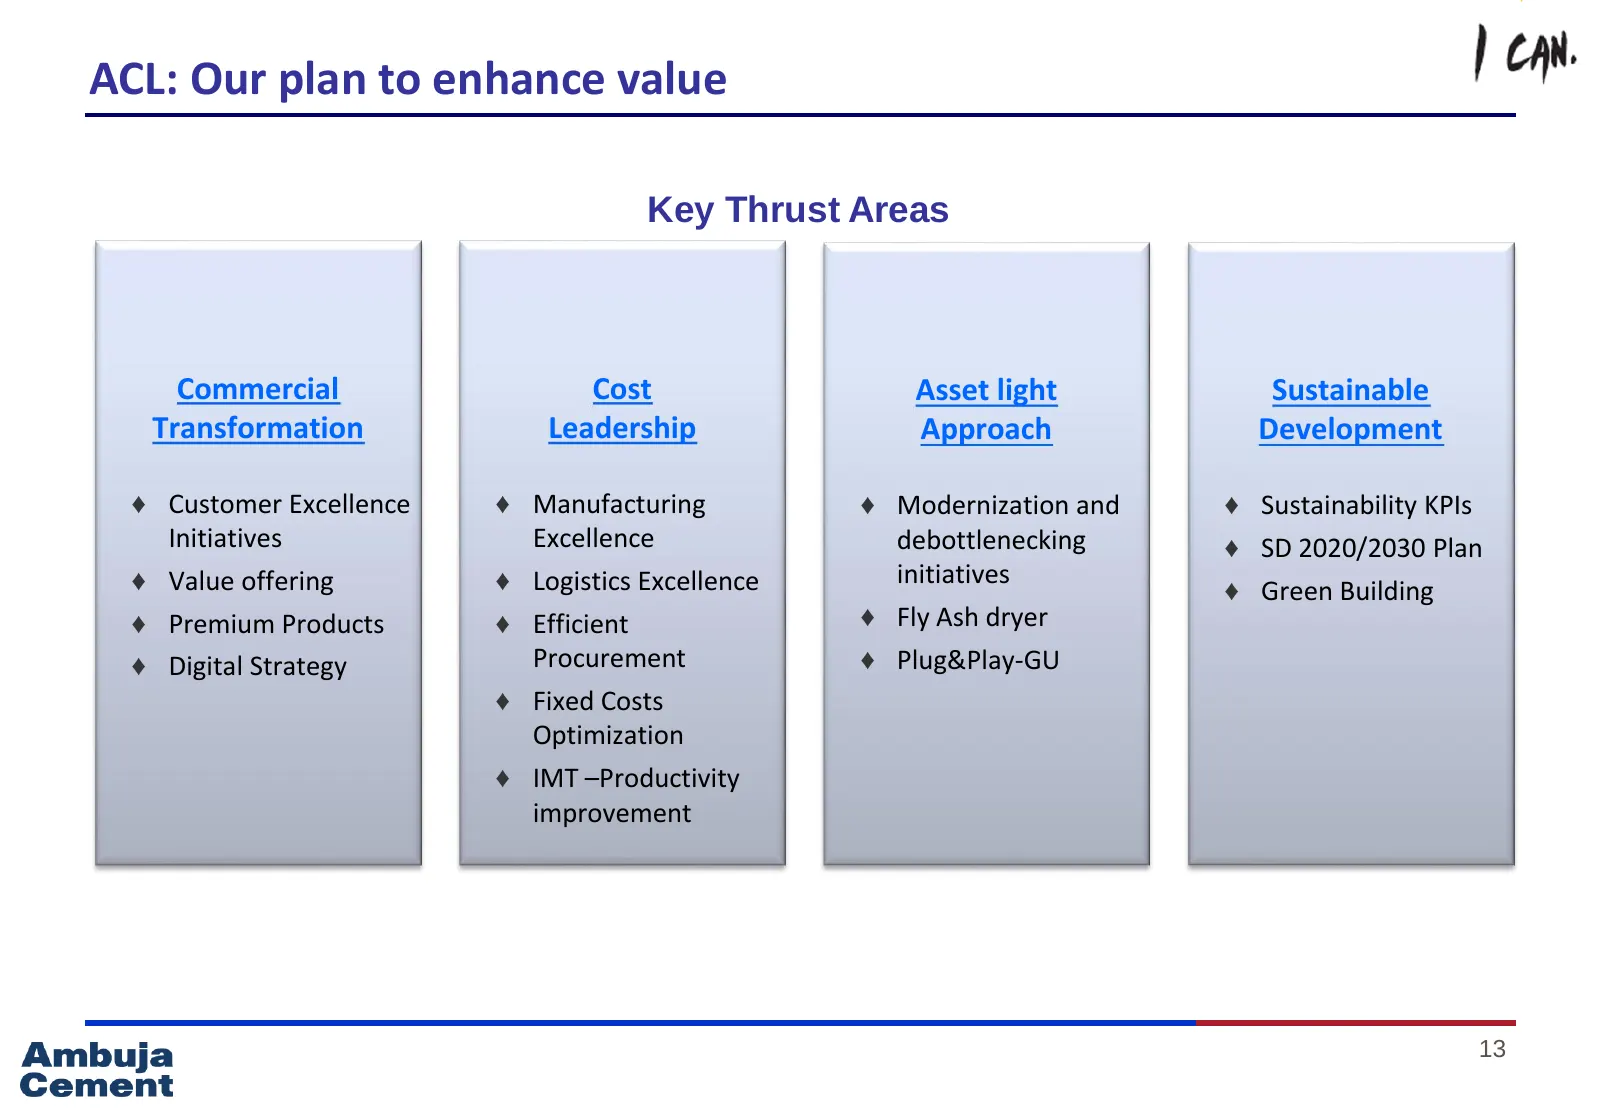
ACL: Our plan to enhance value Key Thrust Areas Commercial Cost Asset light Sustainable Transformation Leadership Approach Development ♦ Customer Excellence ♦ Manufacturing ♦ Modernization and ♦ Sustainability KPIs Initiatives Excellence debottlenecking ♦ SD 2020/2030 Plan ♦ Value offering ♦ Logisti
Slide 15: Cost / Tonne breakup: Significant reduction in fuel costs
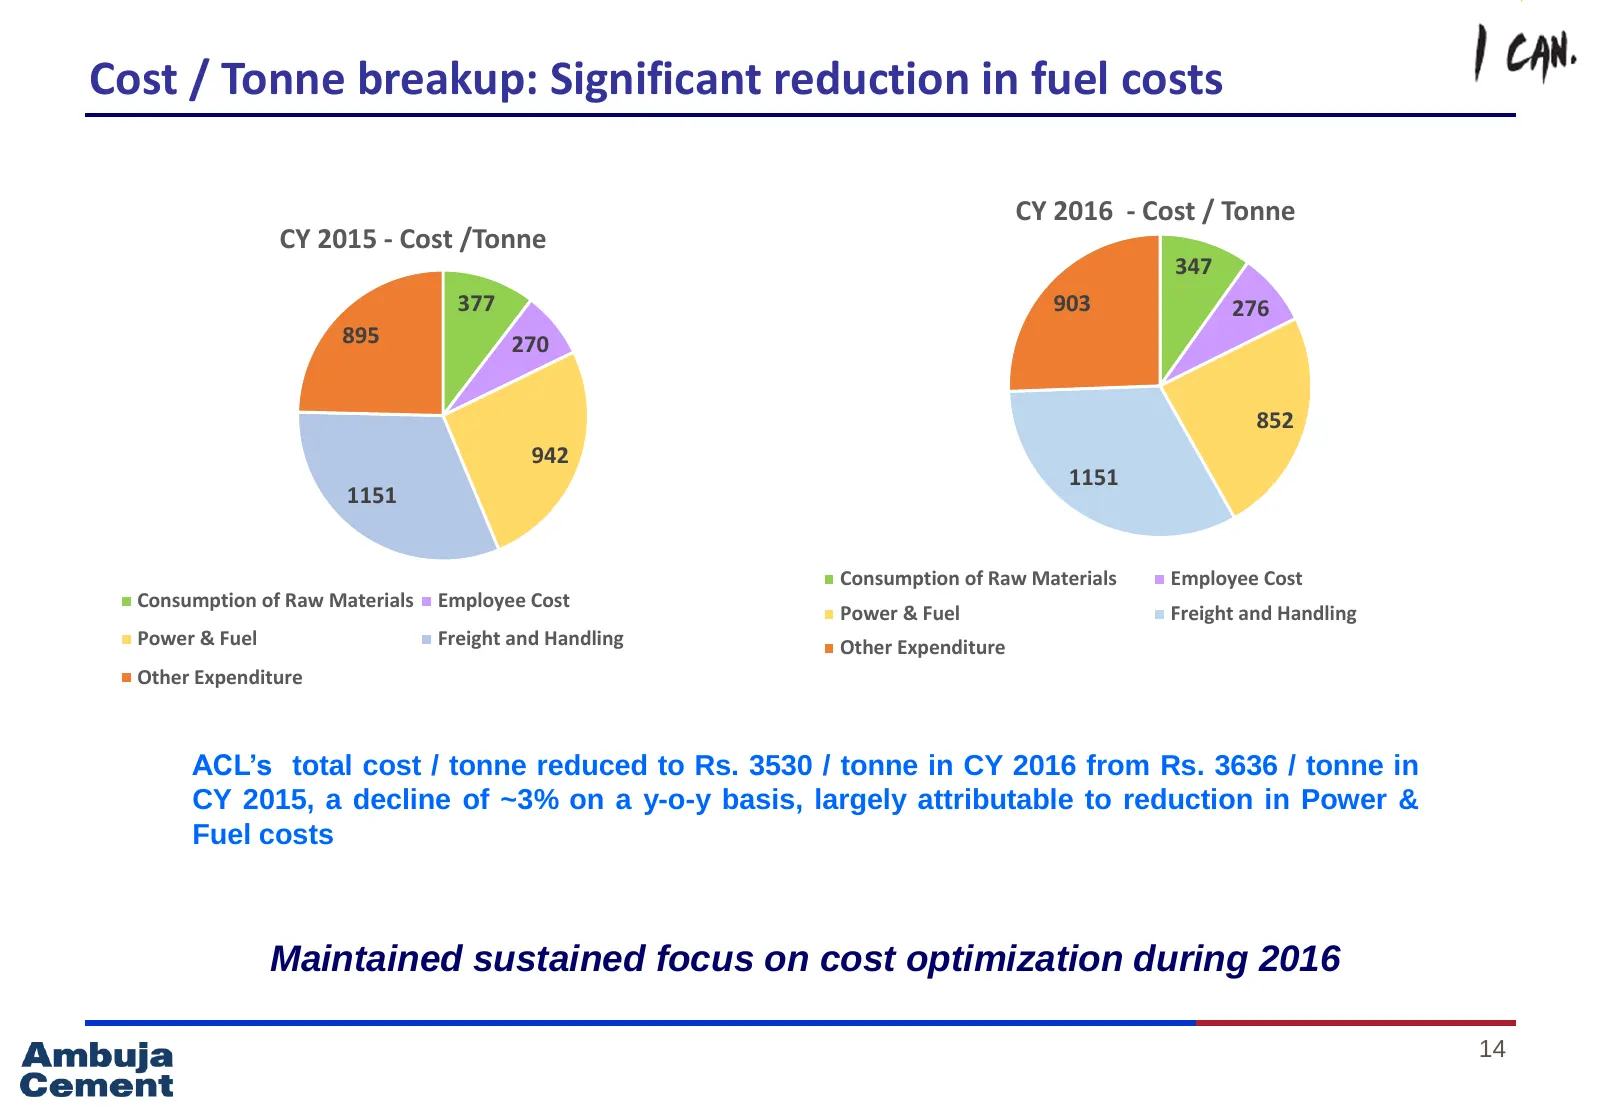
Cost / Tonne breakup: Significant reduction in fuel costs CY 2016 - Cost / Tonne CY 2015 - Cost /Tonne 347 377 903 276 895 270 852 942 1151 1151 Consumption of Raw Materials Employee Cost Consumption of Raw Materials Employee Cost Power & Fuel Freight and Handling Power & Fuel Freight and Handling O
Slide 16: Fuel mix – Higher usage of low cost pet-coke
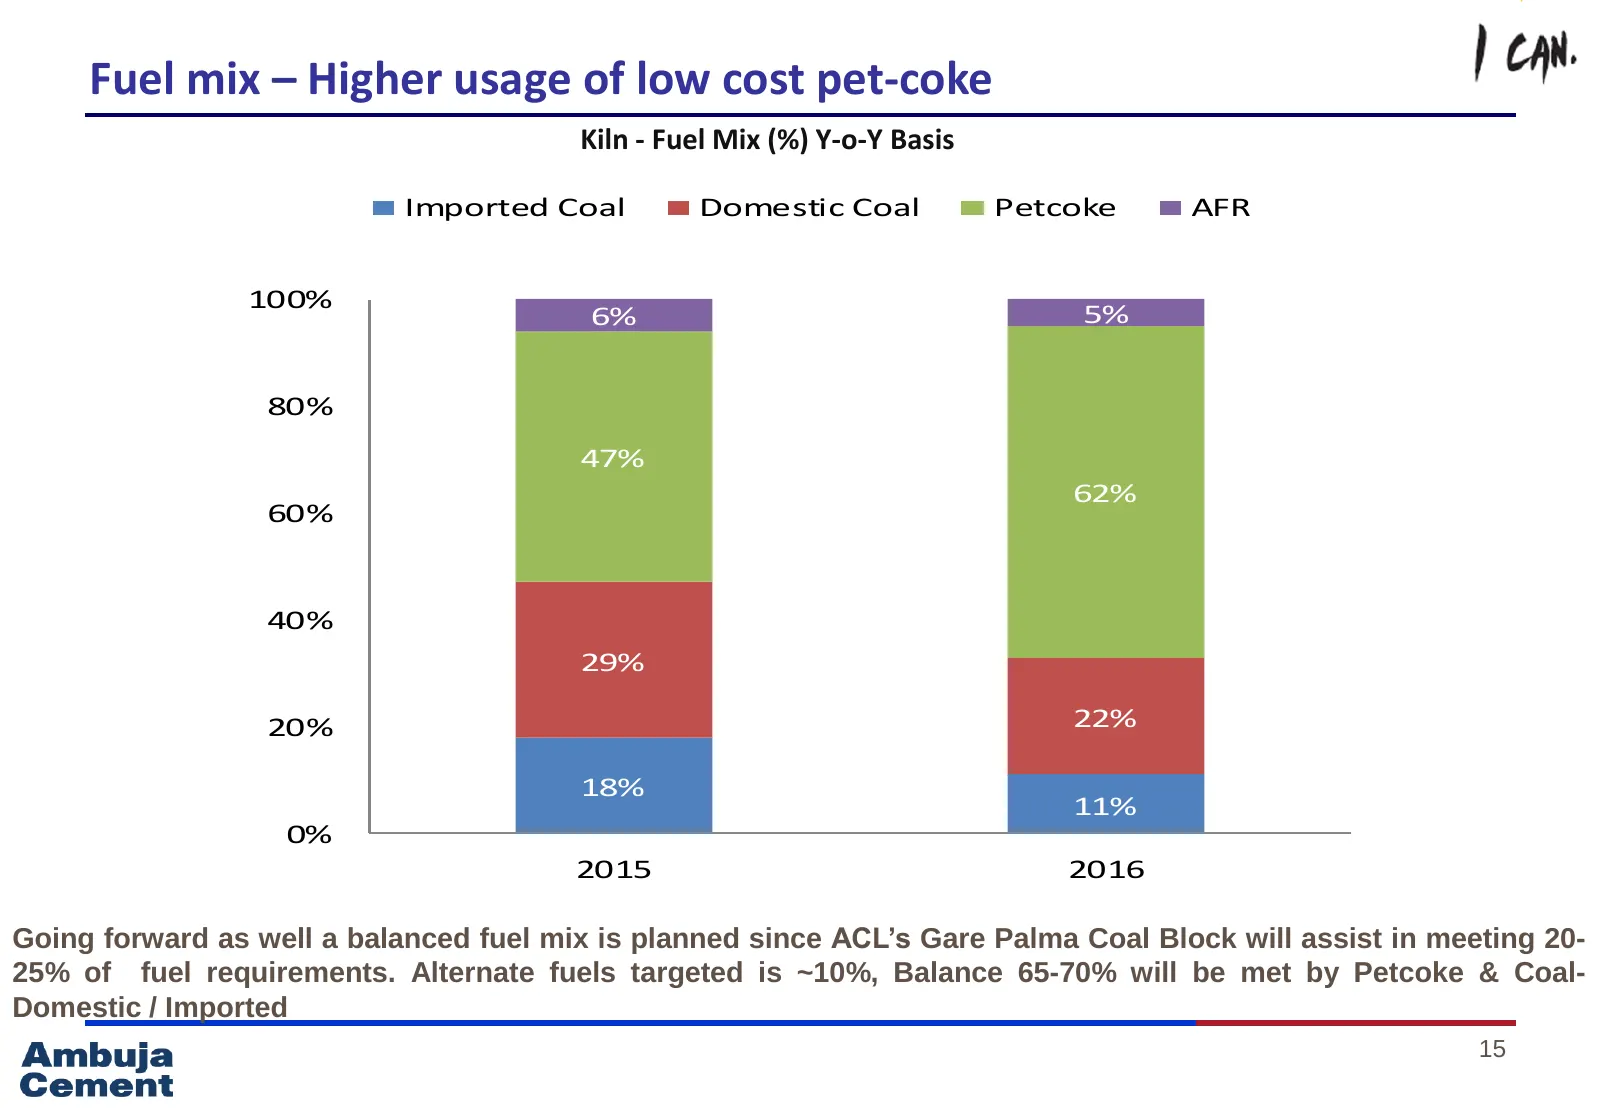
Fuel mix – Higher usage of low cost pet-coke Kiln - Fuel Mix (%) Y-o-Y Basis Imported Coal Domestic Coal Petcoke AFR 100% 6% 5% 80% 47% 62% 60% 40% 29% 20% 22% 18% 11% 0% 2015 2016 Going forward as well a balanced fuel mix is planned since ACL’s Gare Palma Coal Block will assist in meeting 20- 25% o
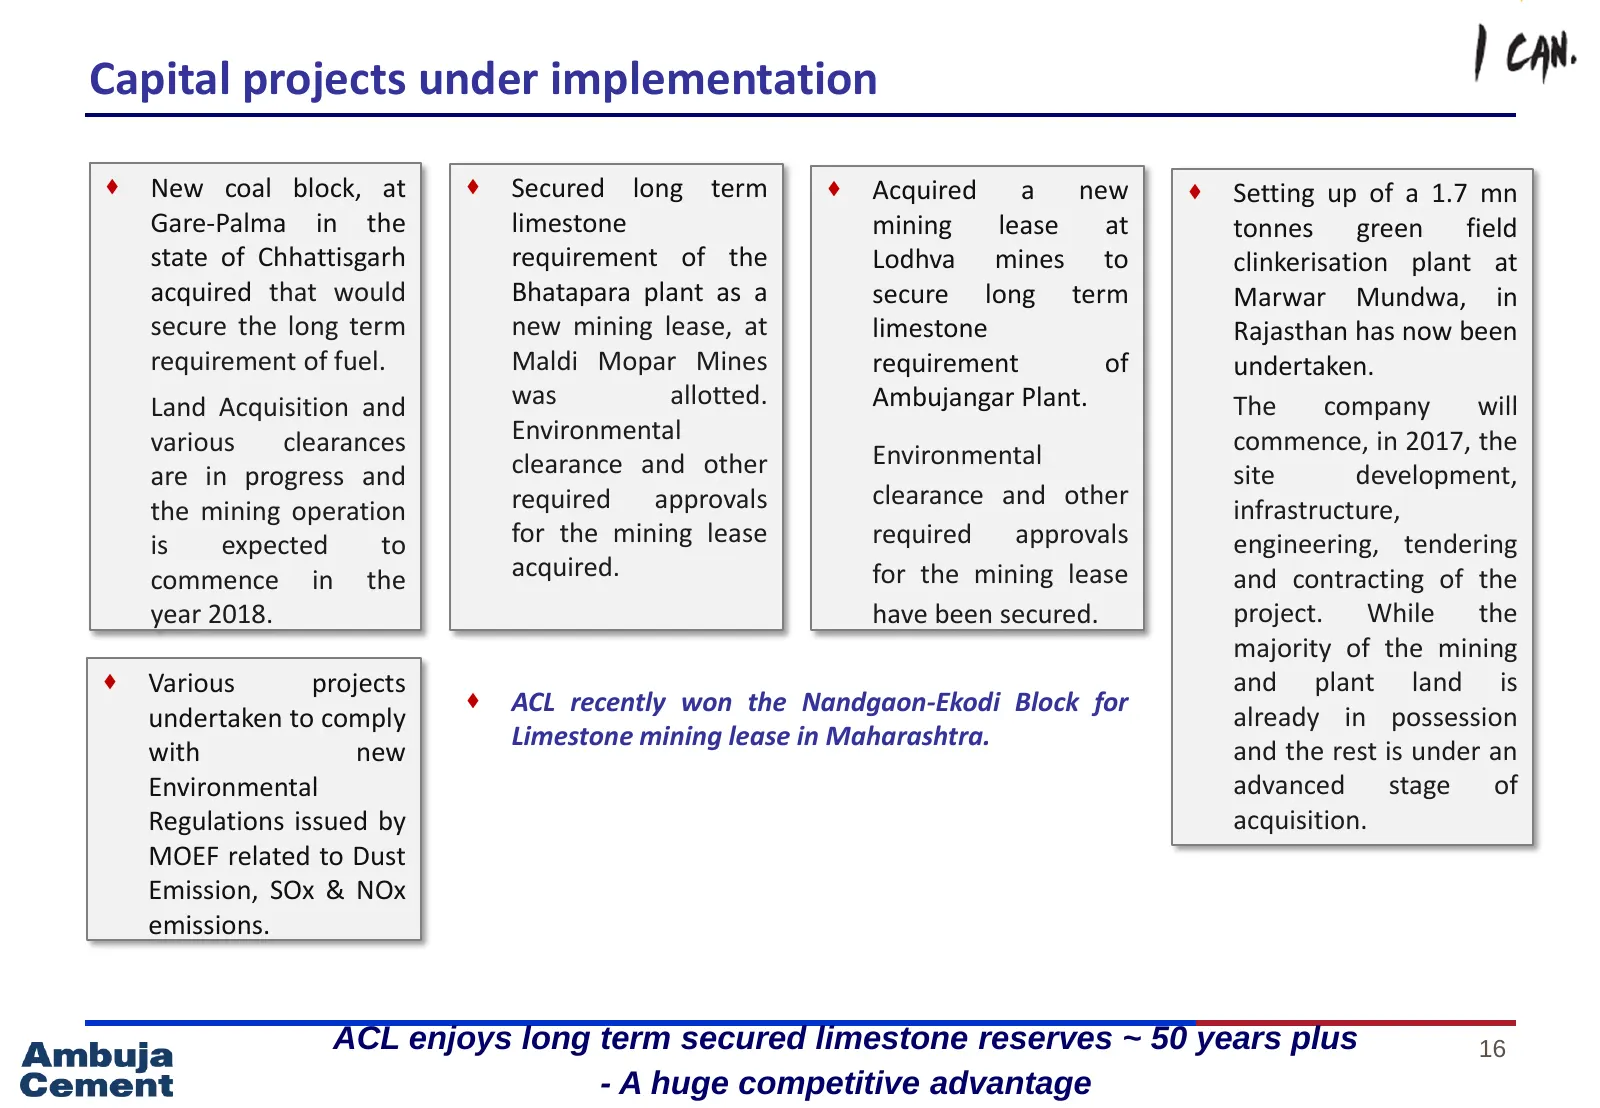
Slide 17: Capital projects under implementation
Capital projects under implementation New coal block, at Secured long term Acquired a new Setting up of a 1.7 mn Gare-Palma in the limestone mining lease at tonnes green field state of Chhattisgarh requirement of the Lodhva mines to clinkerisation plant at acquired that would Bhatapara plant
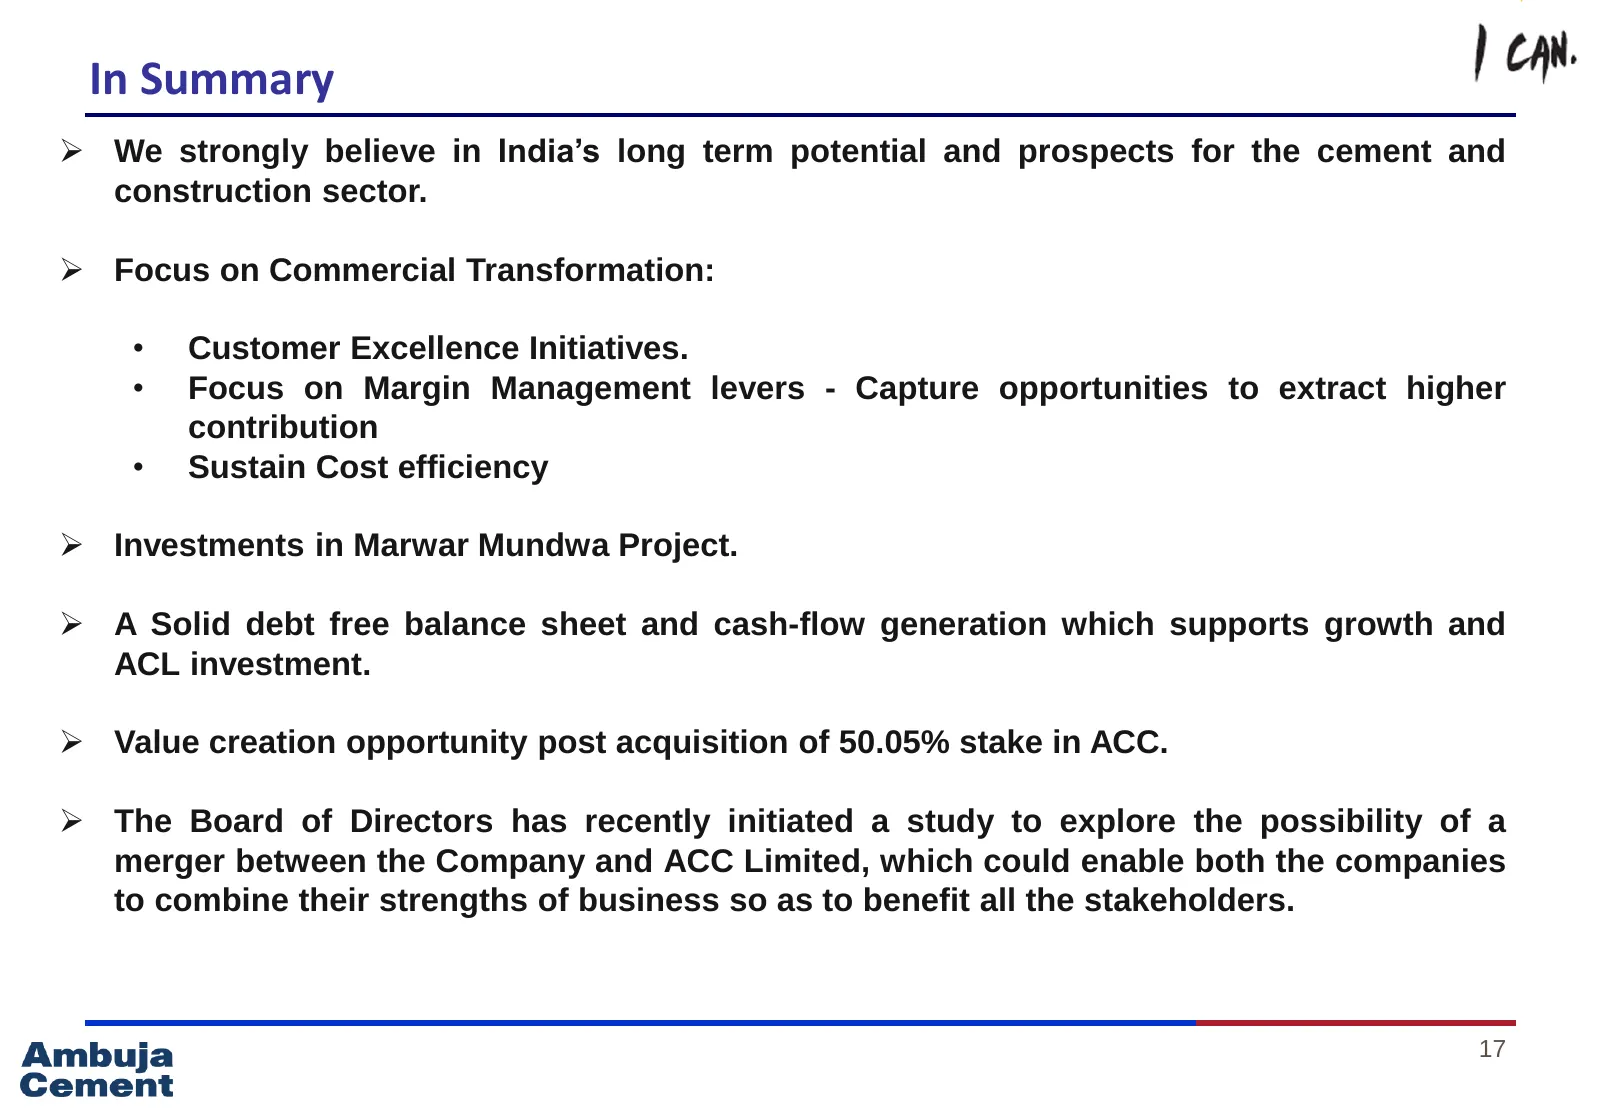
Slide 18: In Summary
In Summary We strongly believe in India’s long term potential and prospects for the cement and construction sector. Focus on Commercial Transformation: • Customer Excellence Initiatives. • Focus on Margin Management levers - Capture opportunities to extract higher contribution • Sustain Cost eff
Source: Internet Archive copy of ambujacement.com
More decks from Ambuja Cements Limited
 Adani Portfolio — Investor Presentation (November 2026)56 slides · November 2026
 H1 FY27 Earnings Presentation40 slides · November 2026
 H1 FY27 Earnings Presentation40 slides · November 2026
 Adani Portfolio — ESG Presentation (November 2026)18 slides · November 2026
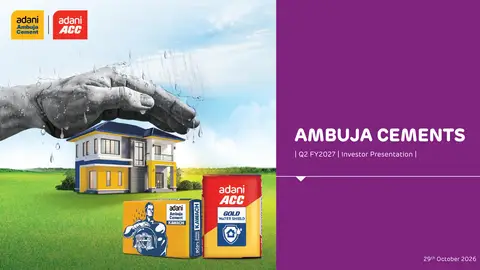 Q2 FY2027 Earnings Presentation39 slides · Oct 29, 2026
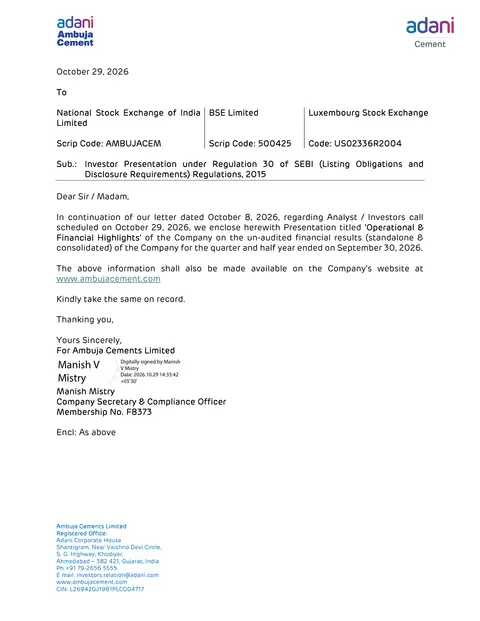 Q2 FY2027 Earnings Presentation40 slides · Oct 29, 2026