Ambuja Cements Limited · NSE:AMBUJACEM
Ambuja Cements — Adani Portfolio — Investor Presentation (November 2026)
56 slides from Ambuja Cements's investor presentation, November 2026

Slide 1: Adani Portfolio | Equity Note
Adani Portfolio | Equity Note November 2026
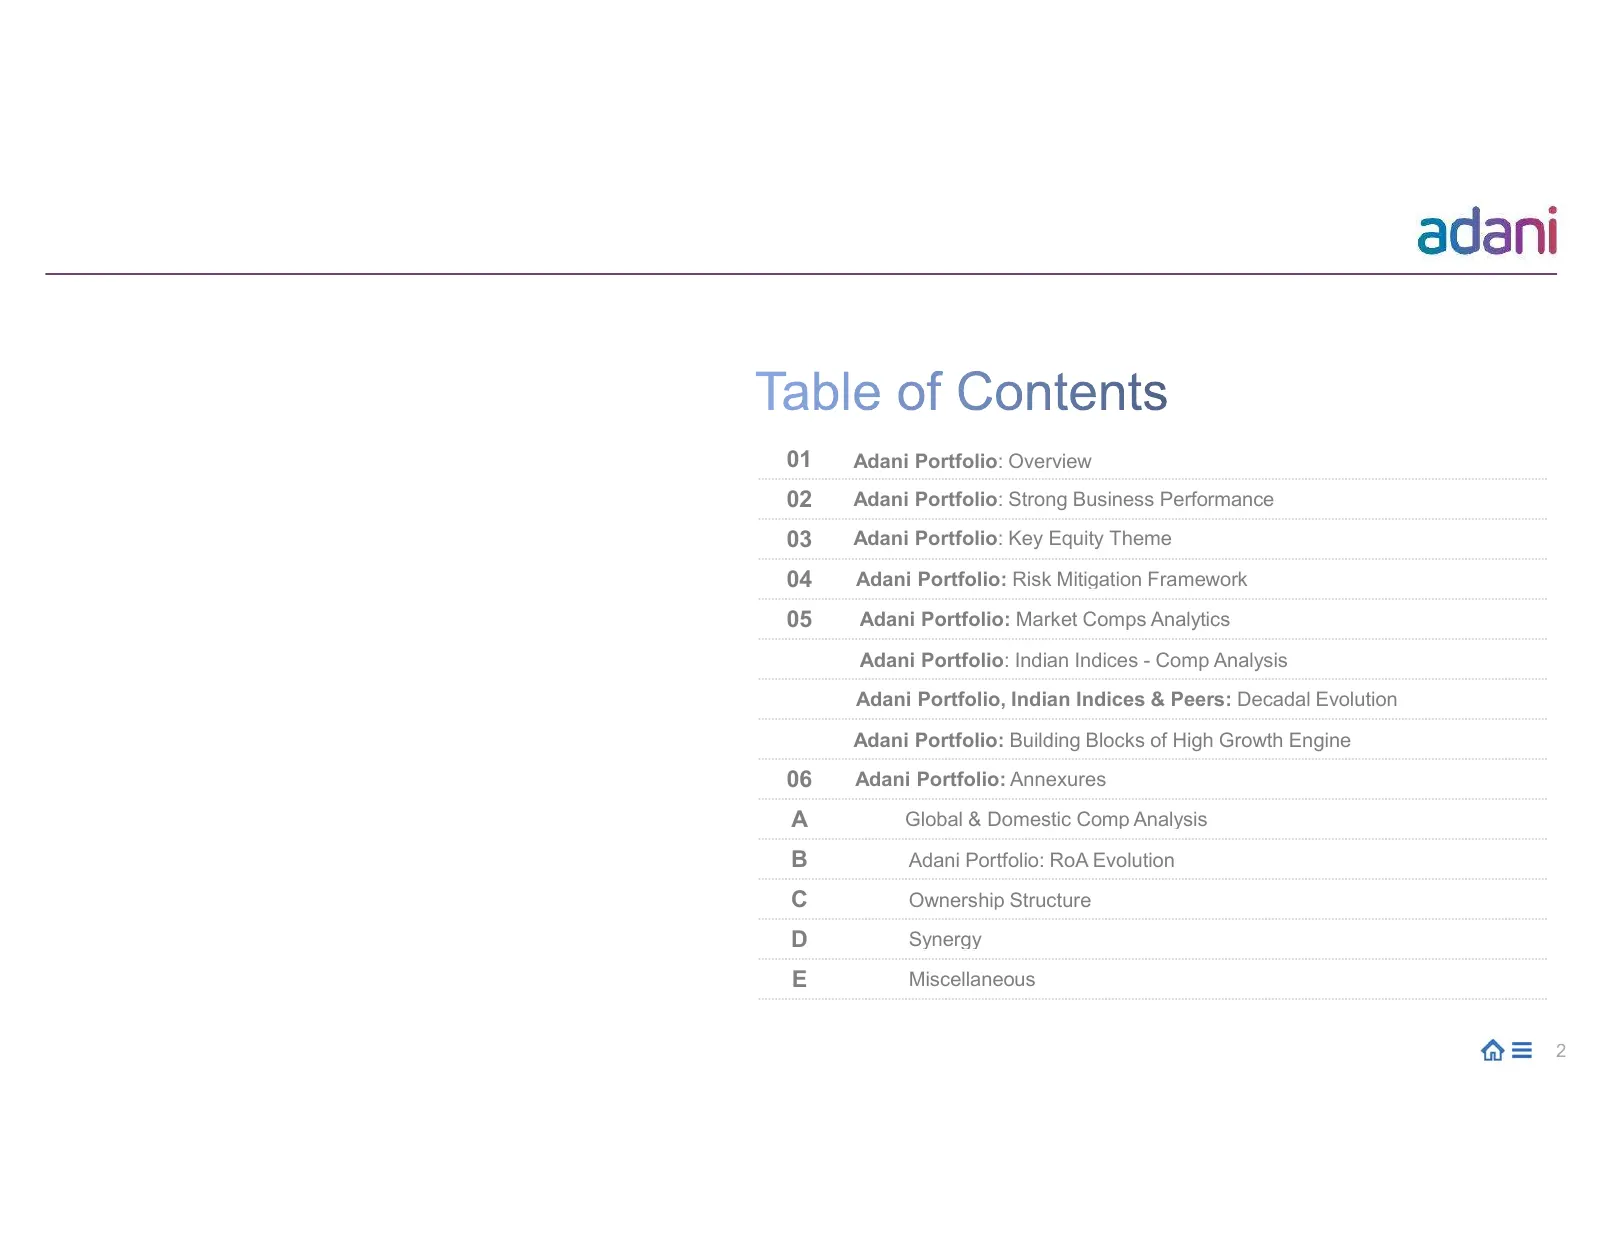
Slide 2: Adani Portfolio: Overview Adani Portfolio: Strong Business Performance Adani Portfolio: Key Equity Theme
01 Adani Portfolio: Overview 02 Adani Portfolio: Strong Business Performance 03 Adani Portfolio: Key Equity Theme 04 Adani Portfolio: Risk Mitigation Framework 05 Adani Portfolio: Market Comps Analytics Adani Portfolio: Indian Indices - Comp Analysis Adani Portfolio, Indian Indices & Peers: Decadal
Slide 3: Adani Portfolio: Overview
Adani Portfolio: Overview STRICTLY CONFIDENTIAL
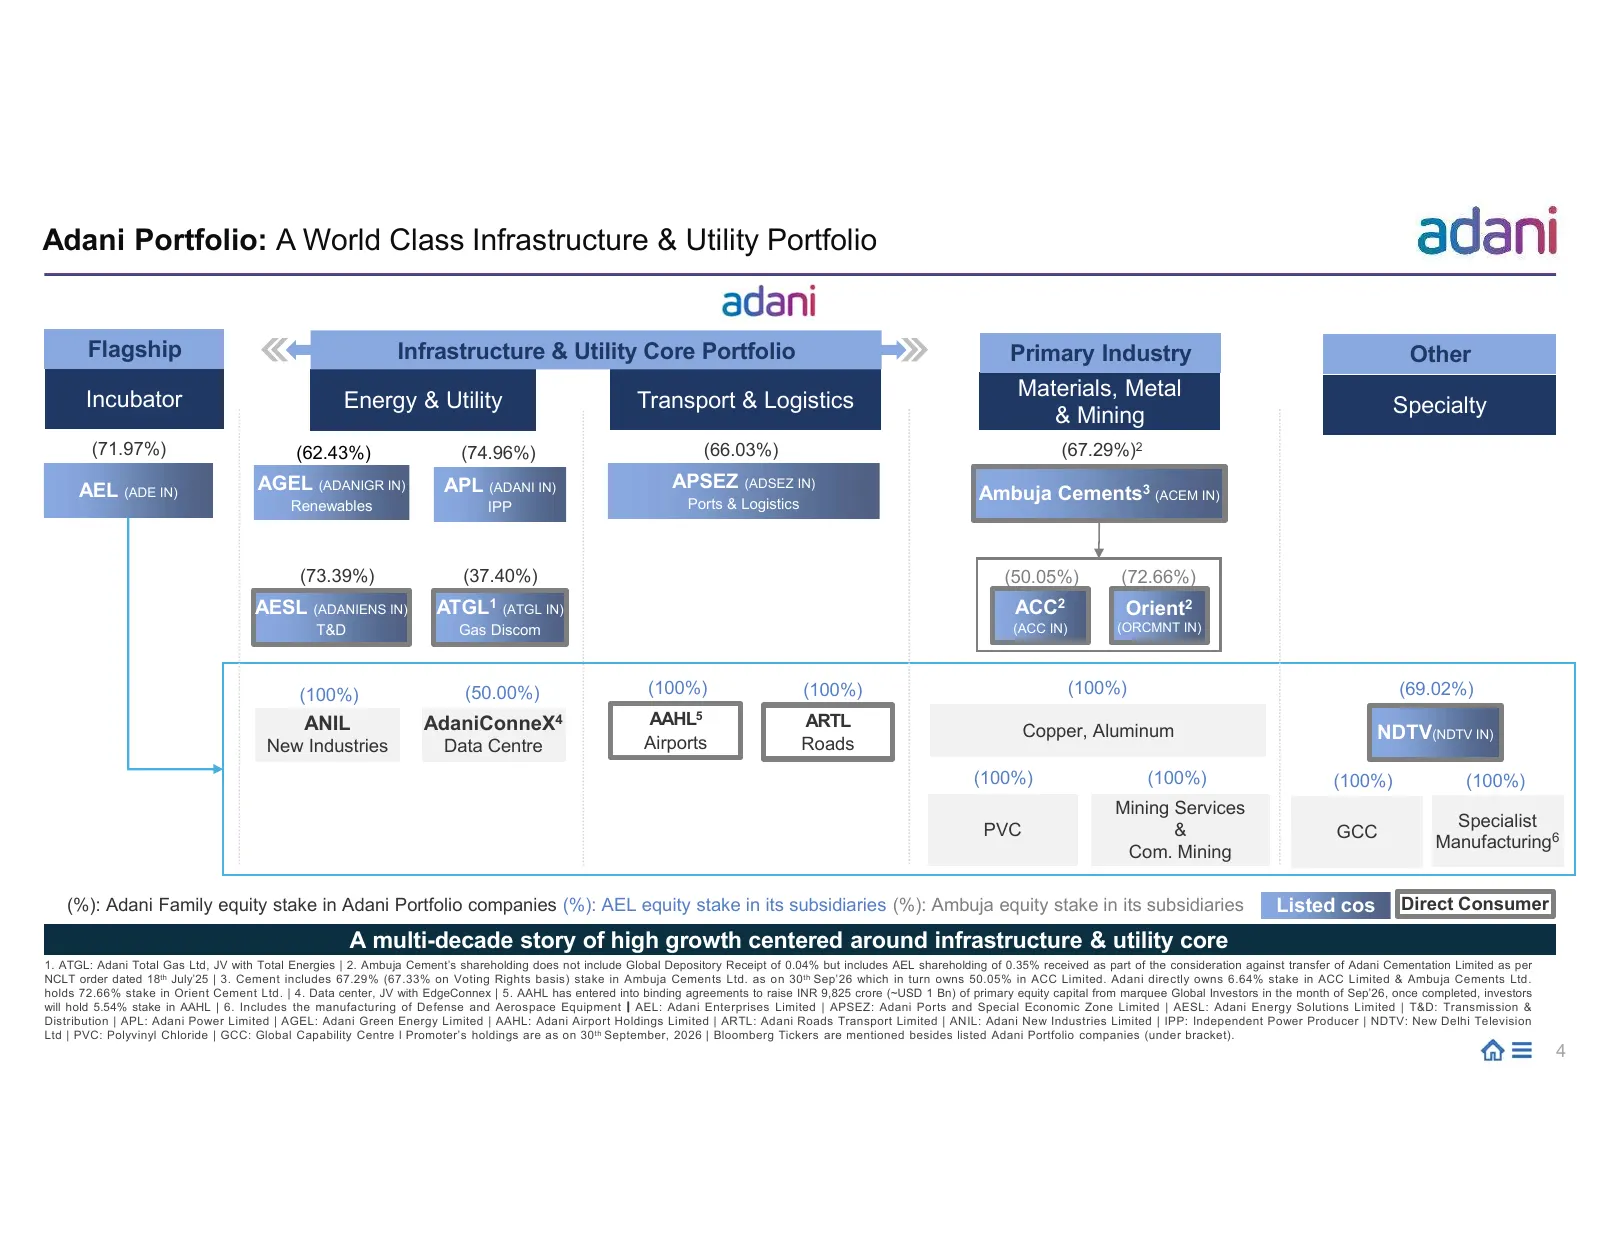
Slide 4: A World Class Infrastructure & Utility Portfolio
Adani Portfolio: A World Class Infrastructure & Utility Portfolio Flagship Infrastructure & Utility Core Portfolio Primary Industry Other Incubator Materials, Metal Energy & Utility Transport & Logistics Specialty & Mining (71.97%) (62.43%) (74.96%) (66.03%) (67.29%)2 AEL (ADE IN) AGEL (ADANIGR IN)
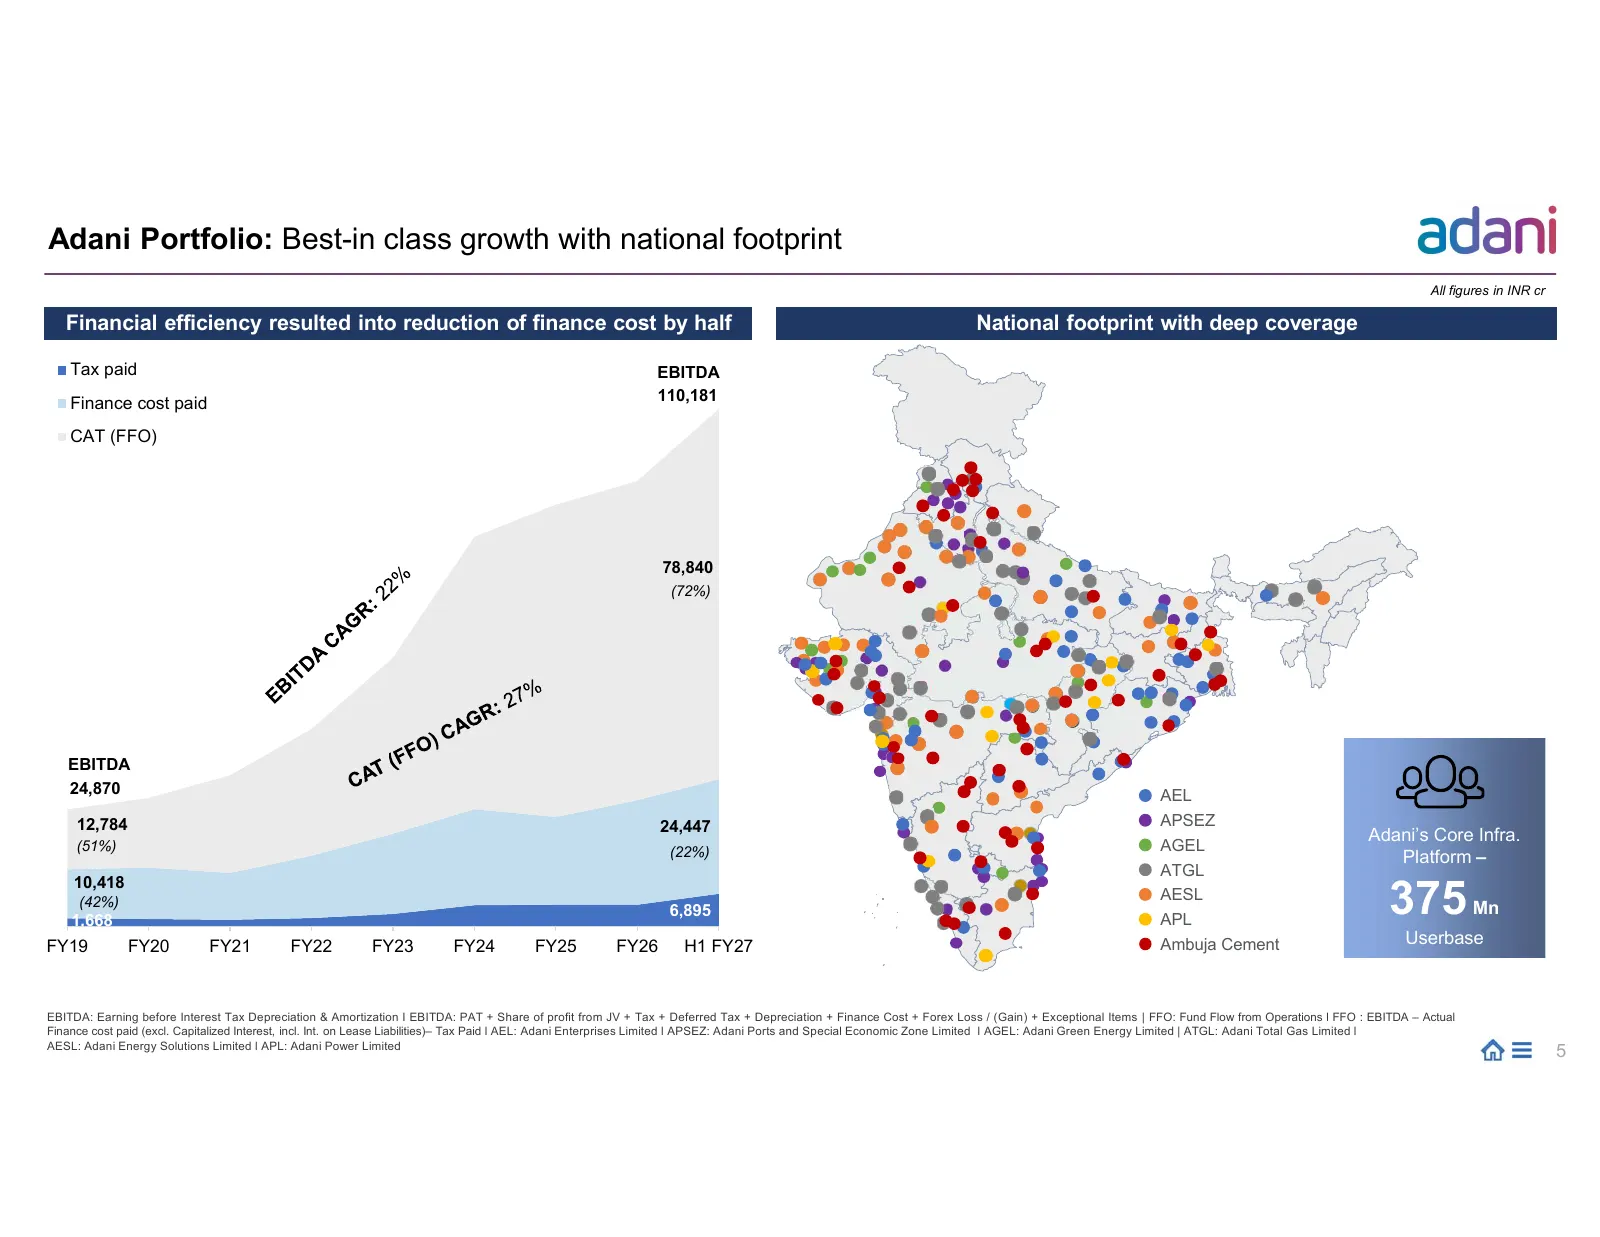
Slide 5: Best-in class growth with national footprint
Adani Portfolio: Best-in class growth with national footprint All figures in INR cr Financial efficiency resulted into reduction of finance cost by half National footprint with deep coverage Tax paid EBITDA Finance cost paid 110,181 CAT (FFO) 78,840 (72%) EBITDA 24,870 AEL 12,784 24,447 APSEZ Adani’
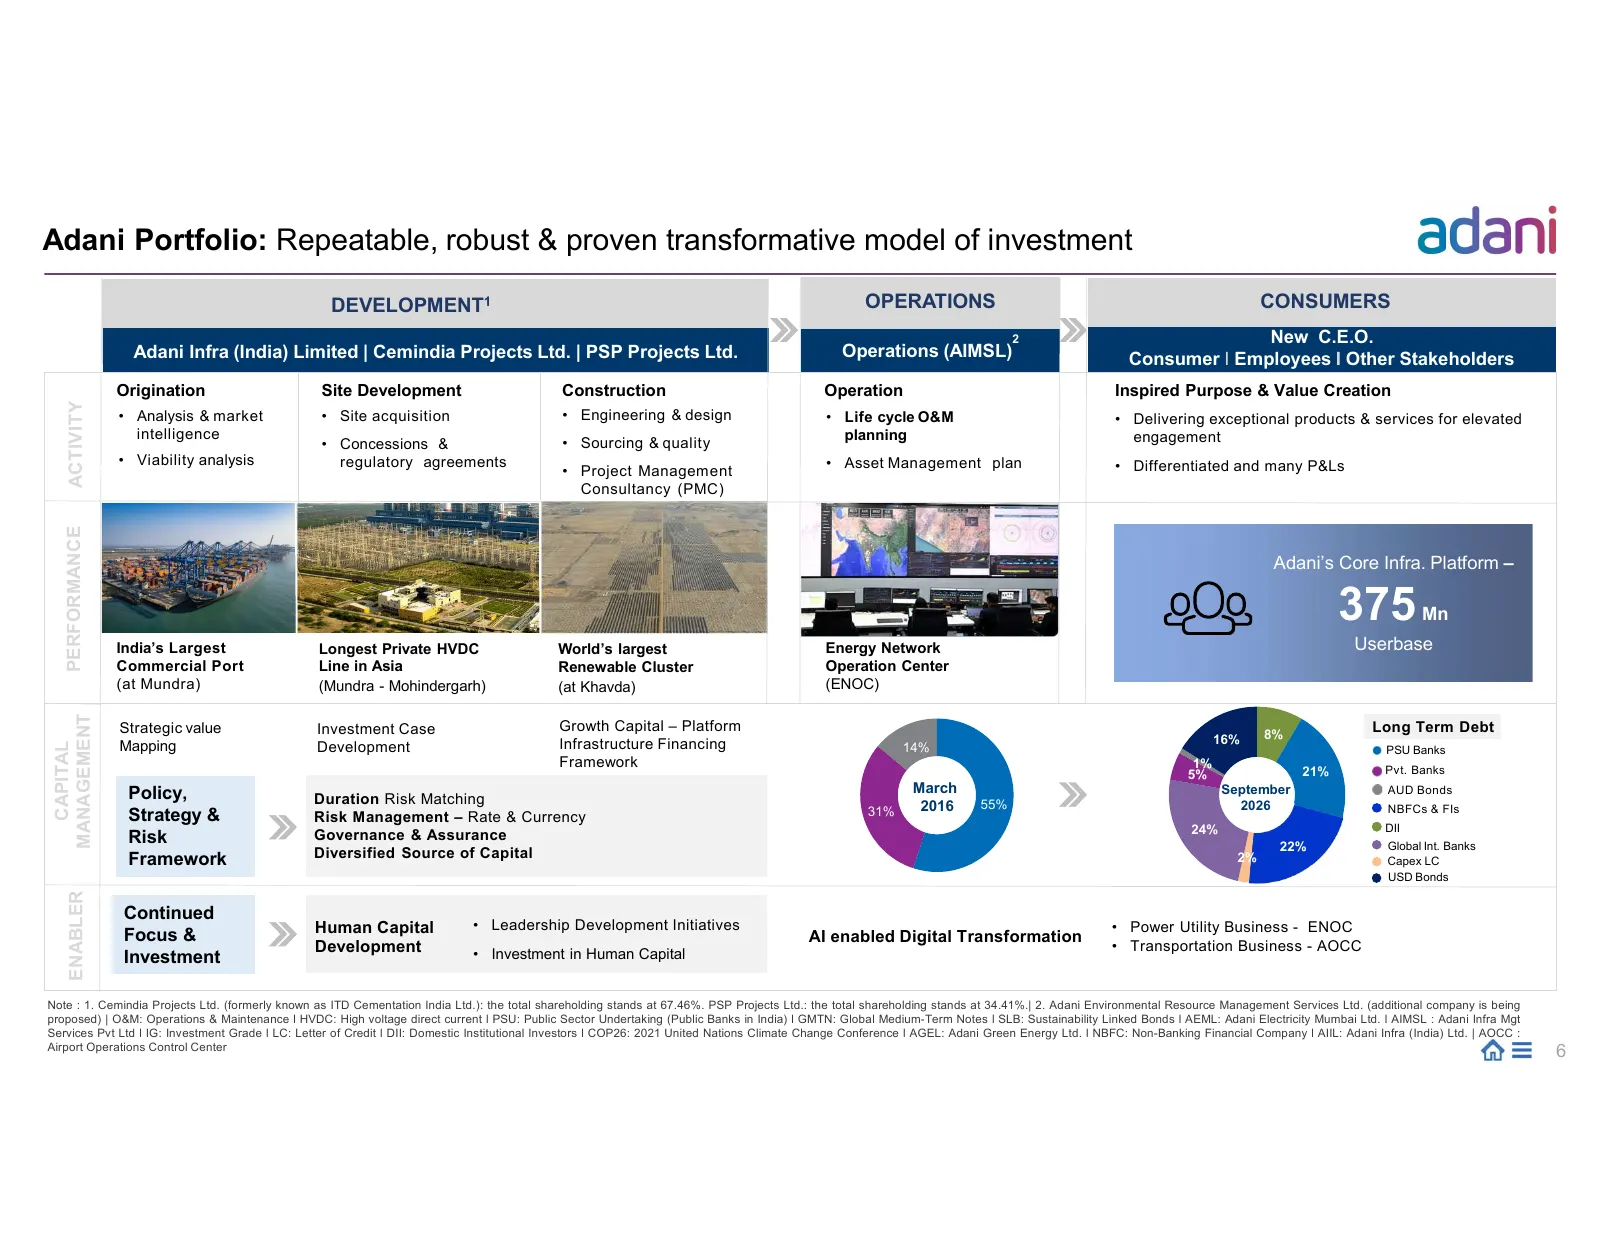
Slide 6: Repeatable, robust & proven transformative model of investment
Adani Portfolio: Repeatable, robust & proven transformative model of investment DEVELOPMENT1 OPERATIONS CONSUMERS 2 New C.E.O. Adani Infra (India) Limited | Cemindia Projects Ltd. | PSP Projects Ltd. Operations (AIMSL) Consumer I Employees I Other Stakeholders Origination Site Development Constructi
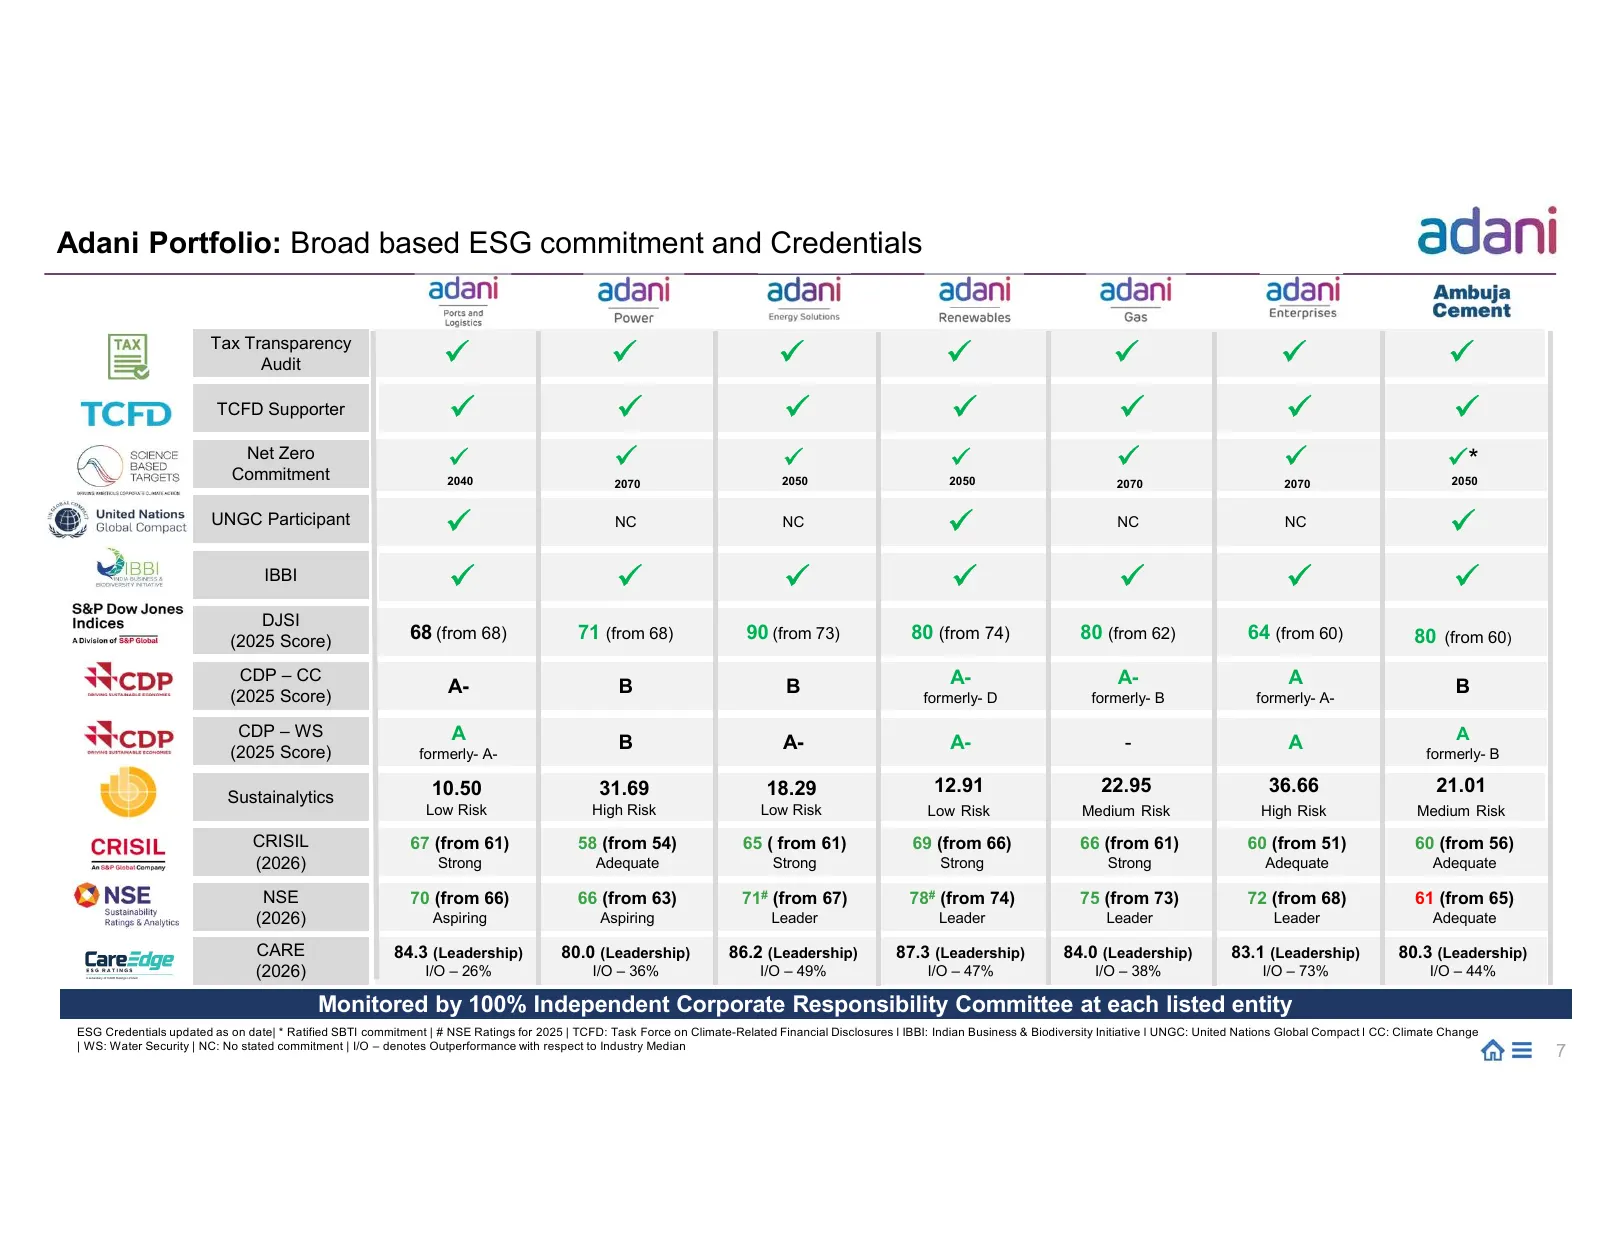
Slide 7: Broad based ESG commitment and Credentials
Adani Portfolio: Broad based ESG commitment and Credentials Tax Transparency Audit TCFD Supporter Net Zero Commitment * 2040 2070 2050 2050 2070 2070 2050 UNGC Participant NC NC NC NC IBBI DJSI (2025 Score) 68 (from 68) 71 (from 68) 90 (fr
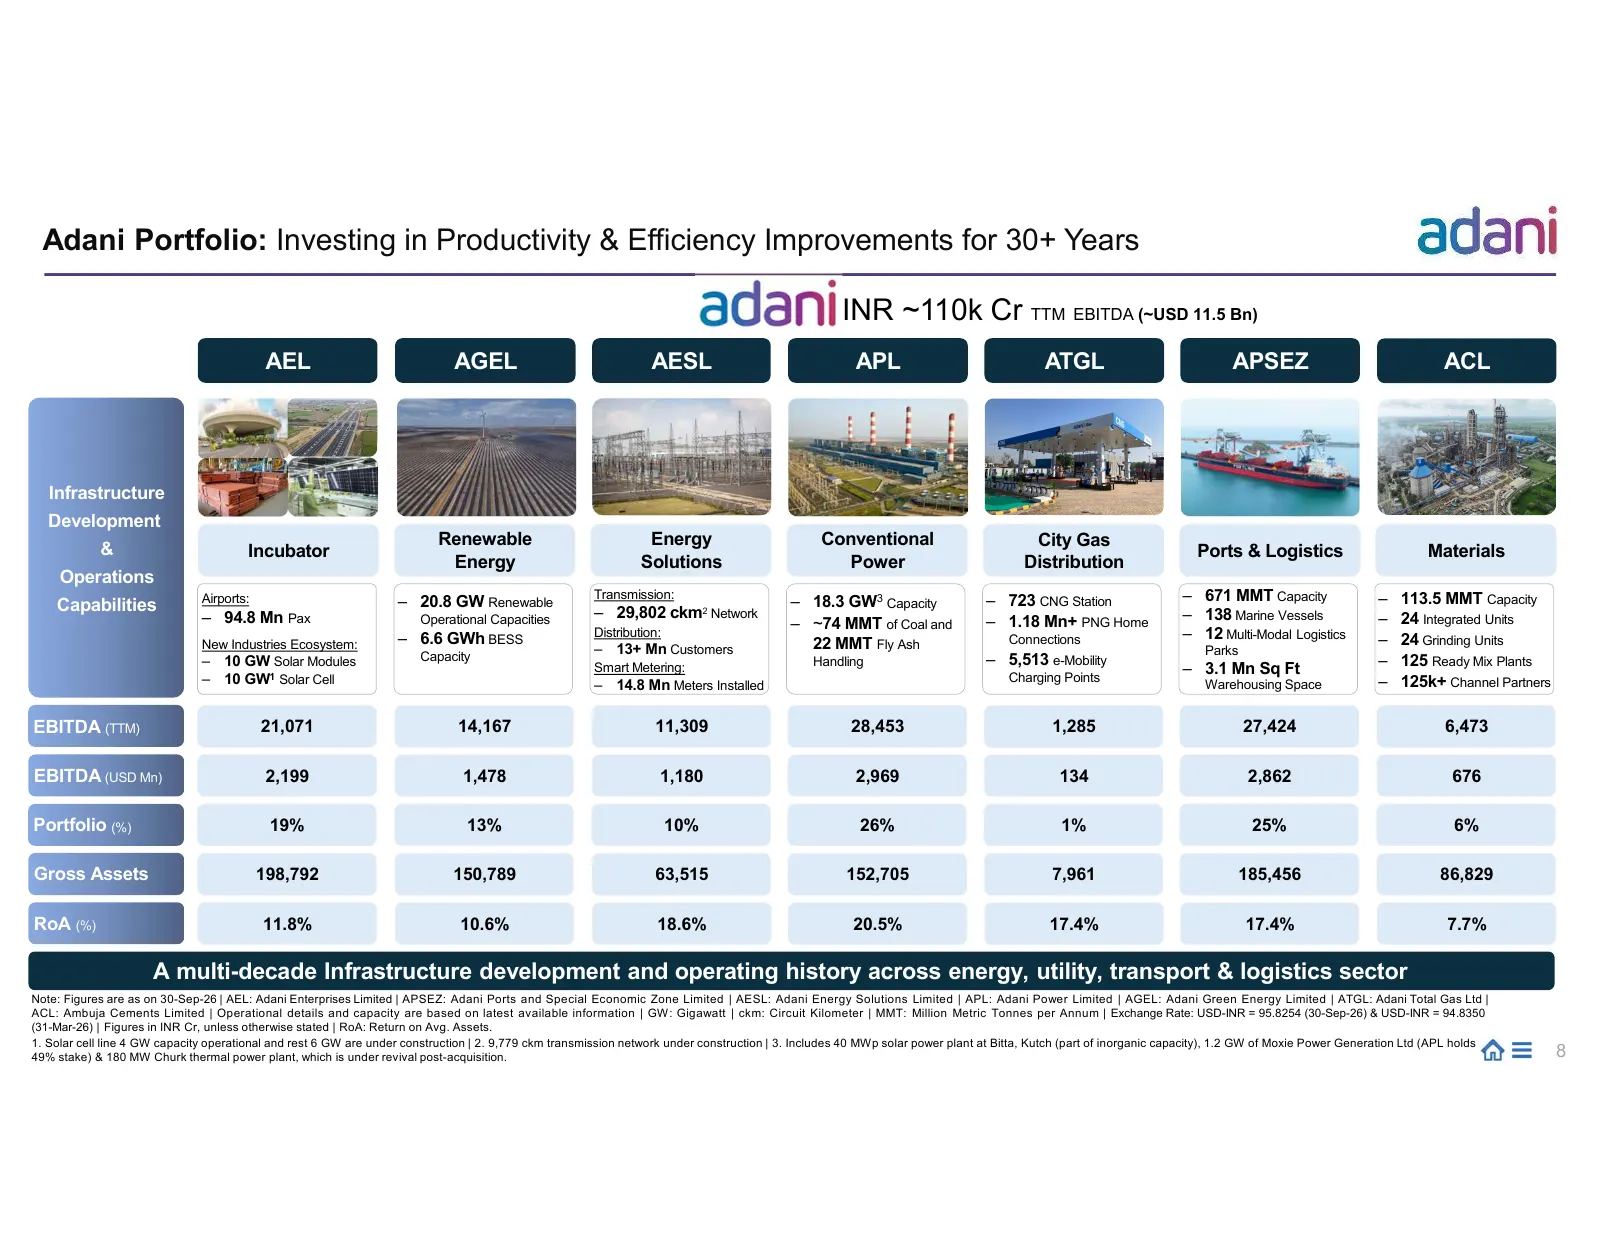
Slide 8: Investing in Productivity & Efficiency Improvements for 30+ Years
Adani Portfolio: Investing in Productivity & Efficiency Improvements for 30+ Years INR ~110k Cr TTM EBITDA (~USD 11.5 Bn) AEL AGEL AESL APL ATGL APSEZ ACL Infrastructure Development Renewable Energy Conventional City Gas & Incubator Ports & Logistics Materials Energy Solutions Power Distribution Ope
Slide 9: Adani Portfolio: Strong Business Performance
Adani Portfolio: Strong Business Performance STRICTLY CONFIDENTIAL
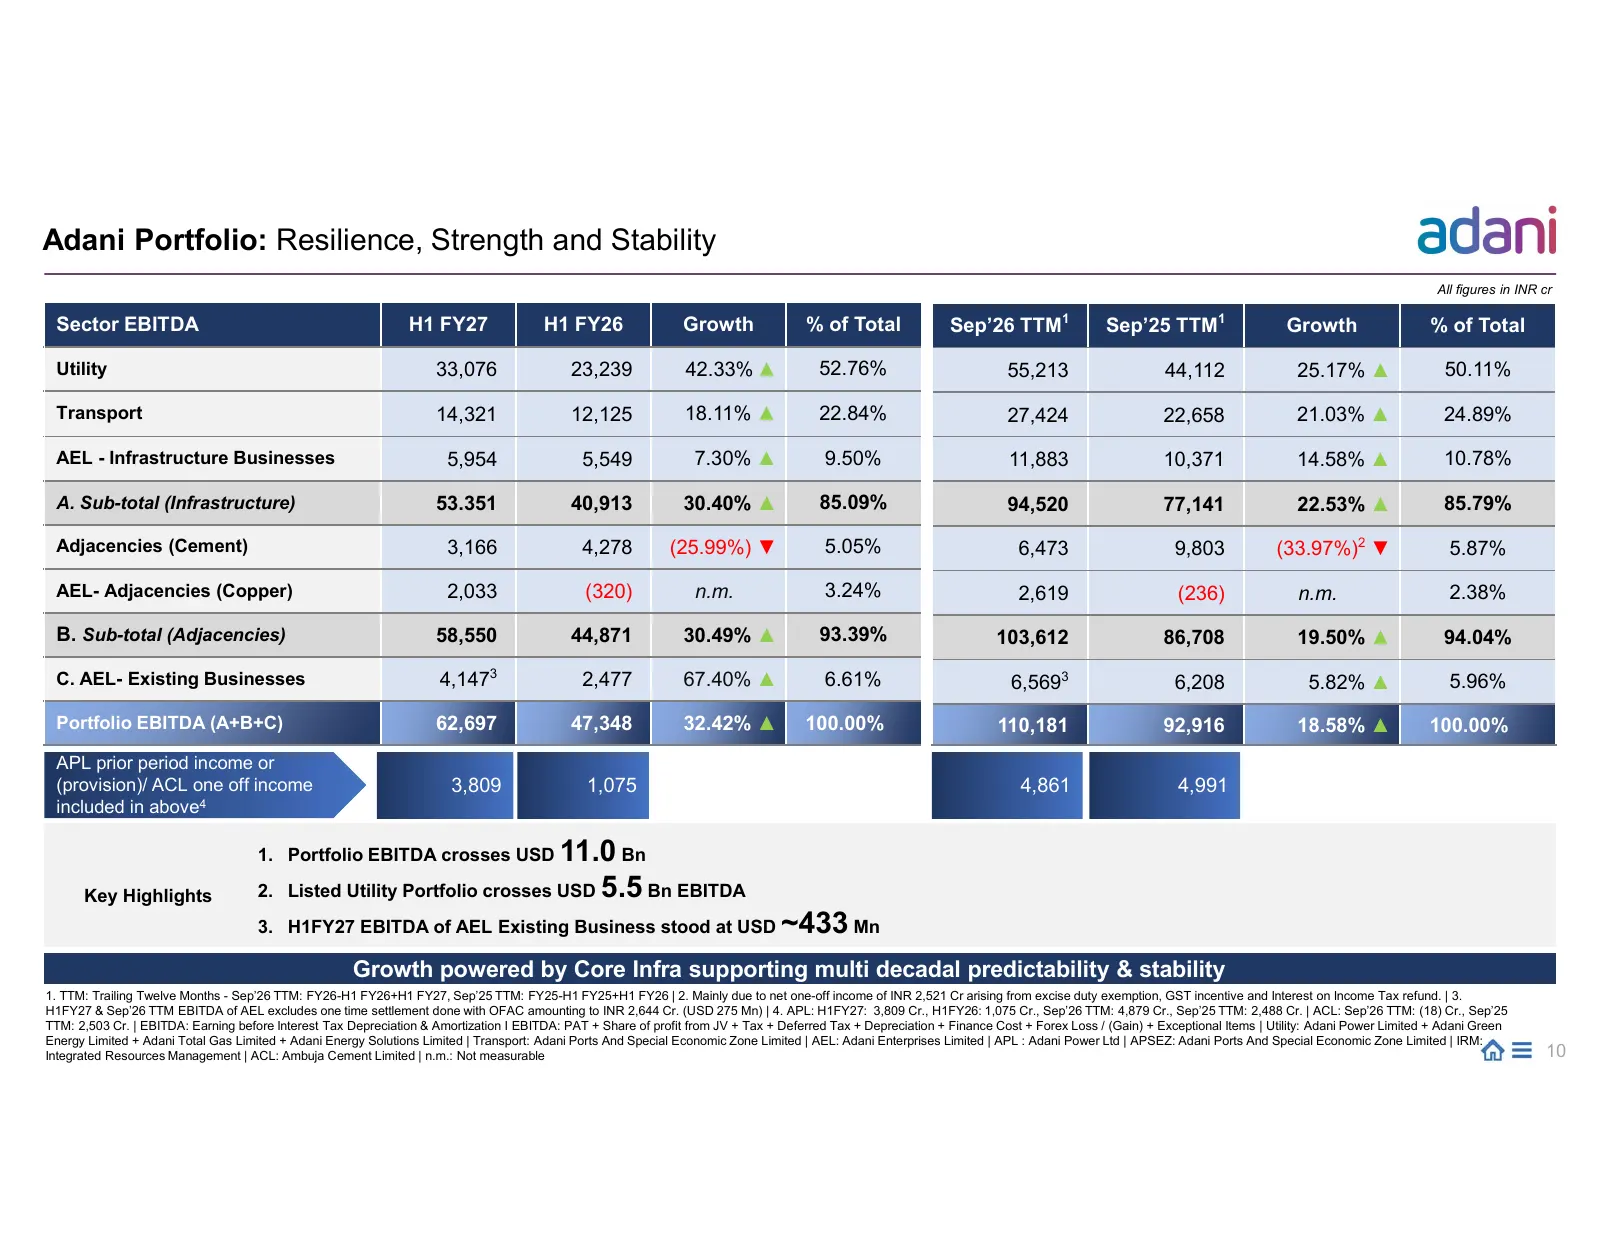
Slide 10: Resilience, Strength and Stability
Adani Portfolio: Resilience, Strength and Stability All figures in INR cr Sector EBITDA H1 FY27 H1 FY26 Growth % of Total Sep’26 TTM1 Sep’25 TTM1 Growth % of Total Utility 33,076 23,239 42.33% ▲ 52.76% 55,213 44,112 25.17% ▲ 50.11% Transport 14,321 12,125 18.11% ▲ 22.84% 27,424 22,658 21.03% ▲ 24.89
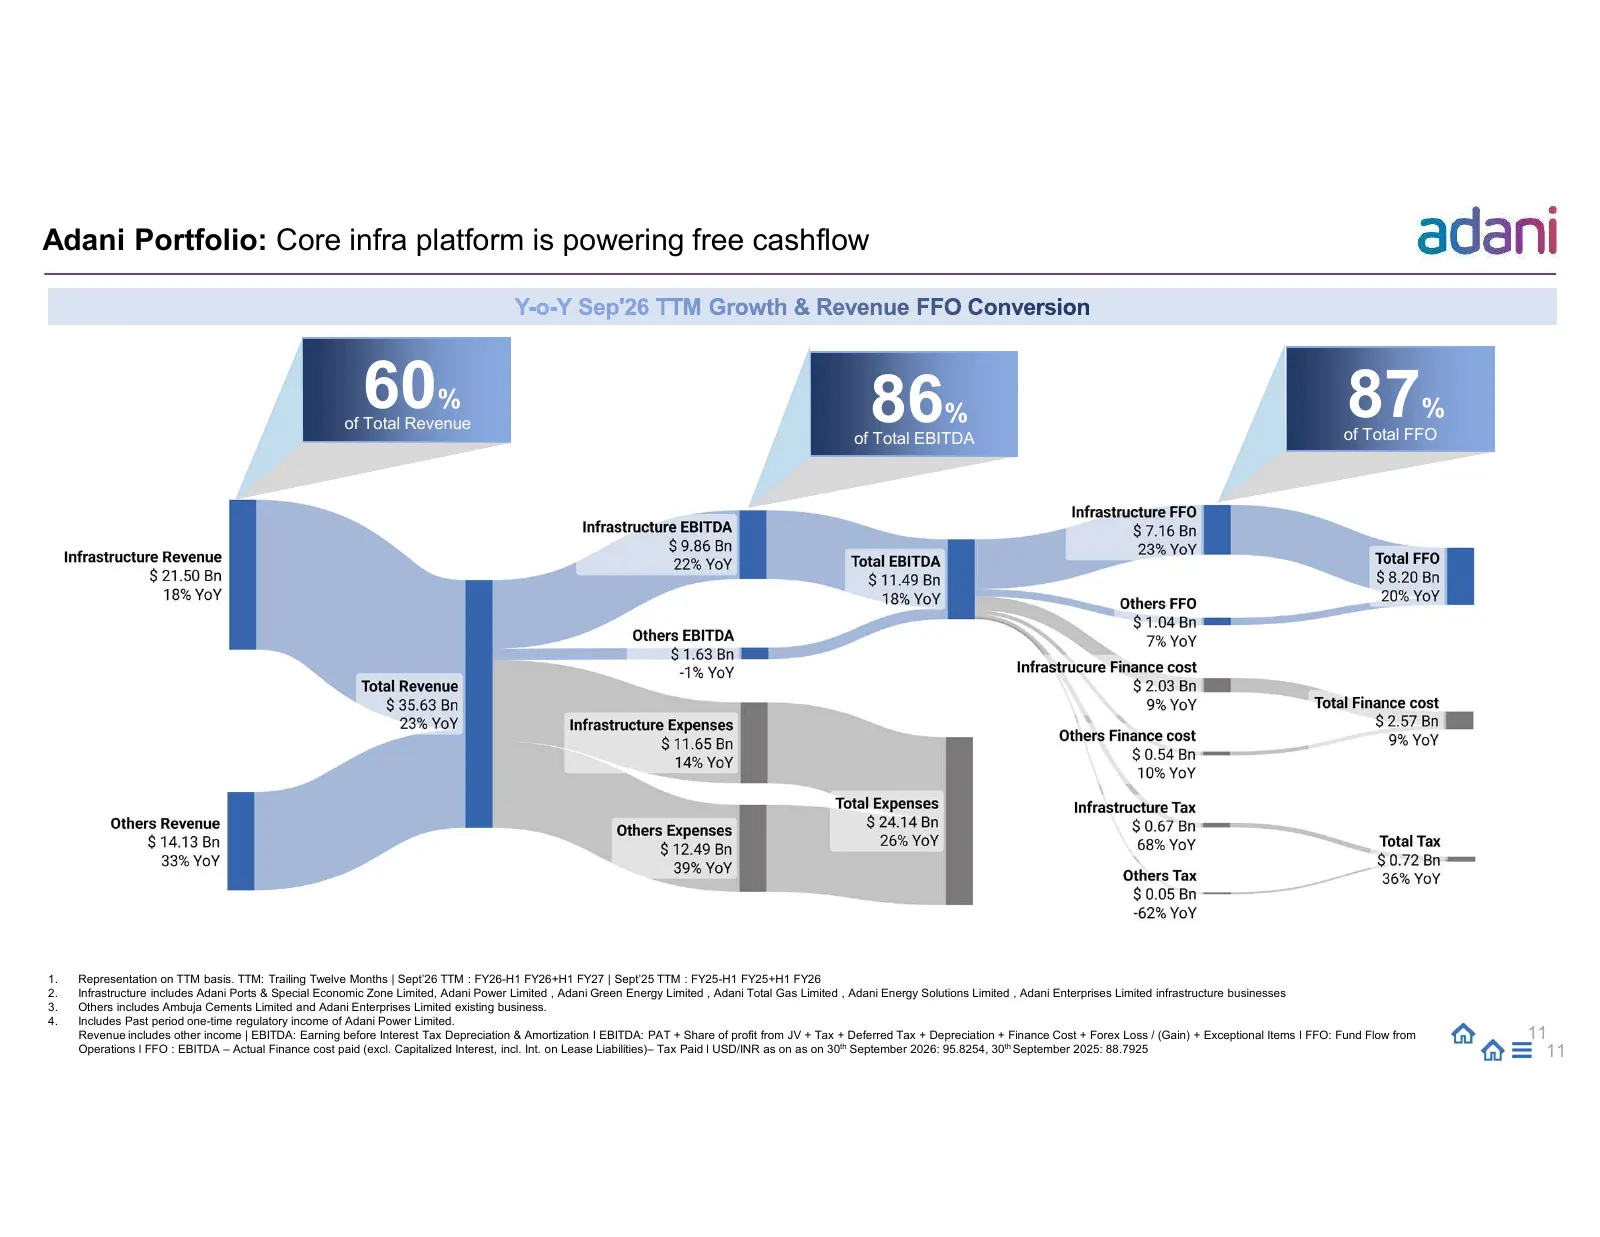
Slide 11: Core infra platform is powering free cashflow
Adani Portfolio: Core infra platform is powering free cashflow 60% of Total Revenue 86% 87% of Total FFO of Total Revenue of Total EBITDA 1. Representation on TTM basis. TTM: Trailing Twelve Months | Sept’26 TTM : FY26-H1 FY26+H1 FY27 | Sept’25 TTM : FY25-H1 FY25+H1 FY26 2. Infrastructure includes A
Slide 12: Adani Portfolio: Key Equity Theme
Adani Portfolio: Key Equity Theme STRICTLY CONFIDENTIAL
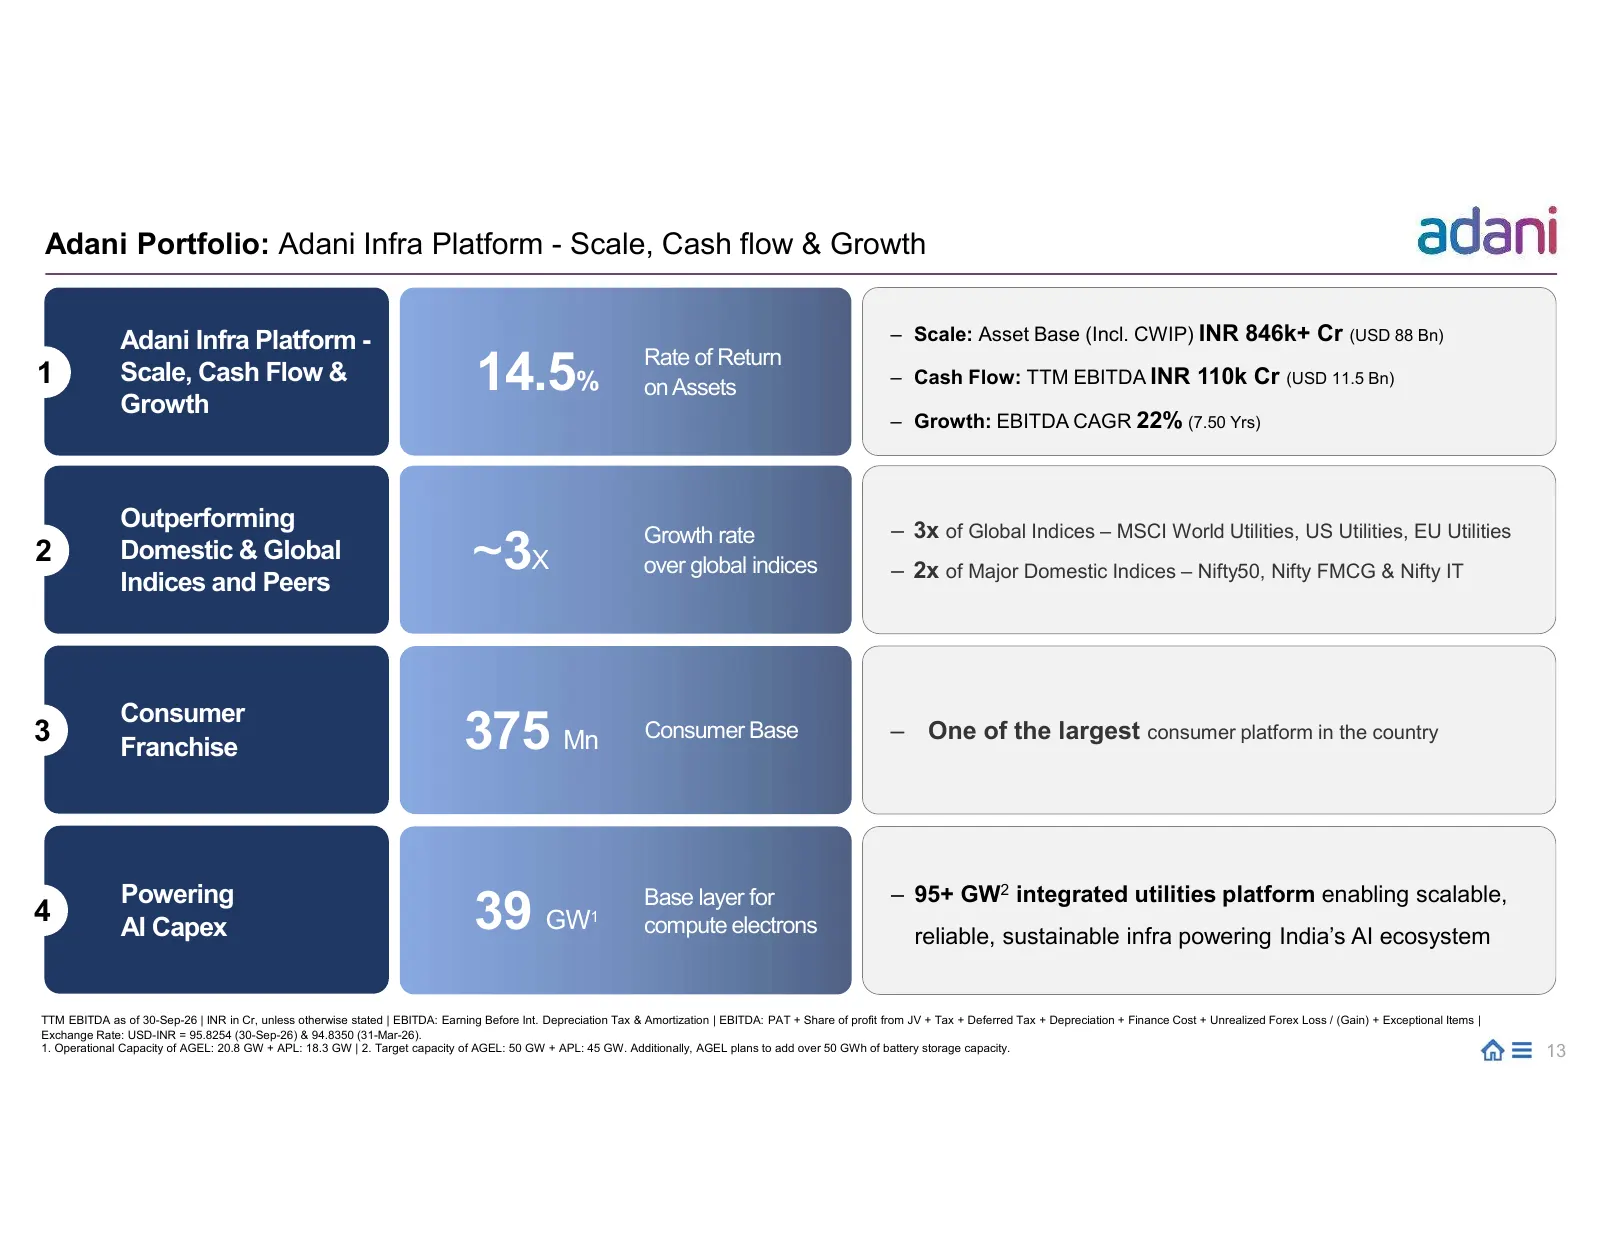
Slide 13: Infra Platform - Scale, Cash flow & Growth
Adani Portfolio: Adani Infra Platform - Scale, Cash flow & Growth Adani Infra Platform - – Scale: Asset Base (Incl. CWIP) INR 846k+ Cr (USD 88 Bn) 1 Scale, Cash Flow & Growth 14.5% Rate of Return on Assets – Cash Flow: TTM EBITDA INR 110k Cr (USD 11.5 Bn) – Growth: EBITDA CAGR 22% (7.50 Yrs) Outperf
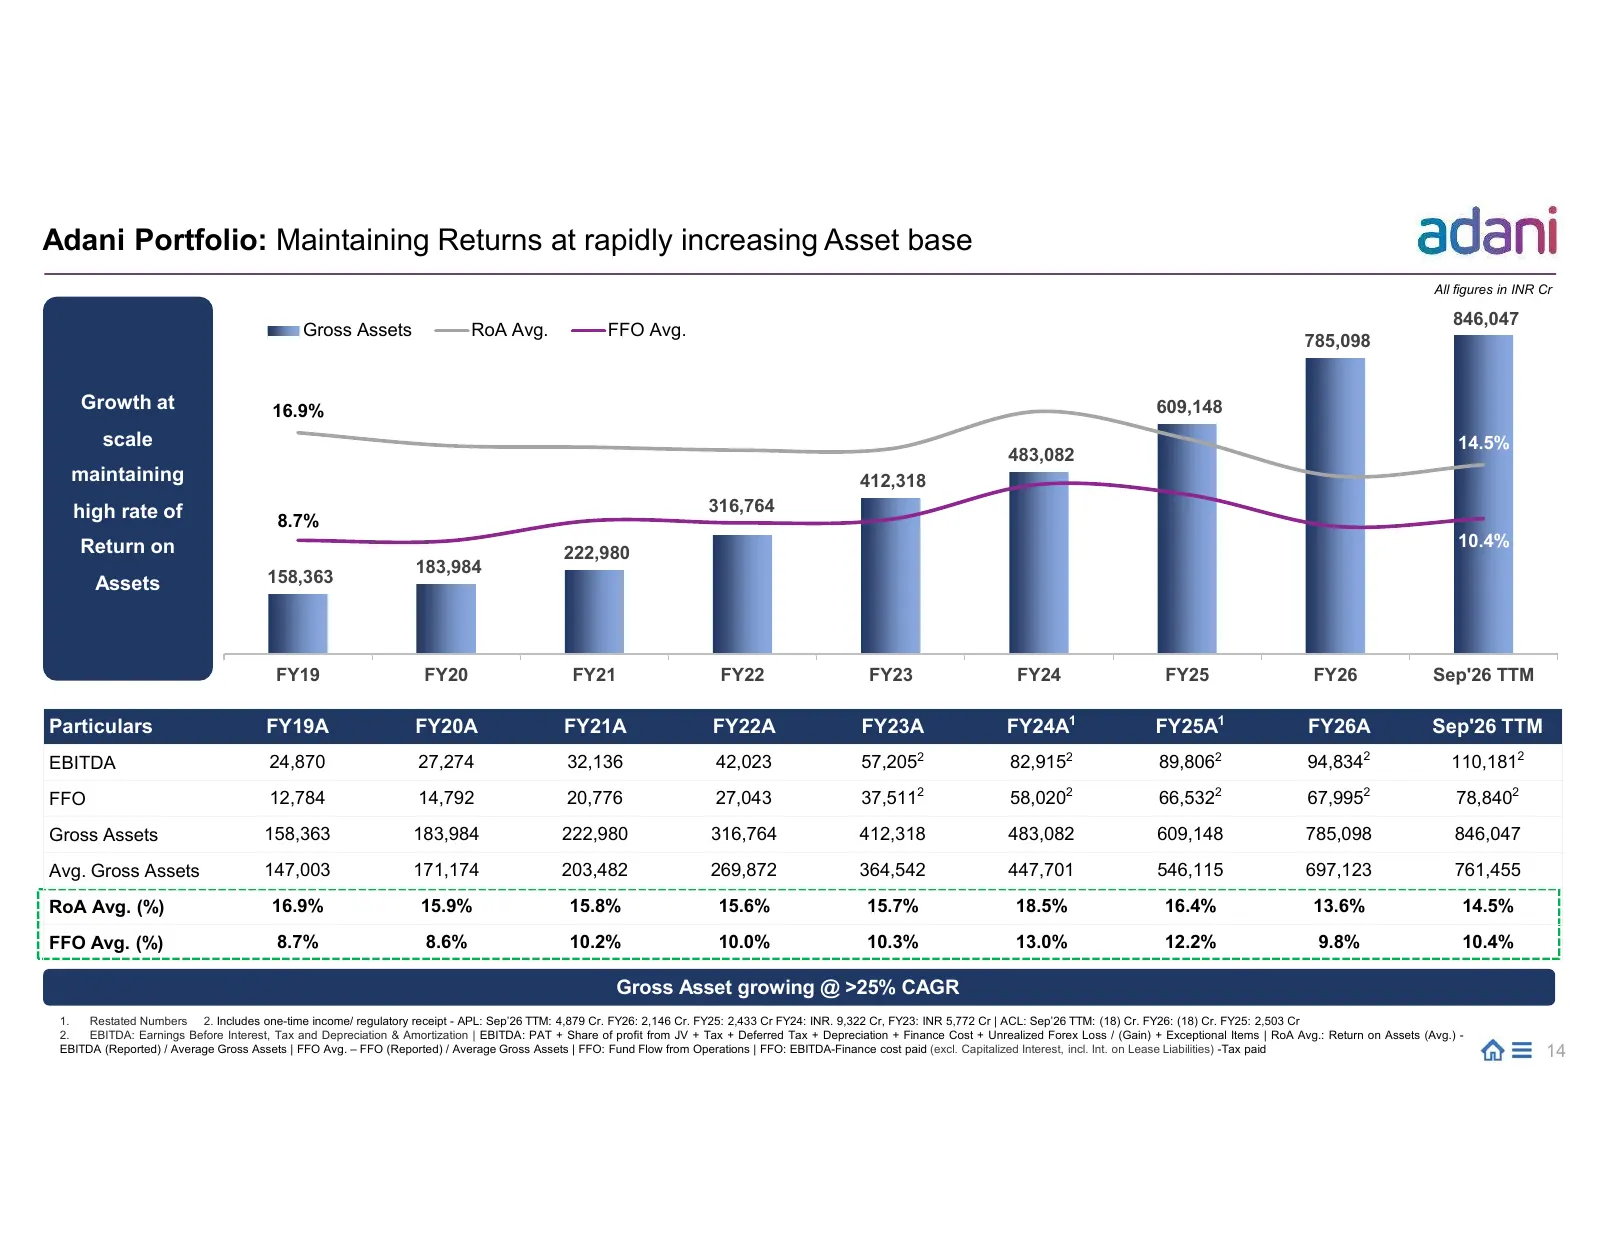
Slide 14: Maintaining Returns at rapidly increasing Asset base
Adani Portfolio: Maintaining Returns at rapidly increasing Asset base All figures in INR Cr 846,047 Gross Assets RoA Avg. FFO Avg. 785,098 Growth at 16.9% 609,148 scale 14.5% 483,082 maintaining 412,318 high rate of 316,764 8.7% Return on 10.4% 222,980 183,984 Assets 158,363 FY19 FY20 FY21 FY22 FY23
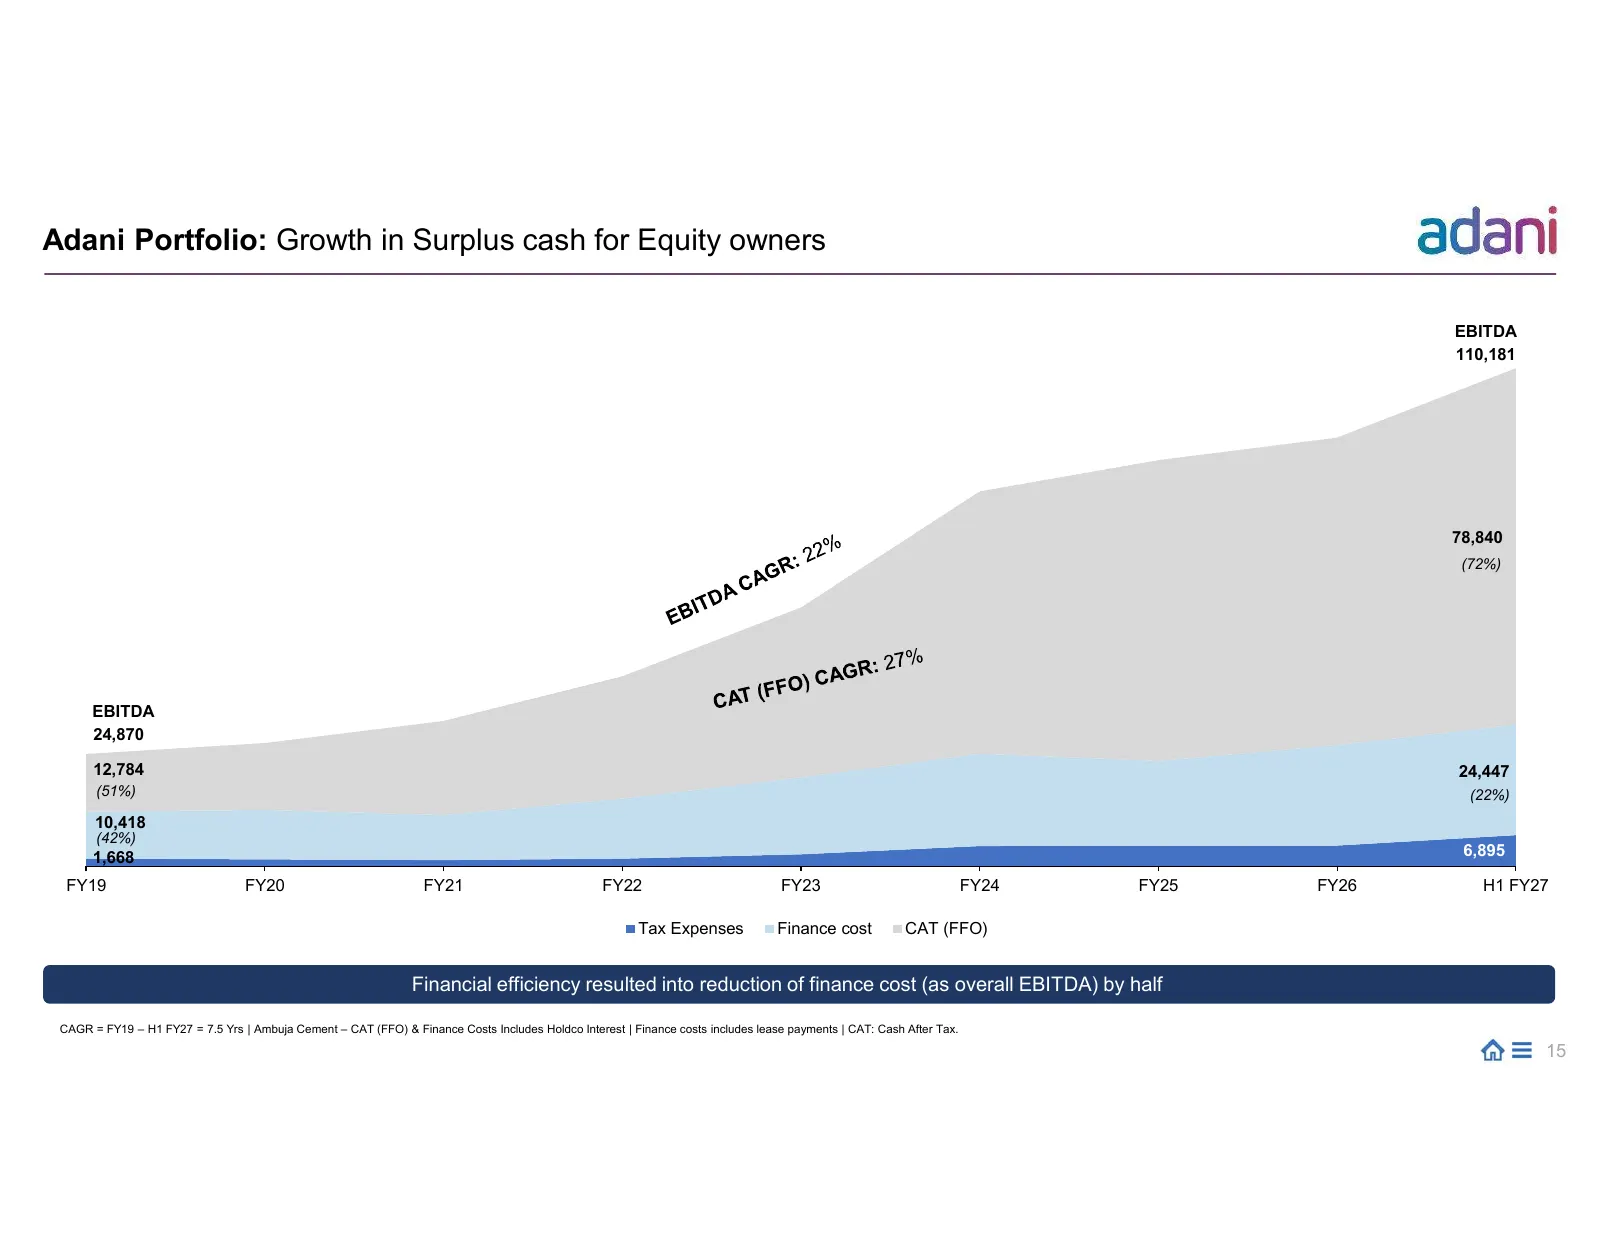
Slide 15: Growth in Surplus cash for Equity owners
Adani Portfolio: Growth in Surplus cash for Equity owners EBITDA 110,181 78,840 (72%) EBITDA 24,870 12,784 24,447 (51%) (22%) 10,418 (42%) 1,668 6,895 FY19 FY20 FY21 FY22 FY23 FY24 FY25 FY26 H1 FY27 Tax Expenses Finance cost CAT (FFO) Financial efficiency resulted into reduction of finance cost (as
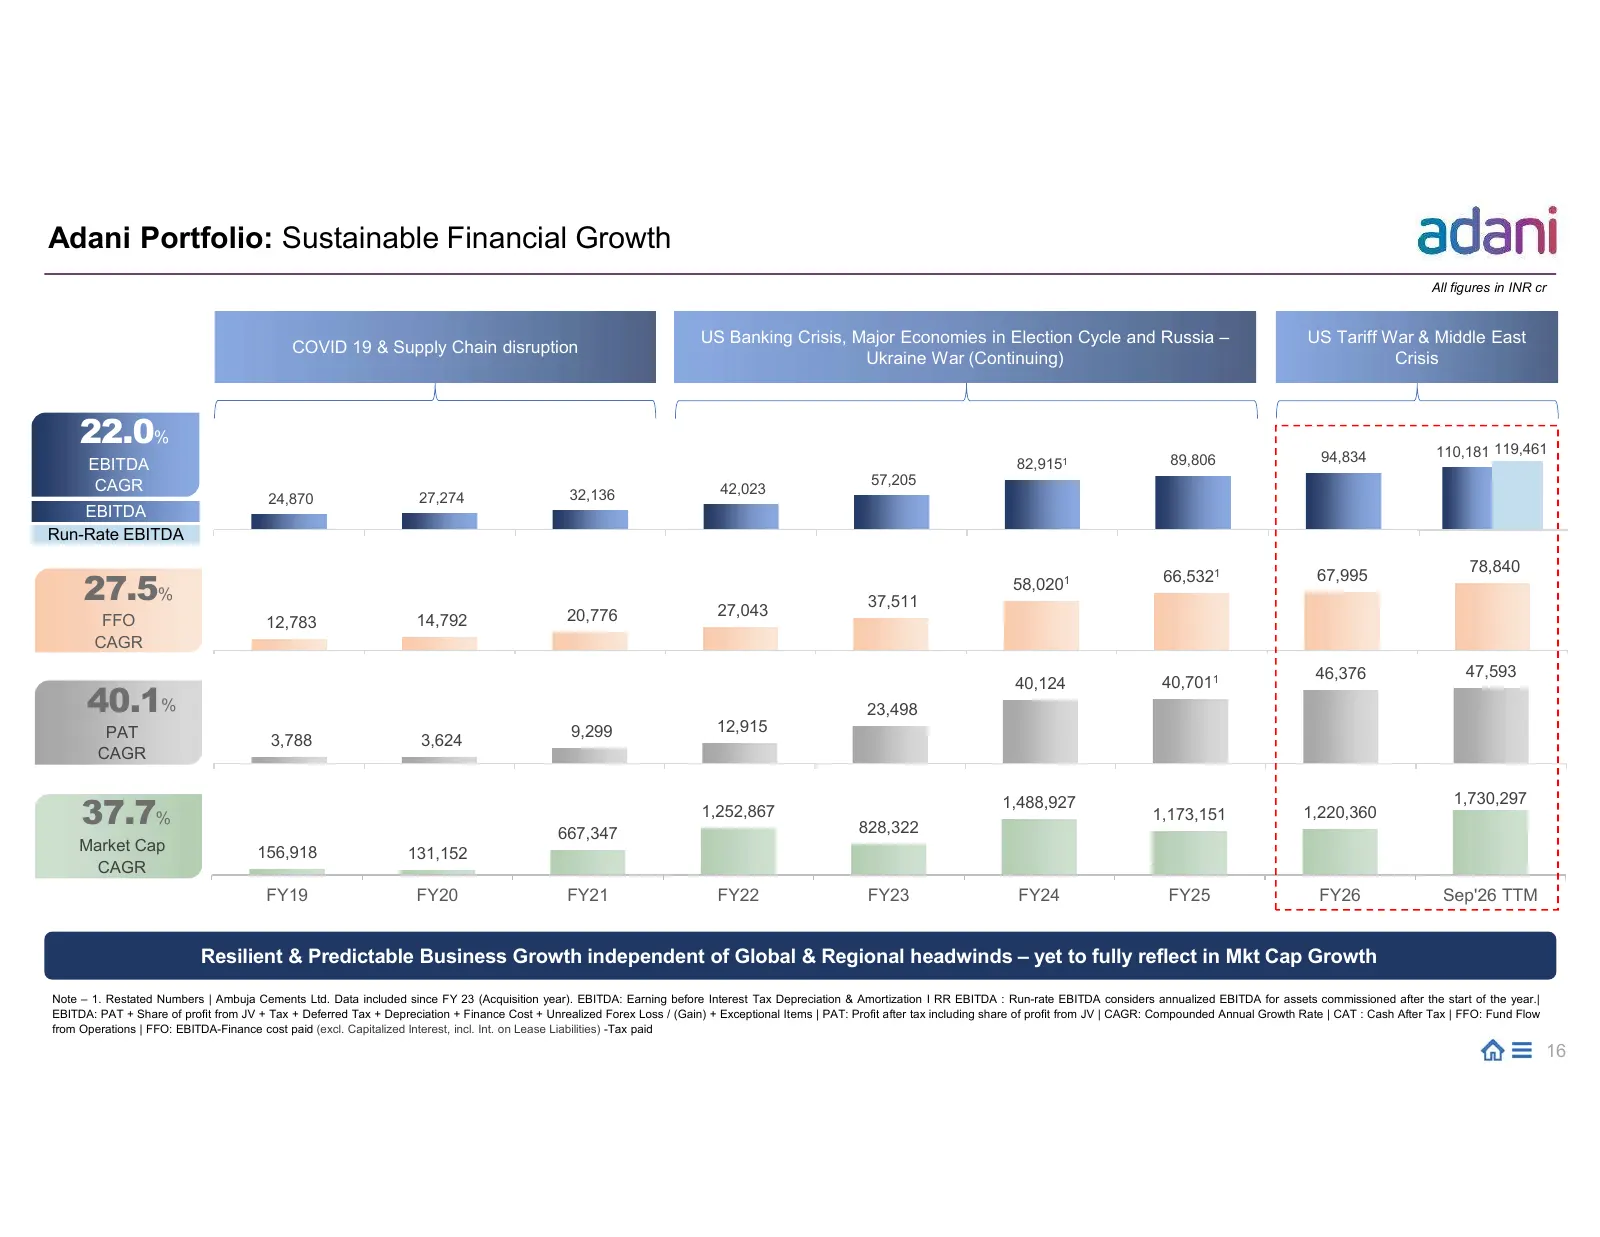
Slide 16: Sustainable Financial Growth
Adani Portfolio: Sustainable Financial Growth All figures in INR cr US Banking Crisis, Major Economies in Election Cycle and Russia – US Tariff War & Middle East COVID 19 & Supply Chain disruption Ukraine War (Continuing) Crisis 250,000 22.0% 200,000 150,000 94,834 110,181 119,461 EBITDA 100,000 82,
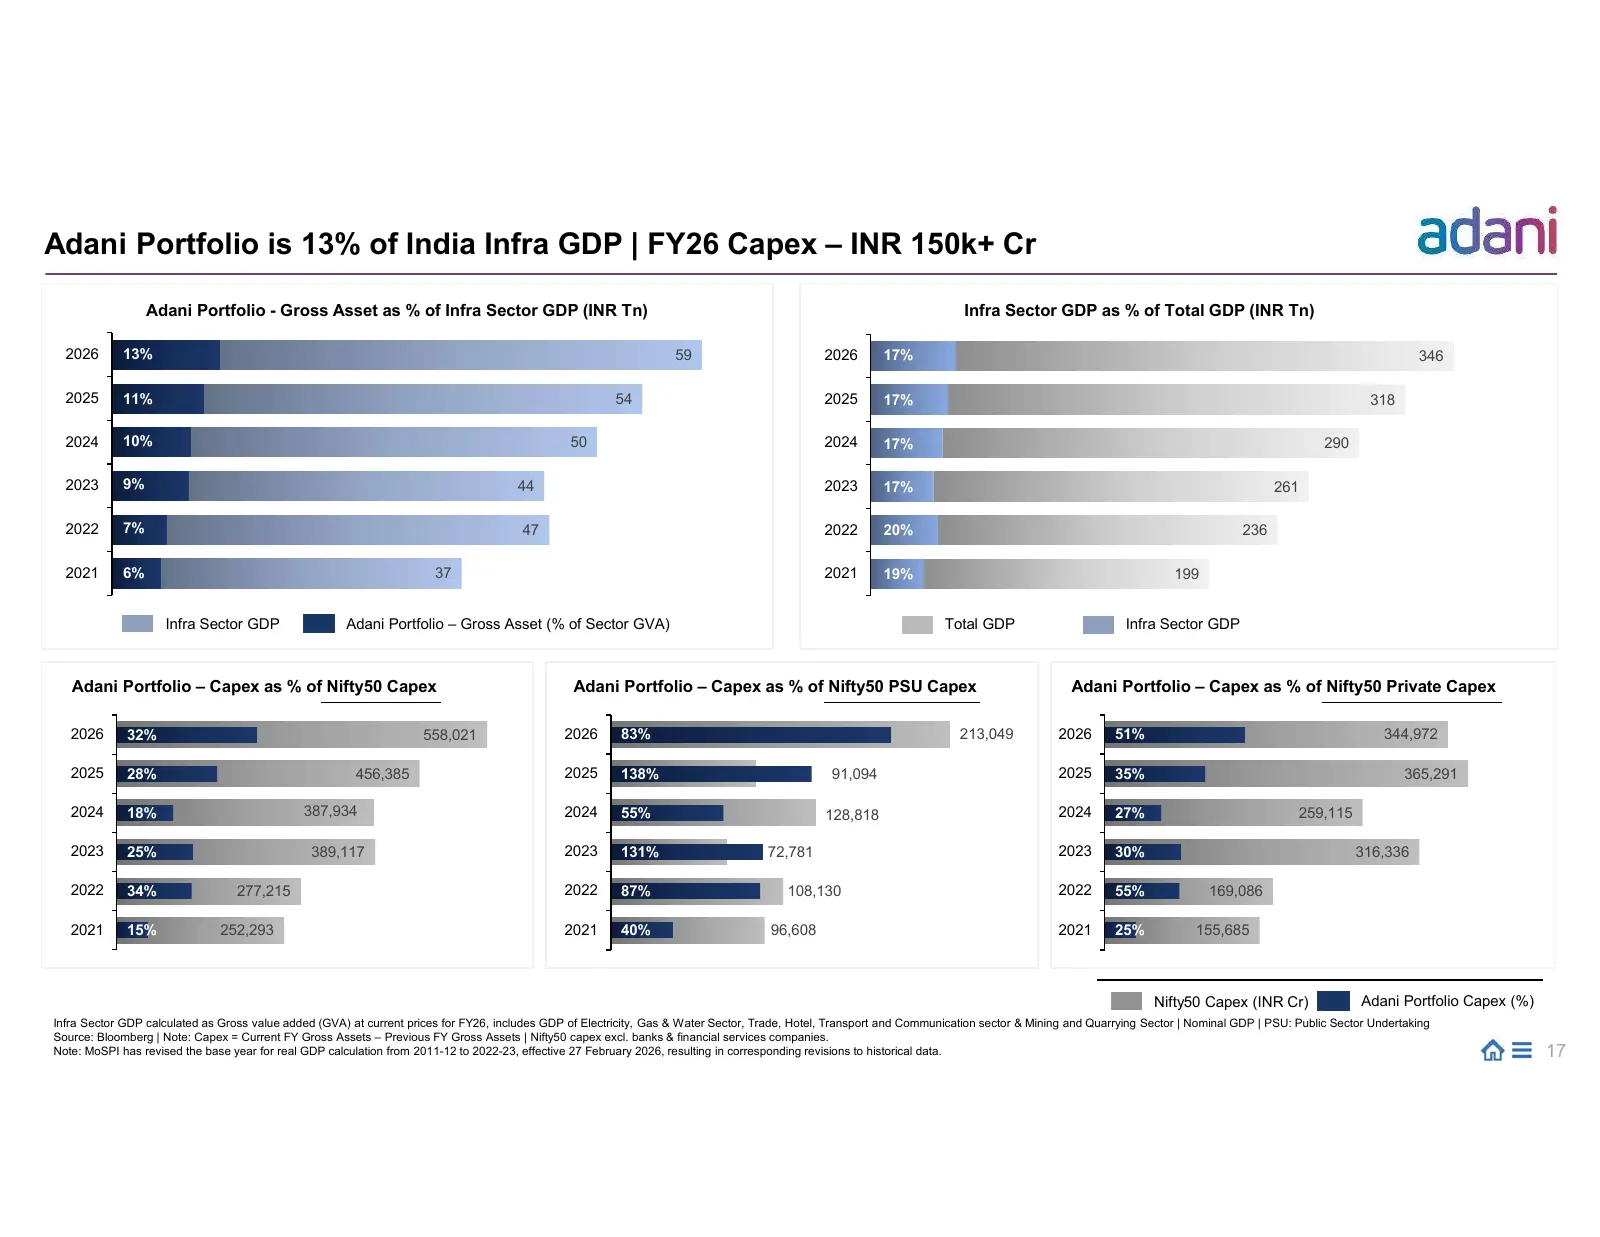
Slide 17: Portfolio is 13% of India Infra GDP
Adani Portfolio is 13% of India Infra GDP | FY26 Capex – INR 150k+ Cr Adani Portfolio - Gross Asset as % of Infra Sector GDP (INR Tn) Infra Sector GDP as % of Total GDP (INR Tn) 2026 13% 59 2026 17% 346 2025 11% 54 2025 17% 318 2024 10% 50 2024 17% 290 2023 9% 44 2023 17% 261 2022 7% 47 2022 20% 236
Slide 18: Risk Mitigation Framework
Adani Portfolio: Risk Mitigation Framework STRICTLY CONFIDENTIAL
Slide 19: Risk Evaluation Structure
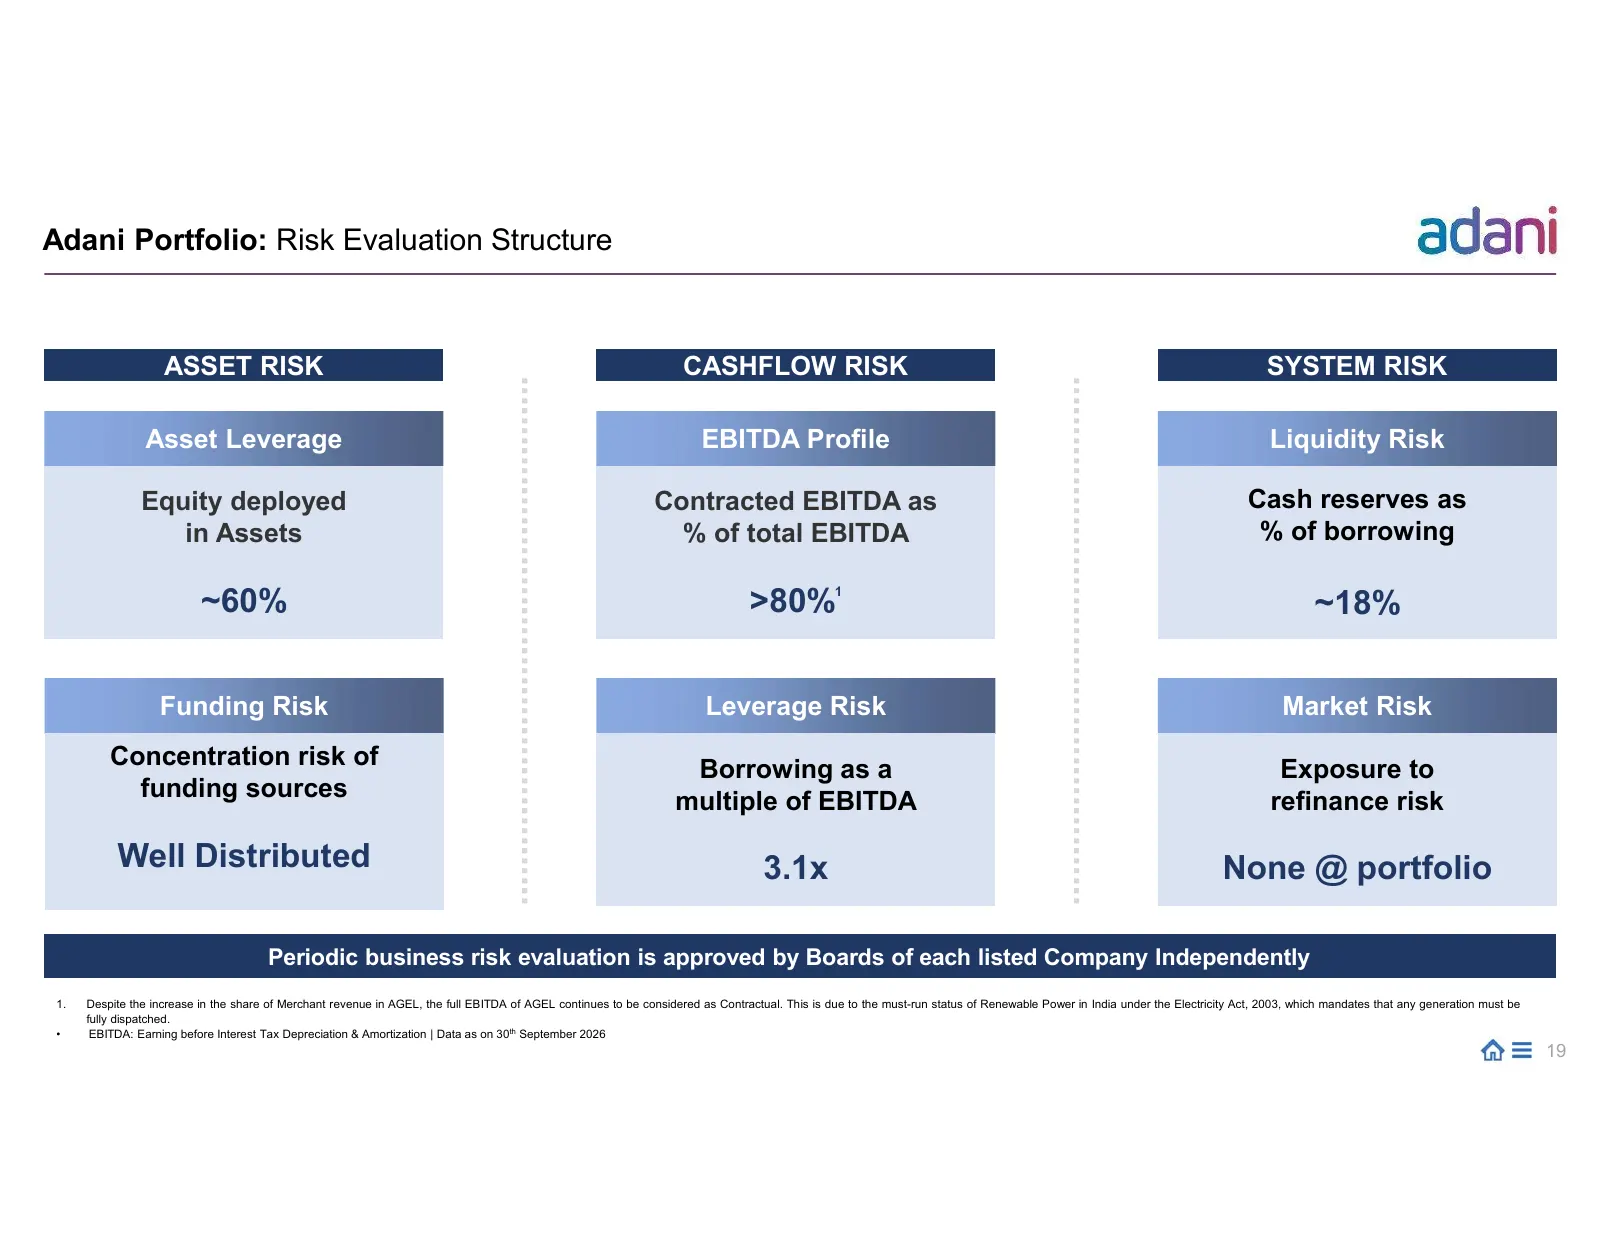
Adani Portfolio: Risk Evaluation Structure ASSET RISK CASHFLOW RISK SYSTEM RISK Asset Leverage EBITDA Profile Liquidity Risk Equity deployed Contracted EBITDA as Cash reserves as in Assets % of total EBITDA % of borrowing ~60% >80% 1 ~18% Funding Risk Leverage Risk Market Risk Concentration risk of
Slide 20: High growth profile & Credit Discipline
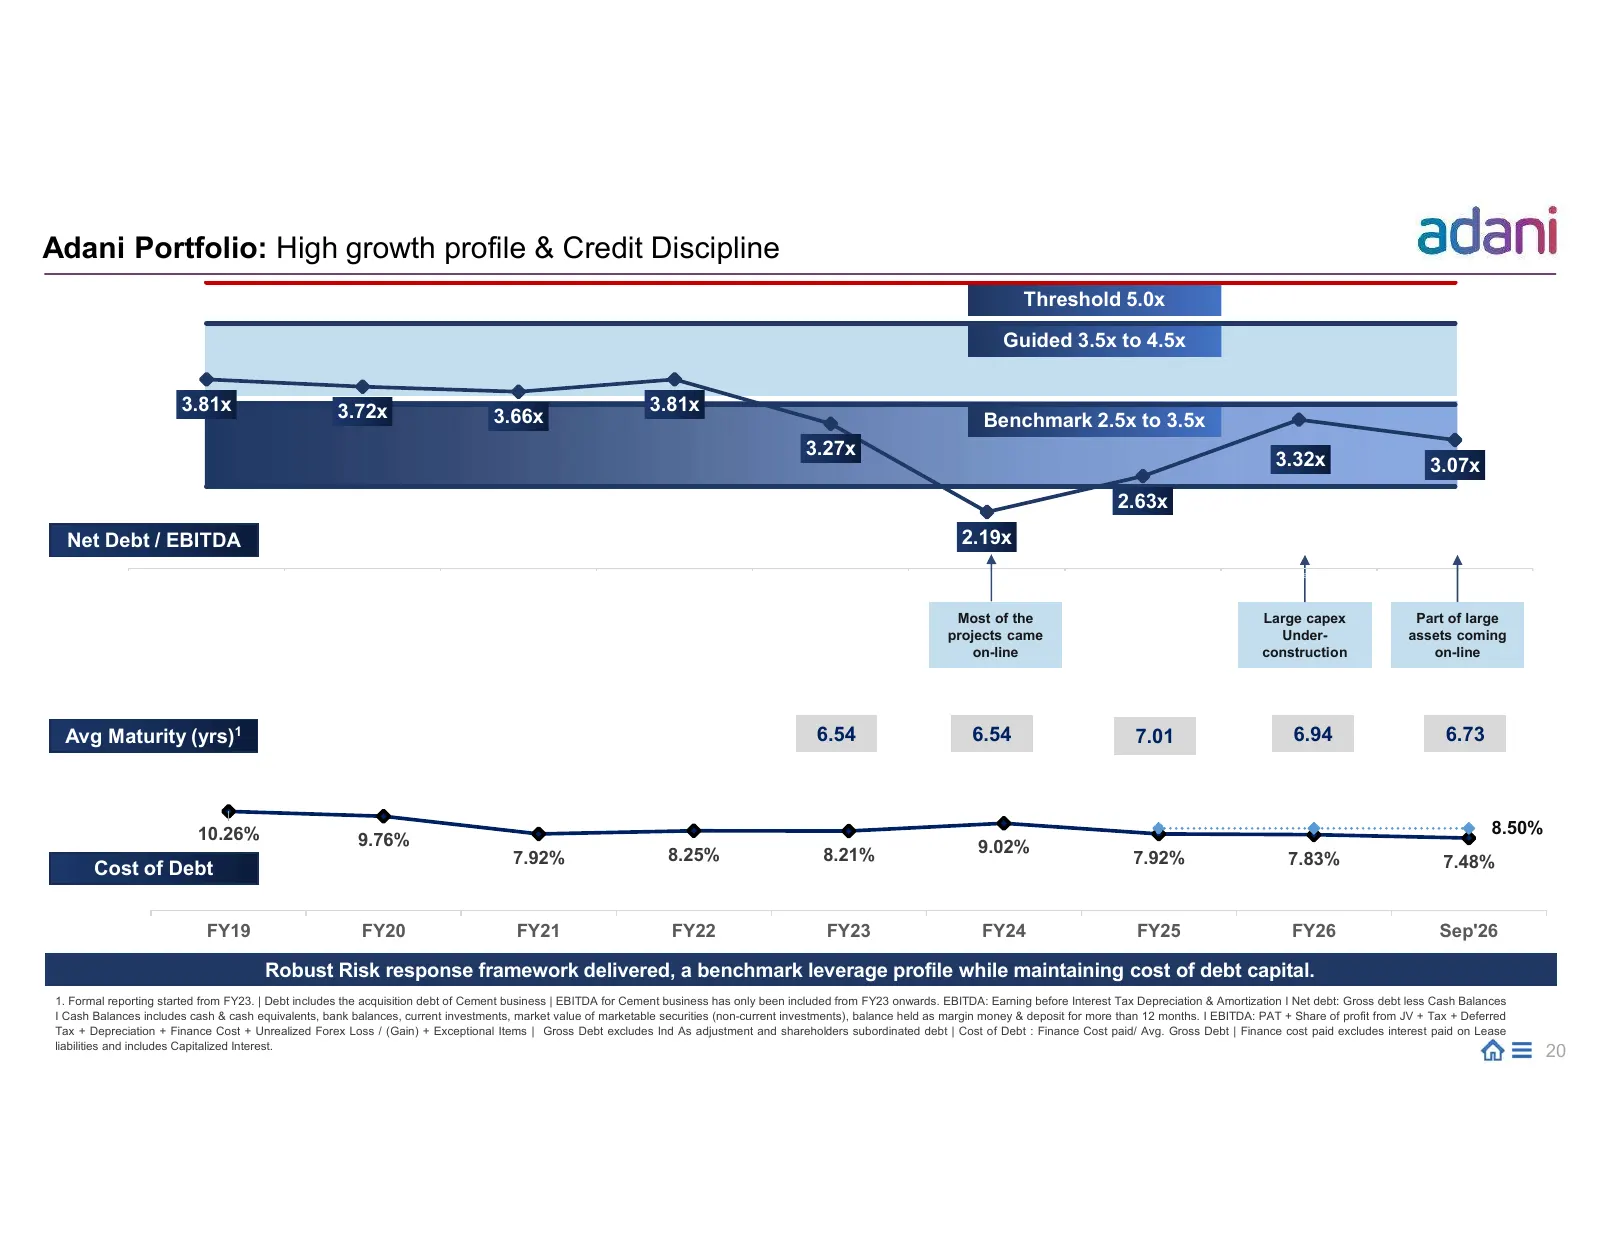
Adani Portfolio: High growth profile & Credit Discipline Threshold 5.0x Guided 3.5x to 4.5x 3.81x 3.72x 3.81x 3.66x Benchmark 2.5x to 3.5x 3.27x 3.32x 3.07x 2.63x Net Debt / EBITDA 2.19x FY19 FY20 FY21 FY22 FY23 FY24 FY25 FY26 Sep'26 TTM Most of the Large capex Part of large projects came Under- ass
Slide 21: Well distributed EBITDA contribution
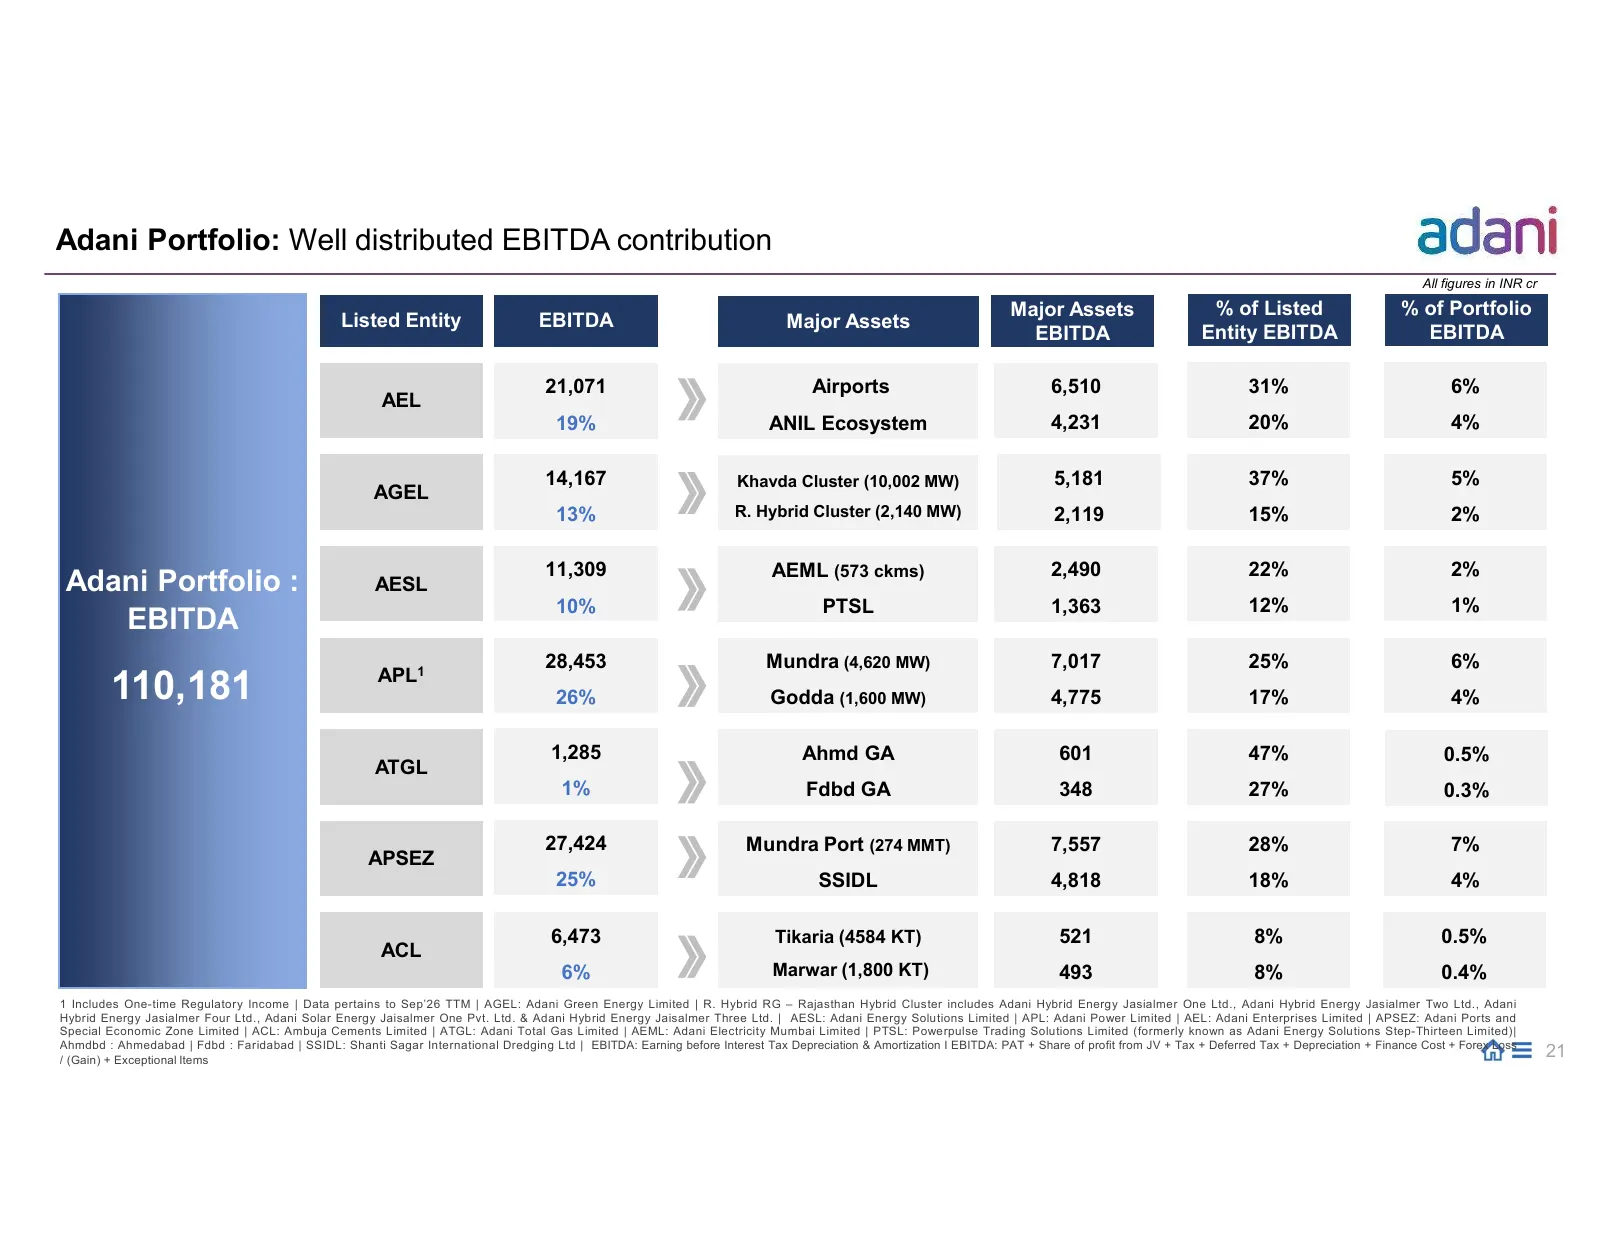
Adani Portfolio: Well distributed EBITDA contribution All figures in INR cr Major Assets % of Listed % of Portfolio Listed Entity EBITDA Major Assets EBITDA Entity EBITDA EBITDA 21,071 Airports 6,510 31% 6% AEL 19% ANIL Ecosystem 4,231 20% 4% 14,167 Khavda Cluster (10,002 MW) 5,181 37% 5% AGEL 13% R
Slide 22: Distributed geographically diverse asset base
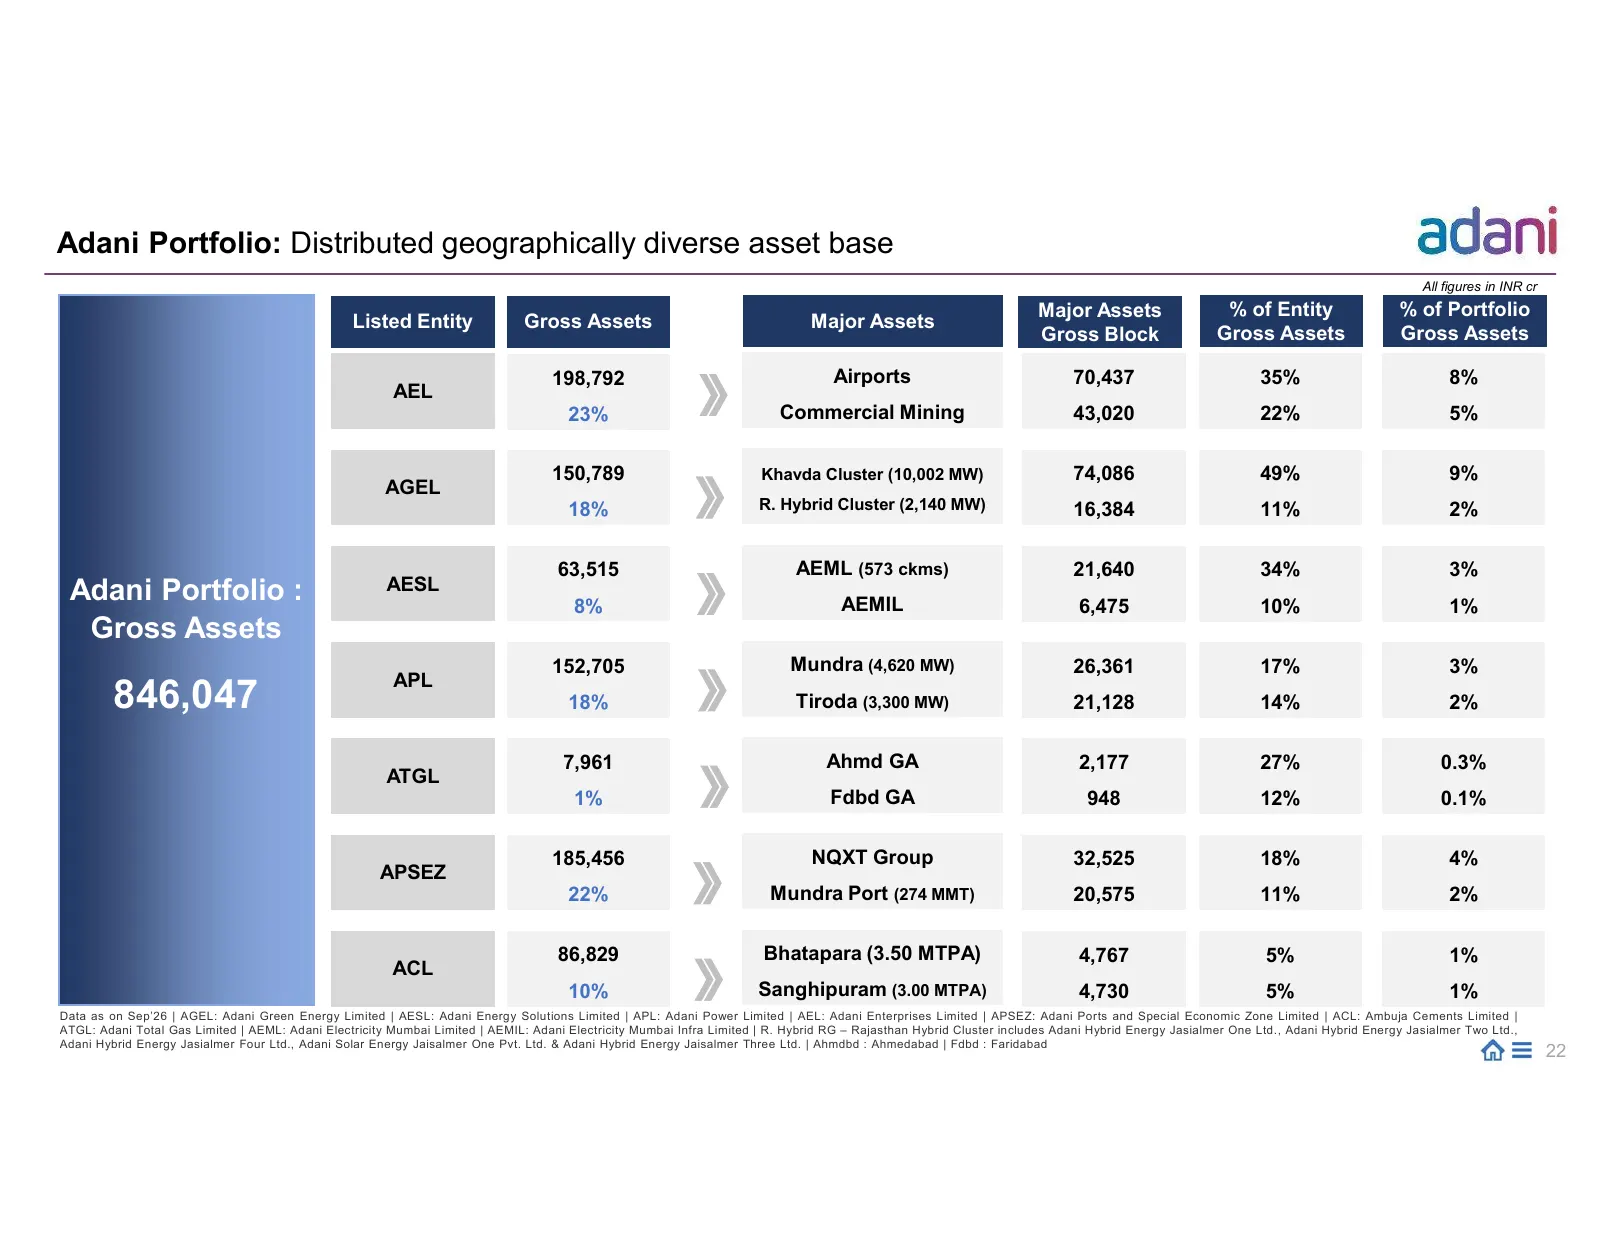
Adani Portfolio: Distributed geographically diverse asset base All figures in INR cr Major Assets % of Entity % of Portfolio Listed Entity Gross Assets Major Assets Gross Block Gross Assets Gross Assets 198,792 Airports 70,437 35% 8% AEL 23% Commercial Mining 43,020 22% 5% 150,789 Khavda Cluster (10
Slide 23: Market Comps Analytics
Adani Portfolio: Market Comps Analytics STRICTLY CONFIDENTIAL
Slide 24: Indian Indices - Comp Analysis
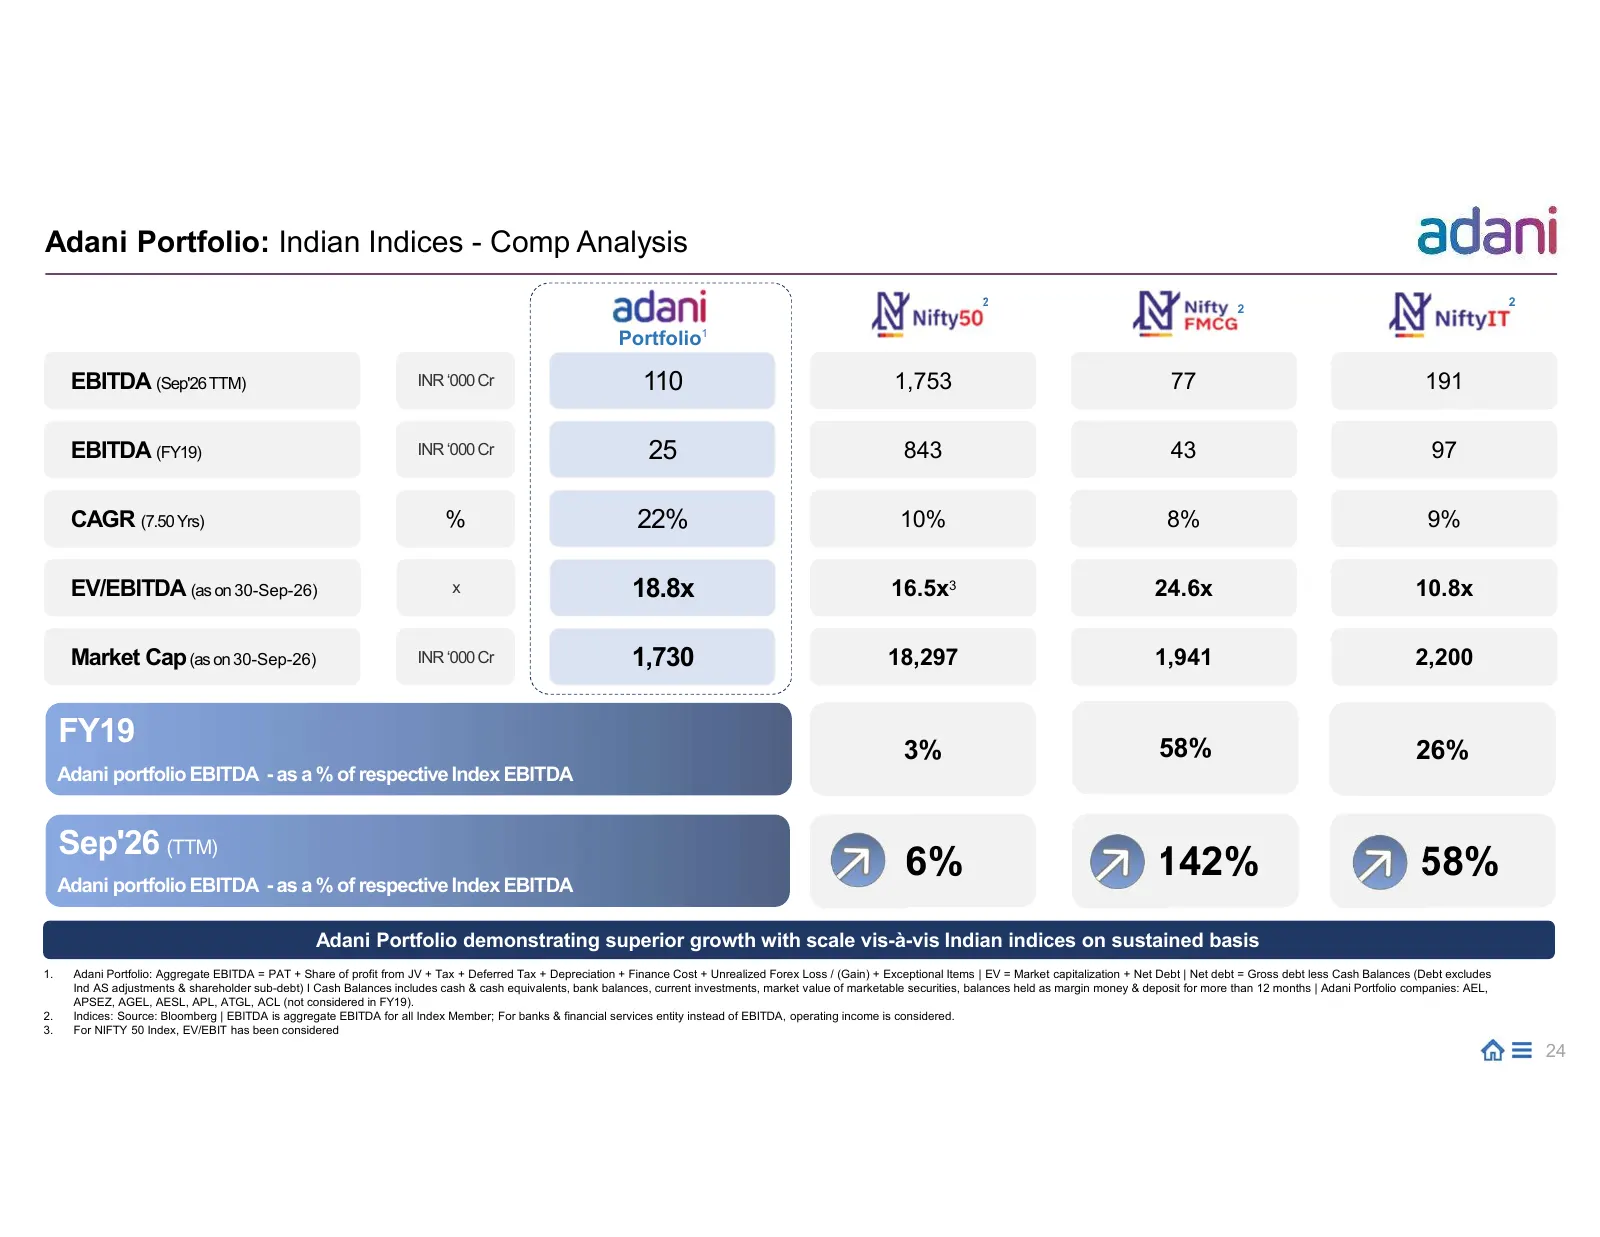
Adani Portfolio: Indian Indices - Comp Analysis 2 2 2 Portfolio1 EBITDA (Sep'26 TTM) INR ‘000 Cr 110 1,753 77 191 EBITDA (FY19) INR ‘000 Cr 25 843 43 97 CAGR (7.50 Yrs) % 22% 10% 8% 9% EV/EBITDA (as on 30-Sep-26) x 18.8x 16.5x3 24.6x 10.8x Market Cap (as on 30-Sep-26) INR ‘000 Cr 1,730 18,297 1,941
Slide 25: Re-investment of FCF, resulting higher shareholders' return
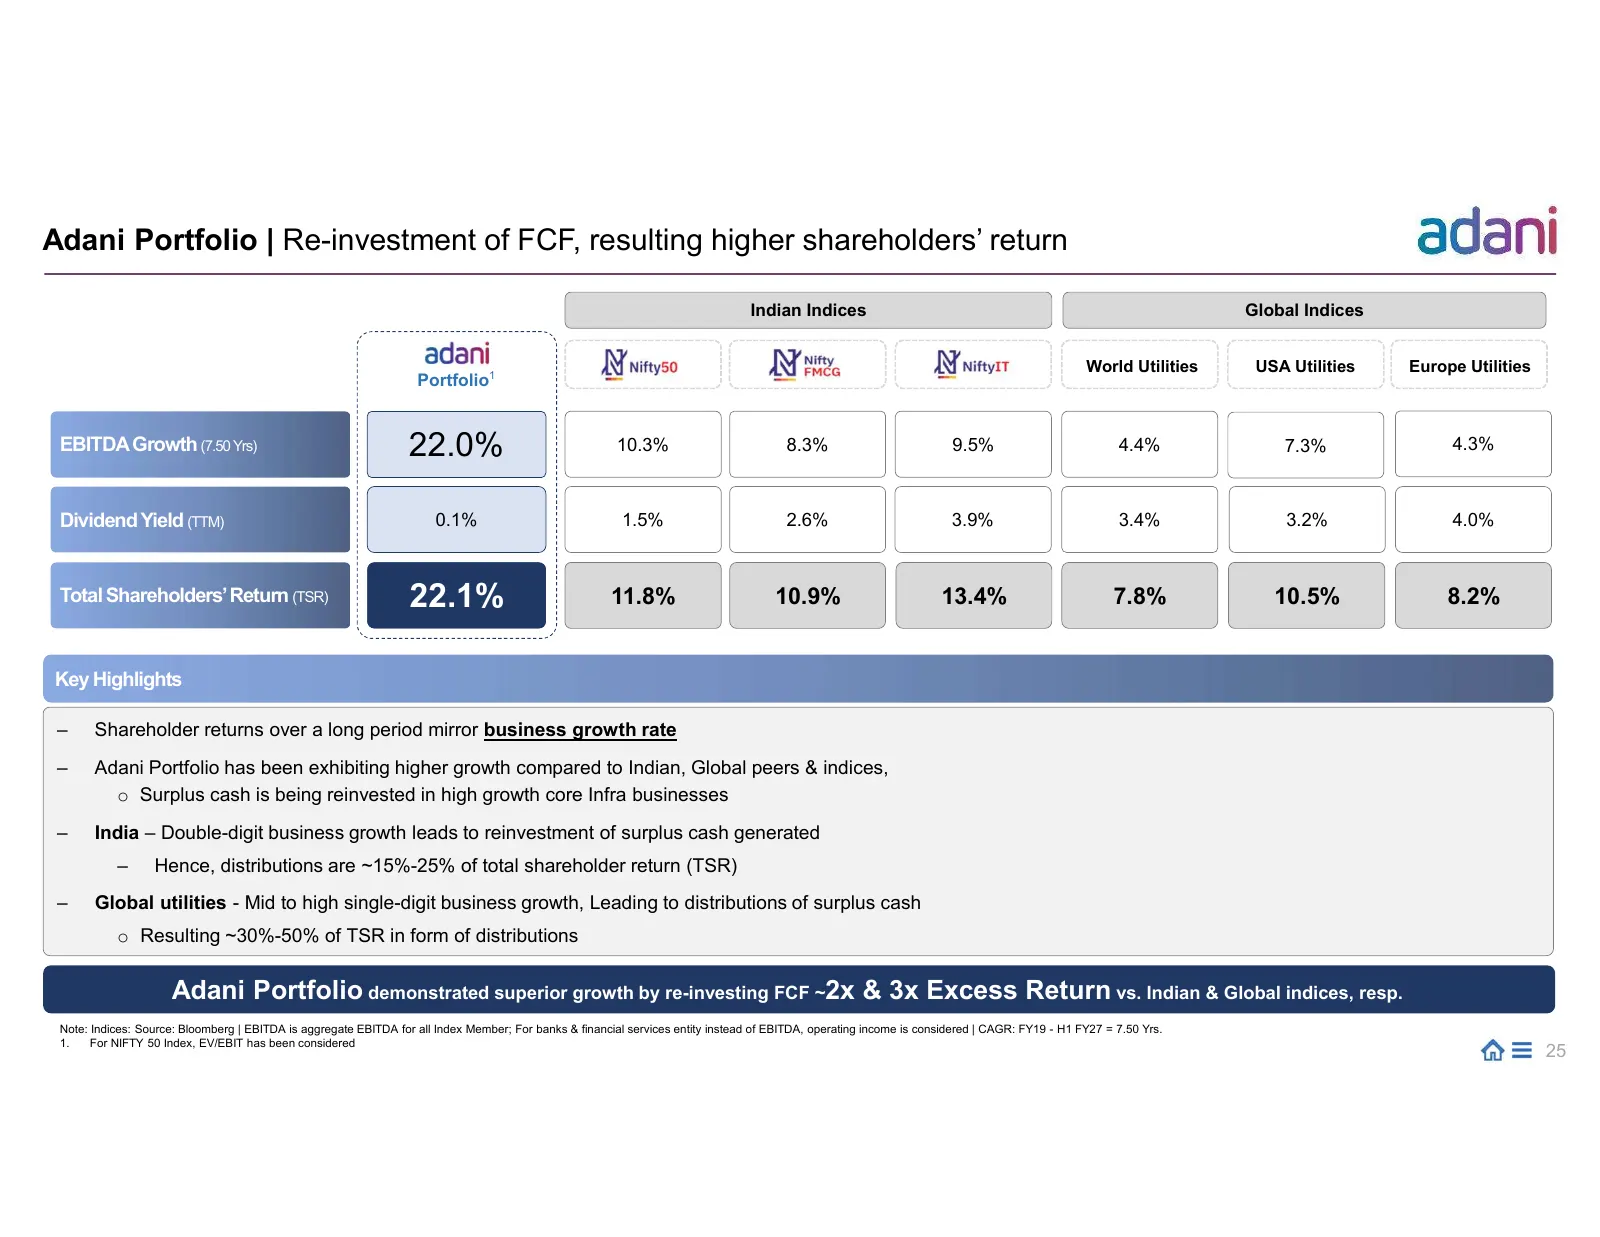
Adani Portfolio | Re-investment of FCF, resulting higher shareholders’ return Indian Indices Global Indices World Utilities USA Utilities Europe Utilities Portfolio1 EBITDA Growth (7.50 Yrs) 22.0% 10.3% 8.3% 9.5% 4.4% 7.3% 4.3% Dividend Yield (TTM) 0.1% 1.5% 2.6% 3.9% 3.4% 3.2% 4.0% Total Shareholde
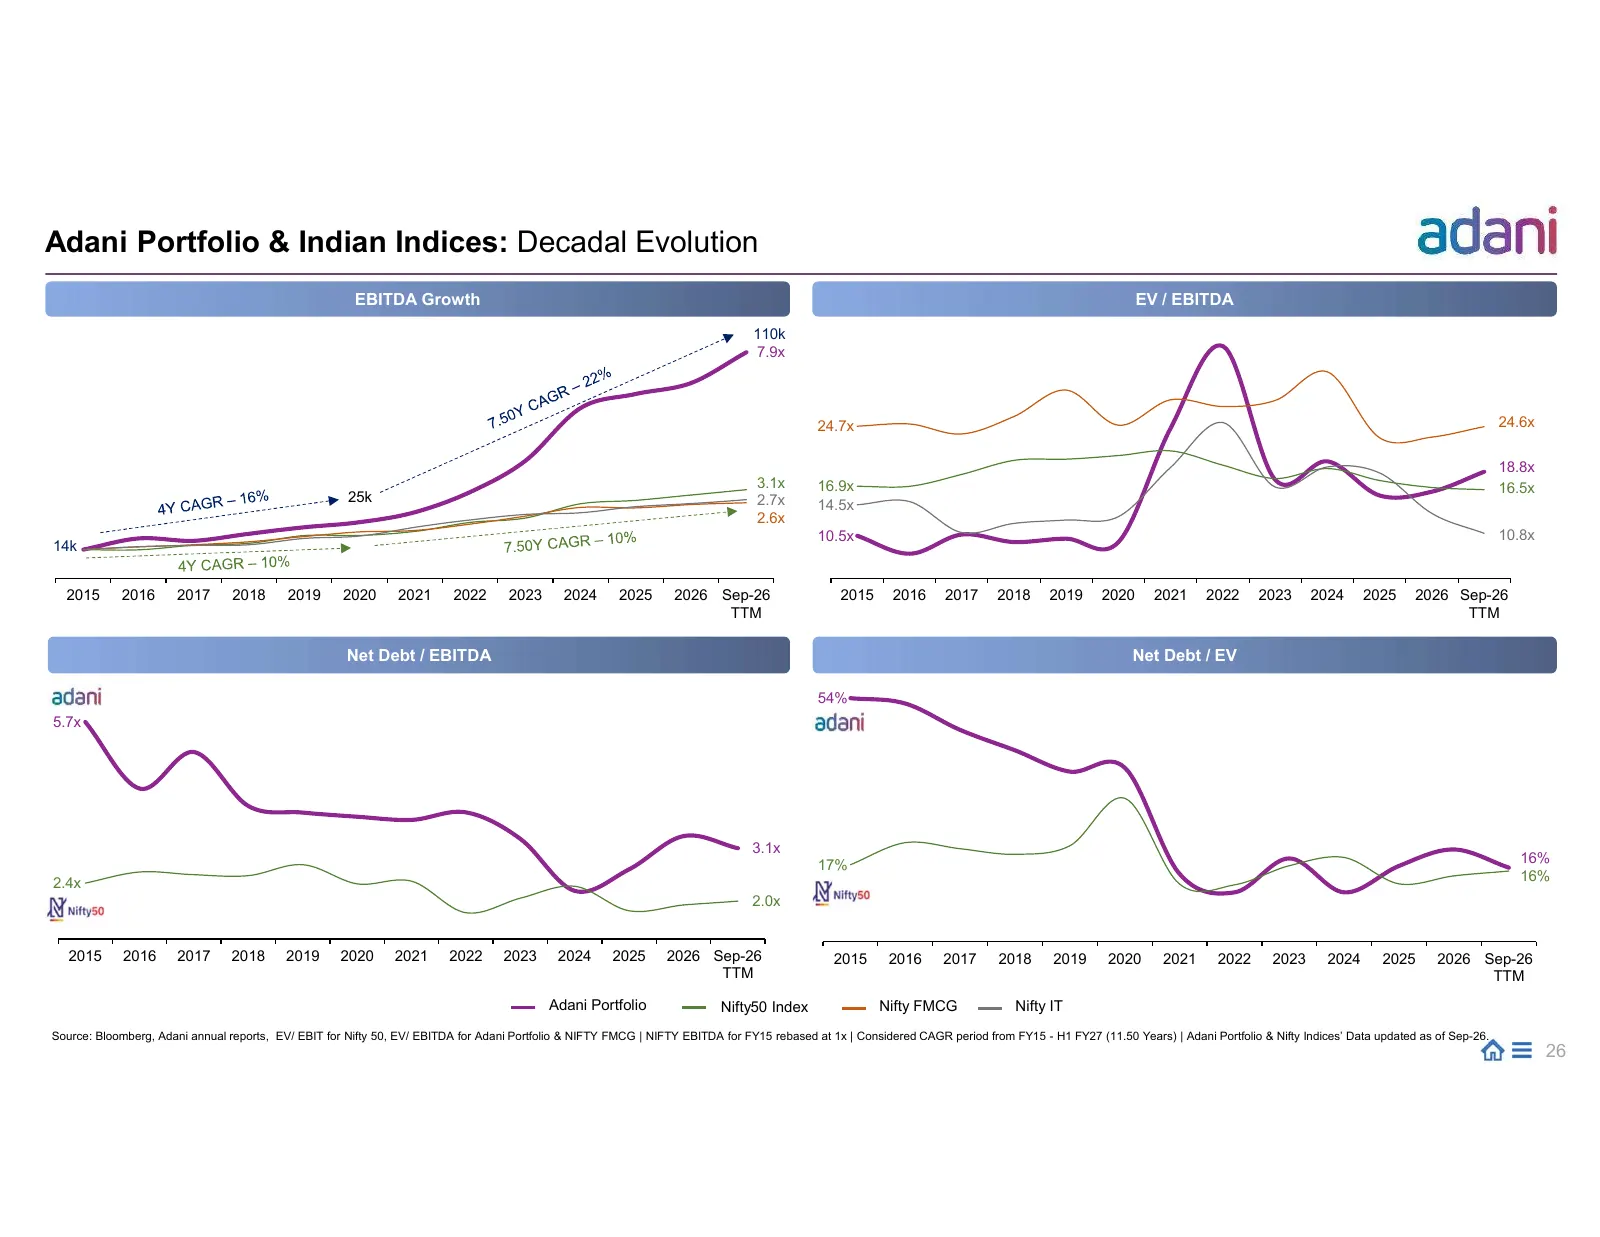
Slide 26: Portfolio & Indian Indices: Decadal Evolution
Adani Portfolio & Indian Indices: Decadal Evolution EBITDA Growth EV / EBITDA 110k 7.9x 24.7x 24.6x 18.8x 3.1x 16.9x 16.5x 25k 2.7x 14.5x 2.6x 10.5x 10.8x 14k 2015 2016 2017 2018 2019 2020 2021 2022 2023 2024 2025 2026 Sep-26 2015 2016 2017 2018 2019 2020 2021 2022 2023 2024 2025 2026 Sep-26 TTM TTM
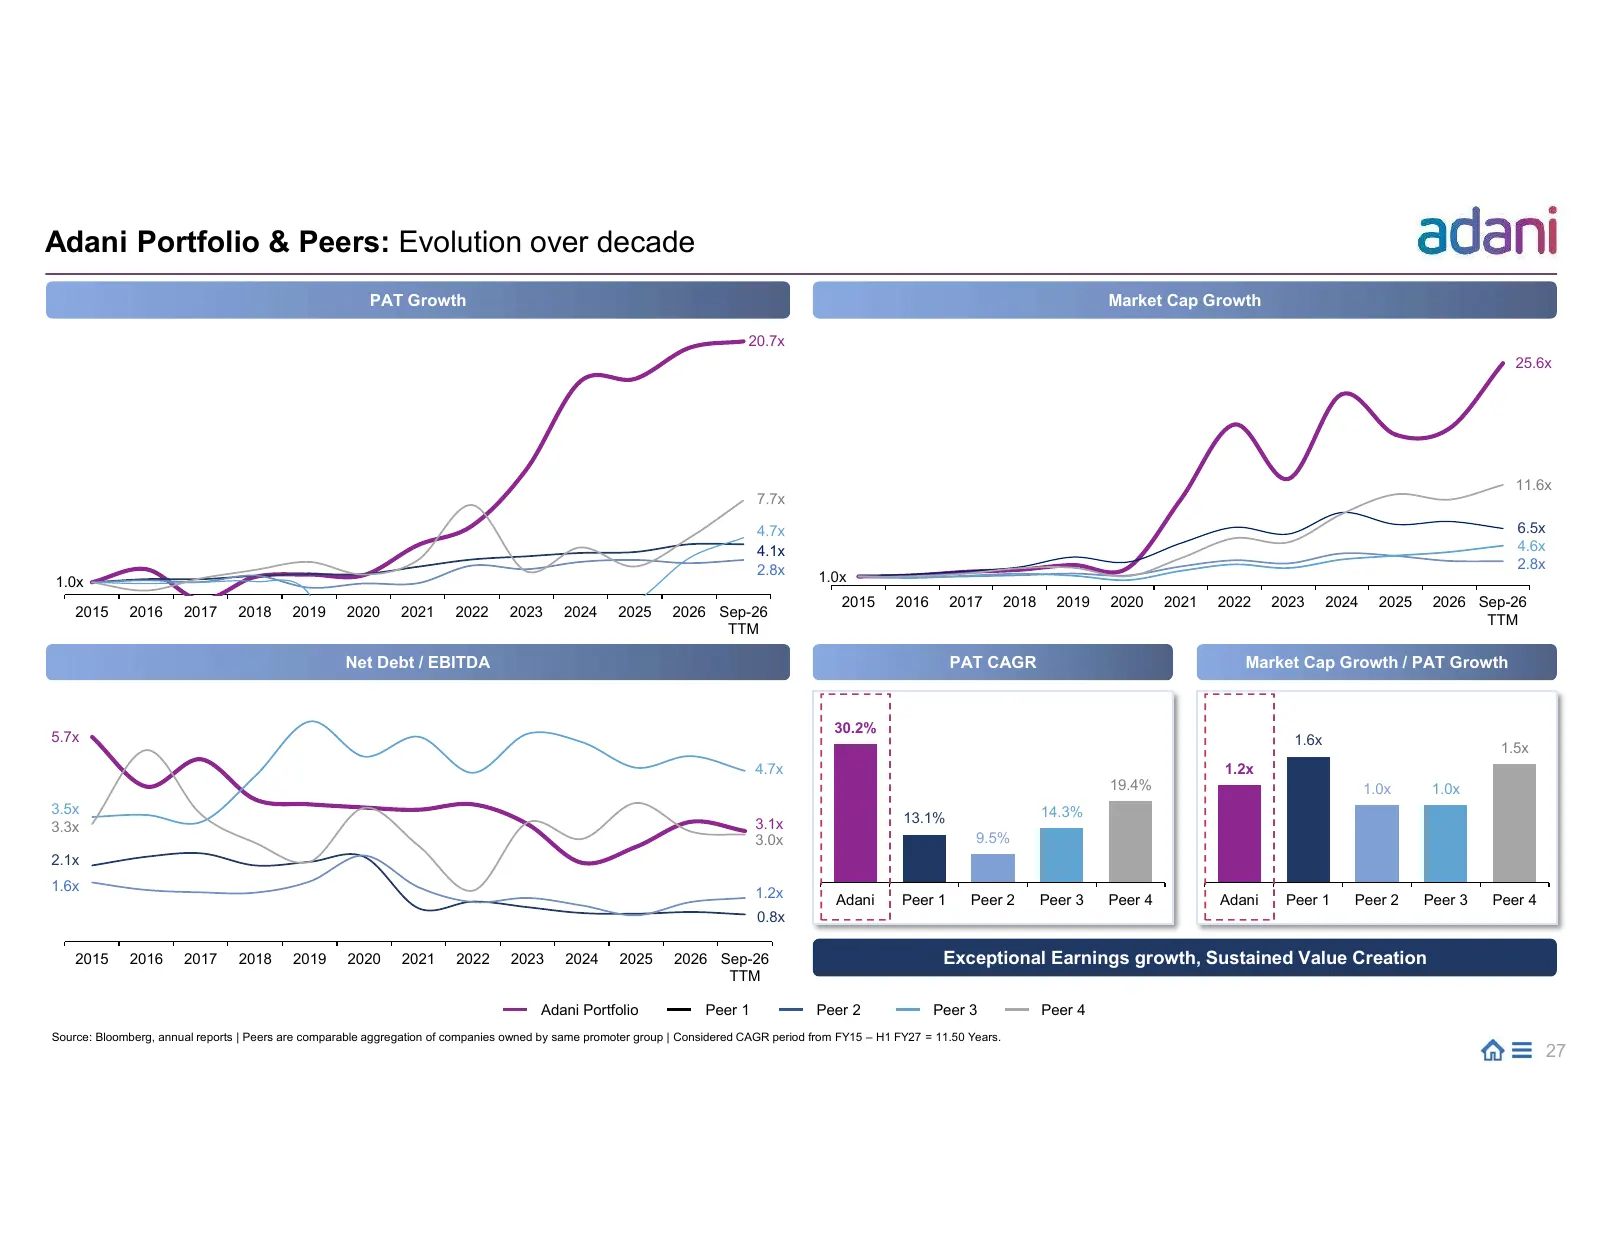
Slide 27: Portfolio & Peers: Evolution over decade
Adani Portfolio & Peers: Evolution over decade PAT Growth Market Cap Growth 20.7x 25.6x 11.6x 7.7x 4.7x 6.5x 4.1x 4.6x 2.8x 2.8x 1.0x 1.0x 2015 2016 2017 2018 2019 2020 2021 2022 2023 2024 2025 2026 Sep-26 2015 2016 2017 2018 2019 2020 2021 2022 2023 2024 2025 2026 Sep-26 TTM TTM Net Debt / EBITDA P
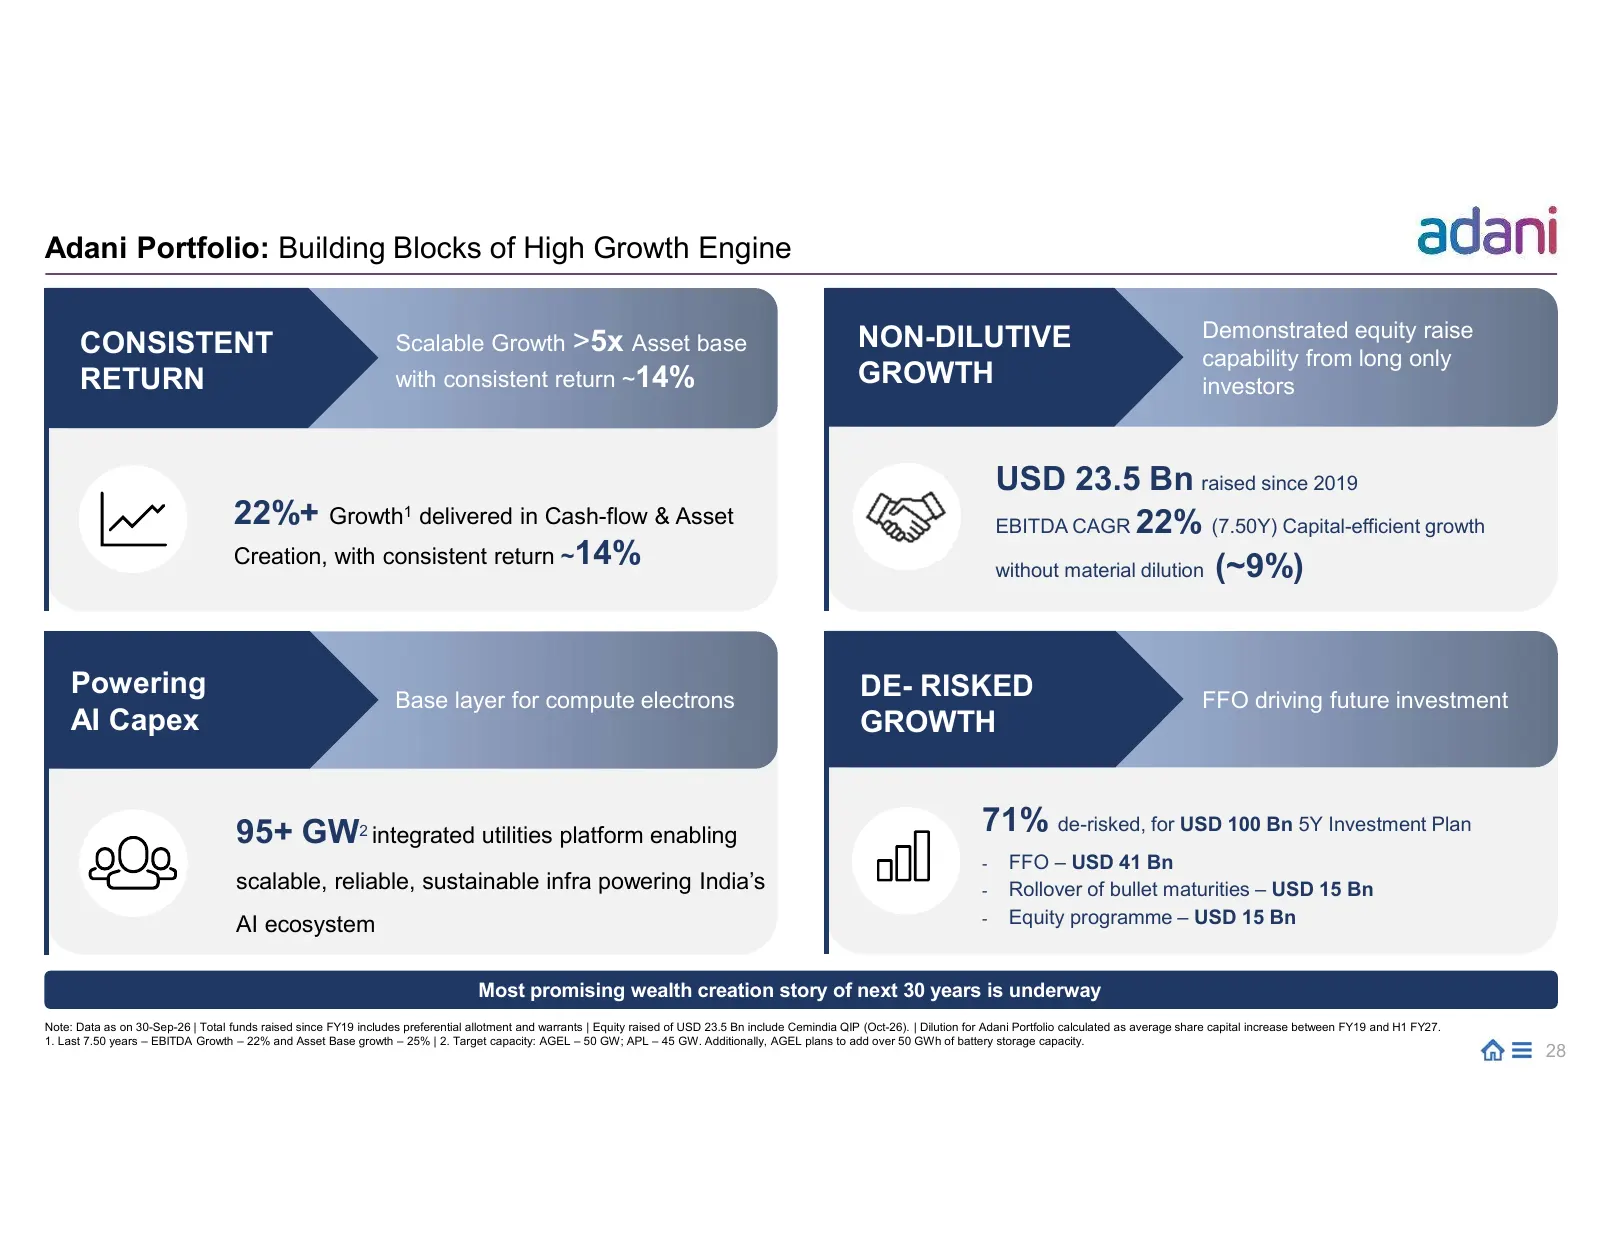
Slide 28: Building Blocks of High Growth Engine
Adani Portfolio: Building Blocks of High Growth Engine NON-DILUTIVE Demonstrated equity raise CONSISTENT Scalable Growth >5x Asset base capability from long only RETURN with consistent return ~14% GROWTH investors USD 23.5 Bn raised since 2019 22%+ Growth1 delivered in Cash-flow & Asset EBITDA CAGR
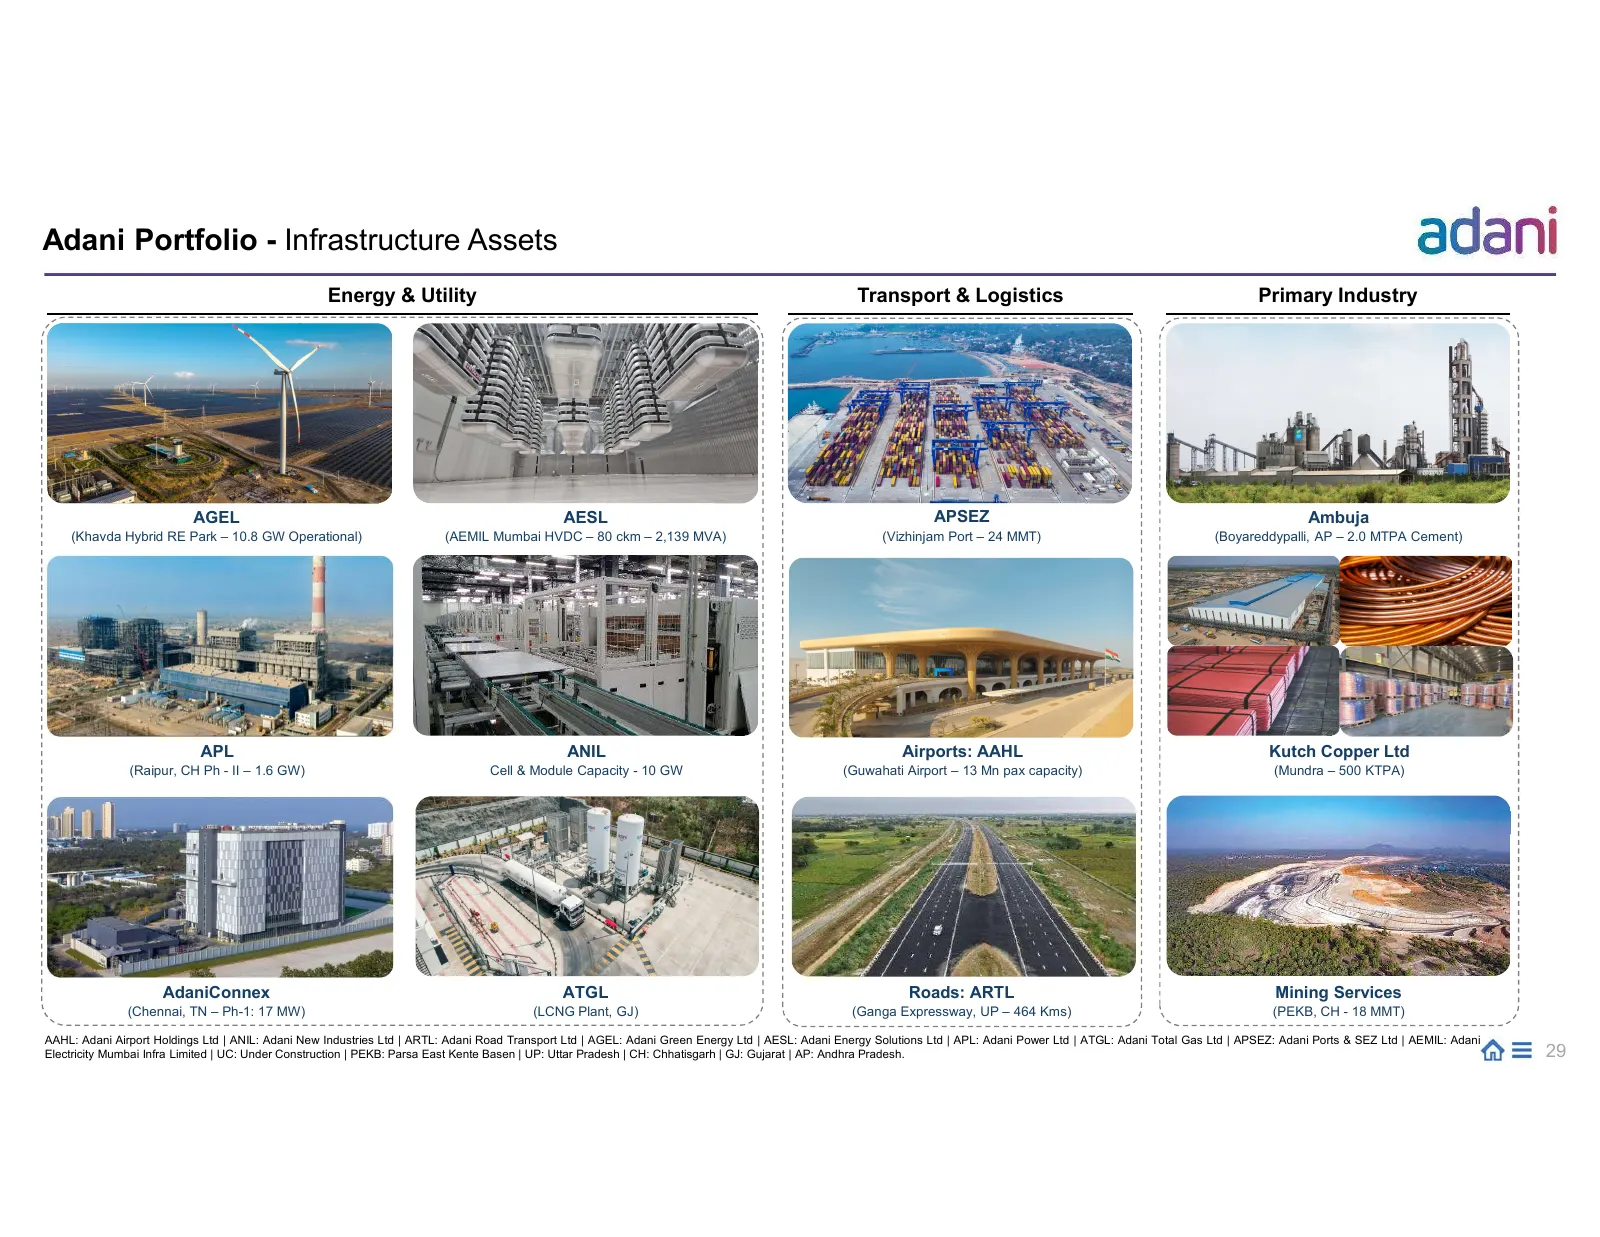
Slide 29: Portfolio - Infrastructure Assets
Adani Portfolio - Infrastructure Assets Energy & Utility Transport & Logistics Primary Industry AGEL AESL APSEZ Ambuja (Khavda Hybrid RE Park – 10.8 GW Operational) (AEMIL Mumbai HVDC – 80 ckm – 2,139 MVA) (Vizhinjam Port – 24 MMT) (Boyareddypalli, AP – 2.0 MTPA Cement) APL ANIL Airports: AAHL Kutch

Slide 30: Thank You
Thank You
Slide 31: Disclaimer
Disclaimer Certain statements made in this presentation may not be based on historical information or facts and may be “forward-looking statements,” including those relating to general business plans and strategy of Adani group, the future outlook and growth prospects, and future developments of the
Slide 32: Annexures
Adani Portfolio: Annexures STRICTLY CONFIDENTIAL
Slide 33: Global & Domestic Comp Analysis
ANNEXURE Global & Domestic Comp Analysis
Slide 34: Utilities: Global Utility Indices - Comp Analysis
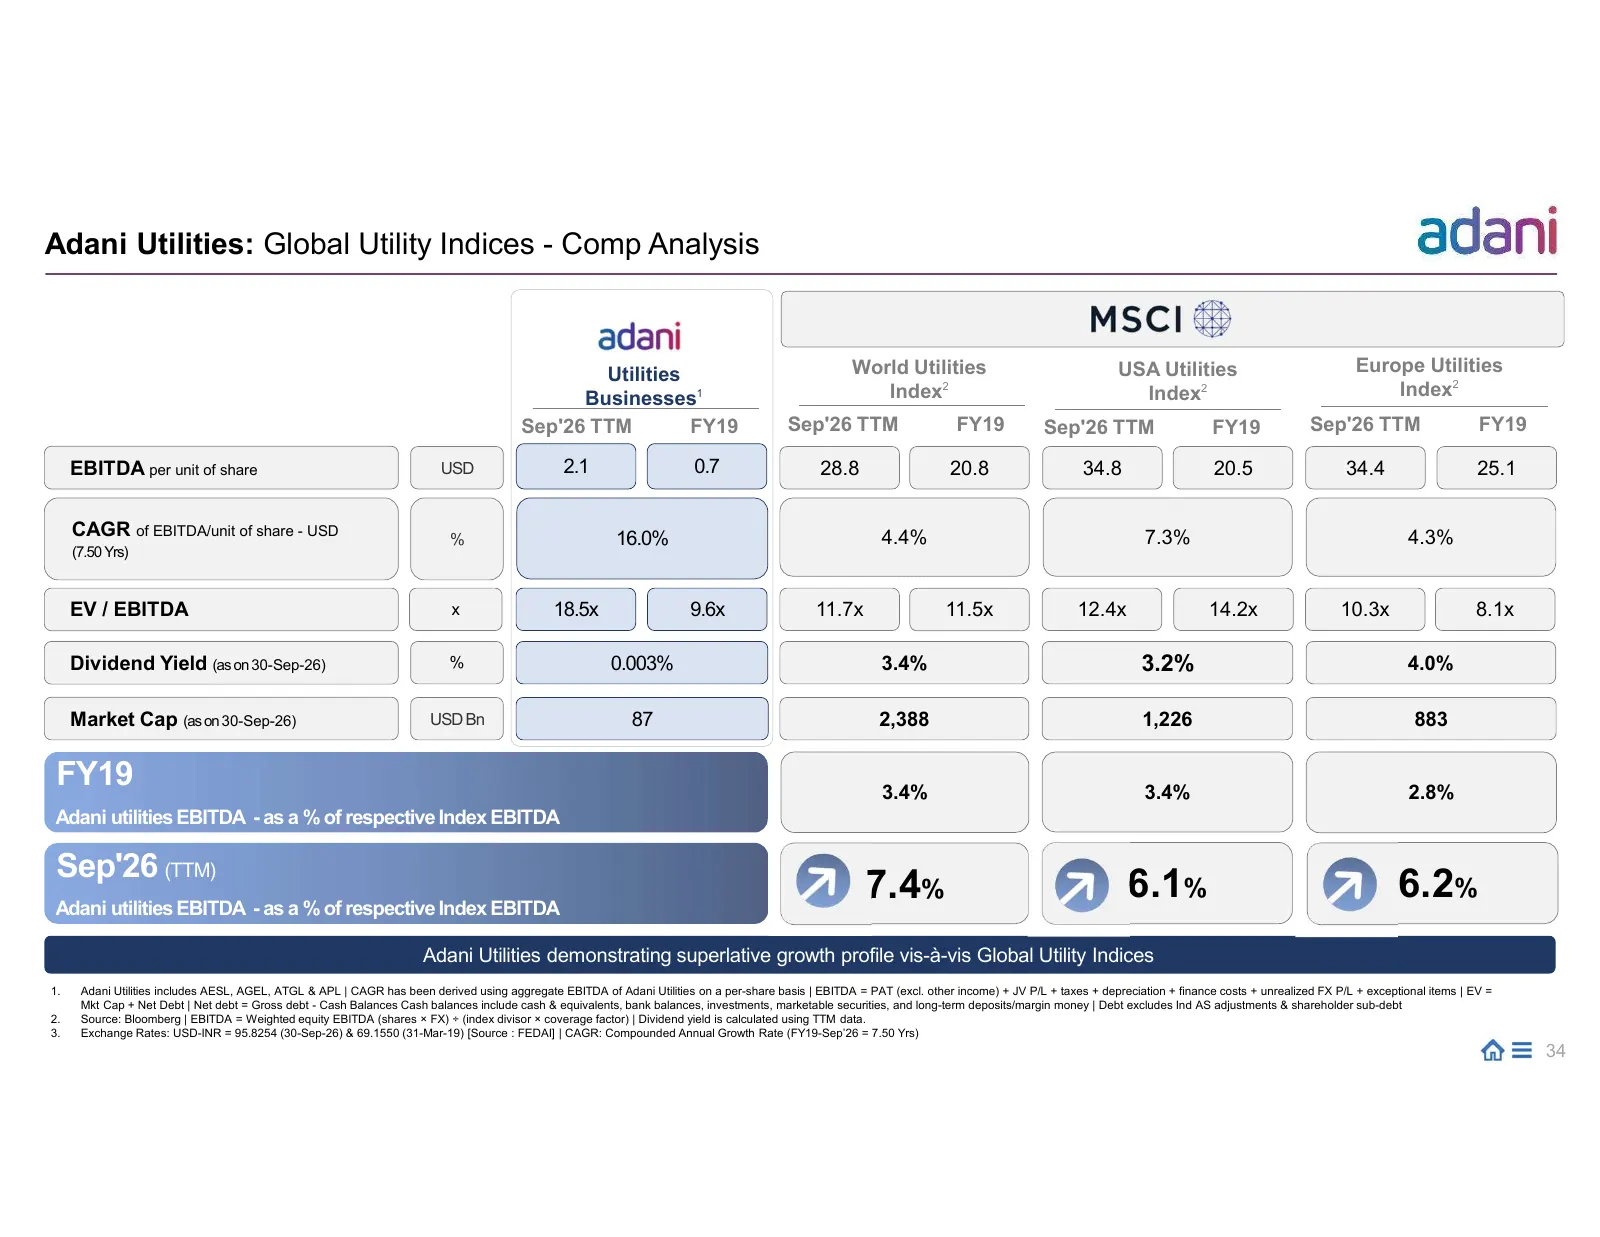
Adani Utilities: Global Utility Indices - Comp Analysis Utilities World Utilities USA Utilities Europe Utilities Businesses1 Index2 Index2 Index2 Sep'26 TTM FY19 Sep'26 TTM FY19 Sep'26 TTM FY19 Sep'26 TTM FY19 EBITDA per unit of share USD 2.1 0.7 28.8 20.8 34.8 20.5 34.4 25.1 CAGR of EBITDA/unit of
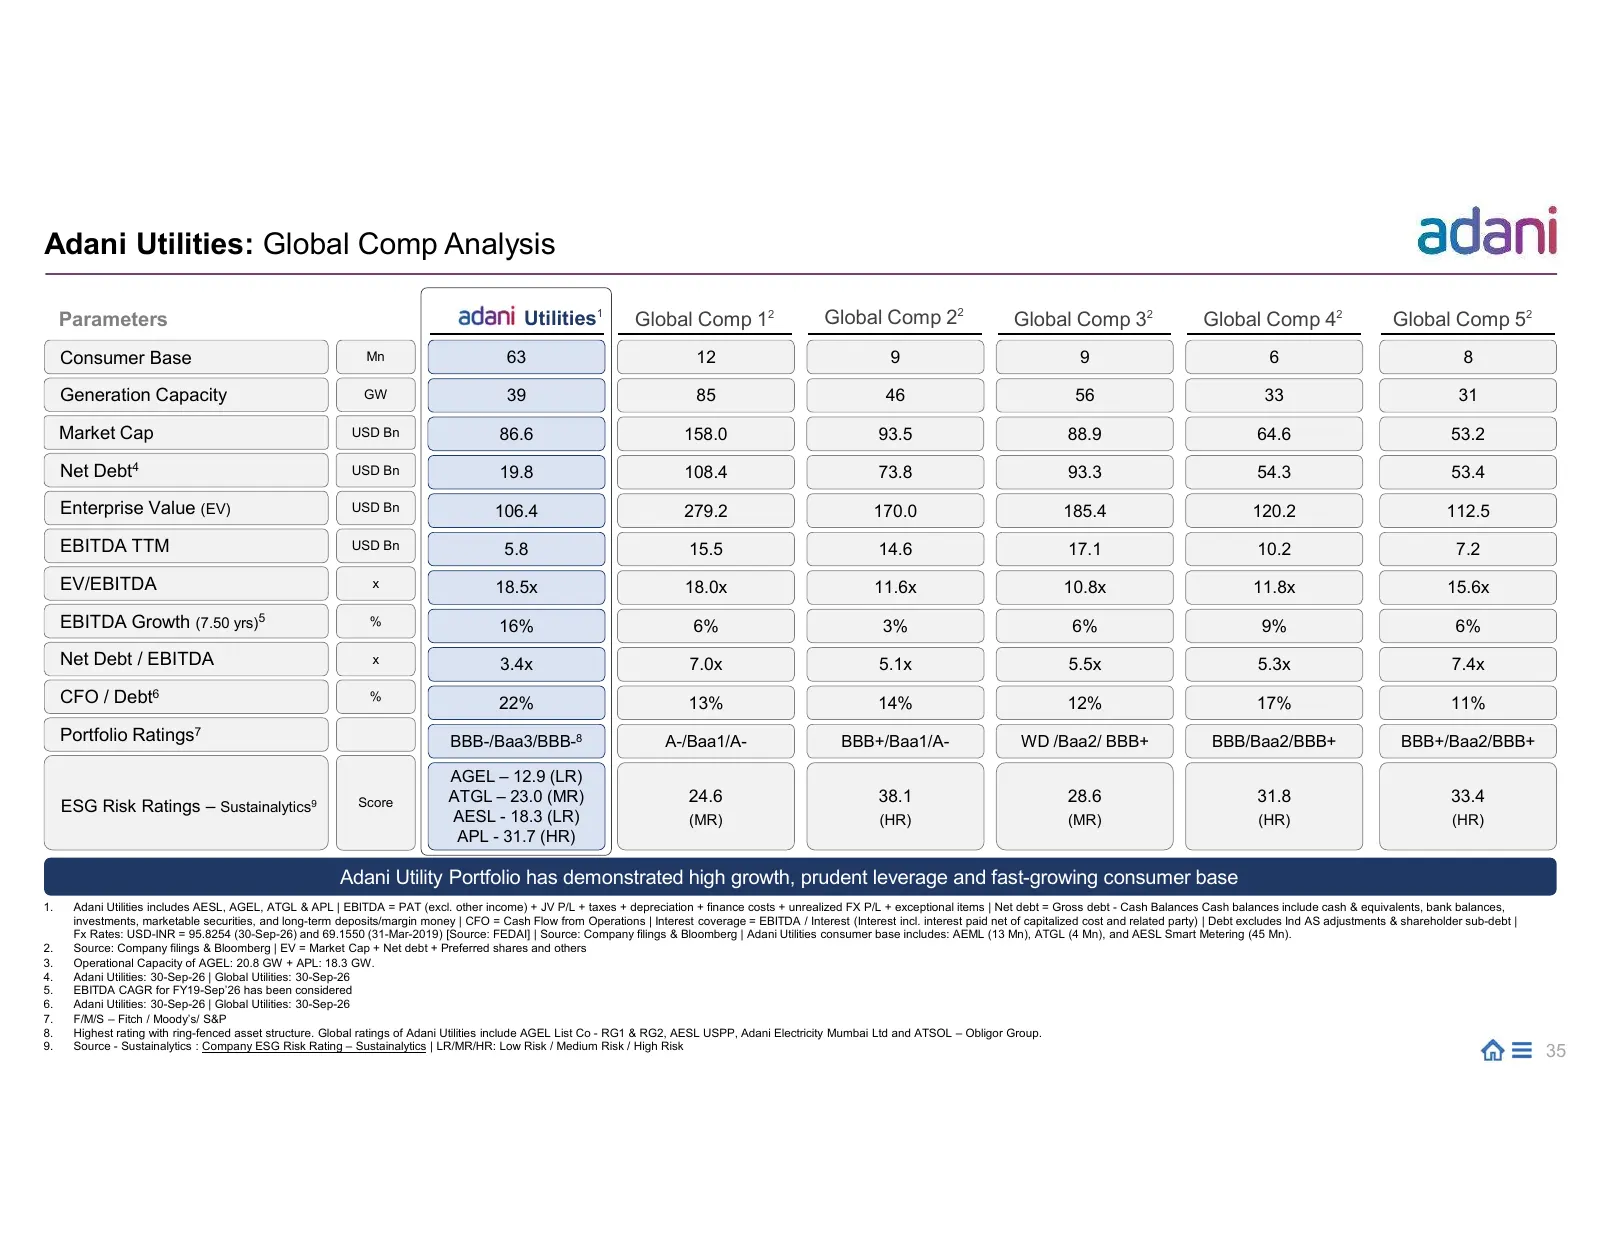
Slide 35: Utilities: Global Comp Analysis
Adani Utilities: Global Comp Analysis Parameters Adani Utilities1 Global Comp 12 Global Comp 22 Global Comp 32 Global Comp 42 Global Comp 52 Consumer Base Mn 63 12 9 9 6 8 Generation Capacity GW 39 85 46 56 33 31 Market Cap USD Bn 86.6 158.0 93.5 88.9 64.6 53.2 Net Debt4 USD Bn 19.8 108.4 73.8 93.3
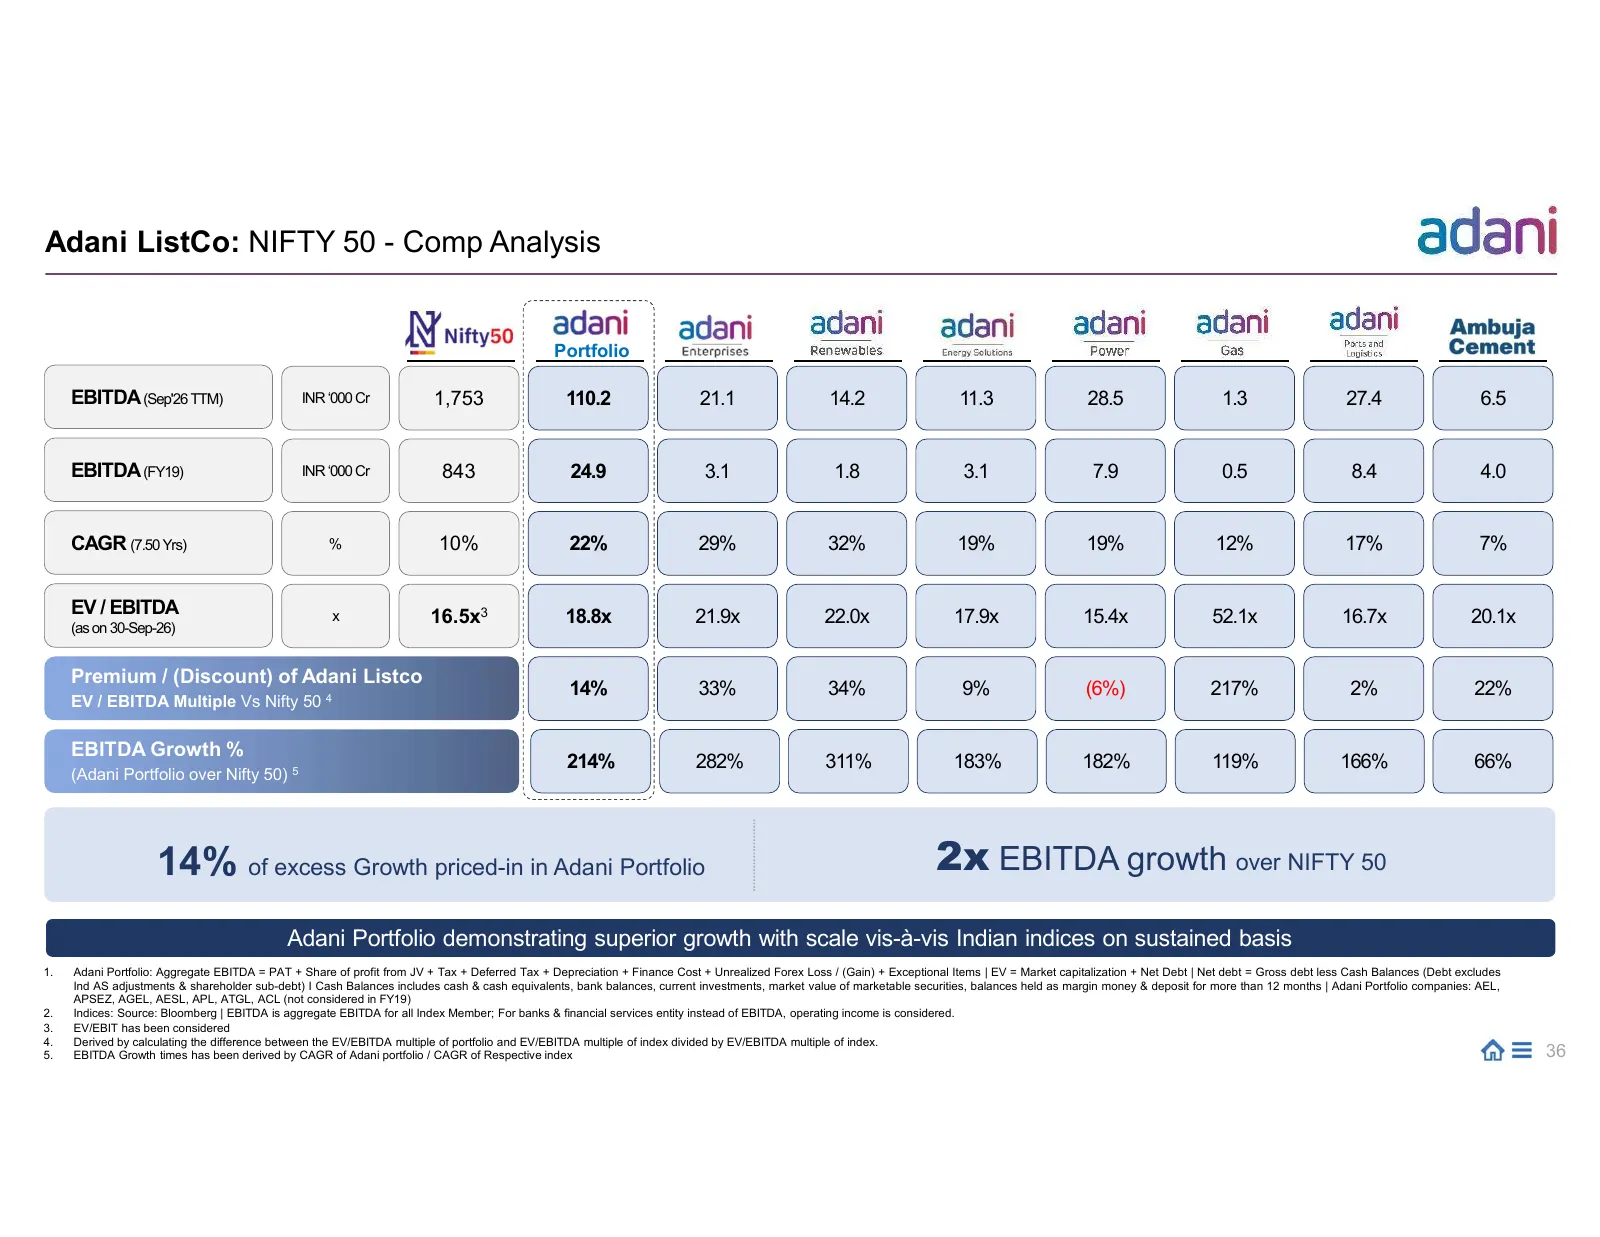
Slide 36: 2x EBITDA growth over NIFTY 50
Adani ListCo: NIFTY 50 - Comp Analysis Portfolio EBITDA (Sep'26 TTM) INR ‘000 Cr 1,753 110.2 21.1 14.2 11.3 28.5 1.3 27.4 6.5 EBITDA (FY19) INR ‘000 Cr 843 24.9 3.1 1.8 3.1 7.9 0.5 8.4 4.0 CAGR (7.50 Yrs) % 10% 22% 29% 32% 19% 19% 12% 17% 7% EV / EBITDA x 16.5x3 18.8x 21.9x 22.0x 17.9x 15.4x 52.1x 1
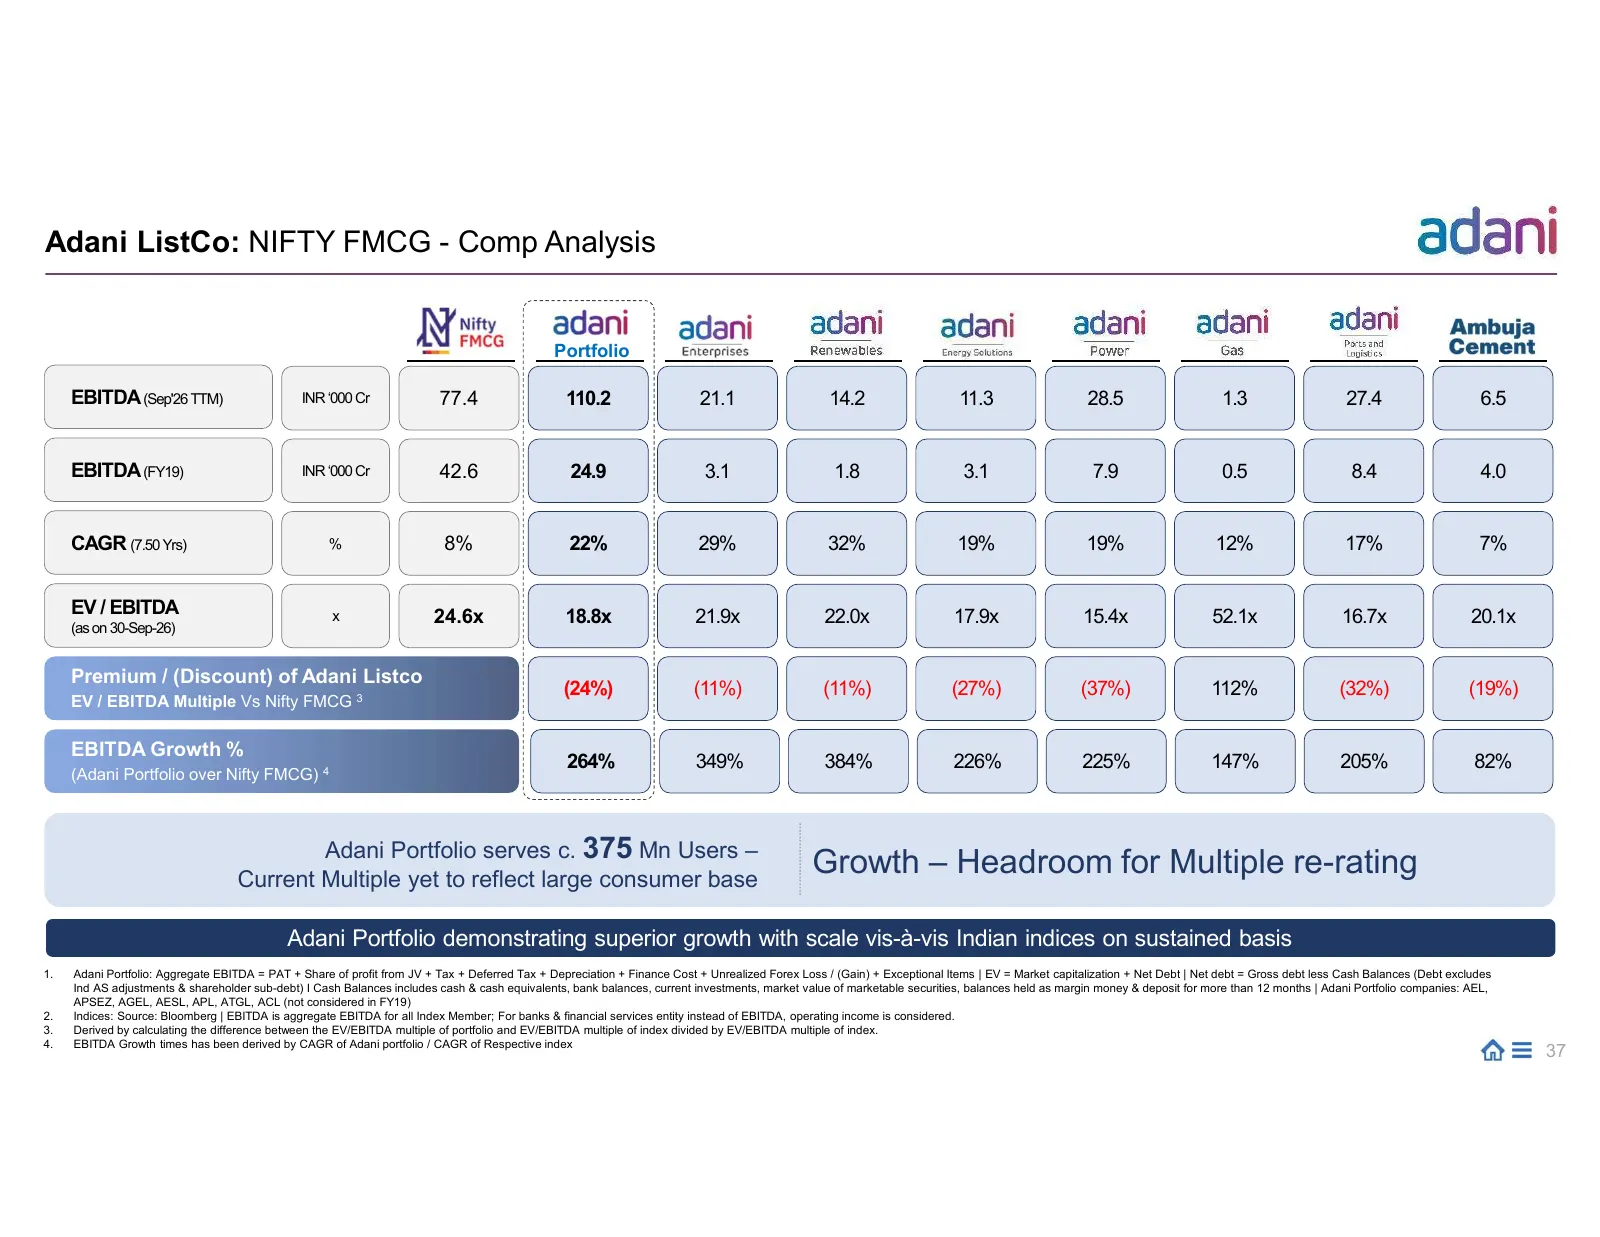
Slide 37: Growth – Headroom for Multiple re-rating
Adani ListCo: NIFTY FMCG - Comp Analysis Portfolio EBITDA (Sep'26 TTM) INR ‘000 Cr 77.4 110.2 21.1 14.2 11.3 28.5 1.3 27.4 6.5 EBITDA (FY19) INR ‘000 Cr 42.6 24.9 3.1 1.8 3.1 7.9 0.5 8.4 4.0 CAGR (7.50 Yrs) % 8% 22% 29% 32% 19% 19% 12% 17% 7% EV / EBITDA x 24.6x 18.8x 21.9x 22.0x 17.9x 15.4x 52.1x 1
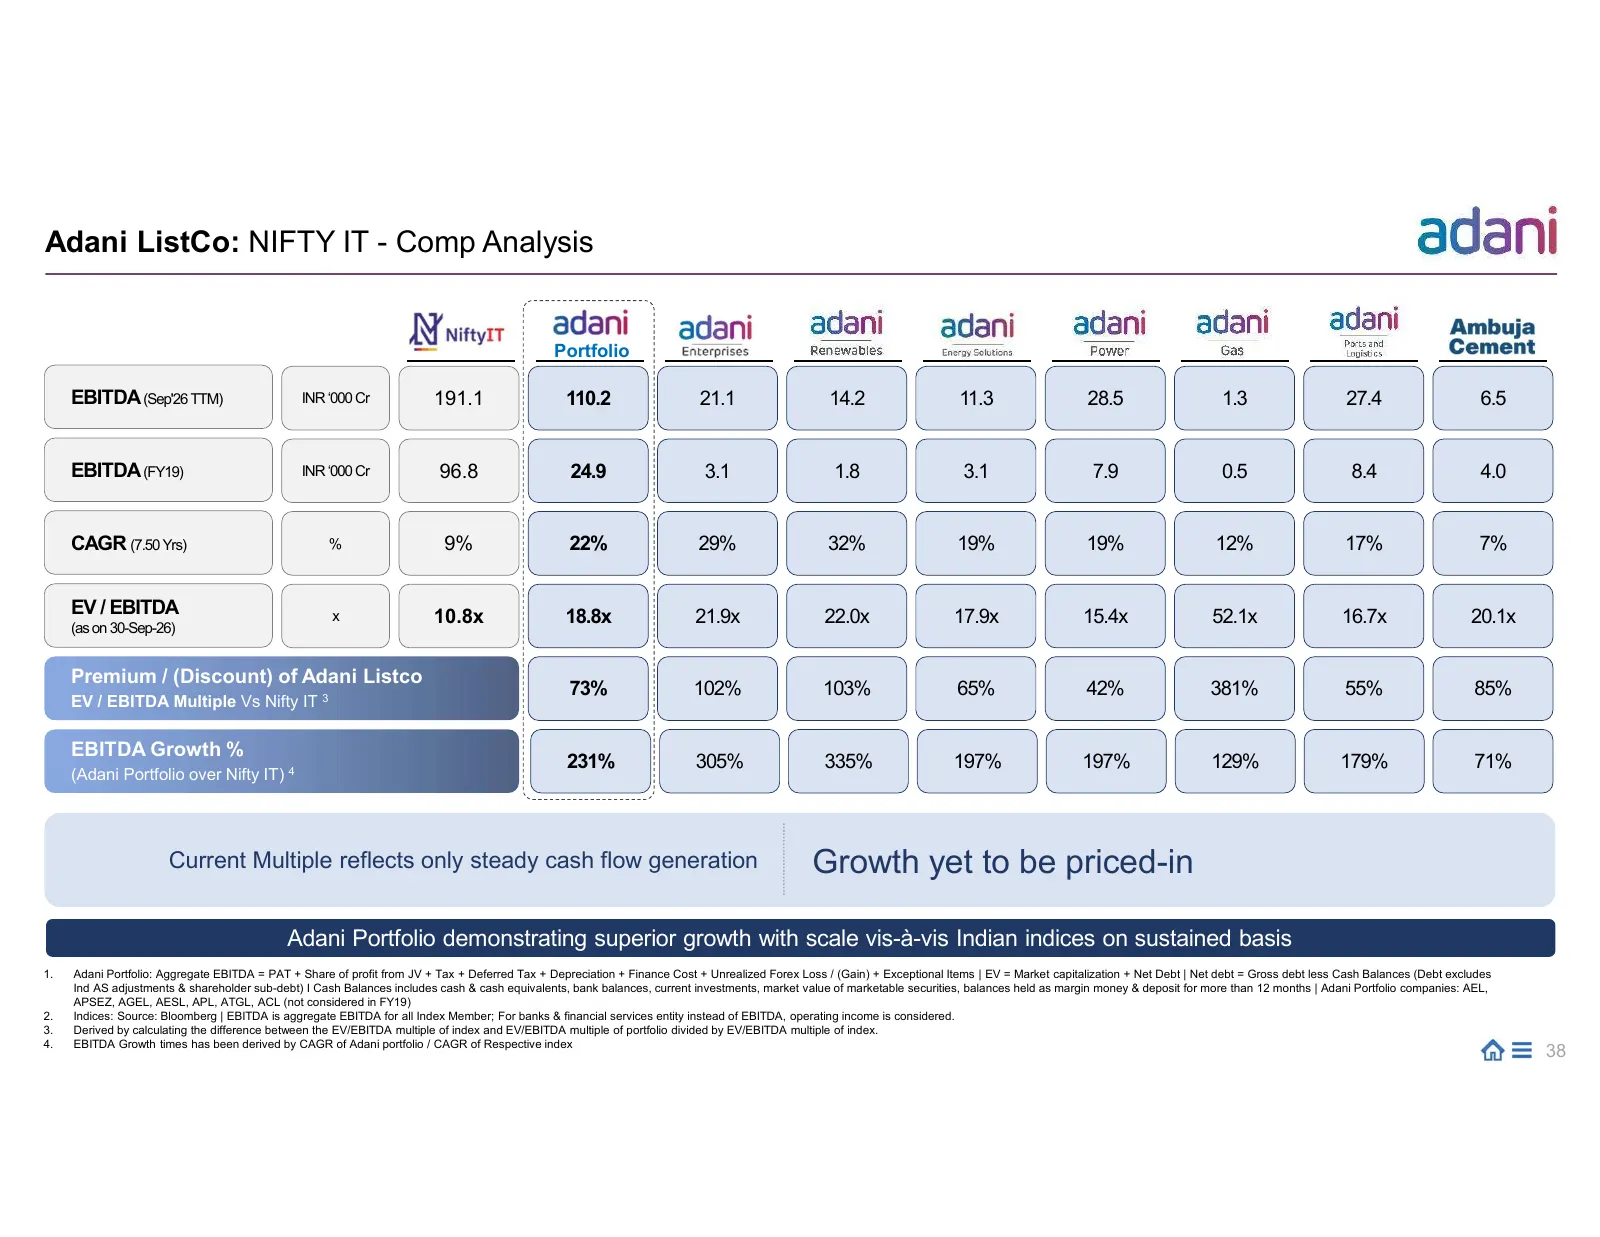
Slide 38: Growth yet to be priced-in
Adani ListCo: NIFTY IT - Comp Analysis Portfolio EBITDA (Sep'26 TTM) INR ‘000 Cr 191.1 110.2 21.1 14.2 11.3 28.5 1.3 27.4 6.5 EBITDA (FY19) INR ‘000 Cr 96.8 24.9 3.1 1.8 3.1 7.9 0.5 8.4 4.0 CAGR (7.50 Yrs) % 9% 22% 29% 32% 19% 19% 12% 17% 7% EV / EBITDA x 10.8x 18.8x 21.9x 22.0x 17.9x 15.4x 52.1x 16
Slide 39: Adani Portfolio Companies: RoA Evolution
ANNEXURE Adani Portfolio Companies: RoA Evolution
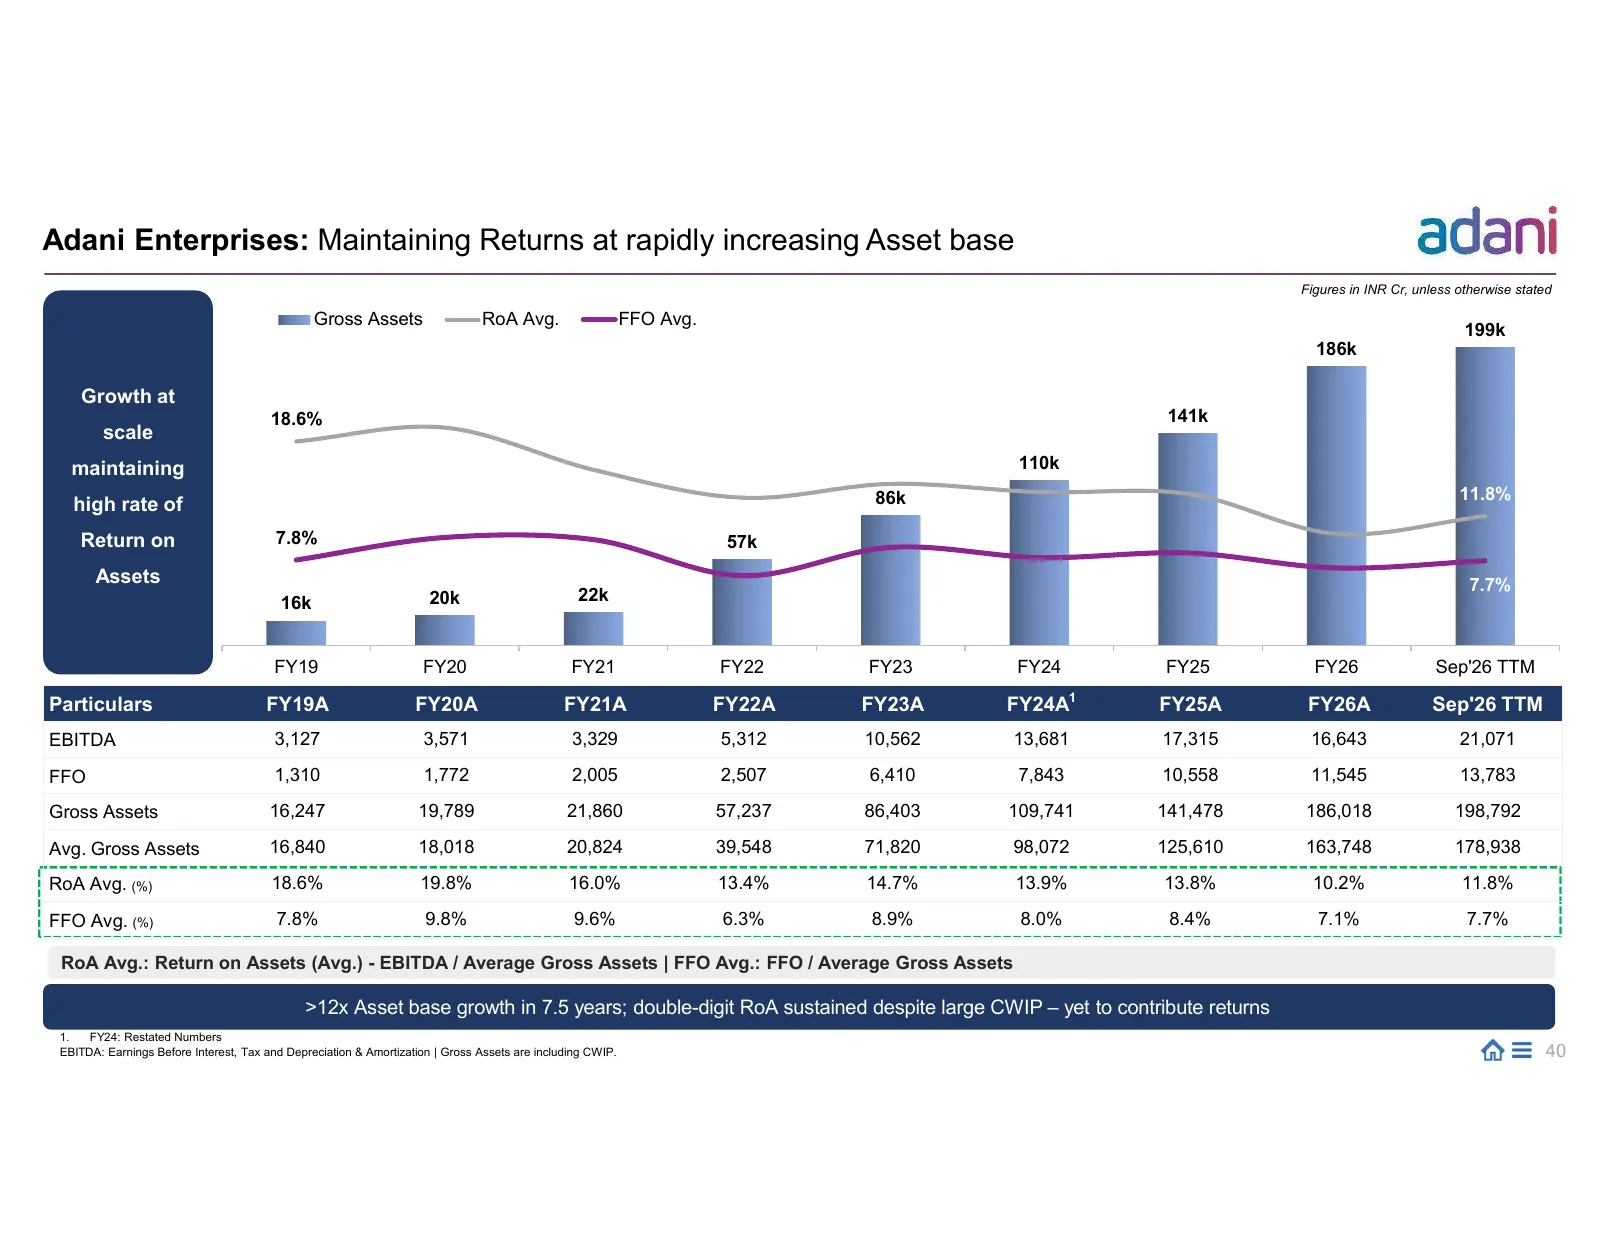
Slide 40: Adani Enterprises: Maintaining Returns at rapidly increasing Asset base
Adani Enterprises: Maintaining Returns at rapidly increasing Asset base Figures in INR Cr, unless otherwise stated Gross Assets RoA Avg. FFO Avg. 199k 186k Growth at 18.6% 141k scale maintaining 110k 86k 11.8% high rate of Return on 7.8% 57k Assets 7.7% 16k 20k 22k FY19 FY20 FY21 FY22 FY23 FY24 FY25
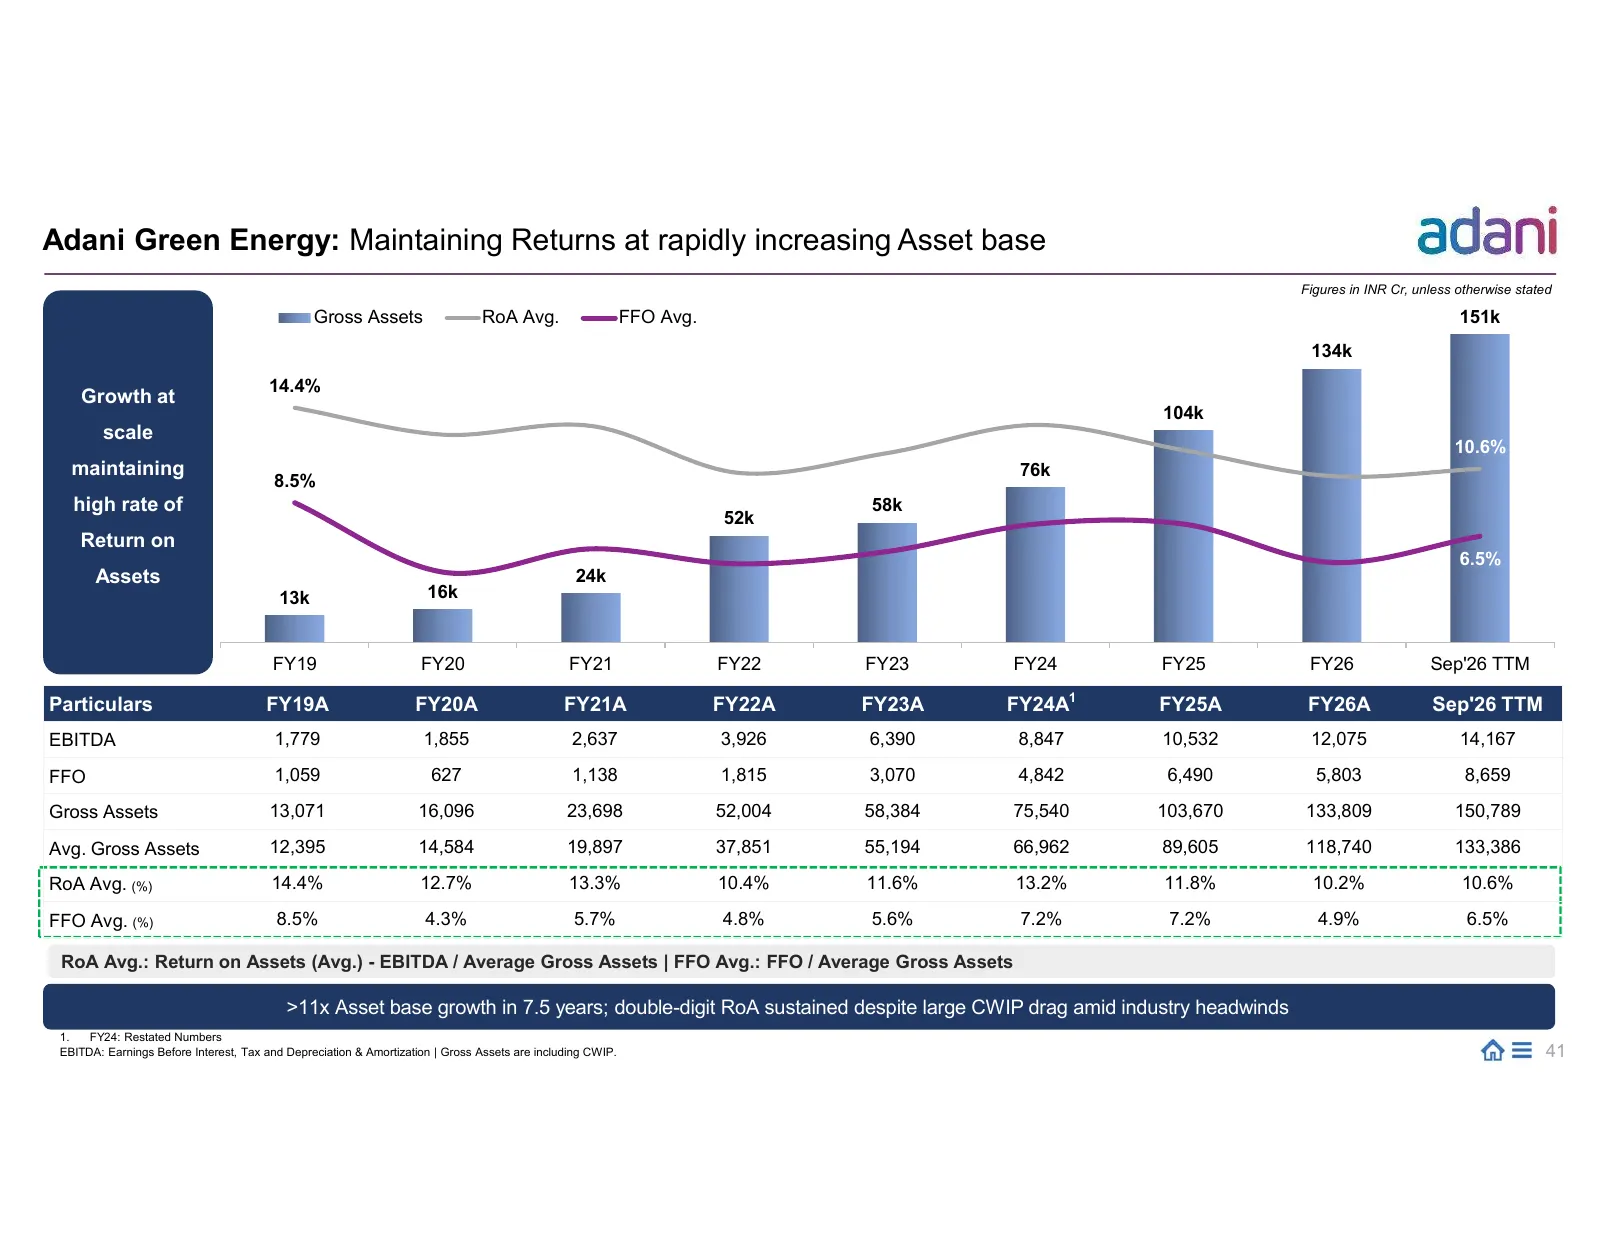
Slide 41: Adani Green Energy: Maintaining Returns at rapidly increasing Asset base
Adani Green Energy: Maintaining Returns at rapidly increasing Asset base Figures in INR Cr, unless otherwise stated Gross Assets RoA Avg. FFO Avg. 151k 134k 14.4% Growth at 104k scale 10.6% maintaining 76k 8.5% high rate of 58k 52k Return on 6.5% Assets 24k 13k 16k FY19 FY20 FY21 FY22 FY23 FY24 FY25
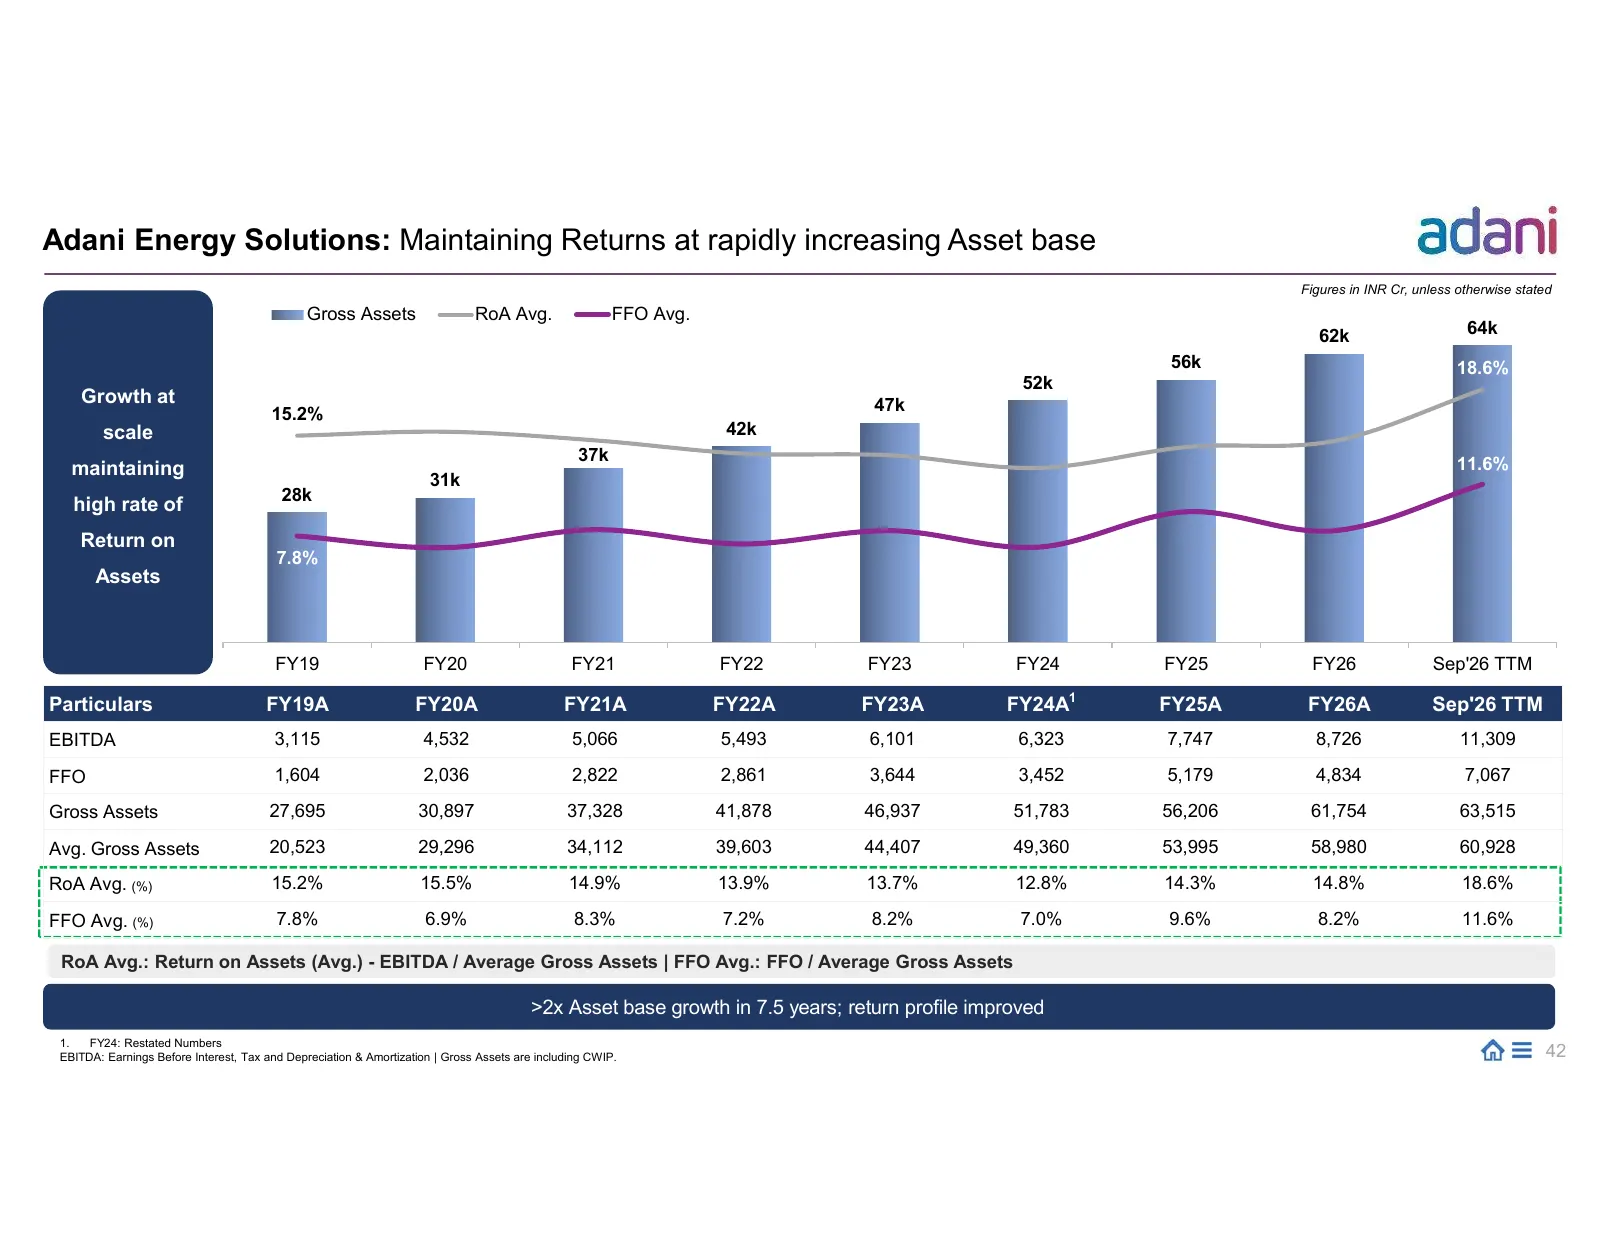
Slide 42: Adani Energy Solutions: Maintaining Returns at rapidly increasing Asset base
Adani Energy Solutions: Maintaining Returns at rapidly increasing Asset base Figures in INR Cr, unless otherwise stated Gross Assets RoA Avg. FFO Avg. 62k 64k 56k 18.6% 52k Growth at 47k 15.2% scale 42k 37k 11.6% maintaining 31k 28k high rate of Return on 7.8% Assets FY19 FY20 FY21 FY22 FY23 FY24 FY
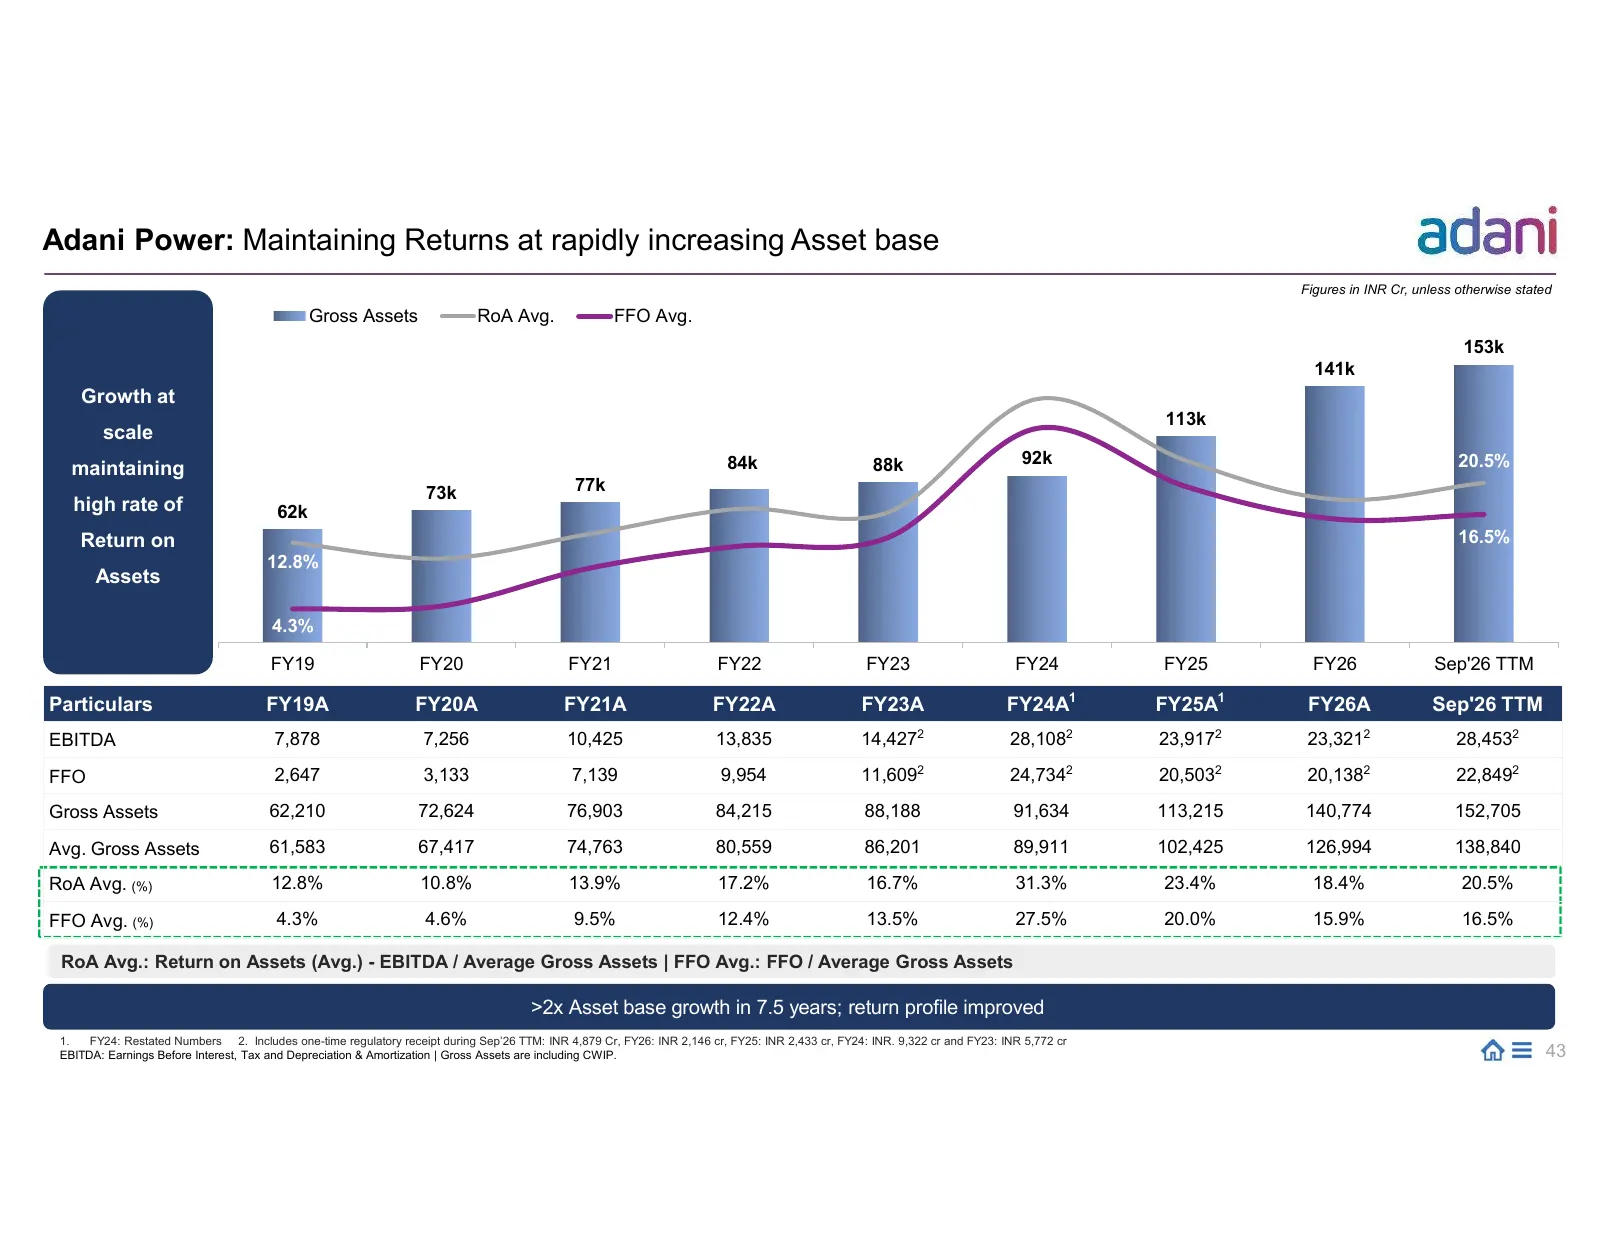
Slide 43: Adani Power: Maintaining Returns at rapidly increasing Asset base
Adani Power: Maintaining Returns at rapidly increasing Asset base Figures in INR Cr, unless otherwise stated Gross Assets RoA Avg. FFO Avg. 153k 141k Growth at 113k scale 84k 88k 92k 20.5% maintaining 73k 77k high rate of 62k Return on 16.5% 12.8% Assets 4.3% FY19 FY20 FY21 FY22 FY23 FY24 FY25 FY26
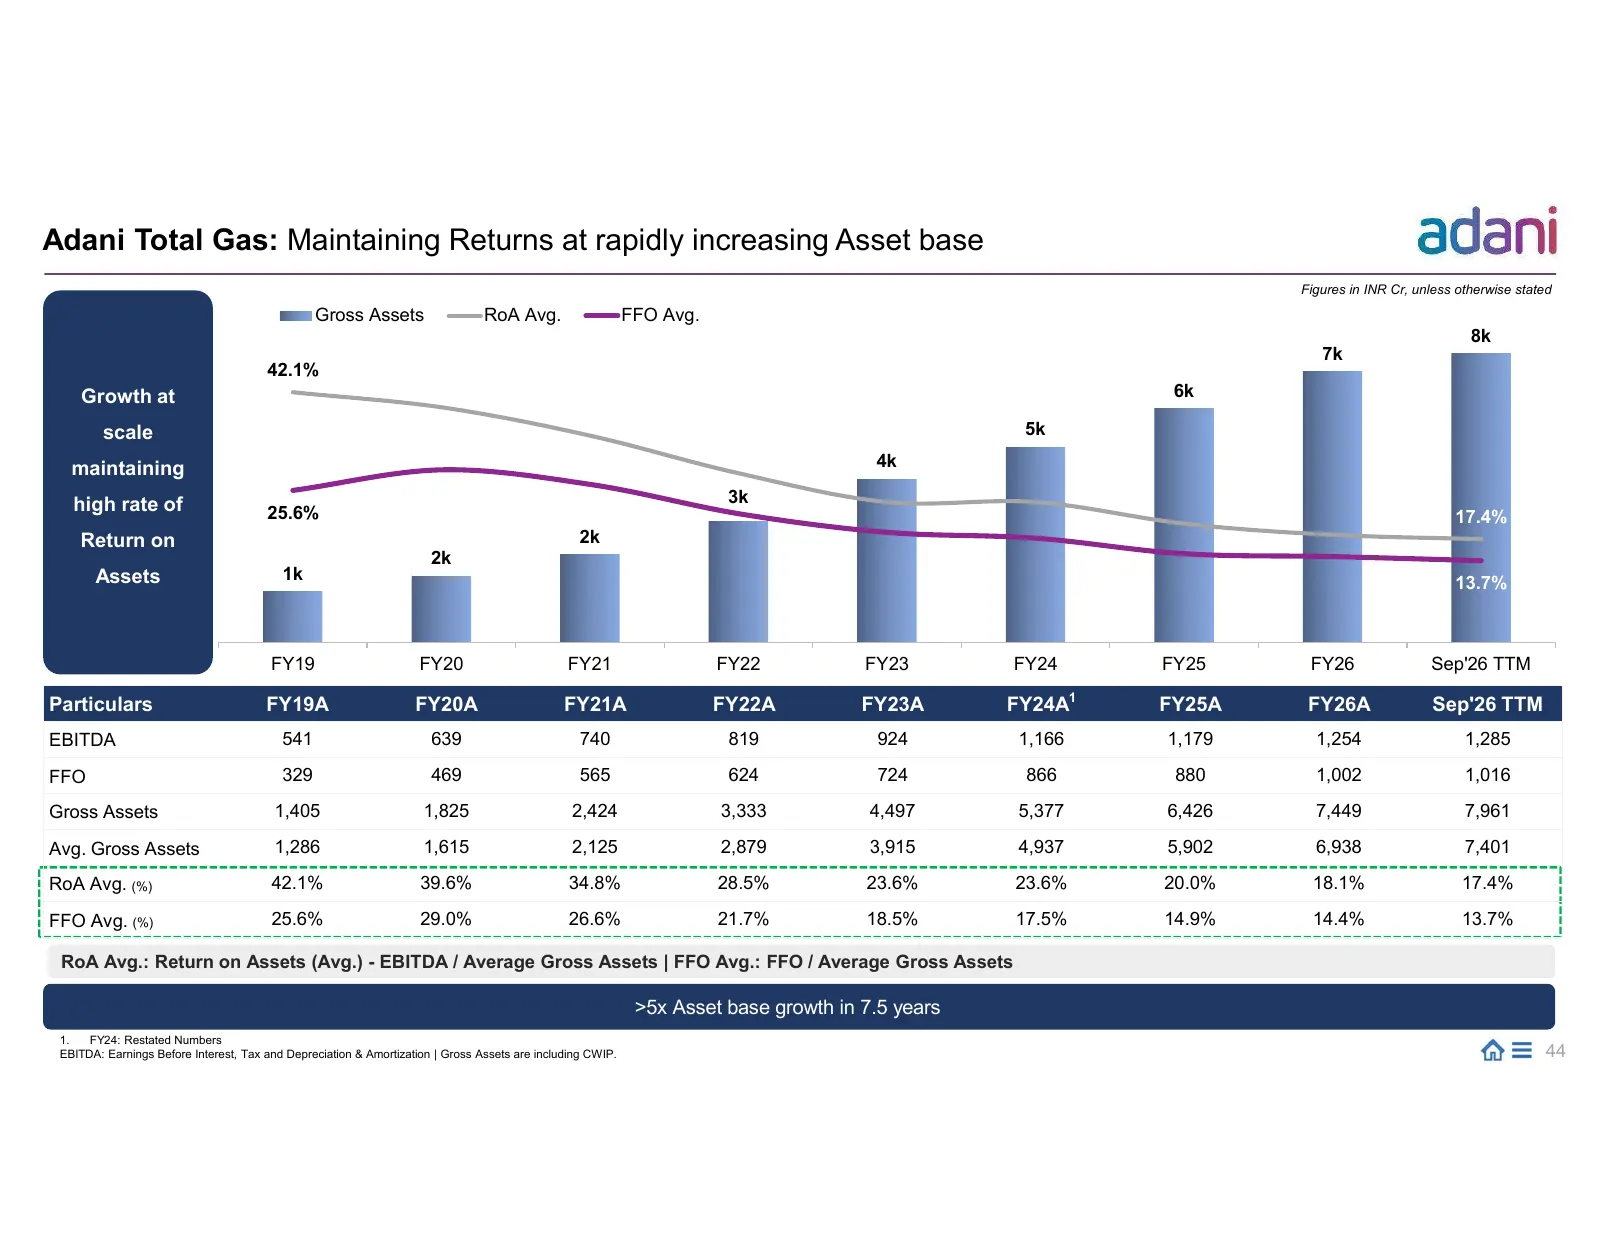
Slide 44: Adani Total Gas: Maintaining Returns at rapidly increasing Asset base
Adani Total Gas: Maintaining Returns at rapidly increasing Asset base Figures in INR Cr, unless otherwise stated Gross Assets RoA Avg. FFO Avg. 8k 7k 42.1% Growth at 6k scale 5k maintaining 4k high rate of 3k 25.6% 17.4% Return on 2k 2k Assets 1k 13.7% FY19 FY20 FY21 FY22 FY23 FY24 FY25 FY26 Sep'26
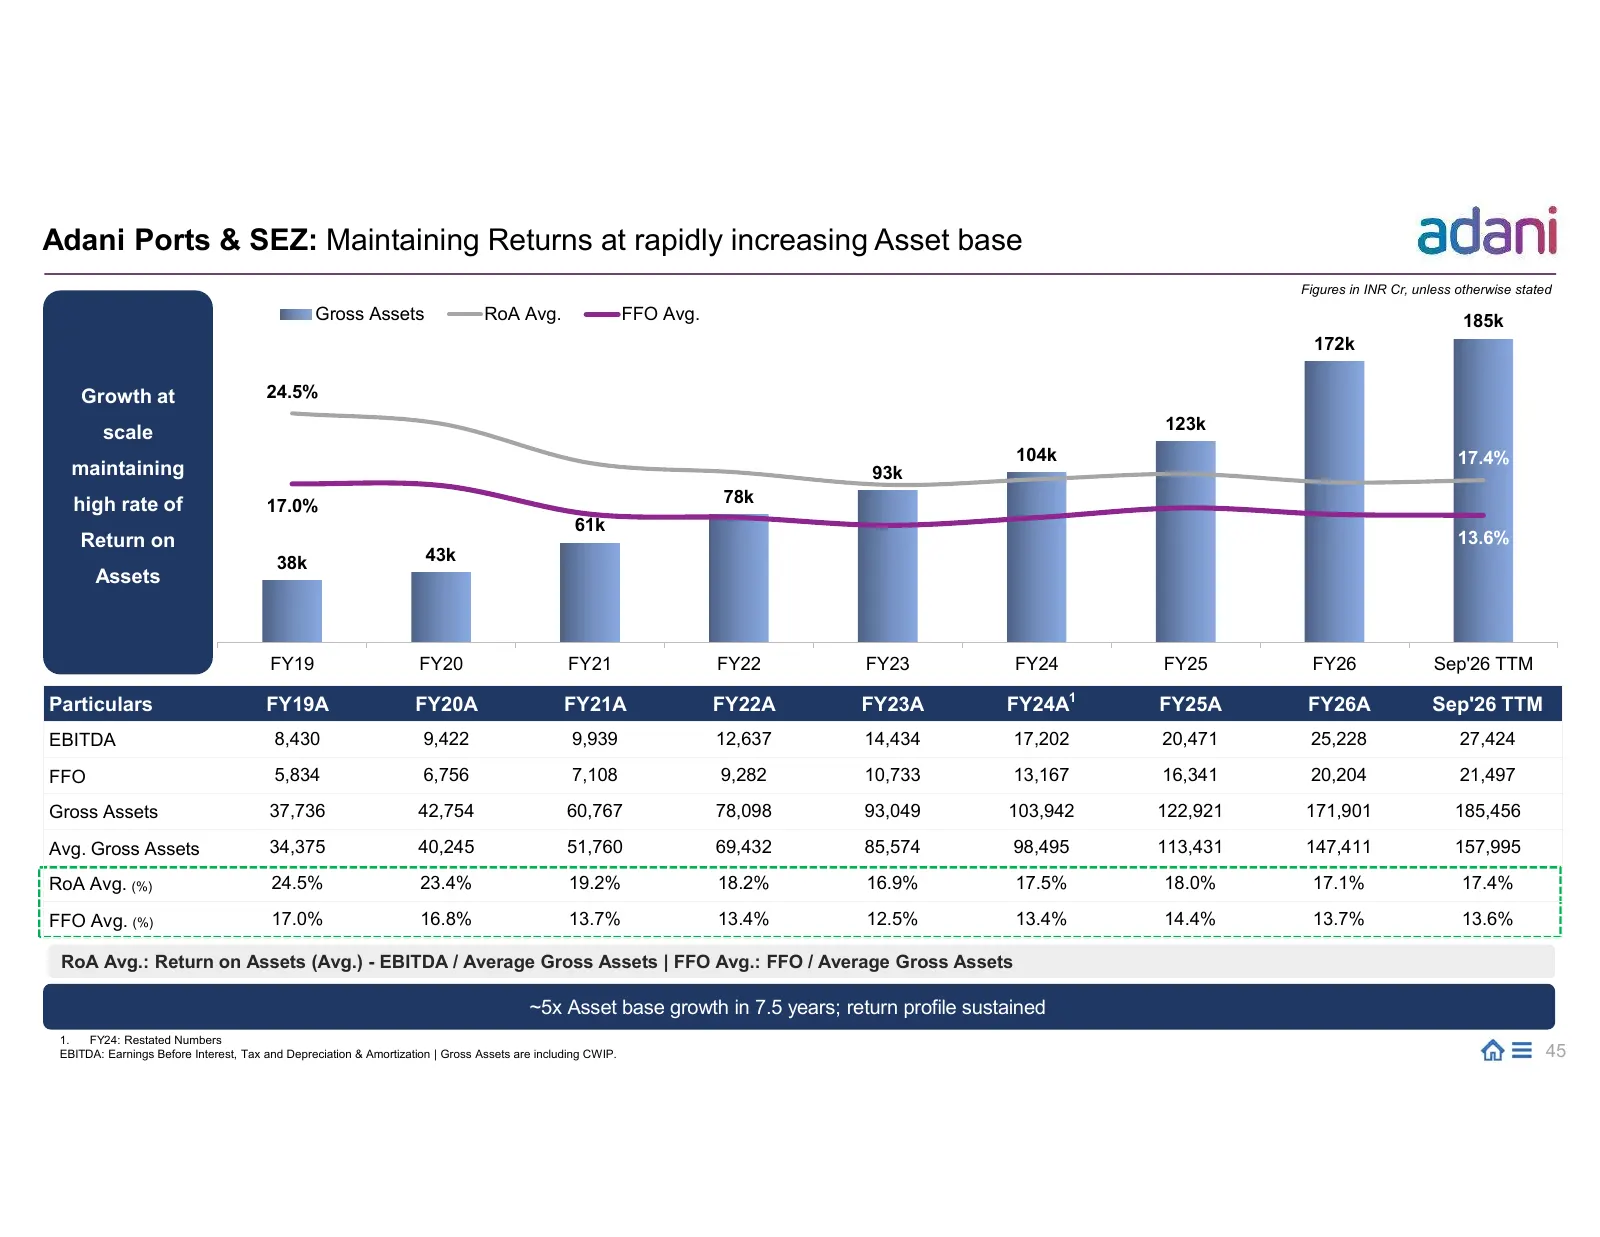
Slide 45: Adani Ports & SEZ: Maintaining Returns at rapidly increasing Asset base
Adani Ports & SEZ: Maintaining Returns at rapidly increasing Asset base Figures in INR Cr, unless otherwise stated Gross Assets RoA Avg. FFO Avg. 185k 172k Growth at 24.5% 123k scale 104k 17.4% maintaining 93k high rate of 78k 17.0% 61k Return on 13.6% 38k 43k Assets FY19 FY20 FY21 FY22 FY23 FY24 FY
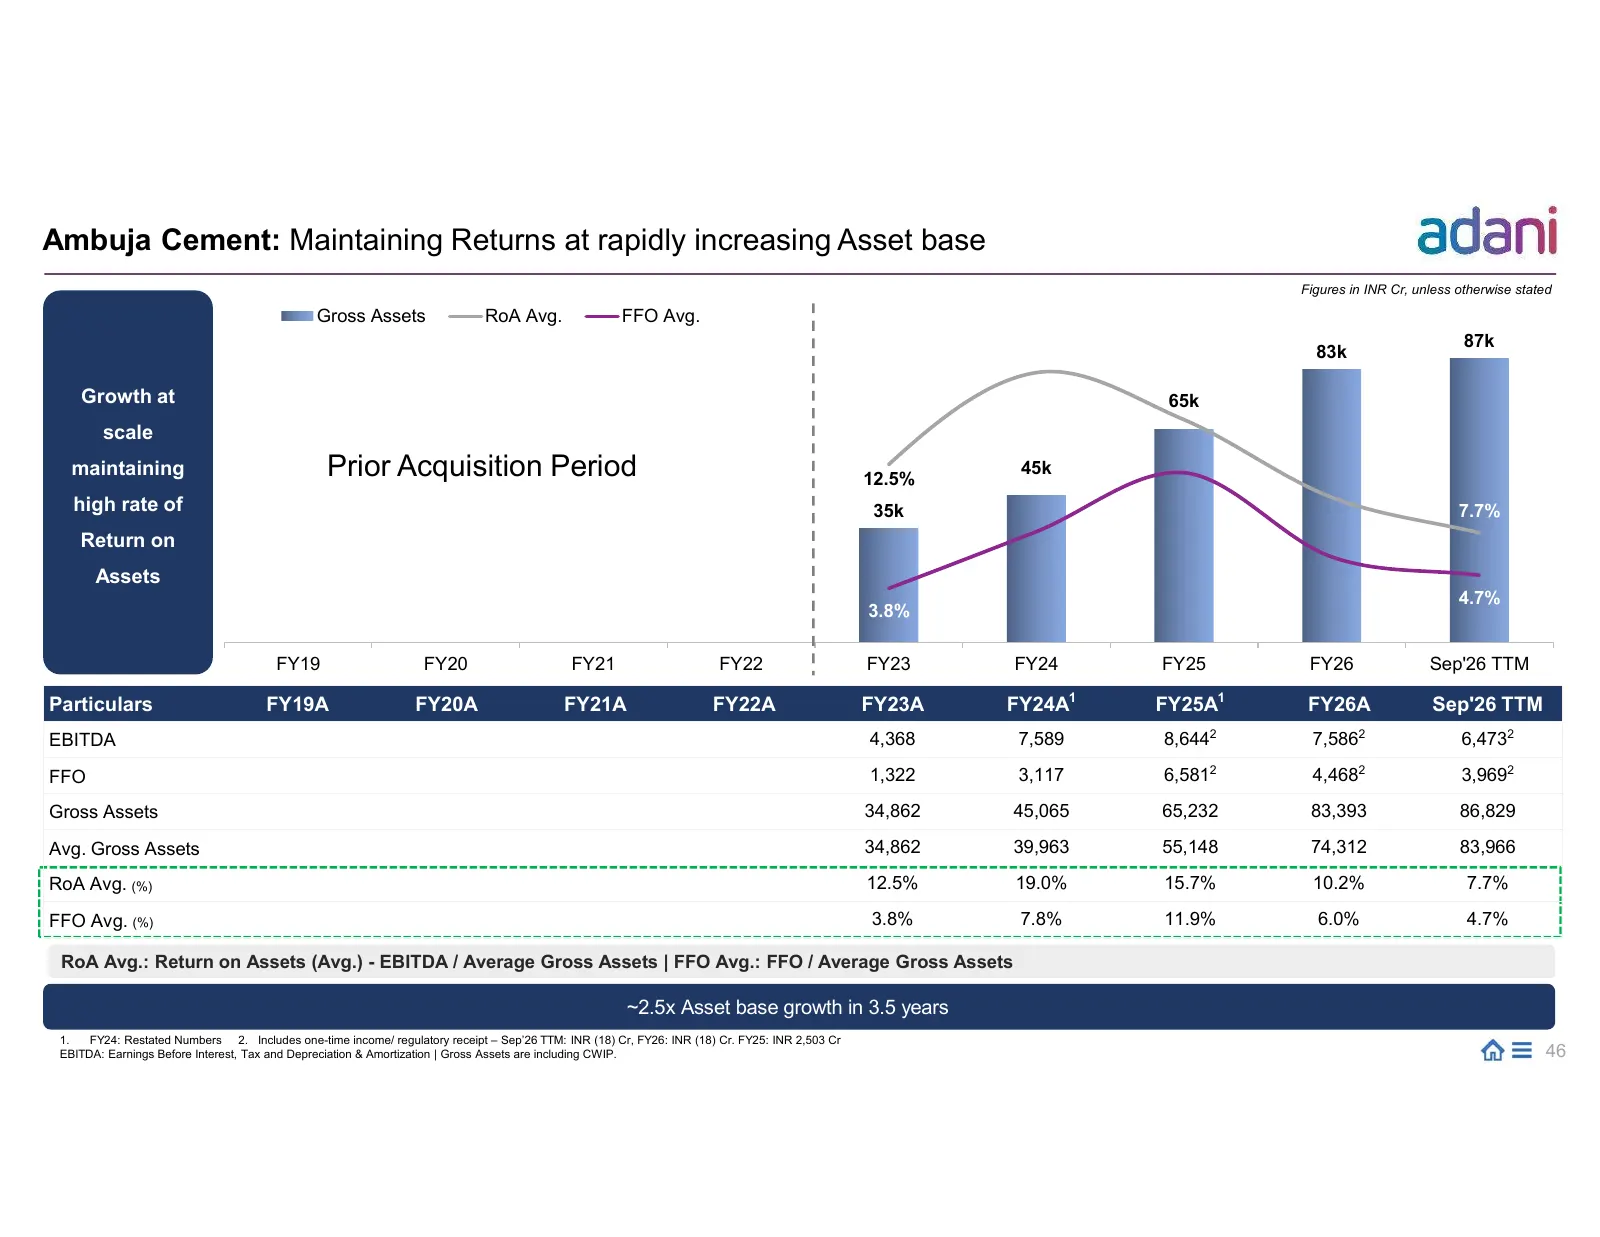
Slide 46: Ambuja Cement: Maintaining Returns at rapidly increasing Asset base
Ambuja Cement: Maintaining Returns at rapidly increasing Asset base Figures in INR Cr, unless otherwise stated Gross Assets RoA Avg. FFO Avg. 87k 83k Growth at 65k scale maintaining Prior Acquisition Period 12.5% 45k high rate of 35k 7.7% Return on Assets 4.7% 3.8% FY19 FY20 FY21 FY22 FY23 FY24 FY25
Slide 47: Ownership Structure
ANNEXURE Ownership Structure STRICTLY CONFIDENTIAL
Slide 48: Shareholding Summary
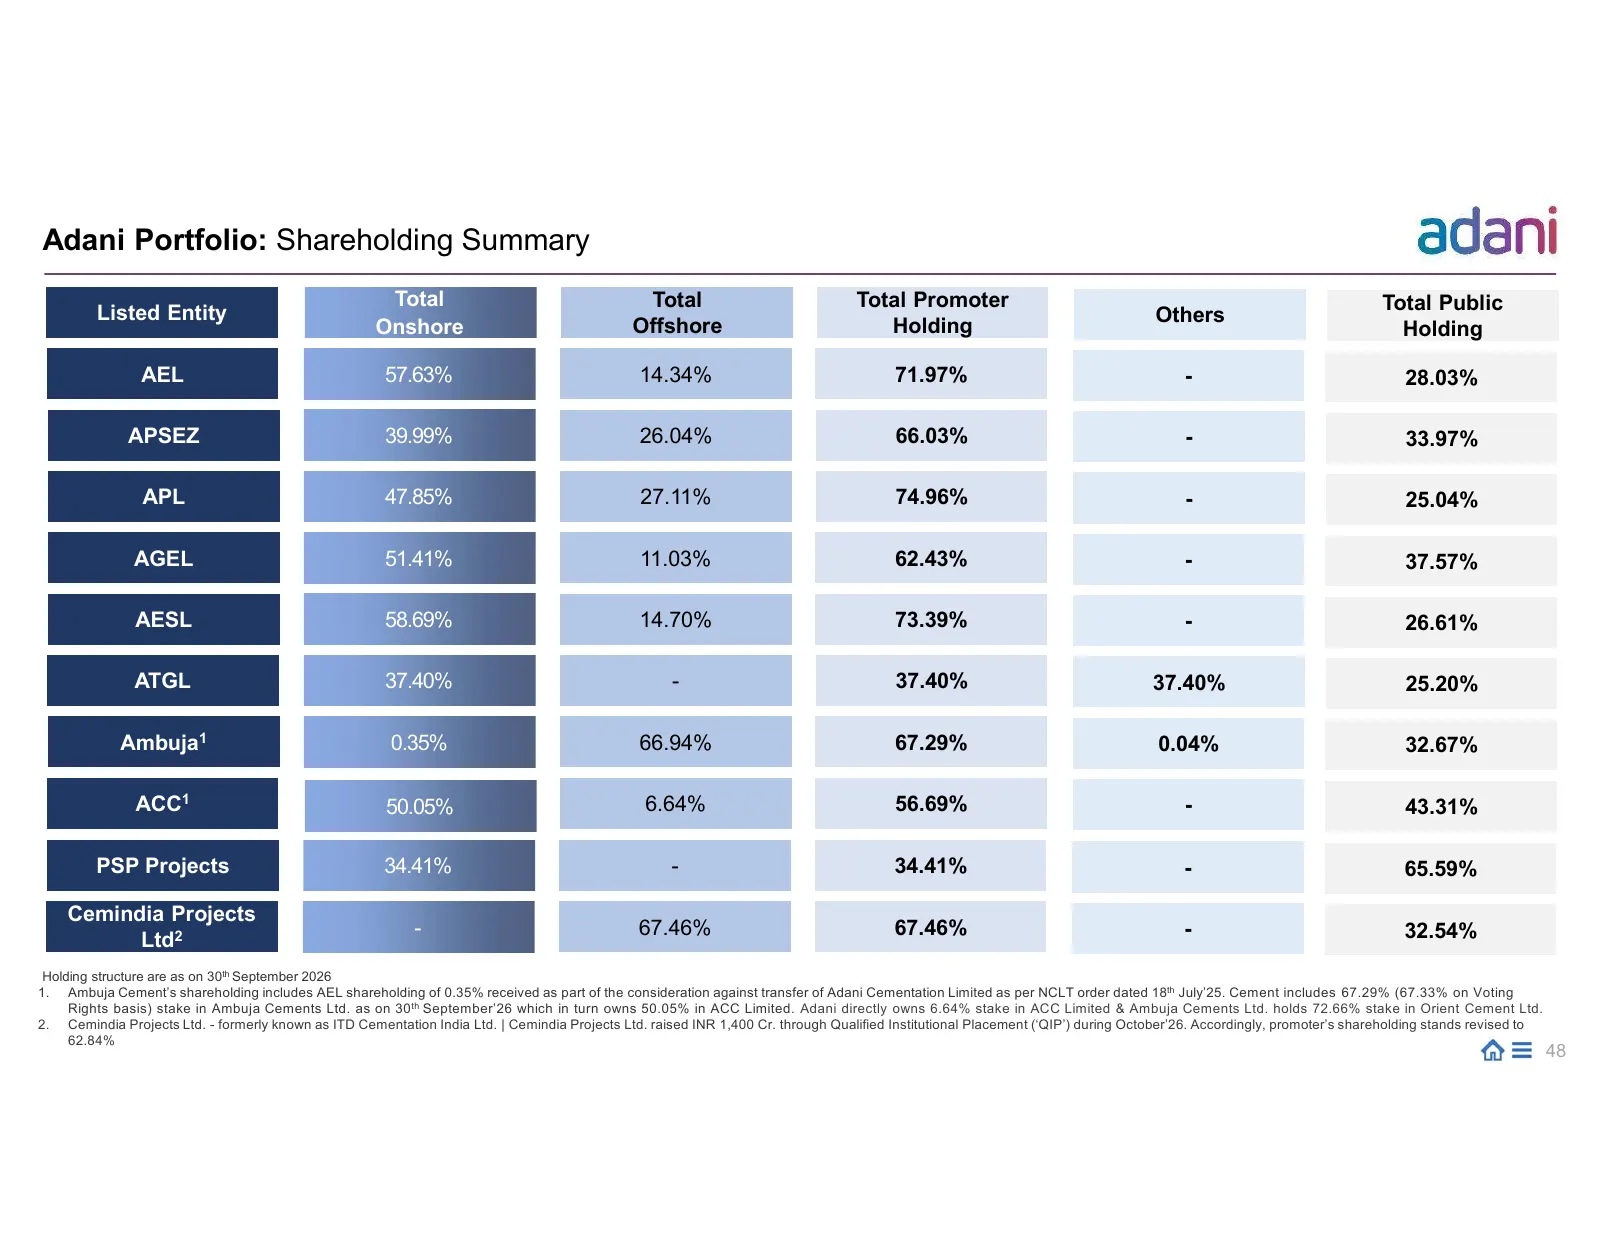
Adani Portfolio: Shareholding Summary Total Total Total Promoter Total Public Listed Entity Others Onshore Offshore Holding Holding AEL 57.63% 14.34% 71.97% - 28.03% APSEZ 39.99% 26.04% 66.03% - 33.97% APL 47.85% 27.11% 74.96% - 25.04% AGEL 51.41% 11.03% 62.43% - 37.57% AESL 58.69% 14.70% 73.39% - 2
Slide 49: UBO (Onshore)
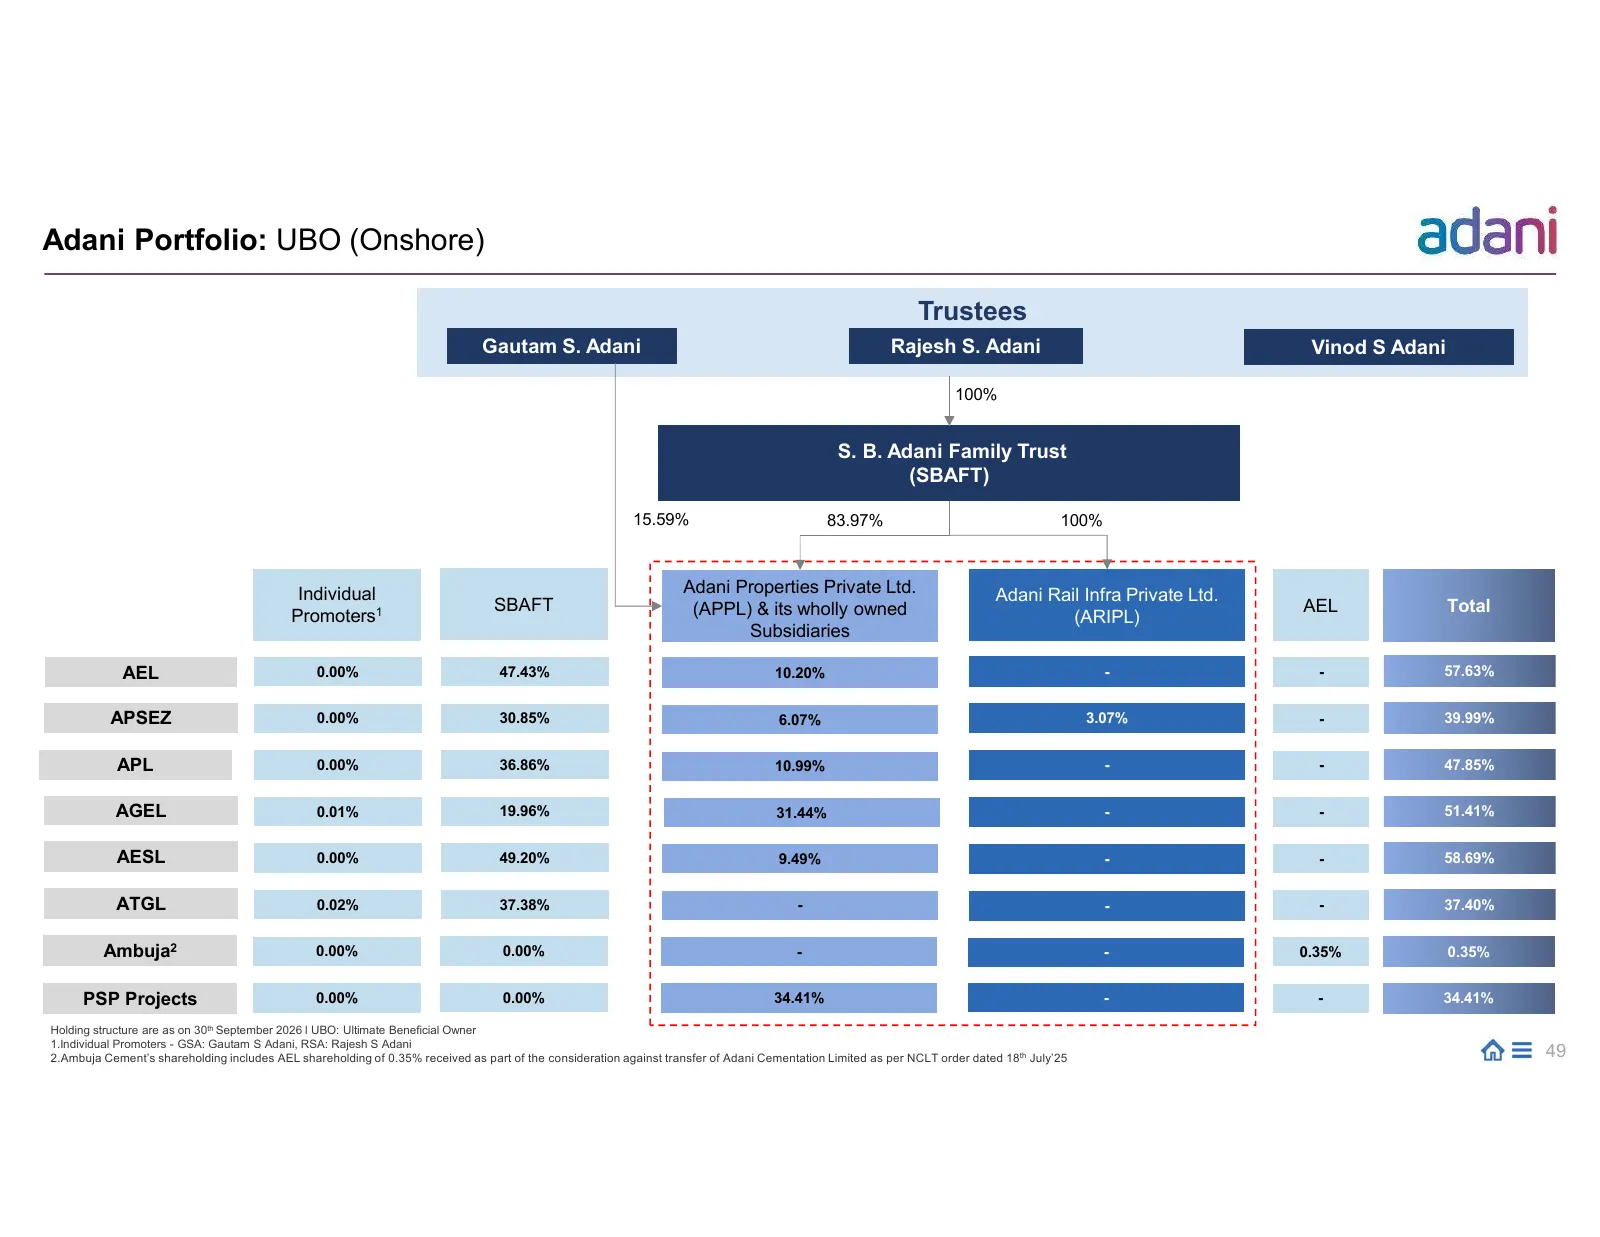
Adani Portfolio: UBO (Onshore) Trustees Gautam S. Adani Rajesh S. Adani Vinod S Adani 100% S. B. Adani Family Trust (SBAFT) 15.59% 83.97% 100% Individual Adani Properties Private Ltd. Adani Rail Infra Private Ltd. SBAFT (APPL) & its wholly owned AEL Total Promoters1 (ARIPL) Subsidiaries AEL 0.00% 47
Slide 50: UBO (Offshore)
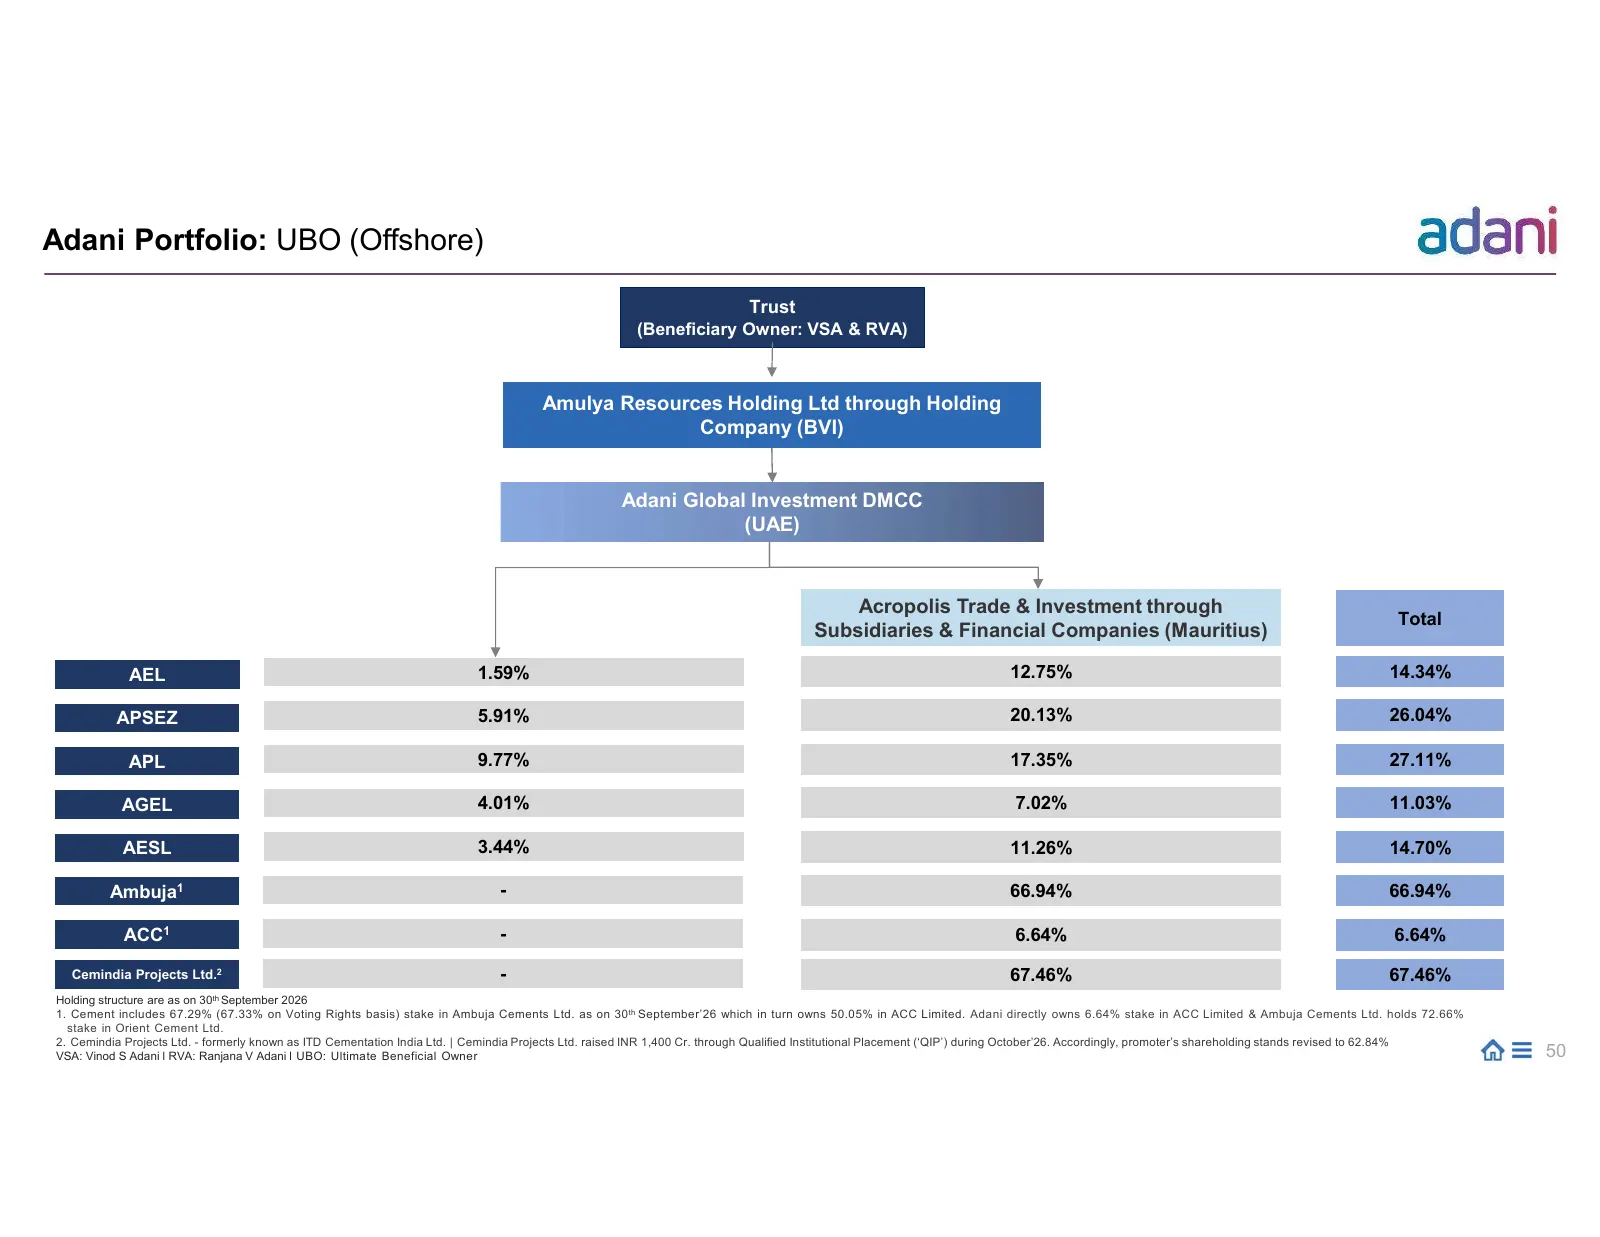
Adani Portfolio: UBO (Offshore) Trust (Beneficiary Owner: VSA & RVA) Amulya Resources Holding Ltd through Holding Company (BVI) Adani Global Investment DMCC (UAE) Acropolis Trade & Investment through Total Subsidiaries & Financial Companies (Mauritius) AEL 1.59% 12.75% 14.34% APSEZ 5.91% 20.13% 26.0
Slide 51: Synergy
ANNEXURE Synergy STRICTLY CONFIDENTIAL
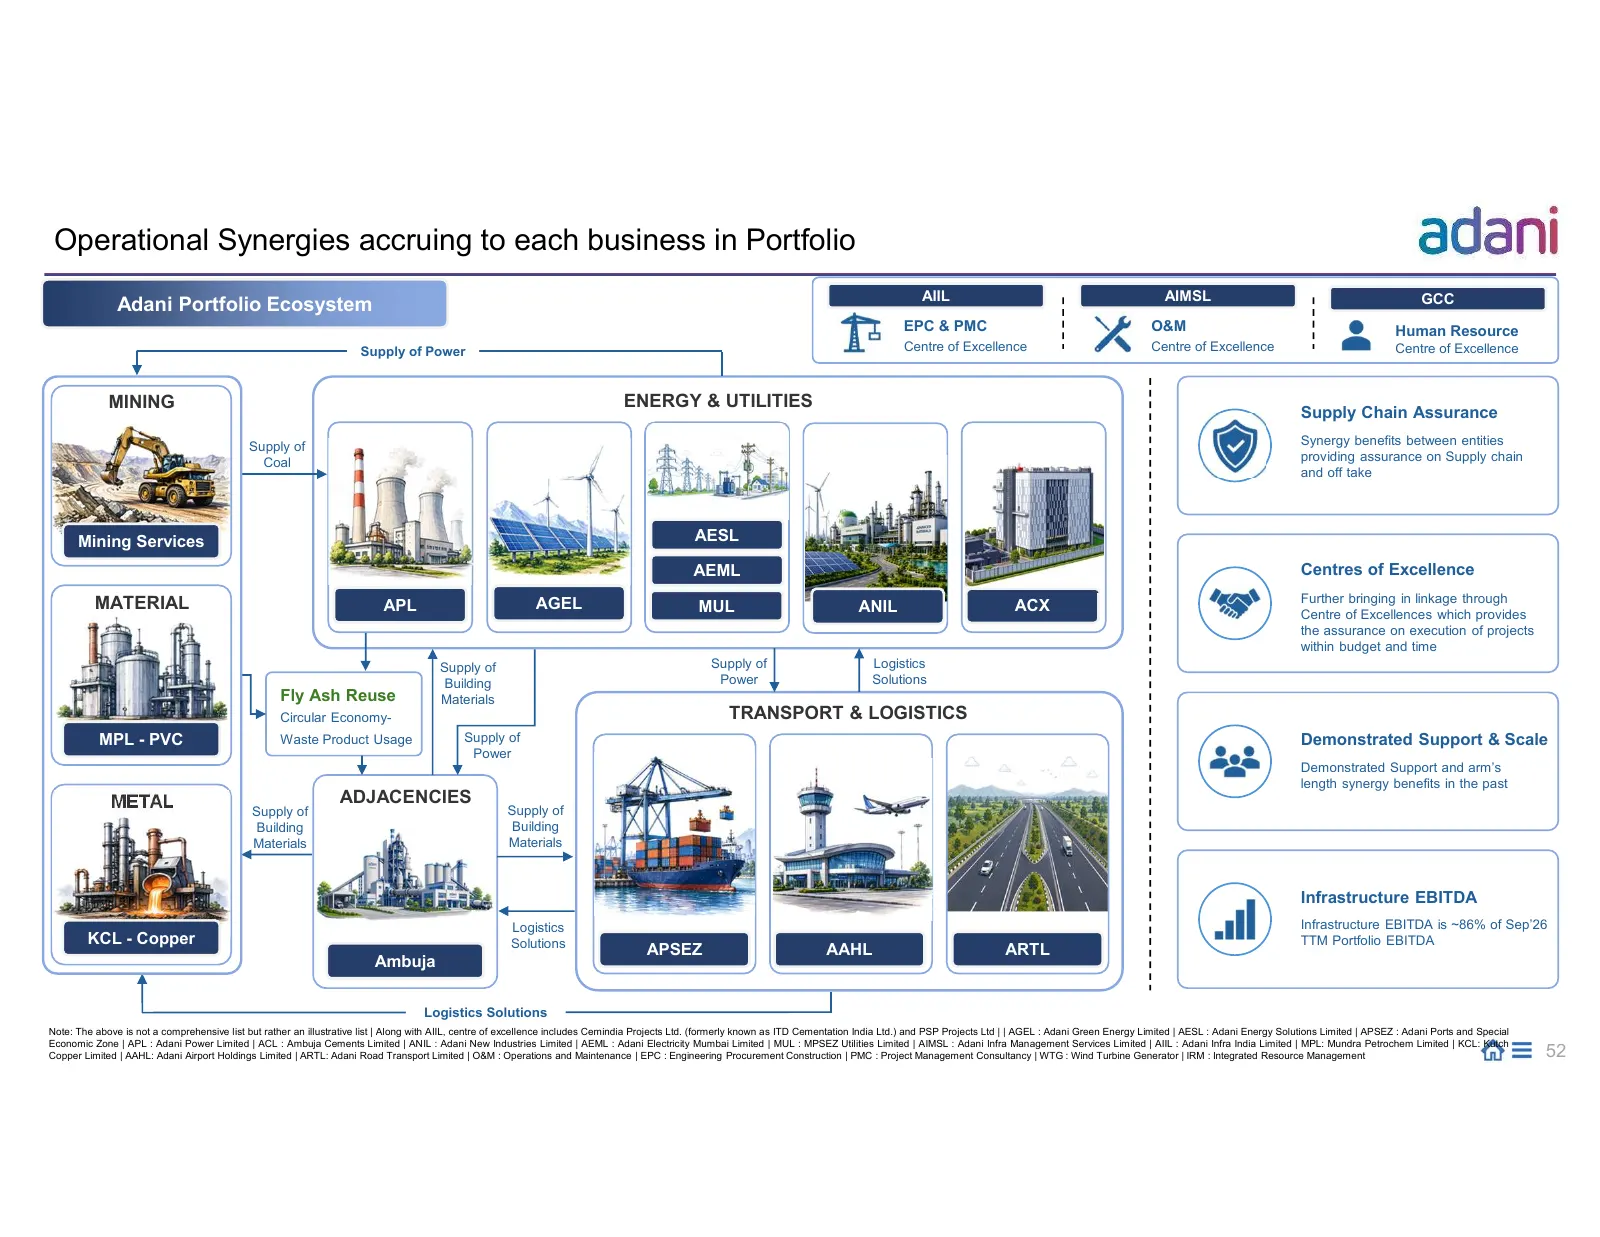
Slide 52: Operational Synergies accruing to each business in Portfolio
Operational Synergies accruing to each business in Portfolio AIIL AIMSL GCC Adani Portfolio Ecosystem EPC & PMC O&M Human Resource Supply of Power Centre of Excellence Centre of Excellence Centre of Excellence MINING ENERGY & UTILITIES Supply Chain Assurance Supply of Synergy benefits between entiti
Slide 53: Miscellaneous
ANNEXURE Miscellaneous STRICTLY CONFIDENTIAL
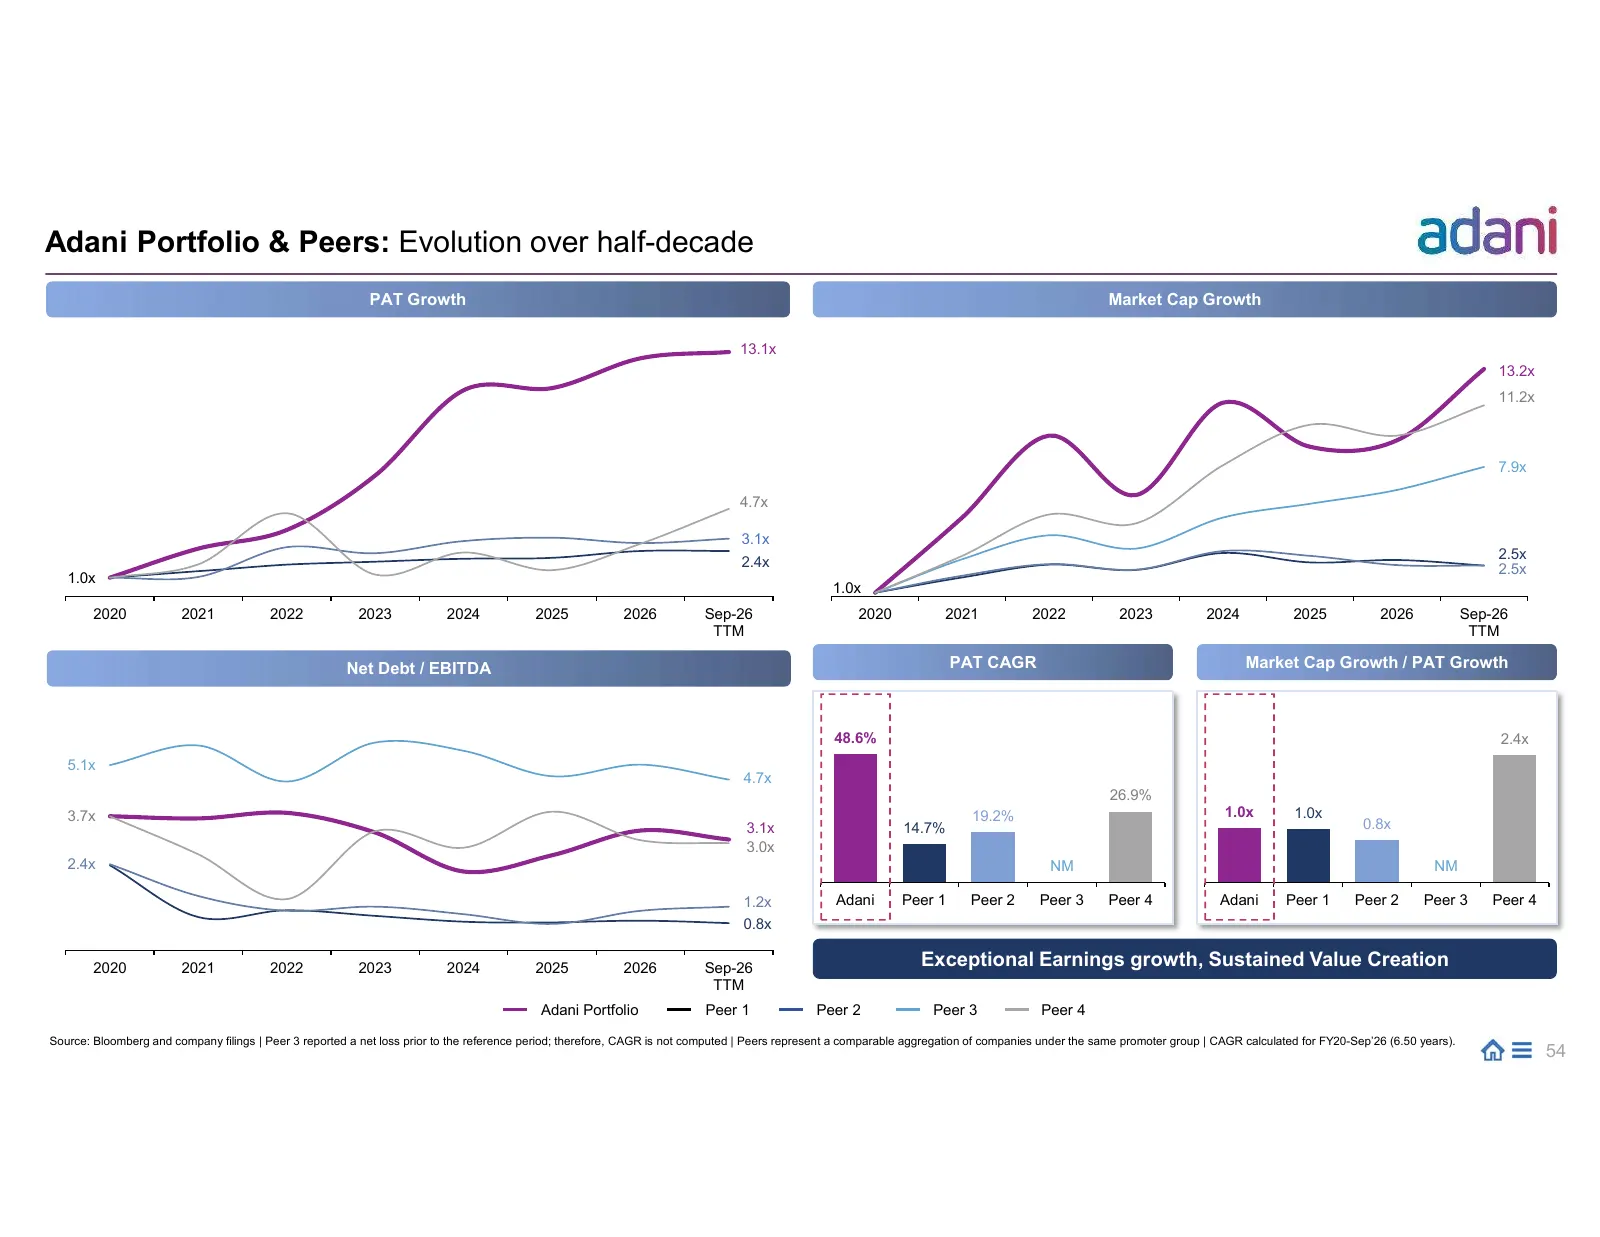
Slide 54: Portfolio & Peers: Evolution over half-decade
Adani Portfolio & Peers: Evolution over half-decade PAT Growth Market Cap Growth 13.1x 13.2x 11.2x 7.9x 4.7x 3.1x 2.5x 2.4x 2.5x 1.0x 1.0x 2020 2021 2022 2023 2024 2025 2026 Sep-26 2020 2021 2022 2023 2024 2025 2026 Sep-26 TTM TTM Net Debt / EBITDA PAT CAGR Market Cap Growth / PAT Growth 48.6% 2.4x
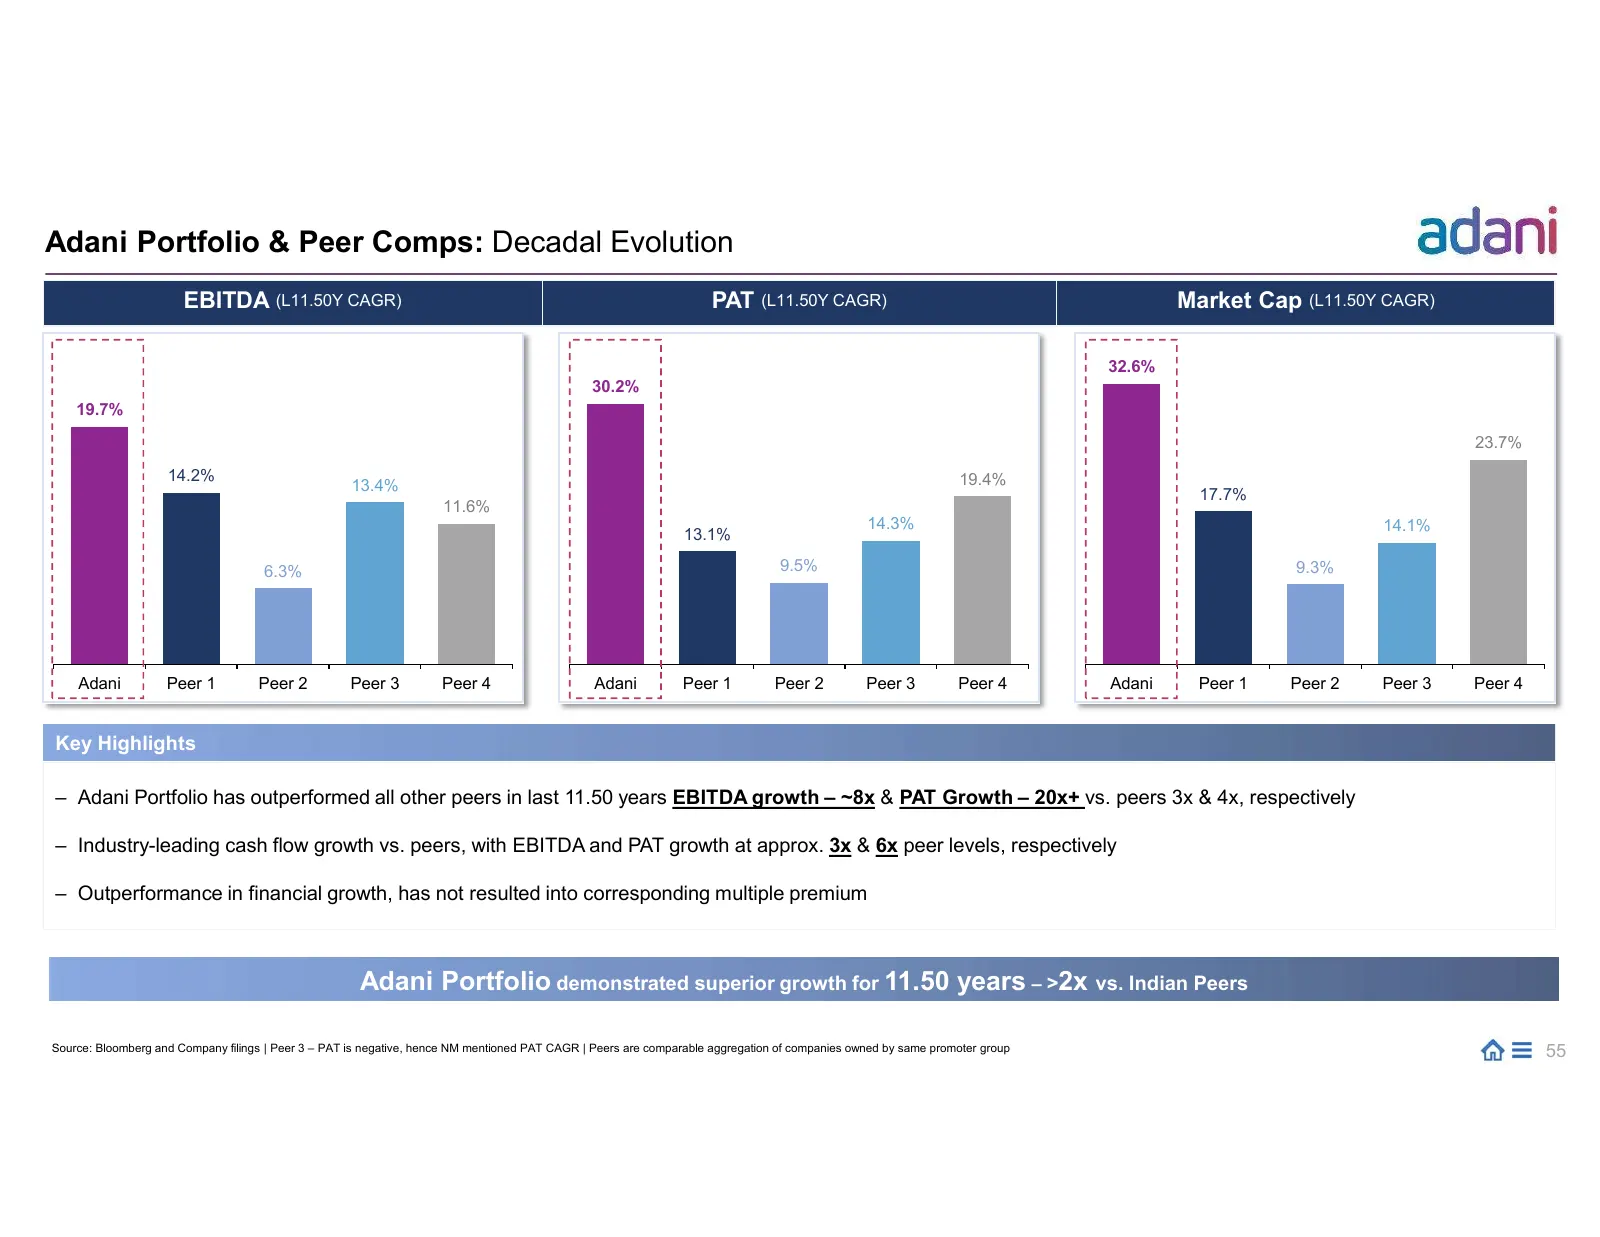
Slide 55: Portfolio & Peer Comps: Decadal Evolution
Adani Portfolio & Peer Comps: Decadal Evolution EBITDA (L11.50Y CAGR) PAT (L11.50Y CAGR) Market Cap (L11.50Y CAGR) 32.6% 30.2% 19.7% 23.7% 14.2% 19.4% 13.4% 17.7% 11.6% 14.3% 14.1% 13.1% 6.3% 9.5% 9.3% Adani Peer 1 Peer 2 Peer 3 Peer 4 Adani Peer 1 Peer 2 Peer 3 Peer 4 Adani Peer 1 Peer 2 Peer 3 Pee

Slide 56: adani
adani
Source: company website
More decks from Ambuja Cements Limited
 H1 FY27 Earnings Presentation40 slides · November 2026
 H1 FY27 Earnings Presentation40 slides · November 2026
 Adani Portfolio — ESG Presentation (November 2026)18 slides · November 2026
 Q2 FY2027 Earnings Presentation39 slides · Oct 29, 2026
 Q2 FY2027 Earnings Presentation40 slides · Oct 29, 2026
 Q2 FY2027 Earnings Presentation40 slides · Oct 29, 2026