Ambuja Cements Limited · NSE:AMBUJACEM
Ambuja Cements — H1 FY27 Earnings Presentation
40 slides from Ambuja Cements's earnings presentation, November 2026

Slide 1: Adani Portfolio | Result Snapshot – H1 FY27
Adani Portfolio | Result Snapshot – H1 FY27 November 2026
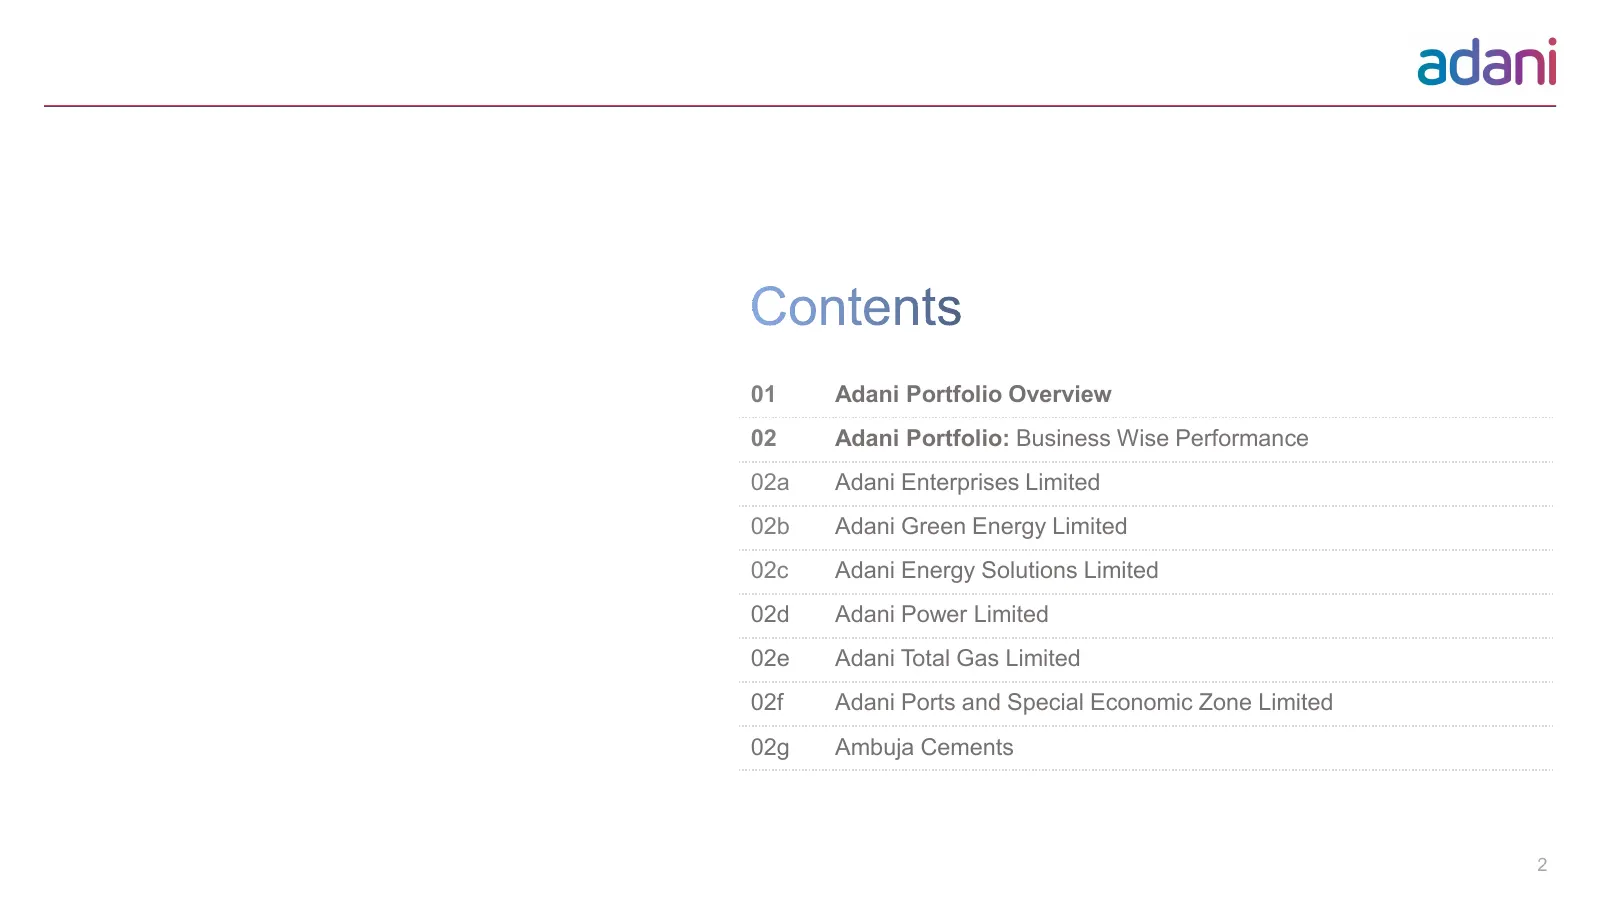
Slide 2: Contents
Contents 01 Adani Portfolio Overview 02 Adani Portfolio: Business Wise Performance 02a Adani Enterprises Limited 02b Adani Green Energy Limited 02c Adani Energy Solutions Limited 02d Adani Power Limited 02e Adani Total Gas Limited 02f Adani Ports and Special Economic Zone Limited 02g Ambuja Cements
Slide 3: Adani Portfolio Overview
01 Adani Portfolio Overview STRICTLY CONFIDENTIAL
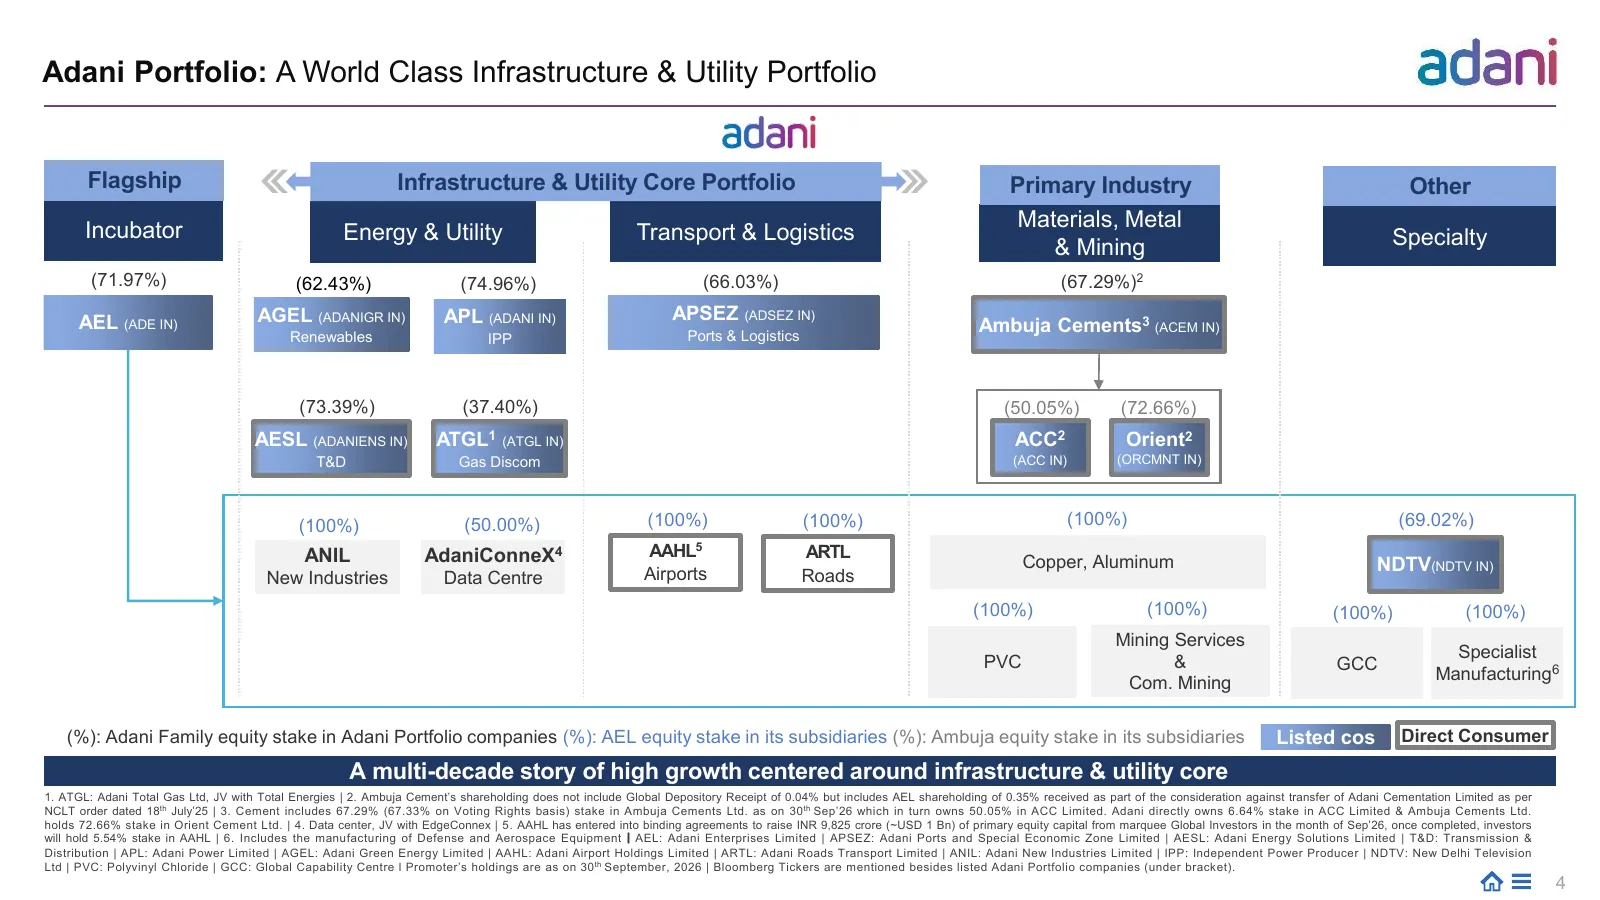
Slide 4: Adani Portfolio: A World Class Infrastructure & Utility Portfolio
Adani Portfolio: A World Class Infrastructure & Utility Portfolio Flagship Infrastructure & Utility Core Portfolio Primary Industry Other Incubator Materials, Metal Energy & Utility Transport & Logistics Specialty & Mining (71.97%) (62.43%) (74.96%) (66.03%) (67.29%)2 AEL (ADE IN) AGEL (ADANIGR IN)
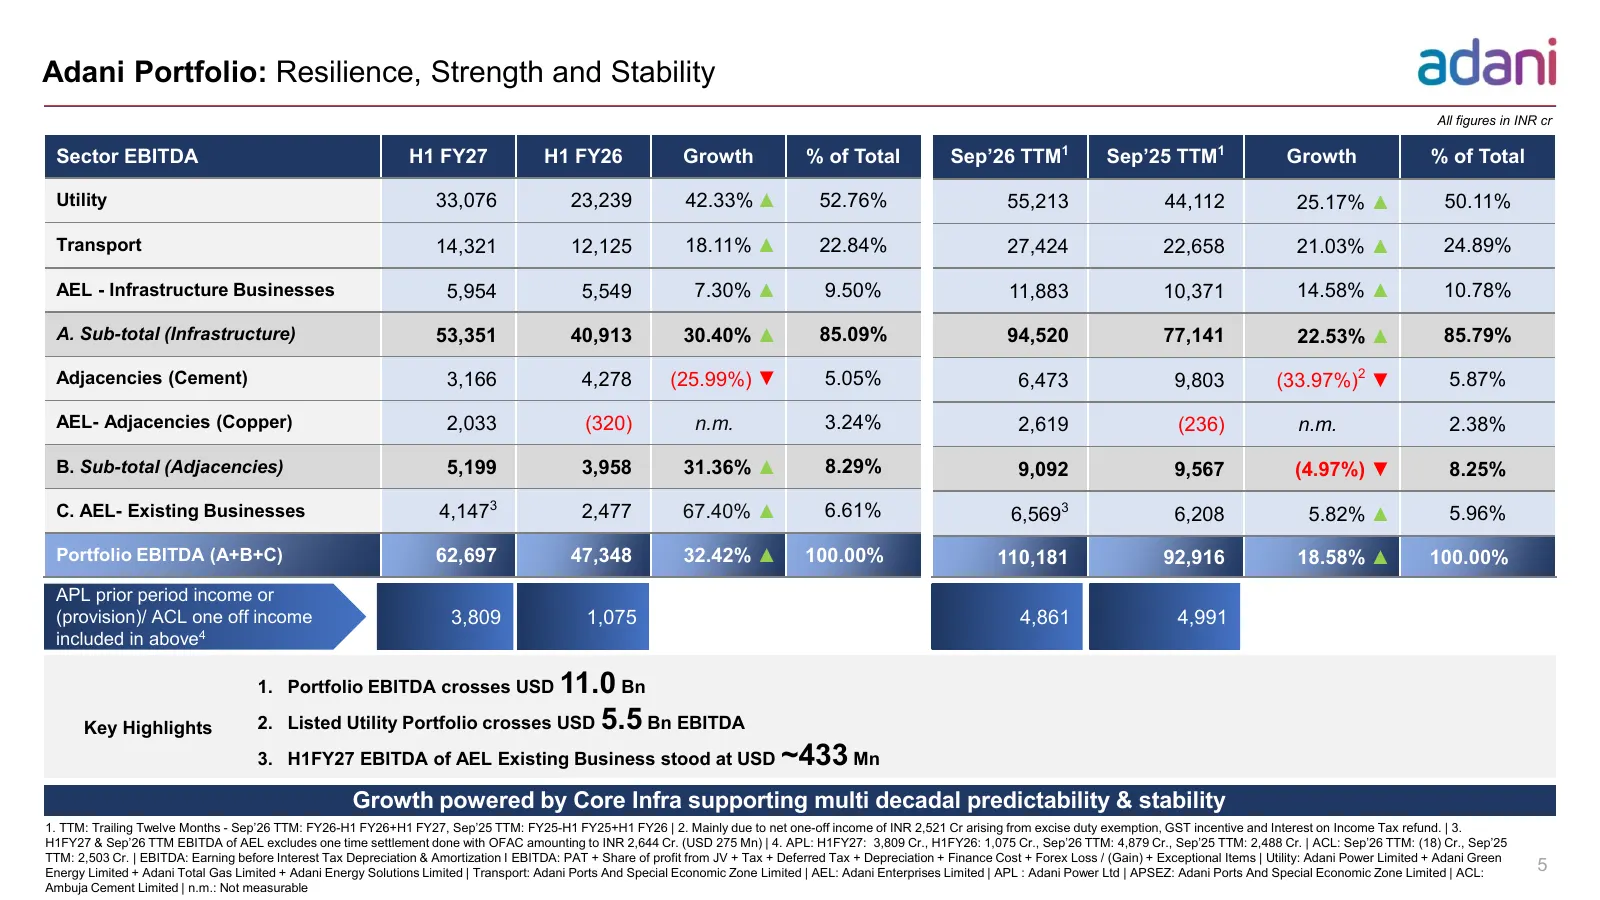
Slide 5: Adani Portfolio: Resilience, Strength and Stability
Adani Portfolio: Resilience, Strength and Stability All figures in INR cr Sector EBITDA H1 FY27 H1 FY26 Growth % of Total Sep’26 TTM1 Sep’25 TTM1 Growth % of Total Utility 33,076 23,239 42.33% ▲ 52.76% 55,213 44,112 25.17% ▲ 50.11% Transport 14,321 12,125 18.11% ▲ 22.84% 27,424 22,658 21.03% ▲ 24.89
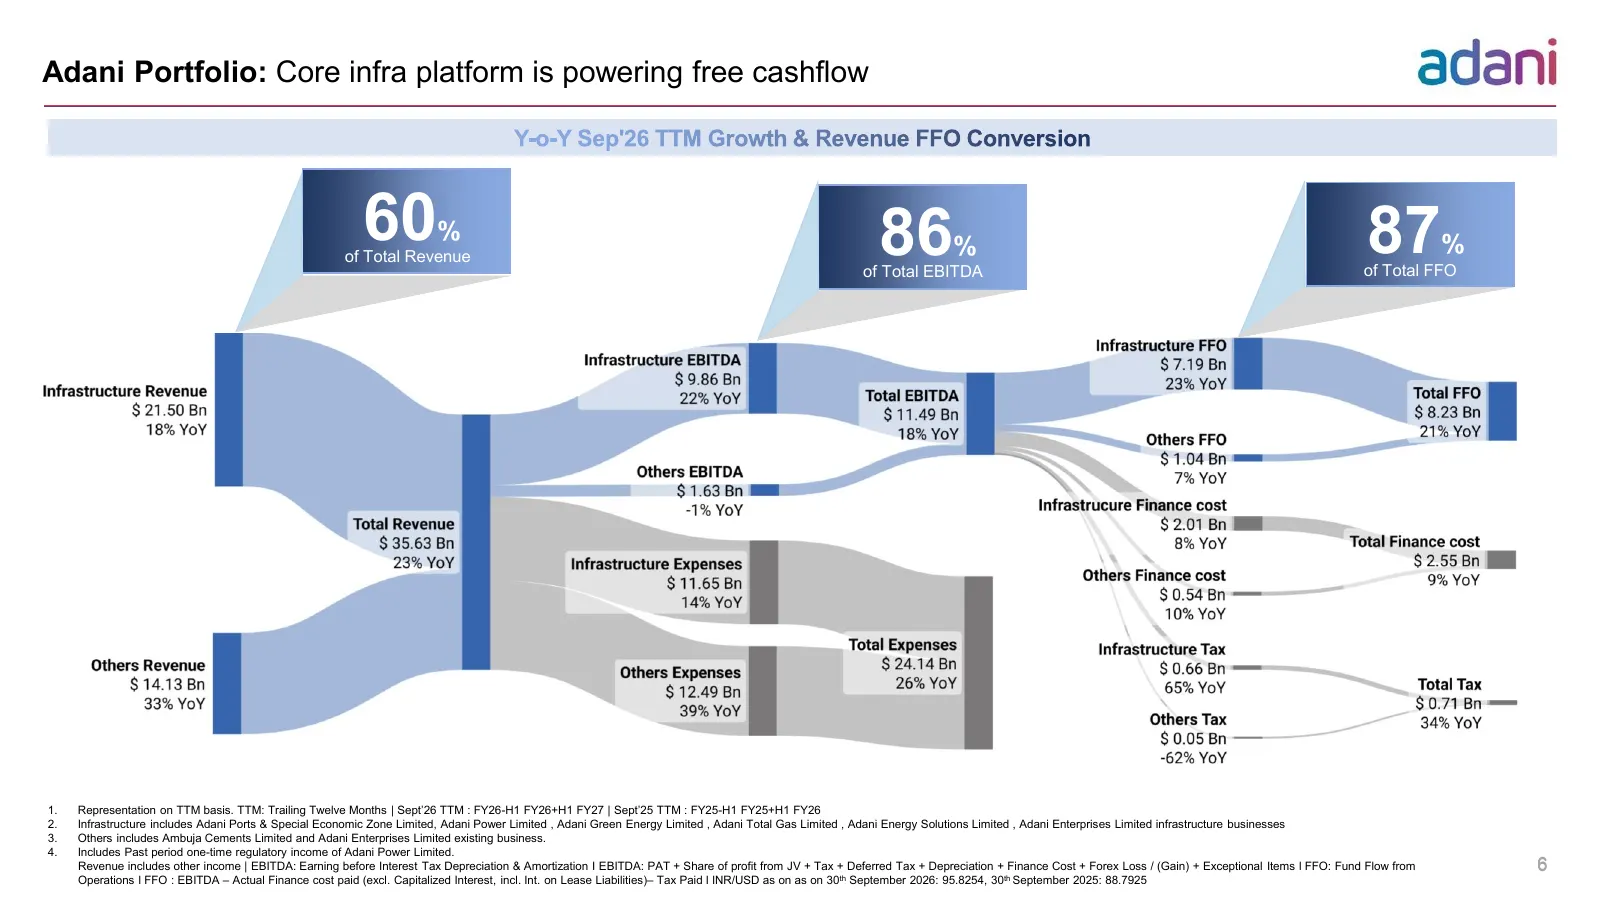
Slide 6: Adani Portfolio: Core infra platform is powering free cashflow
Adani Portfolio: Core infra platform is powering free cashflow Y-o-Y Sep'26 TTM Growth & Revenue FFO Conversion 60 of Total Revenue % 86 % 87 % of Total Revenue of Total EBITDA of Total FFO 1. Representation on TTM basis. TTM: Trailing Twelve Months | Sept’26 TTM : FY26-H1 FY26+H1 FY27 | Sept’25 TTM
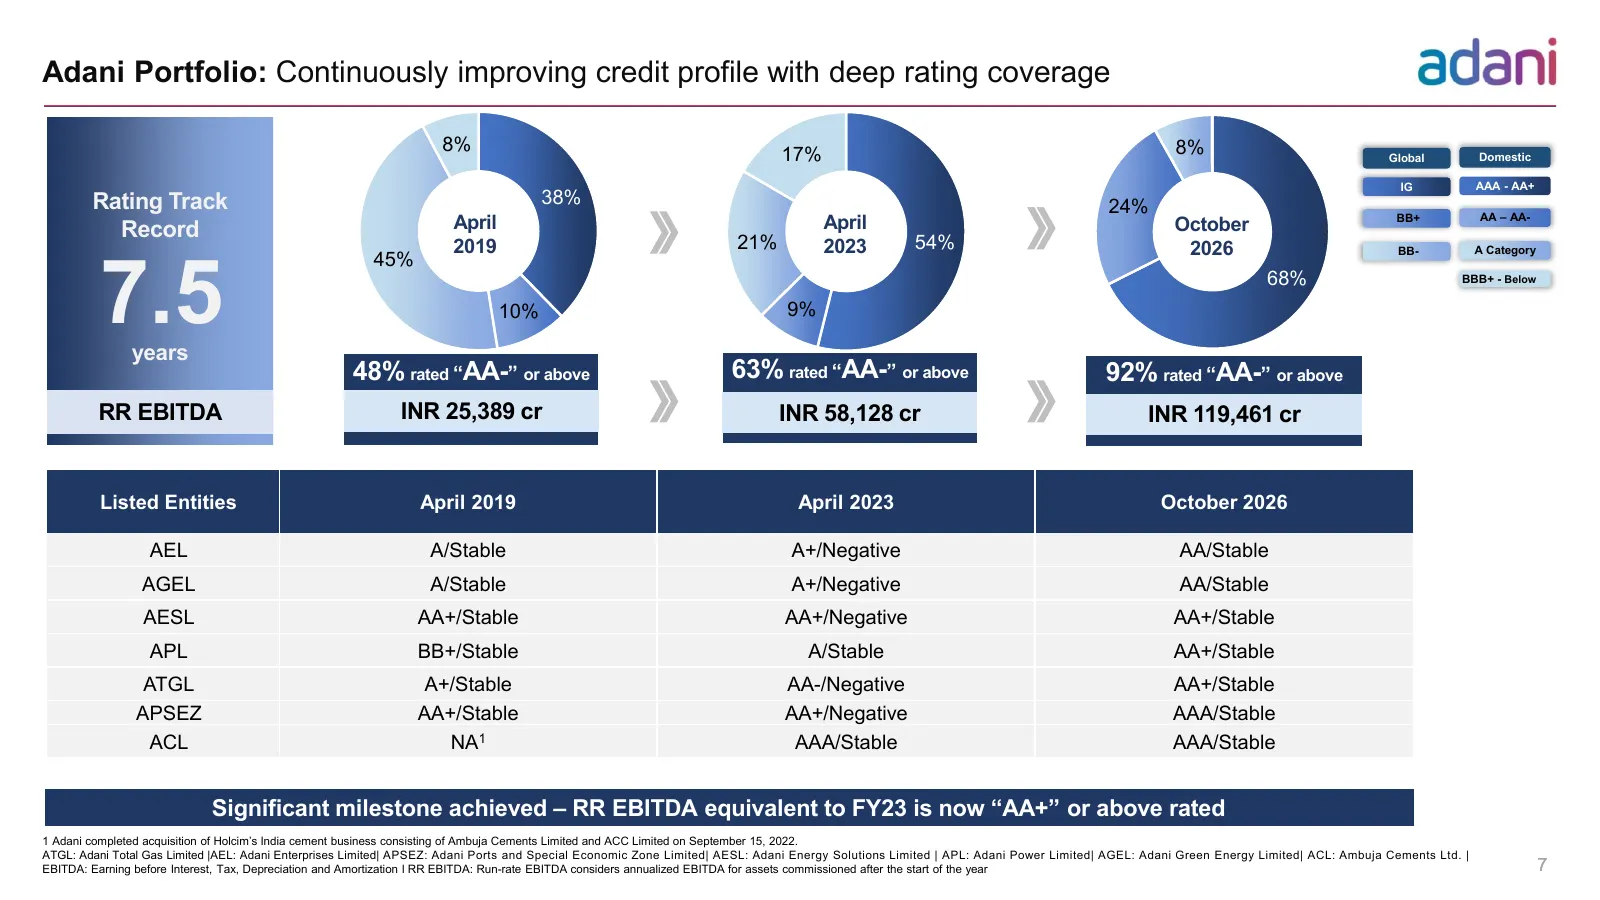
Slide 7: Adani Portfolio: Continuously improving credit profile with deep rating coverage
Adani Portfolio: Continuously improving credit profile with deep rating coverage 8% 17% 8% Global Domestic IG AAA - AA+ Rating Track 38% 24% Record April April October BB+ AA – AA- 2019 21% 2023 54% 2026 7.5 BB- A Category 45% 68% BBB+ - Below 10% 9% years 48% rated “AA-” or above 63% rated “AA-” or
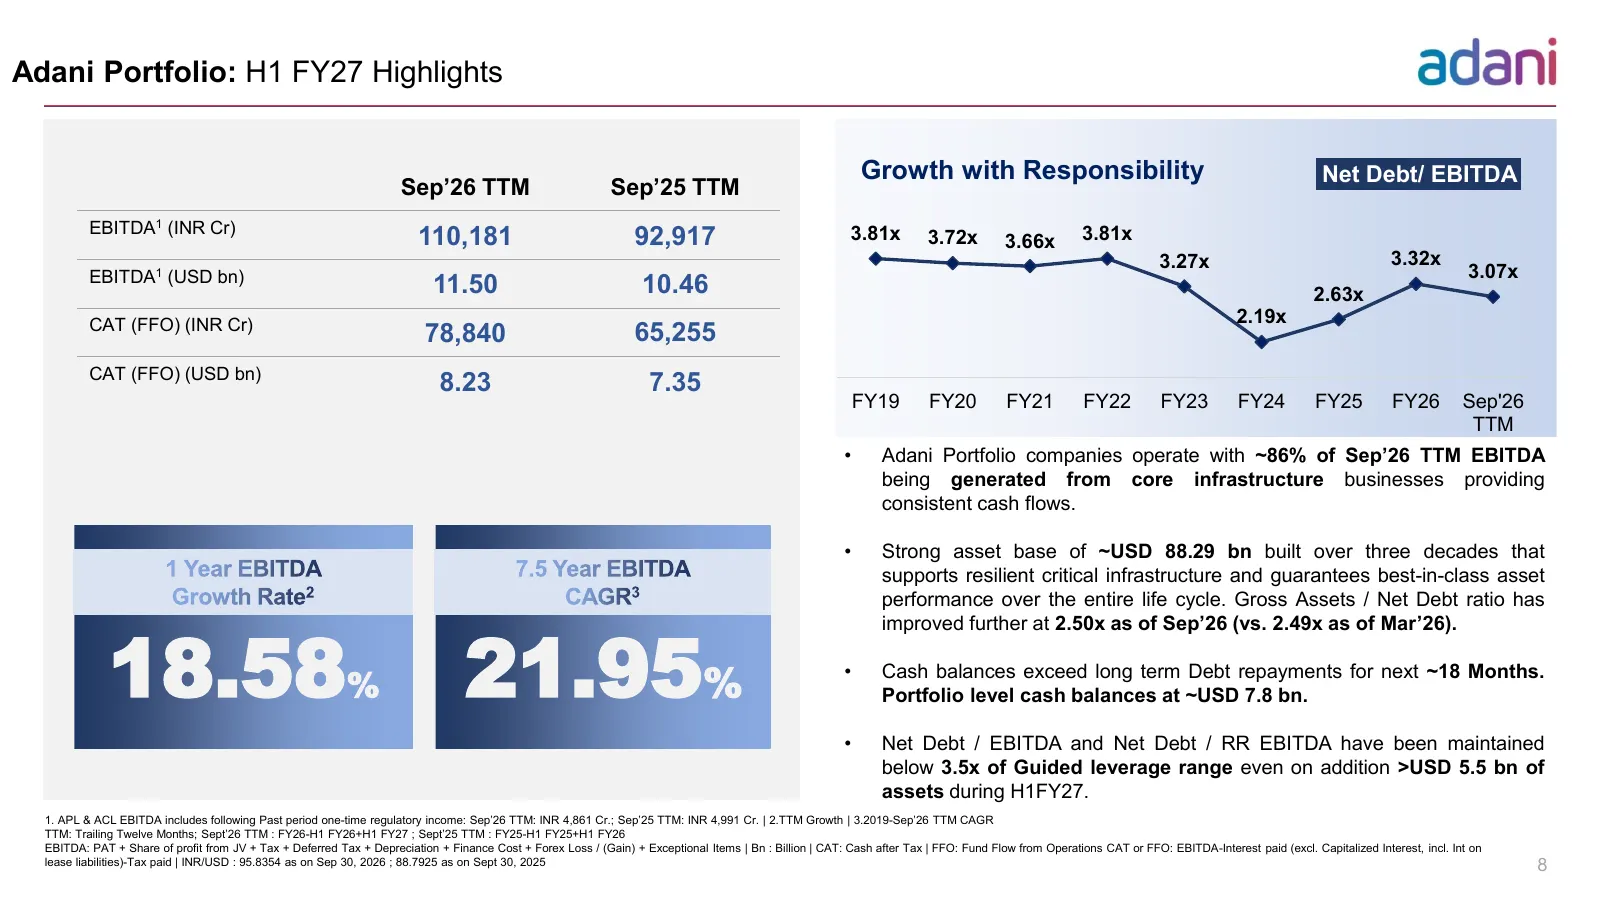
Slide 8: Adani Portfolio: H1 FY27 Highlights
Adani Portfolio: H1 FY27 Highlights Growth with Responsibility Net Debt/ EBITDA Sep’26 TTM Sep’25 TTM EBITDA1 (INR Cr) 110,181 92,917 3.81x 3.72x 3.66x 3.81x 3.27x 3.32x EBITDA1 (USD bn) 3.07x 11.50 10.46 2.63x CAT (FFO) (INR Cr) 2.19x 78,840 65,255 CAT (FFO) (USD bn) 8.23 7.35 FY19 FY20 FY21 FY22 F
Slide 9: Adani Portfolio: Business wise Performance
02 Adani Portfolio: Business wise Performance STRICTLY CONFIDENTIAL
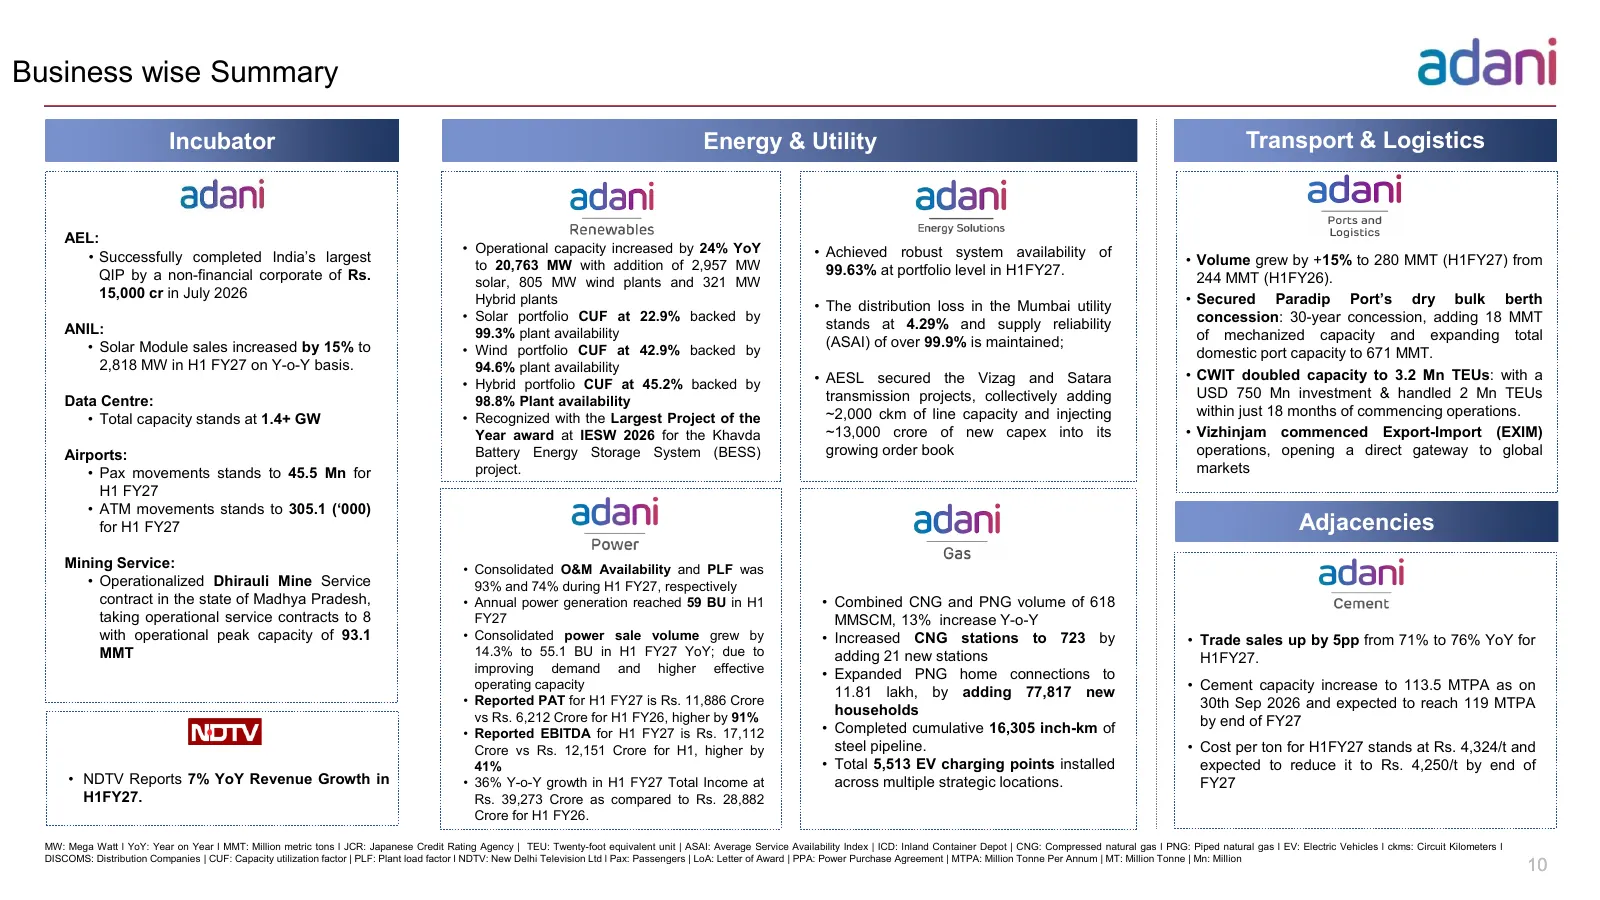
Slide 10: Business wise Summary
Business wise Summary Incubator Energy & Utility Transport & Logistics AEL: • Operational capacity increased by 24% YoY • Achieved robust system availability of • Successfully completed India’s largest • Volume grew by +15% to 280 MMT (H1FY27) from to 20,763 MW with addition of 2,957 MW 99.63% at po

Slide 11: 02a Adani Enterprises Limited
02aAdani Enterprises Limited STRICTLY CONFIDENTIAL
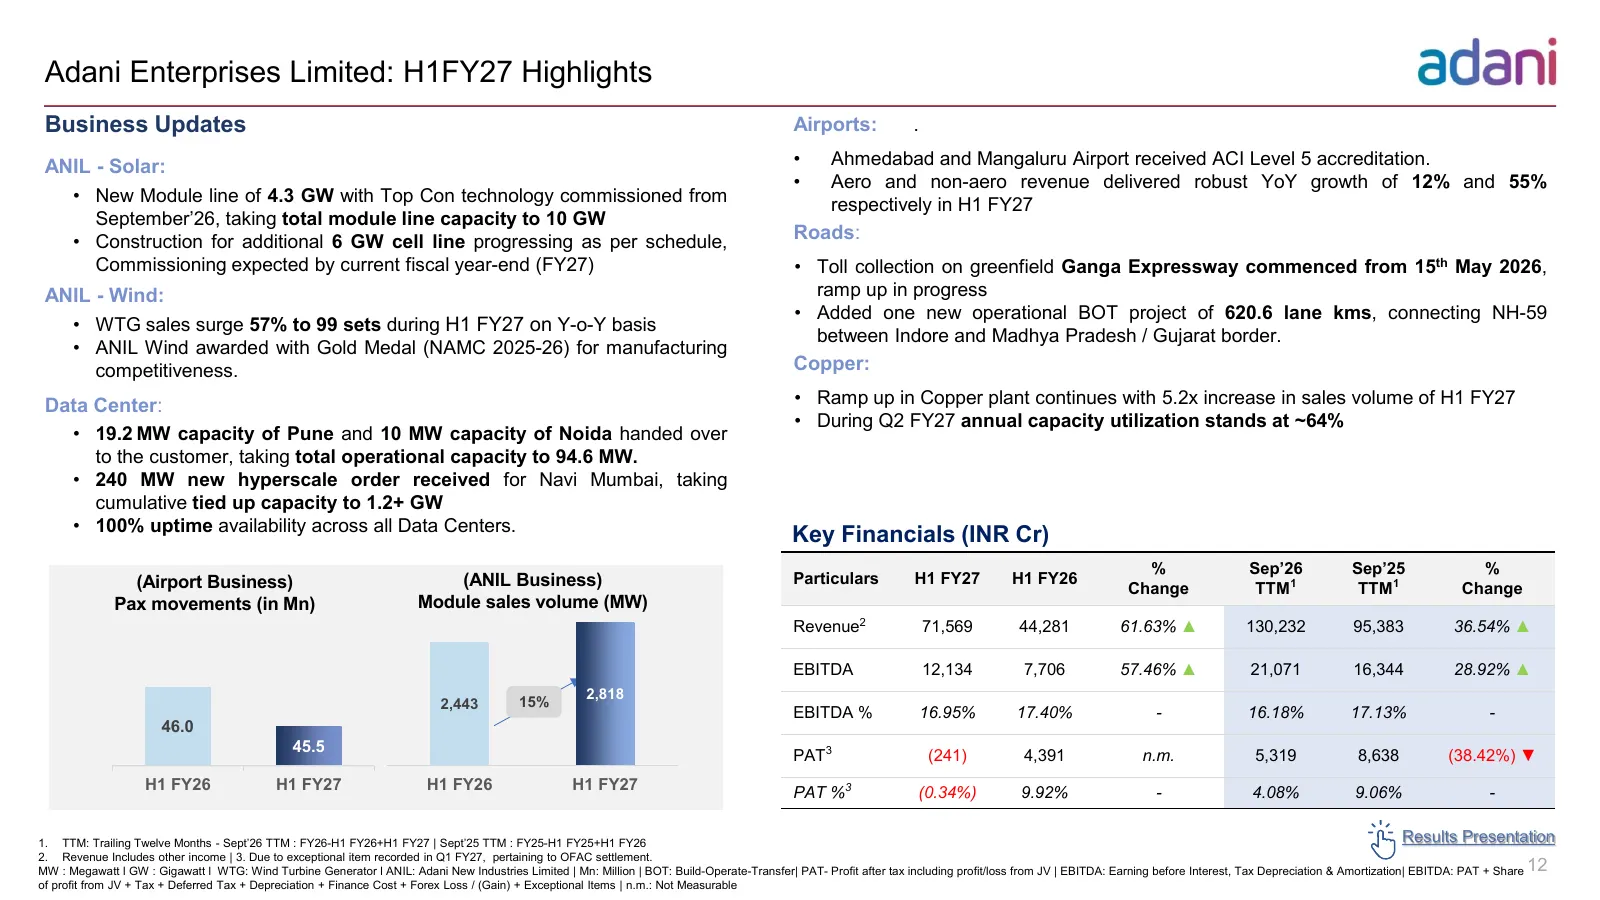
Slide 12: Adani Enterprises Limited: H1FY27 Highlights
Adani Enterprises Limited: H1FY27 Highlights Business Updates Airports: . ANIL - Solar: • Ahmedabad and Mangaluru Airport received ACI Level 5 accreditation. • Aero and non-aero revenue delivered robust YoY growth of 12% and 55% • New Module line of 4.3 GW with Top Con technology commissioned from r
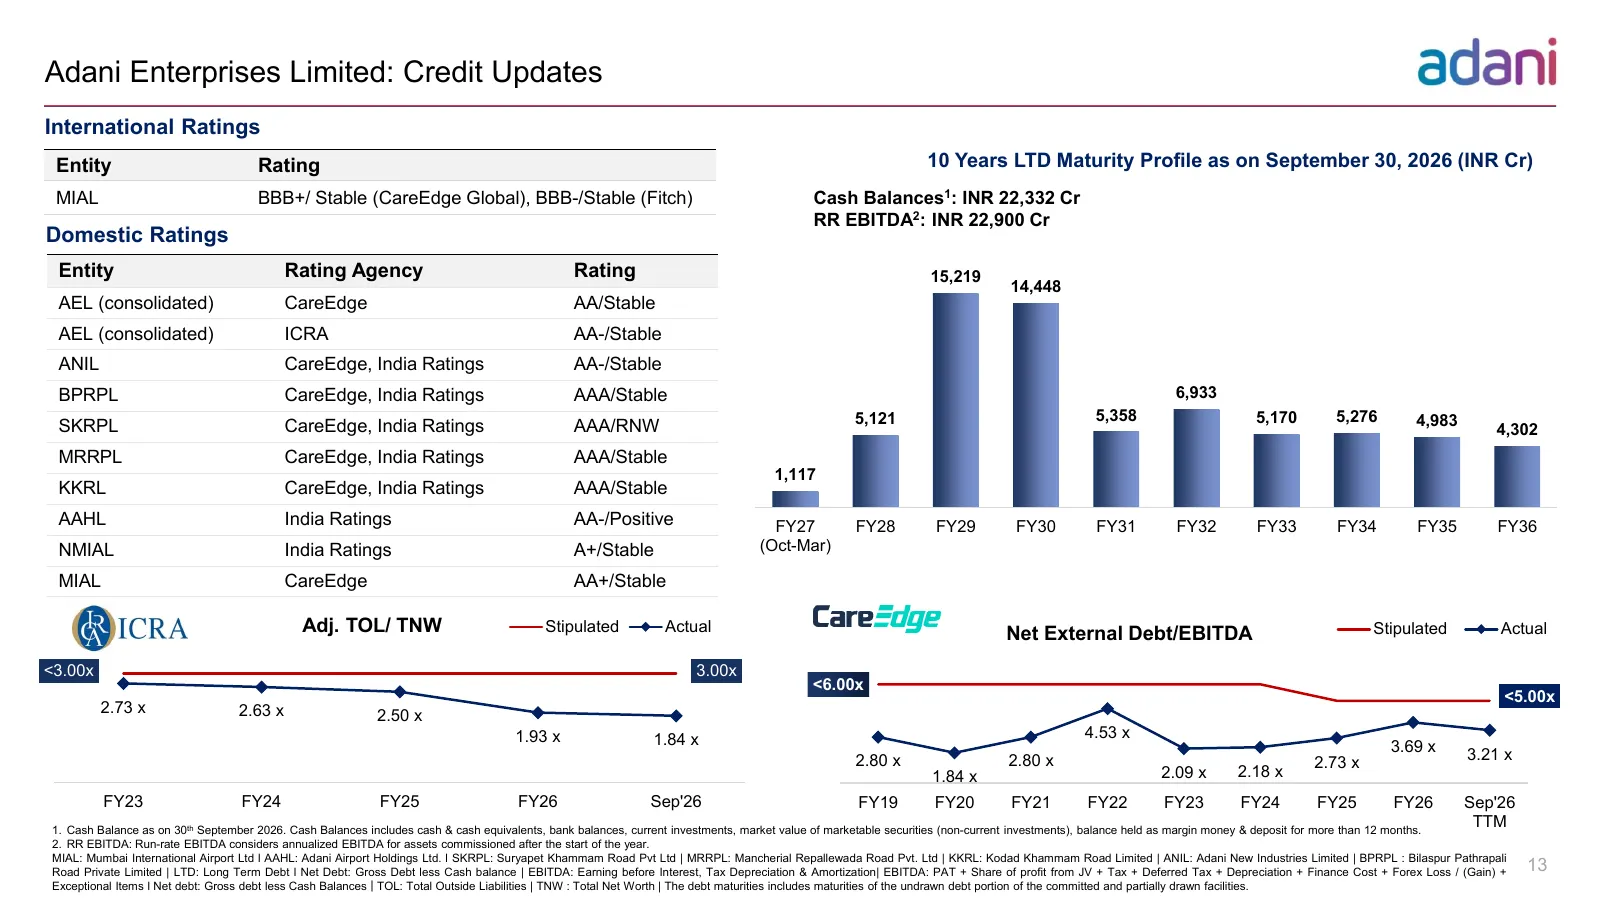
Slide 13: Adani Enterprises Limited: Credit Updates
Adani Enterprises Limited: Credit Updates International Ratings Entity Rating 10 Years LTD Maturity Profile as on September 30, 2026 (INR Cr) MIAL BBB+/ Stable (CareEdge Global), BBB-/Stable (Fitch) Cash Balances1: INR 22,332 Cr RR EBITDA2: INR 22,900 Cr Domestic Ratings Entity Rating Agency Rating
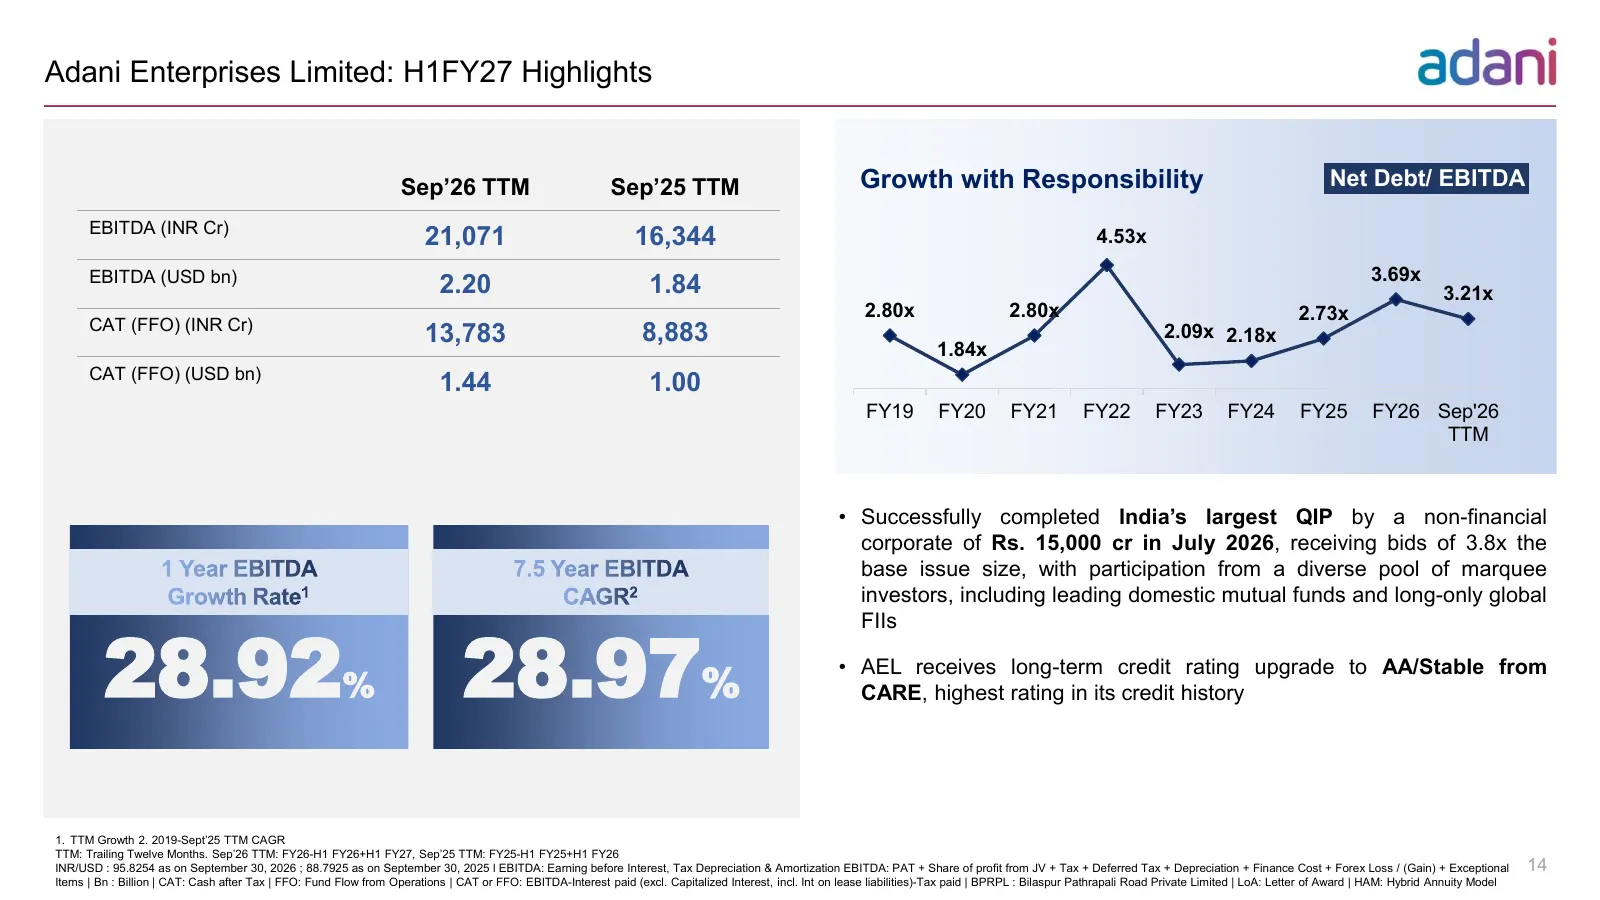
Slide 14: Adani Enterprises Limited: H1FY27 Highlights
Adani Enterprises Limited: H1FY27 Highlights Sep’26 TTM Sep’25 TTM Growth with Responsibility Net Debt/ EBITDA EBITDA (INR Cr) 21,071 16,344 4.53x EBITDA (USD bn) 3.69x 2.20 1.84 3.21x 2.80x 2.80x 2.73x CAT (FFO) (INR Cr) 13,783 8,883 2.09x 2.18x 1.84x CAT (FFO) (USD bn) 1.44 1.00 FY19 FY20 FY21 FY2

Slide 15: 02b Adani Green Energy Limited
02bAdani Green Energy Limited STRICTLY CONFIDENTIAL
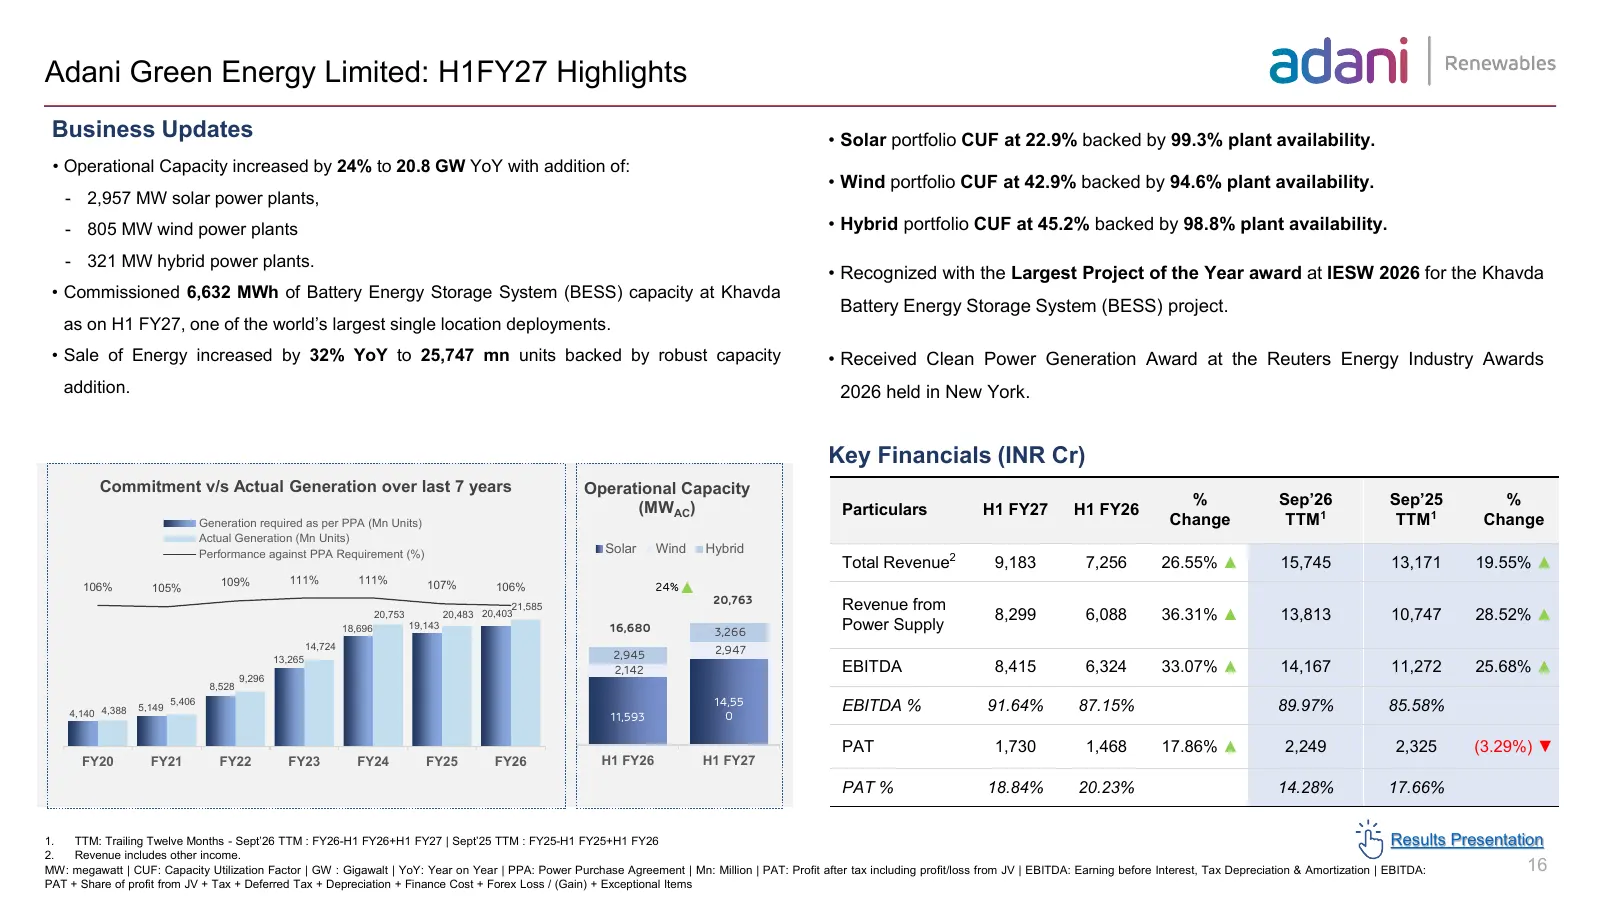
Slide 16: Adani Green Energy Limited: H1FY27 Highlights
Adani Green Energy Limited: H1FY27 Highlights Business Updates • Solar portfolio CUF at 22.9% backed by 99.3% plant availability. • Operational Capacity increased by 24% to 20.8 GW YoY with addition of: • Wind portfolio CUF at 42.9% backed by 94.6% plant availability. - 2,957 MW solar power plants,
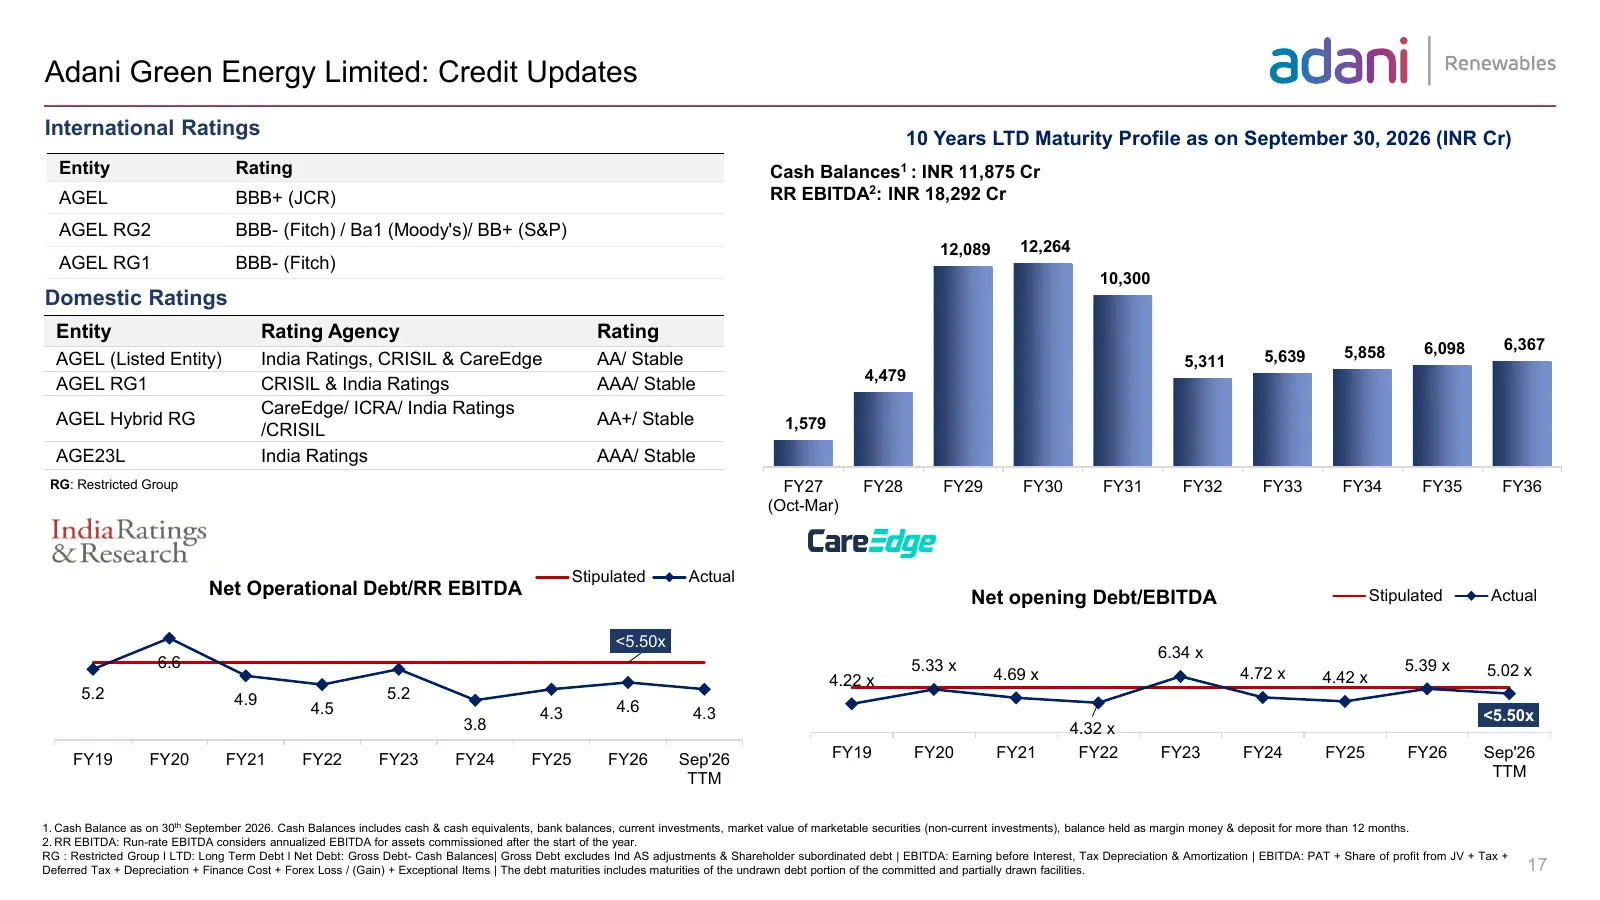
Slide 17: Adani Green Energy Limited: Credit Updates
Adani Green Energy Limited: Credit Updates International Ratings 10 Years LTD Maturity Profile as on September 30, 2026 (INR Cr) Entity Rating Cash Balances1 : INR 11,875 Cr AGEL BBB+ (JCR) RR EBITDA2: INR 18,292 Cr AGEL RG2 BBB- (Fitch) / Ba1 (Moody's)/ BB+ (S&P) 12,089 12,264 AGEL RG1 BBB- (Fitch)
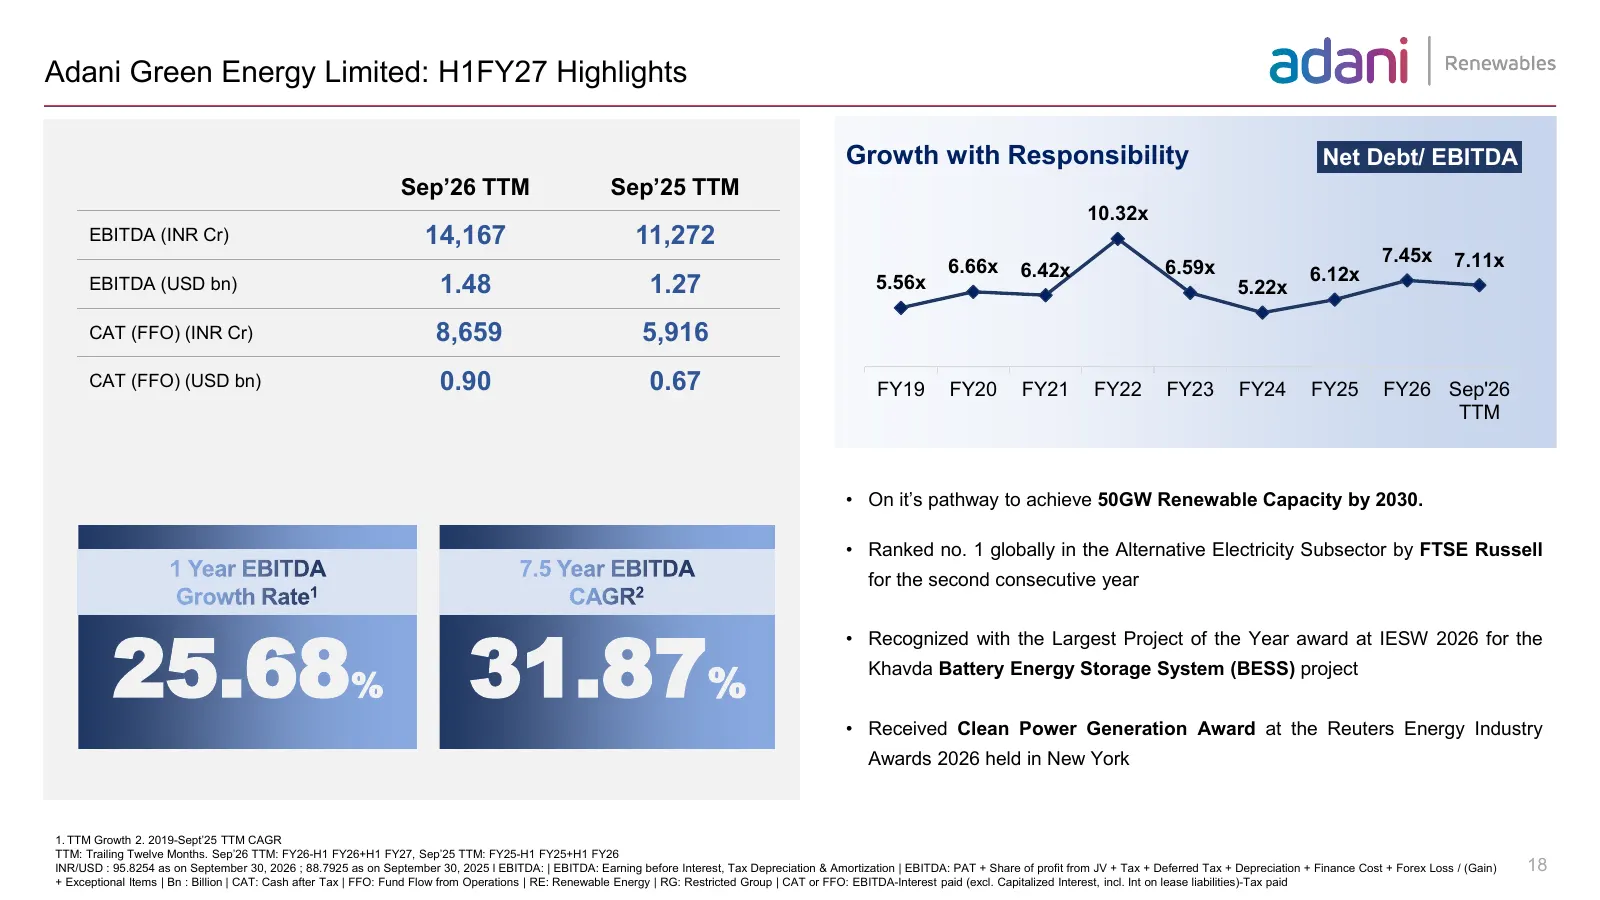
Slide 18: Adani Green Energy Limited: H1FY27 Highlights
Adani Green Energy Limited: H1FY27 Highlights Growth with Responsibility Net Debt/ EBITDA Sep’26 TTM Sep’25 TTM 10.32x EBITDA (INR Cr) 14,167 11,272 7.45x 7.11x 6.66x 6.42x 6.59x 6.12x EBITDA (USD bn) 1.48 1.27 5.56x 5.22x CAT (FFO) (INR Cr) 8,659 5,916 CAT (FFO) (USD bn) 0.90 0.67 FY19 FY20 FY21 FY

Slide 19: 02c Adani Energy Solutions Limited
02cAdani Energy Solutions Limited STRICTLY CONFIDENTIAL
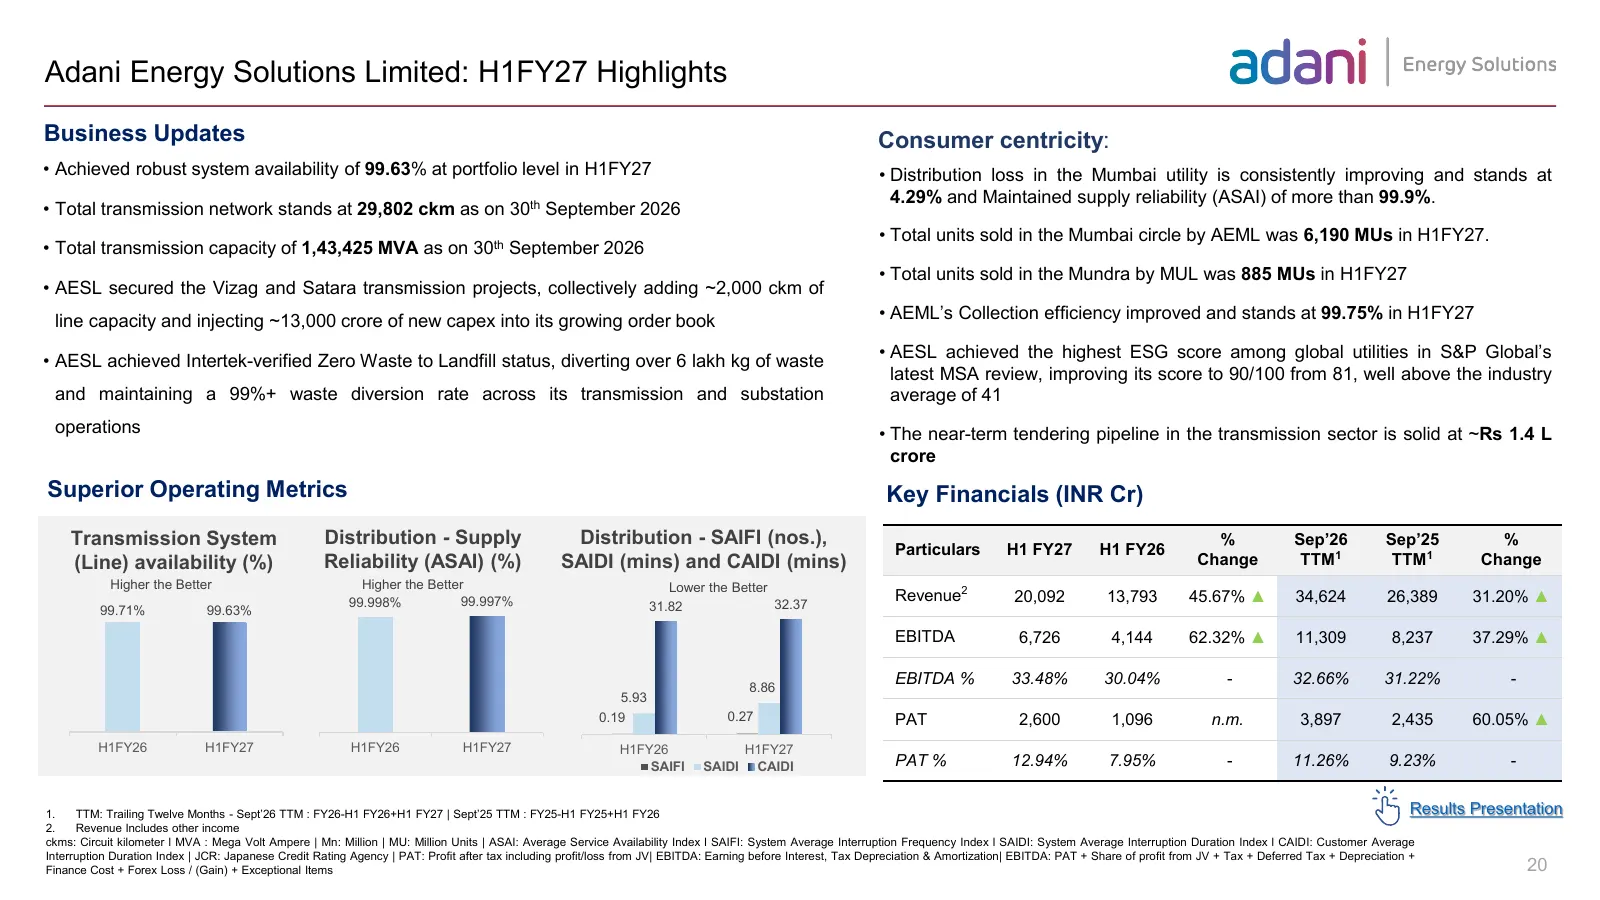
Slide 20: Adani Energy Solutions Limited: H1FY27 Highlights
Adani Energy Solutions Limited: H1FY27 Highlights Business Updates Consumer centricity: • Achieved robust system availability of 99.63% at portfolio level in H1FY27 • Distribution loss in the Mumbai utility is consistently improving and stands at 4.29% and Maintained supply reliability (ASAI) of mor
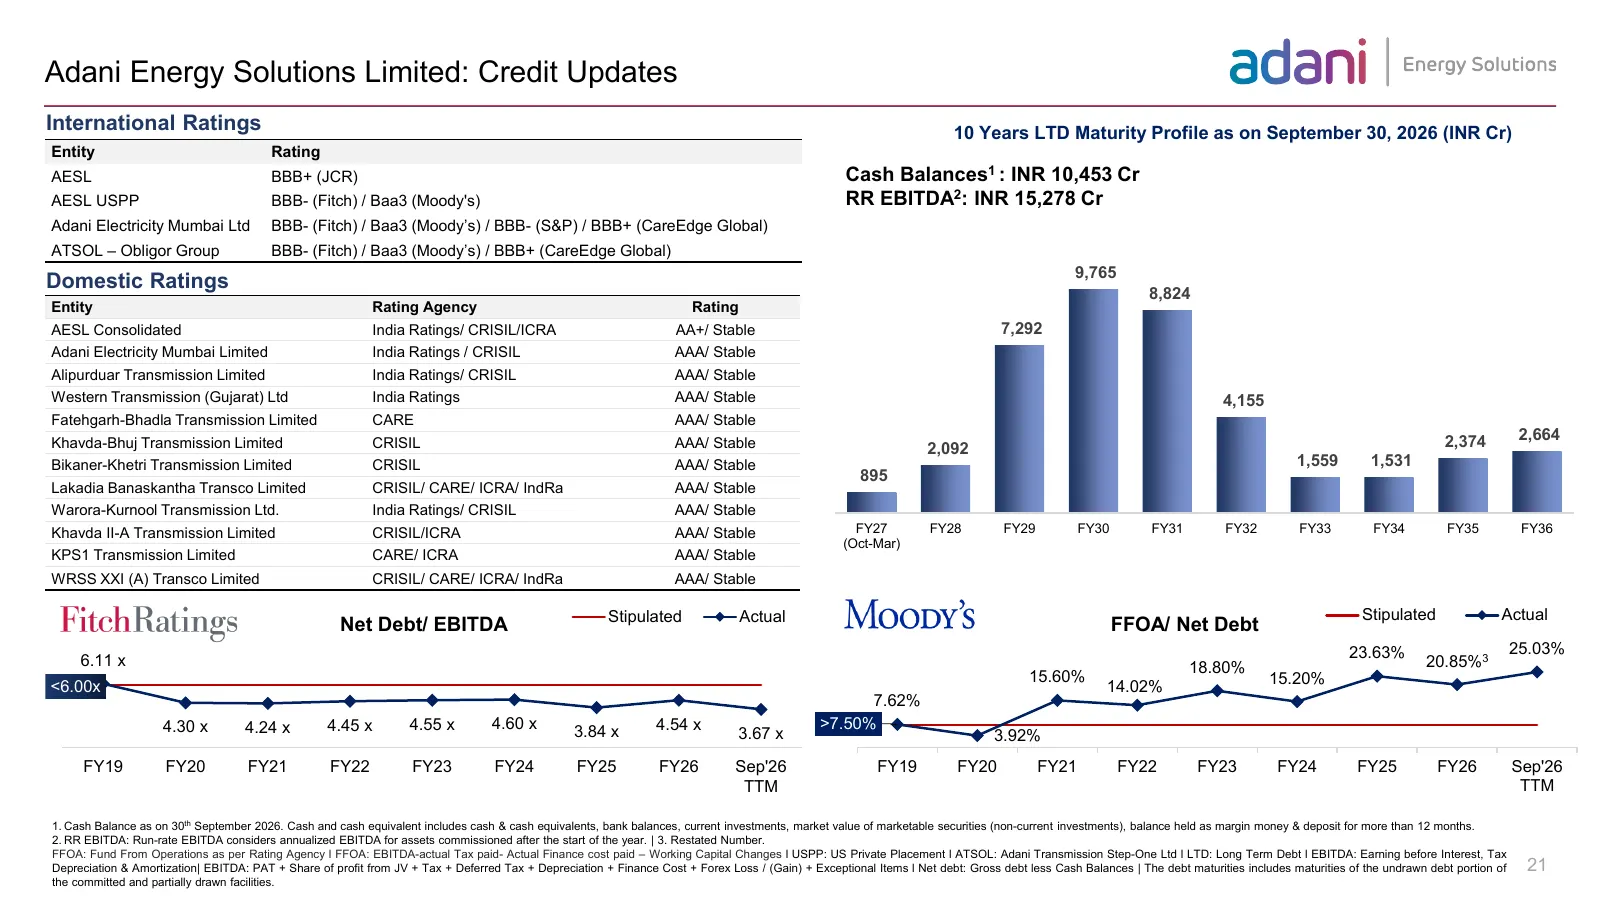
Slide 21: Adani Energy Solutions Limited: Credit Updates
Adani Energy Solutions Limited: Credit Updates International Ratings 10 Years LTD Maturity Profile as on September 30, 2026 (INR Cr) Entity Rating AESL BBB+ (JCR) Cash Balances1 : INR 10,453 Cr AESL USPP BBB- (Fitch) / Baa3 (Moody's) RR EBITDA2: INR 15,278 Cr Adani Electricity Mumbai Ltd BBB- (Fitch
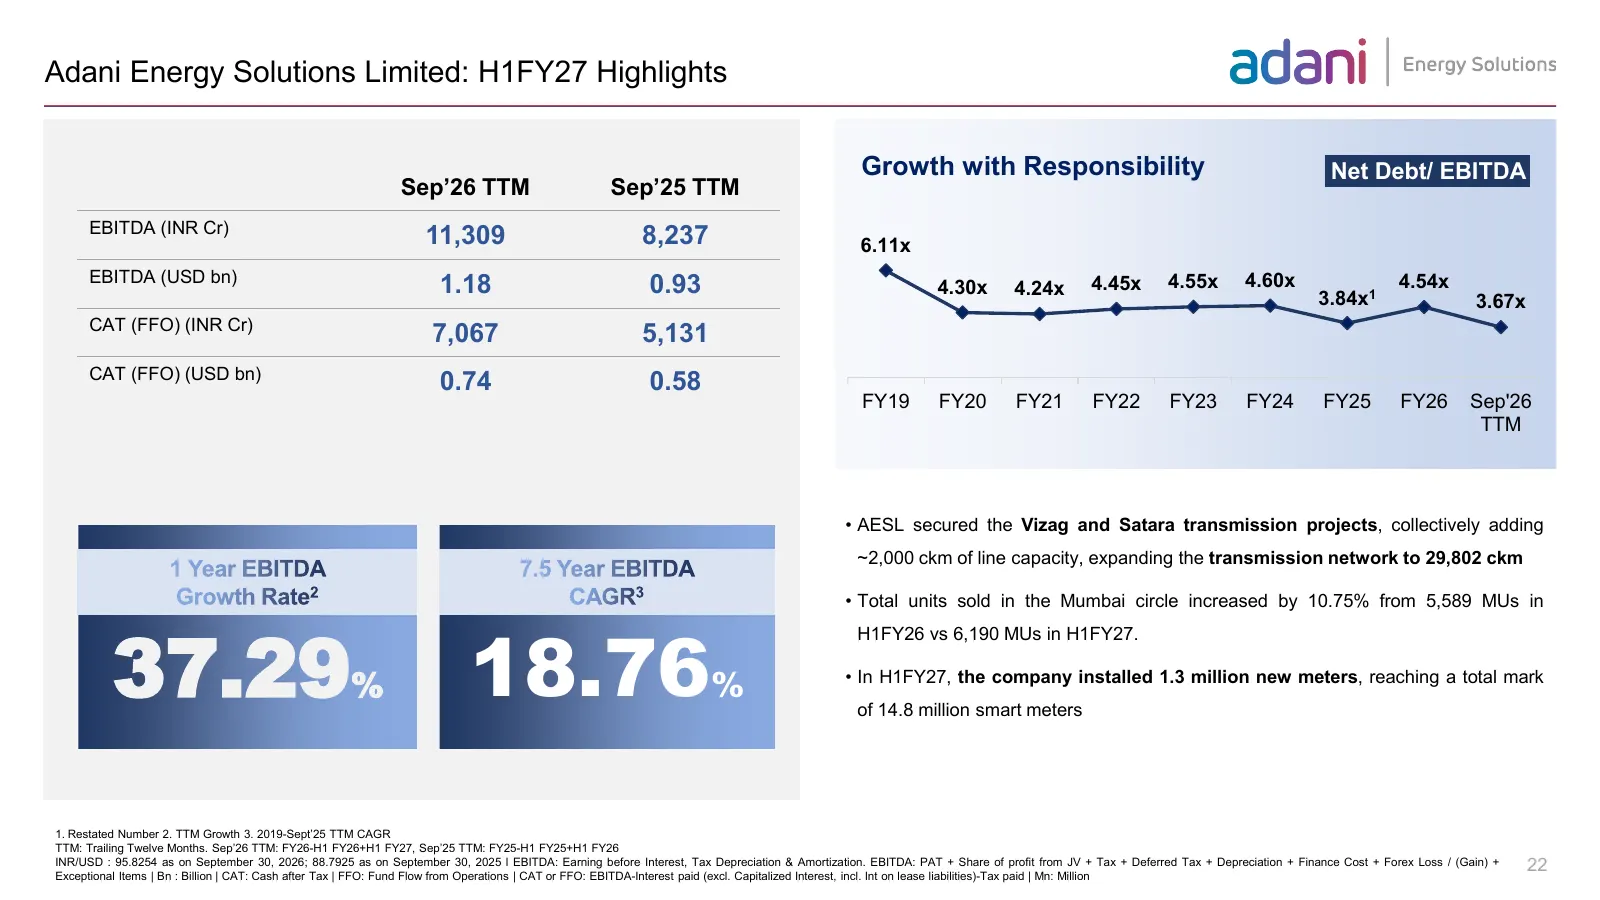
Slide 22: Adani Energy Solutions Limited: H1FY27 Highlights
Adani Energy Solutions Limited: H1FY27 Highlights Growth with Responsibility Net Debt/ EBITDA Sep’26 TTM Sep’25 TTM EBITDA (INR Cr) 11,309 8,237 6.11x EBITDA (USD bn) 4.60x 1.18 0.93 4.30x 4.24x 4.45x 4.55x 3.84x1 4.54x 3.67x CAT (FFO) (INR Cr) 7,067 5,131 CAT (FFO) (USD bn) 0.74 0.58 FY19 FY20 FY21

Slide 23: 02d Adani Power Limited
02dAdani Power Limited STRICTLY CONFIDENTIAL
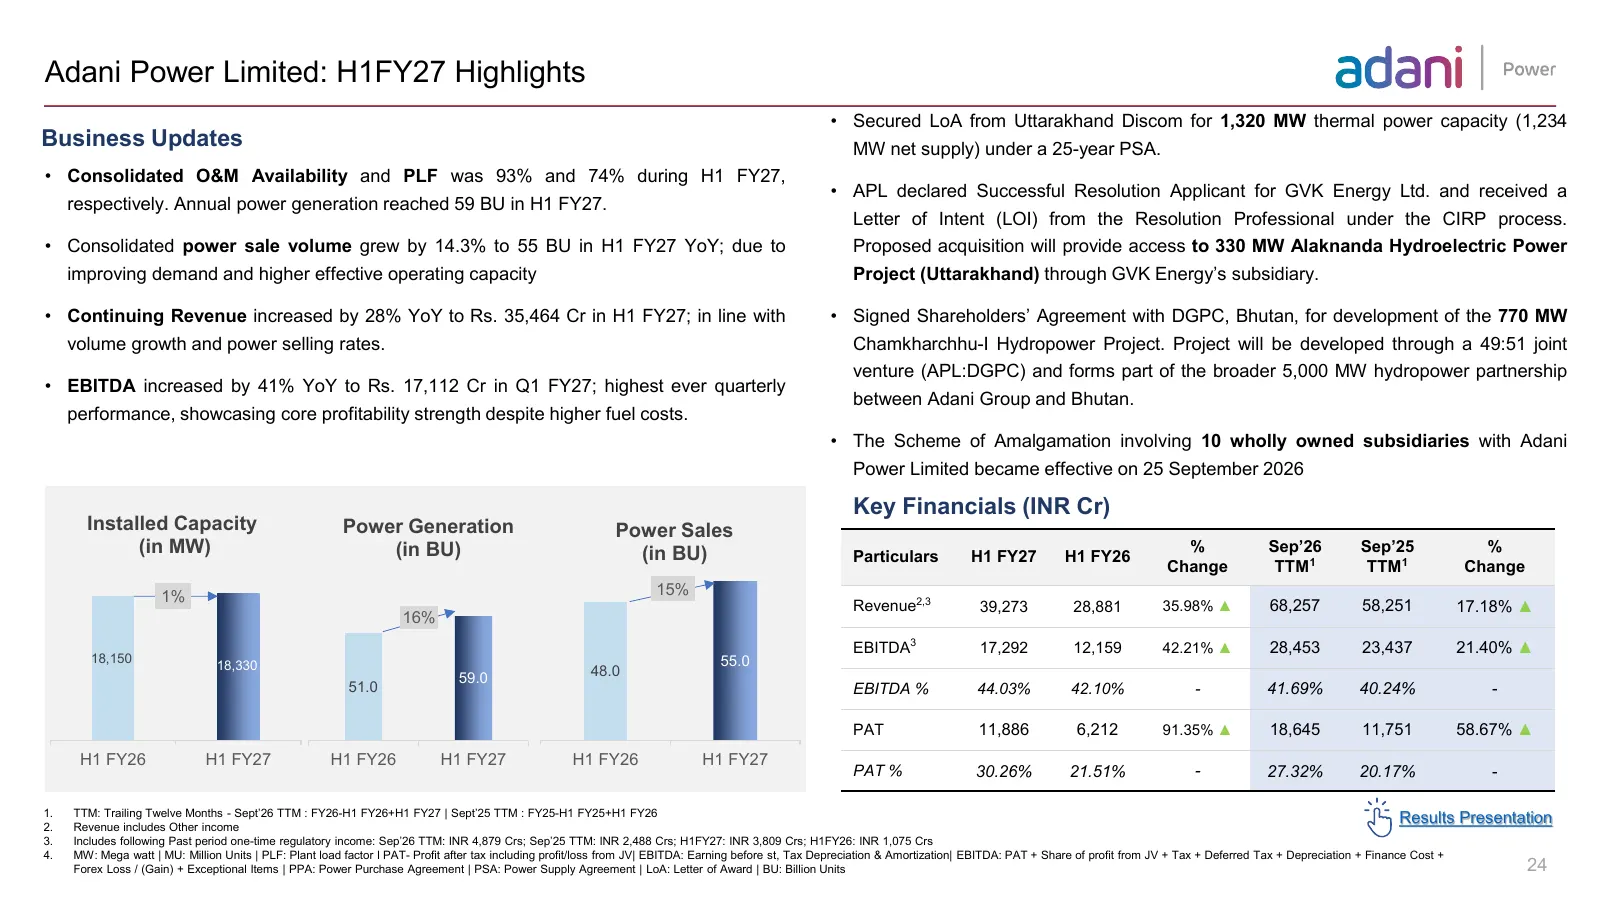
Slide 24: Adani Power Limited: H1FY27 Highlights
Adani Power Limited: H1FY27 Highlights • Secured LoA from Uttarakhand Discom for 1,320 MW thermal power capacity (1,234 Business Updates MW net supply) under a 25-year PSA. • Consolidated O&M Availability and PLF was 93% and 74% during H1 FY27, • APL declared Successful Resolution Applicant for GVK
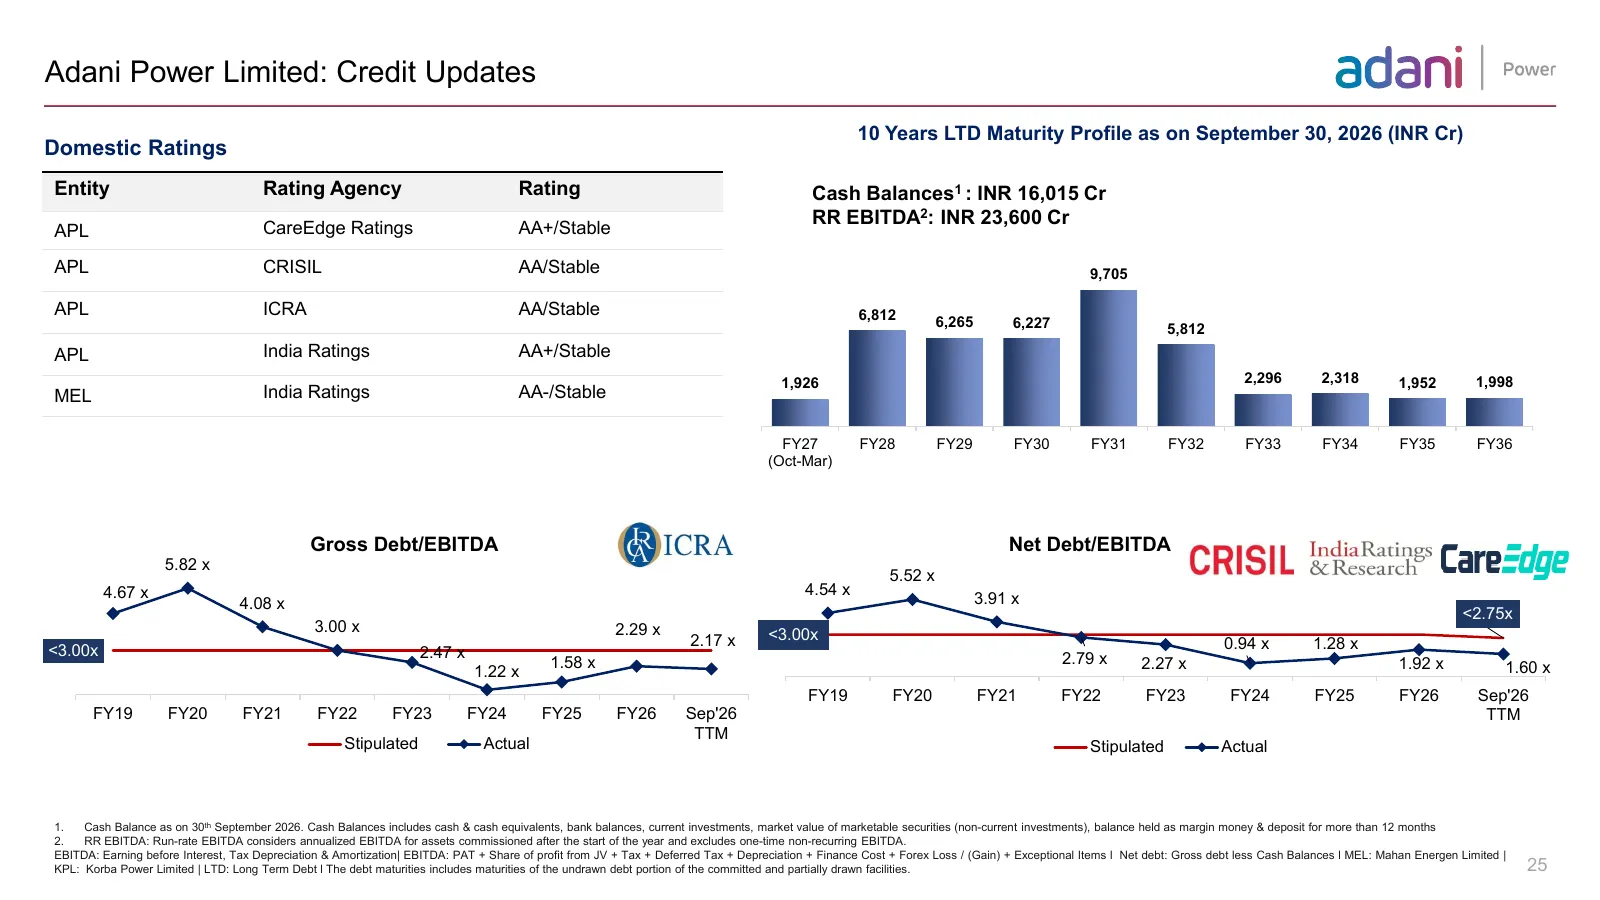
Slide 25: Adani Power Limited: Credit Updates
Adani Power Limited: Credit Updates 10 Years LTD Maturity Profile as on September 30, 2026 (INR Cr) Domestic Ratings Entity Rating Agency Rating Cash Balances1 : INR 16,015 Cr RR EBITDA2: INR 23,600 Cr APL CareEdge Ratings AA+/Stable APL CRISIL AA/Stable 9,705 APL ICRA AA/Stable 6,812 6,265 6,227 5,
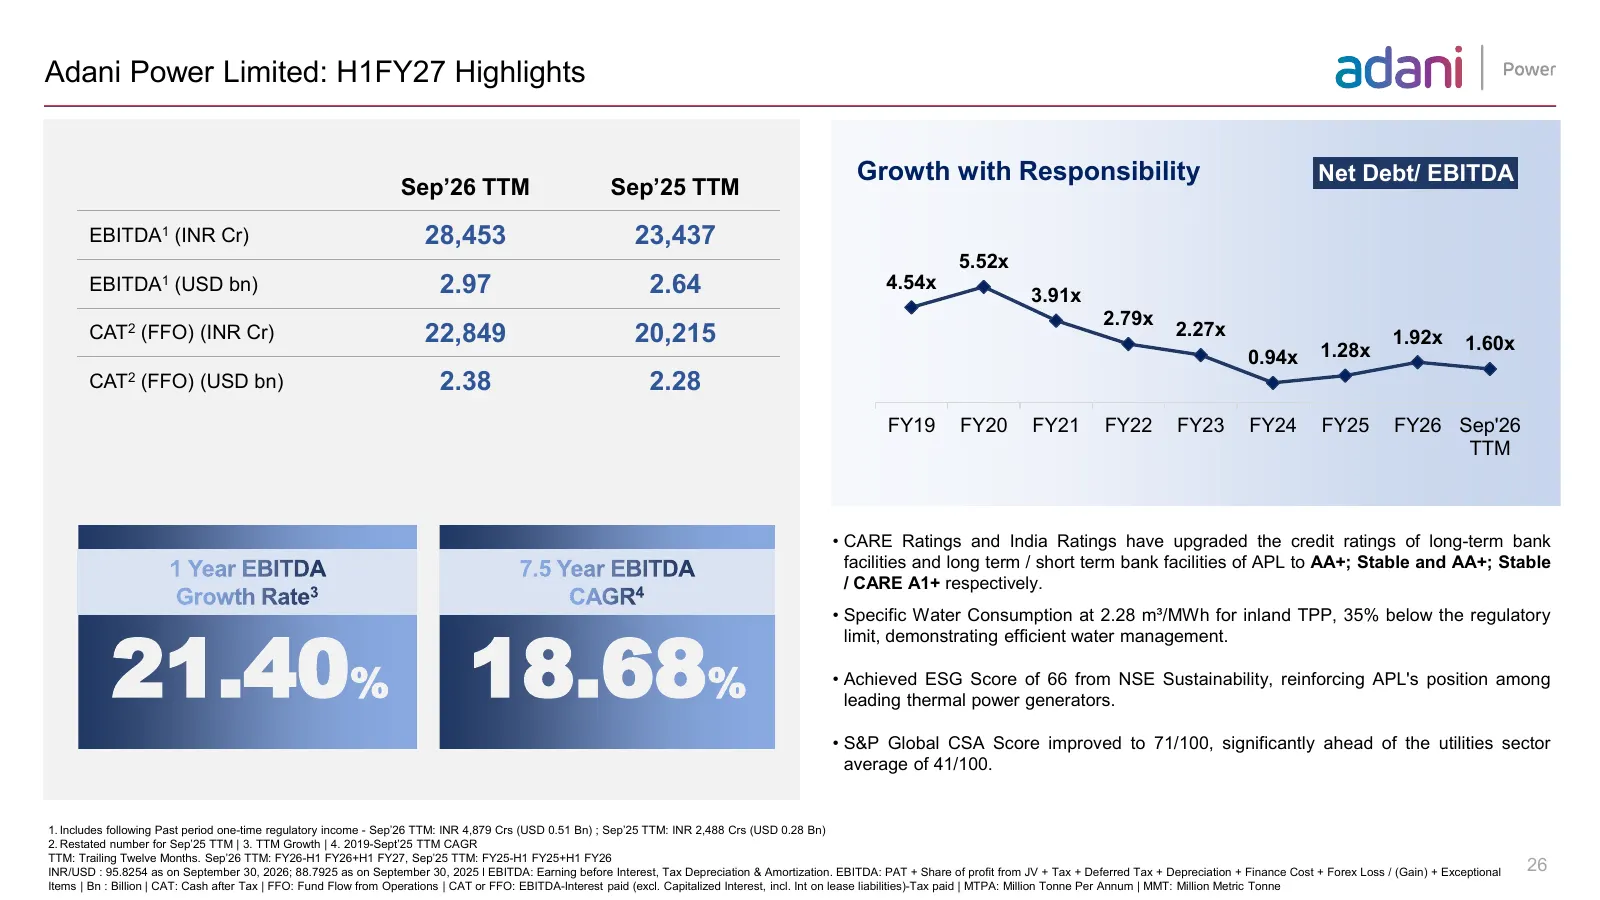
Slide 26: Adani Power Limited: H1FY27 Highlights
Adani Power Limited: H1FY27 Highlights Growth with Responsibility Net Debt/ EBITDA Sep’26 TTM Sep’25 TTM EBITDA1 (INR Cr) 28,453 23,437 5.52x EBITDA1 (USD bn) 2.97 2.64 4.54x 3.91x 2.79x CAT2 (FFO) (INR Cr) 22,849 20,215 2.27x 1.92x 1.60x 0.94x 1.28x CAT2 (FFO) (USD bn) 2.38 2.28 FY19 FY20 FY21 FY22

Slide 27: 02e Adani Total Gas Limited
02eAdani Total Gas Limited STRICTLY CONFIDENTIAL
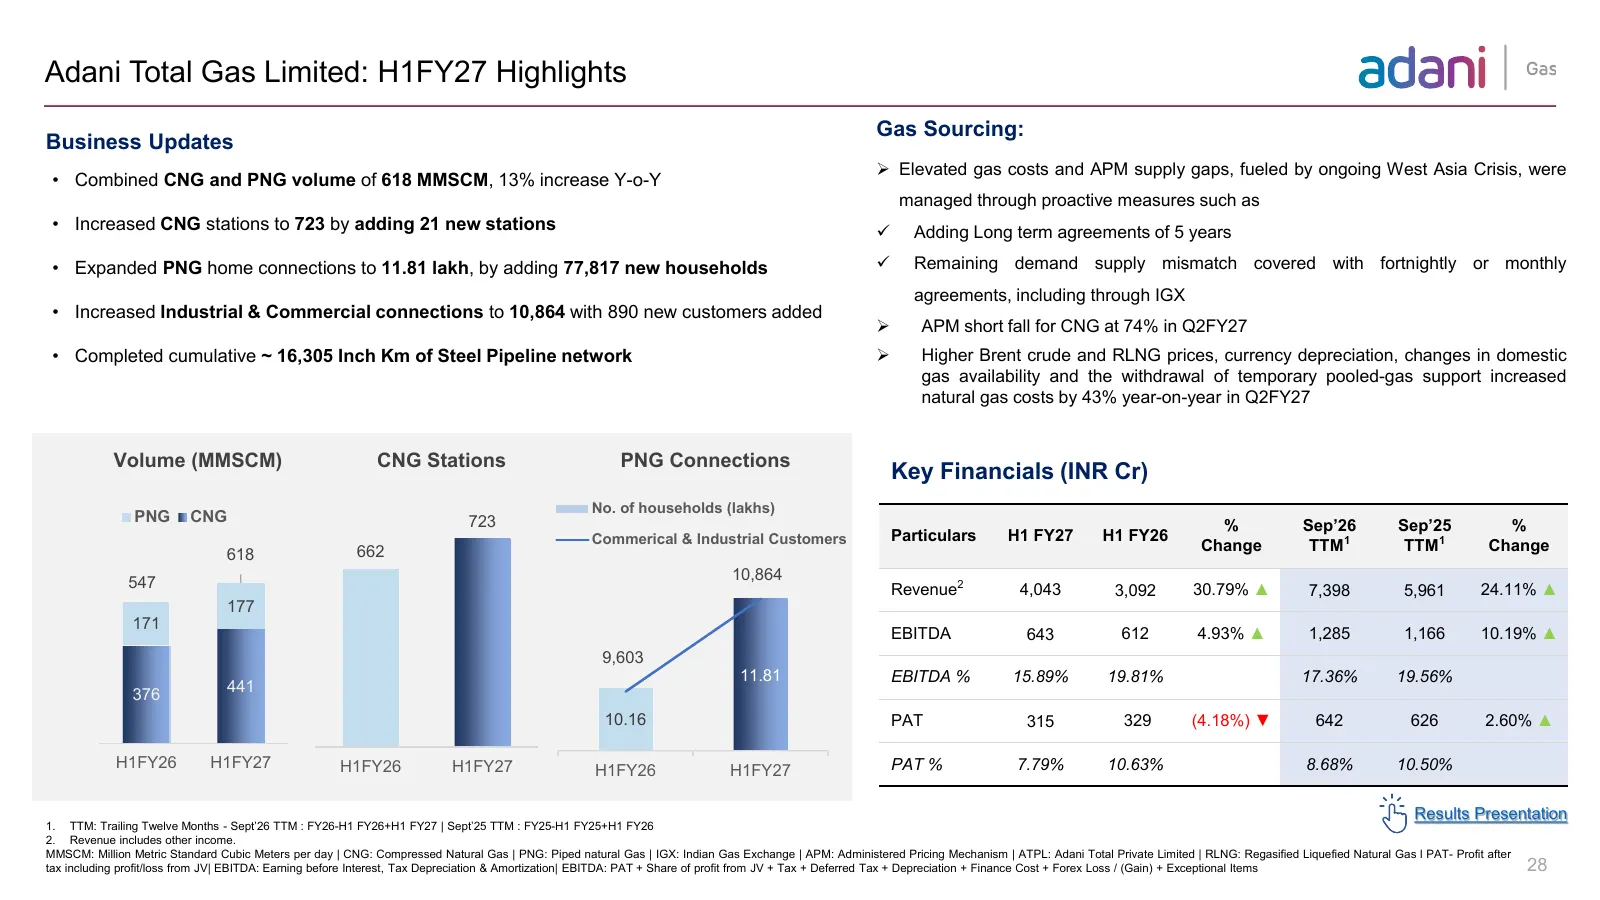
Slide 28: Adani Total Gas Limited: H1FY27 Highlights
Adani Total Gas Limited: H1FY27 Highlights Gas Sourcing: Business Updates ➢ Elevated gas costs and APM supply gaps, fueled by ongoing West Asia Crisis, were • Combined CNG and PNG volume of 618 MMSCM, 13% increase Y-o-Y managed through proactive measures such as • Increased CNG stations to 723 by ad
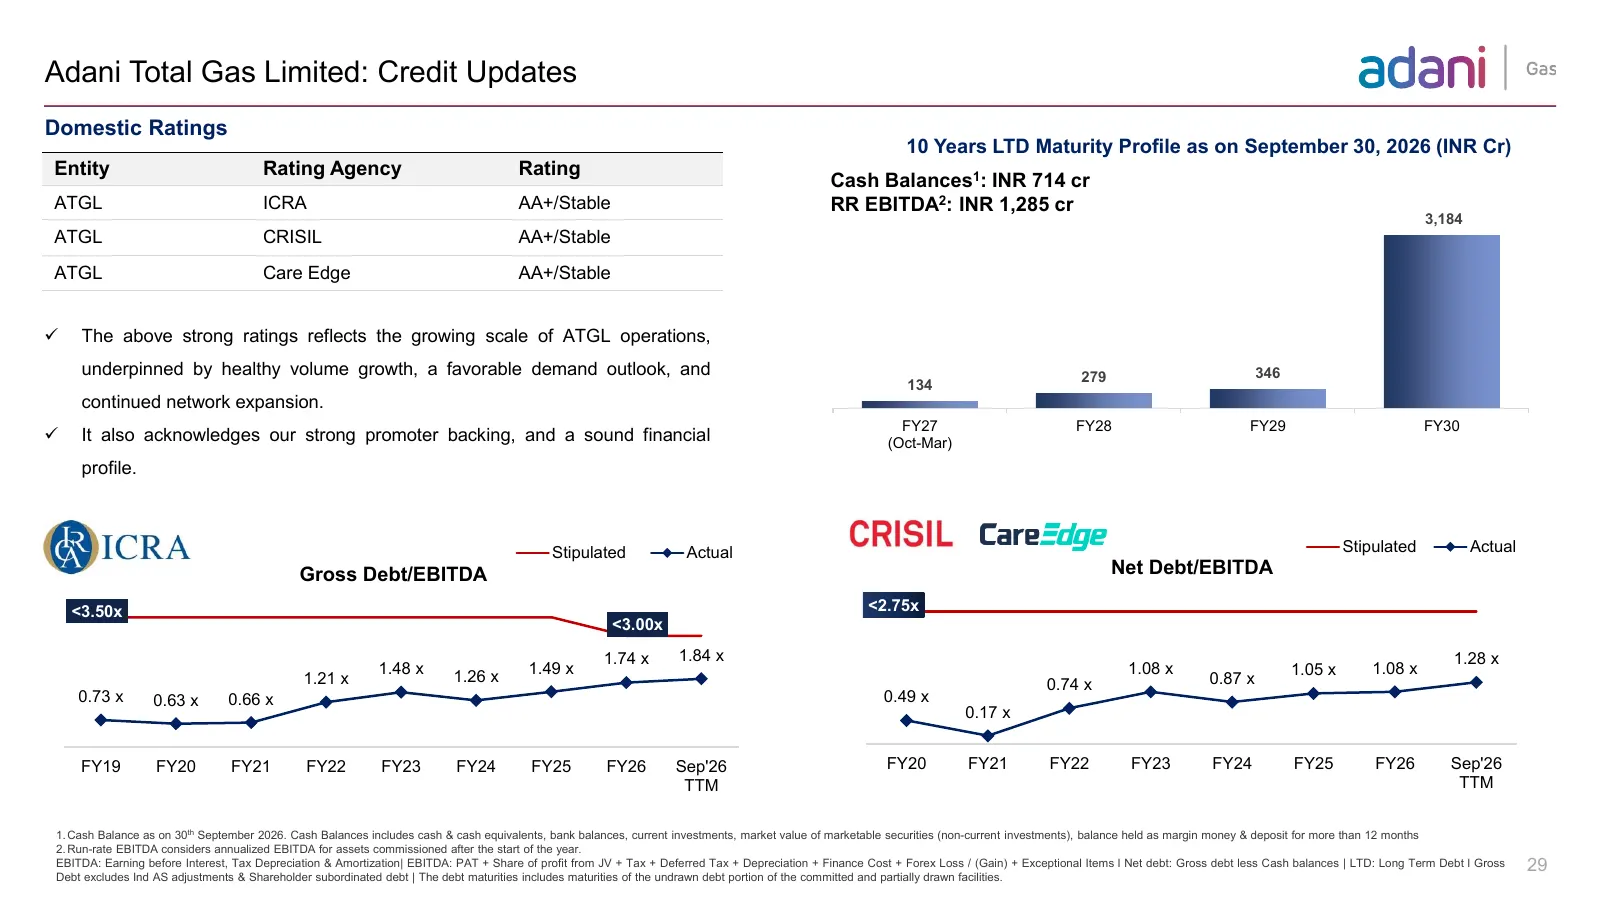
Slide 29: Adani Total Gas Limited: Credit Updates
Adani Total Gas Limited: Credit Updates Domestic Ratings 10 Years LTD Maturity Profile as on September 30, 2026 (INR Cr) Entity Rating Agency Rating Cash Balances1: INR 714 cr ATGL ICRA AA+/Stable RR EBITDA2: INR 1,285 cr 3,184 ATGL CRISIL AA+/Stable ATGL Care Edge AA+/Stable ✓ The above strong rati
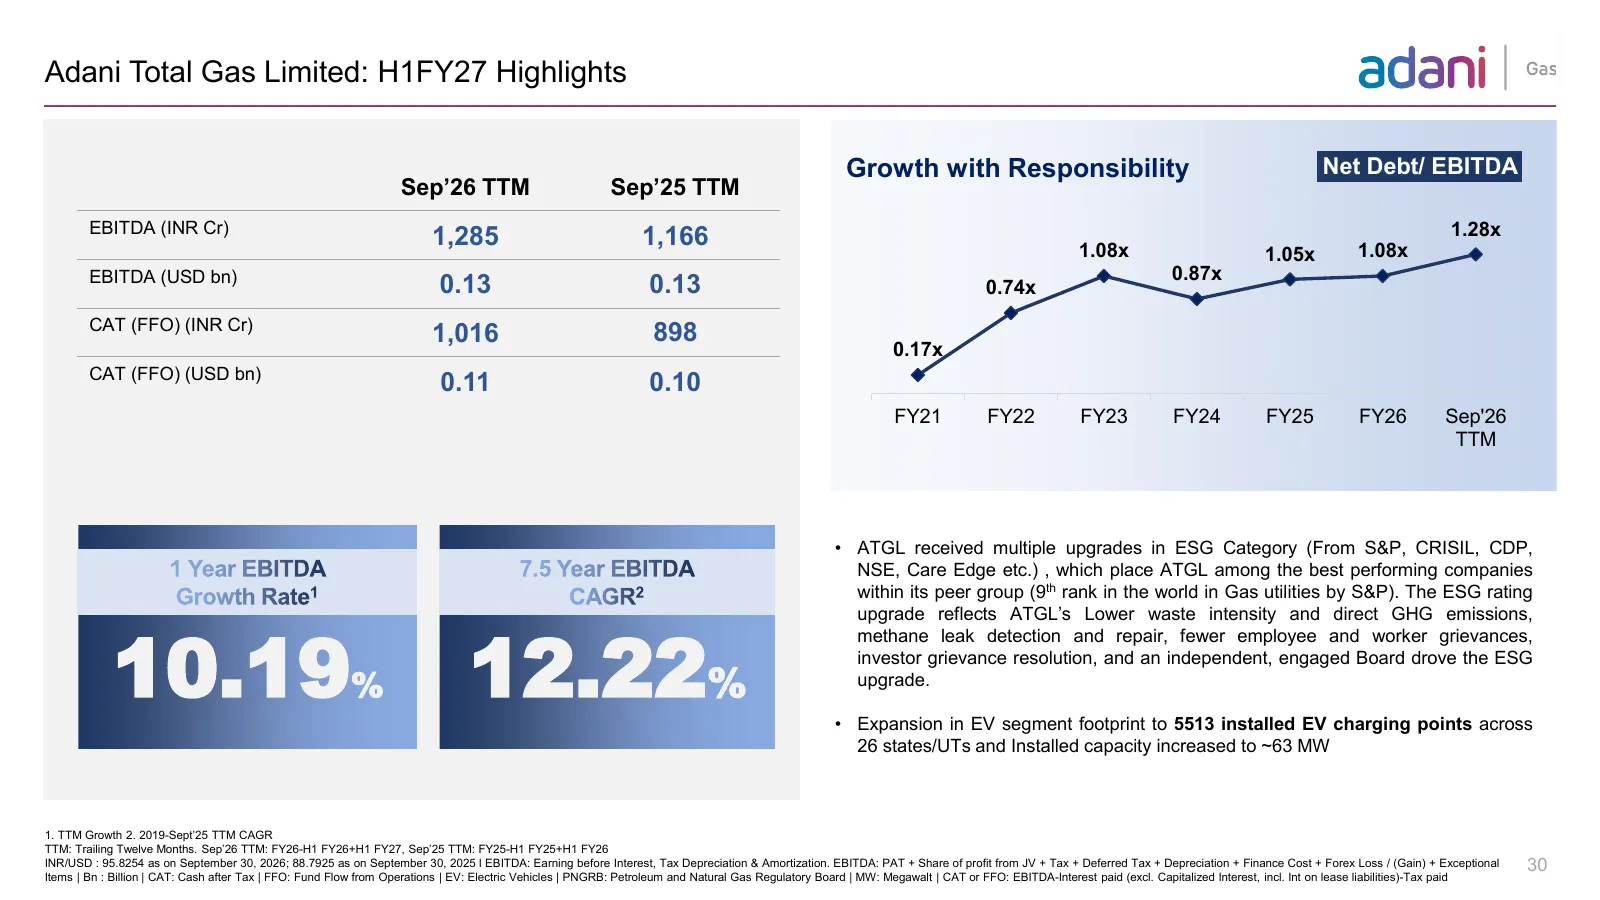
Slide 30: Adani Total Gas Limited: H1FY27 Highlights
Adani Total Gas Limited: H1FY27 Highlights Growth with Responsibility Net Debt/ EBITDA Sep’26 TTM Sep’25 TTM EBITDA (INR Cr) 1.28x 1,285 1,166 1.08x 1.08x 1.05x EBITDA (USD bn) 0.87x 0.13 0.13 0.74x CAT (FFO) (INR Cr) 1,016 898 0.17x CAT (FFO) (USD bn) 0.11 0.10 FY21 FY22 FY23 FY24 FY25 FY26 Sep'26

Slide 31: 02f Adani Ports and Special Economic Zone Limited
02fAdani Ports and Special Economic Zone Limited STRICTLY CONFIDENTIAL
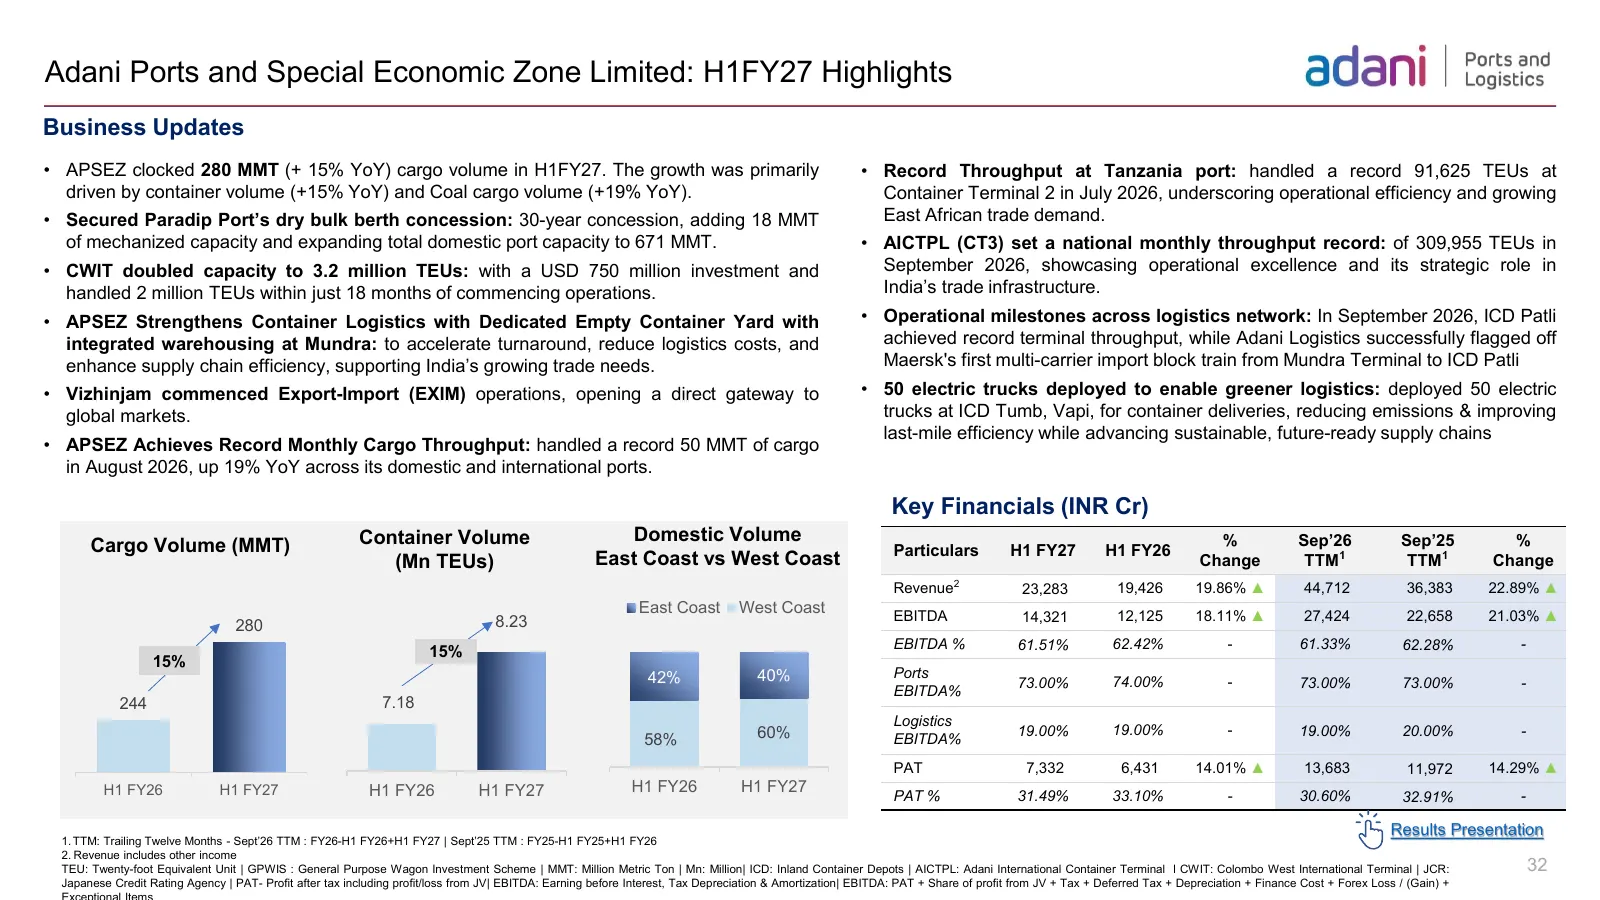
Slide 32: Adani Ports and Special Economic Zone Limited: H1FY27 Highlights
Adani Ports and Special Economic Zone Limited: H1FY27 Highlights Business Updates • APSEZ clocked 280 MMT (+ 15% YoY) cargo volume in H1FY27. The growth was primarily • Record Throughput at Tanzania port: handled a record 91,625 TEUs at driven by container volume (+15% YoY) and Coal cargo volume (+1
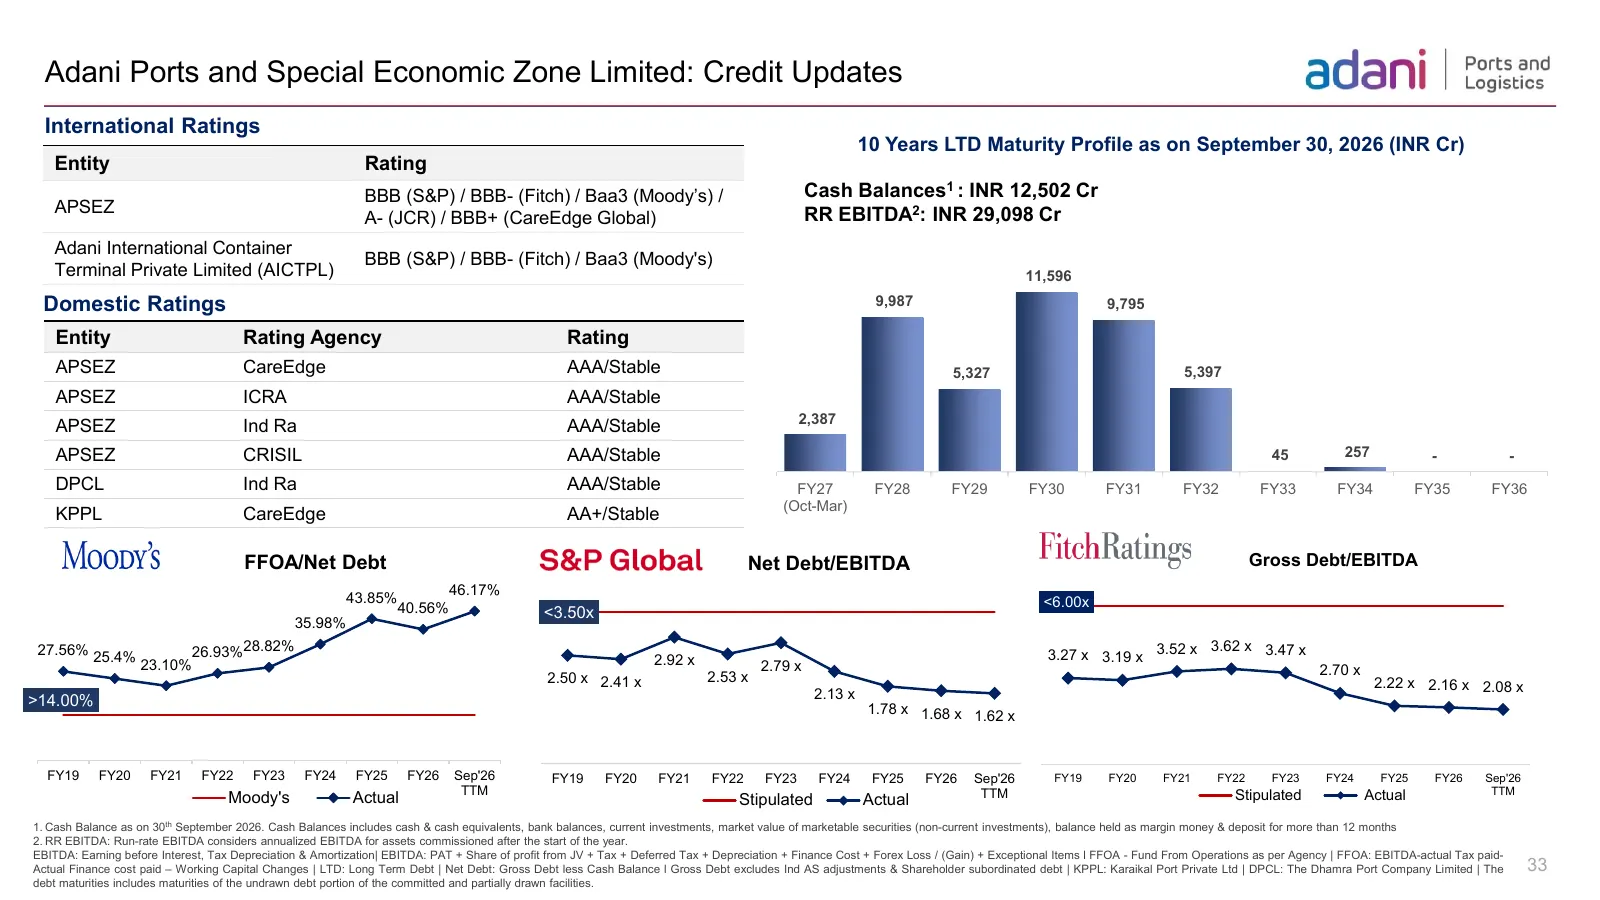
Slide 33: Adani Ports and Special Economic Zone Limited: Credit Updates
Adani Ports and Special Economic Zone Limited: Credit Updates International Ratings 10 Years LTD Maturity Profile as on September 30, 2026 (INR Cr) Entity Rating BBB (S&P) / BBB- (Fitch) / Baa3 (Moody’s) / Cash Balances1 : INR 12,502 Cr APSEZ RR EBITDA2: INR 29,098 Cr A- (JCR) / BBB+ (CareEdge Globa
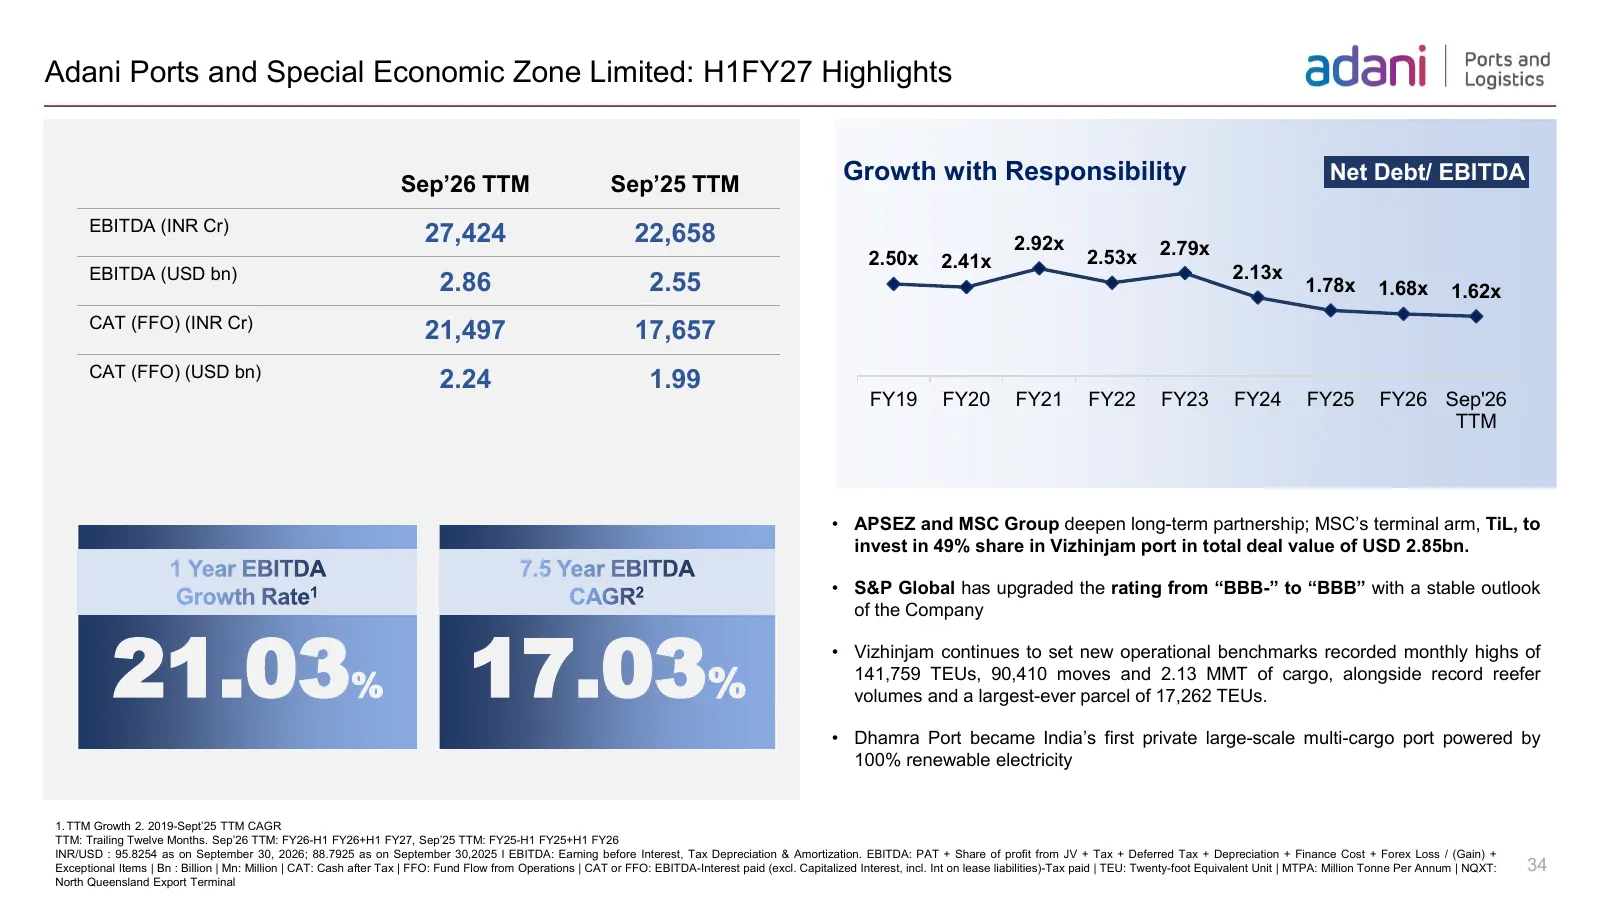
Slide 34: Adani Ports and Special Economic Zone Limited: H1FY27 Highlights
Adani Ports and Special Economic Zone Limited: H1FY27 Highlights Sep’26 TTM Sep’25 TTM Growth with Responsibility Net Debt/ EBITDA EBITDA (INR Cr) 27,424 22,658 2.92x 2.79x 2.50x 2.41x 2.53x EBITDA (USD bn) 2.13x 2.86 2.55 1.78x 1.68x 1.62x CAT (FFO) (INR Cr) 21,497 17,657 CAT (FFO) (USD bn) 2.24 1.

Slide 35: 02g Ambuja Cements
02gAmbuja Cements STRICTLY CONFIDENTIAL
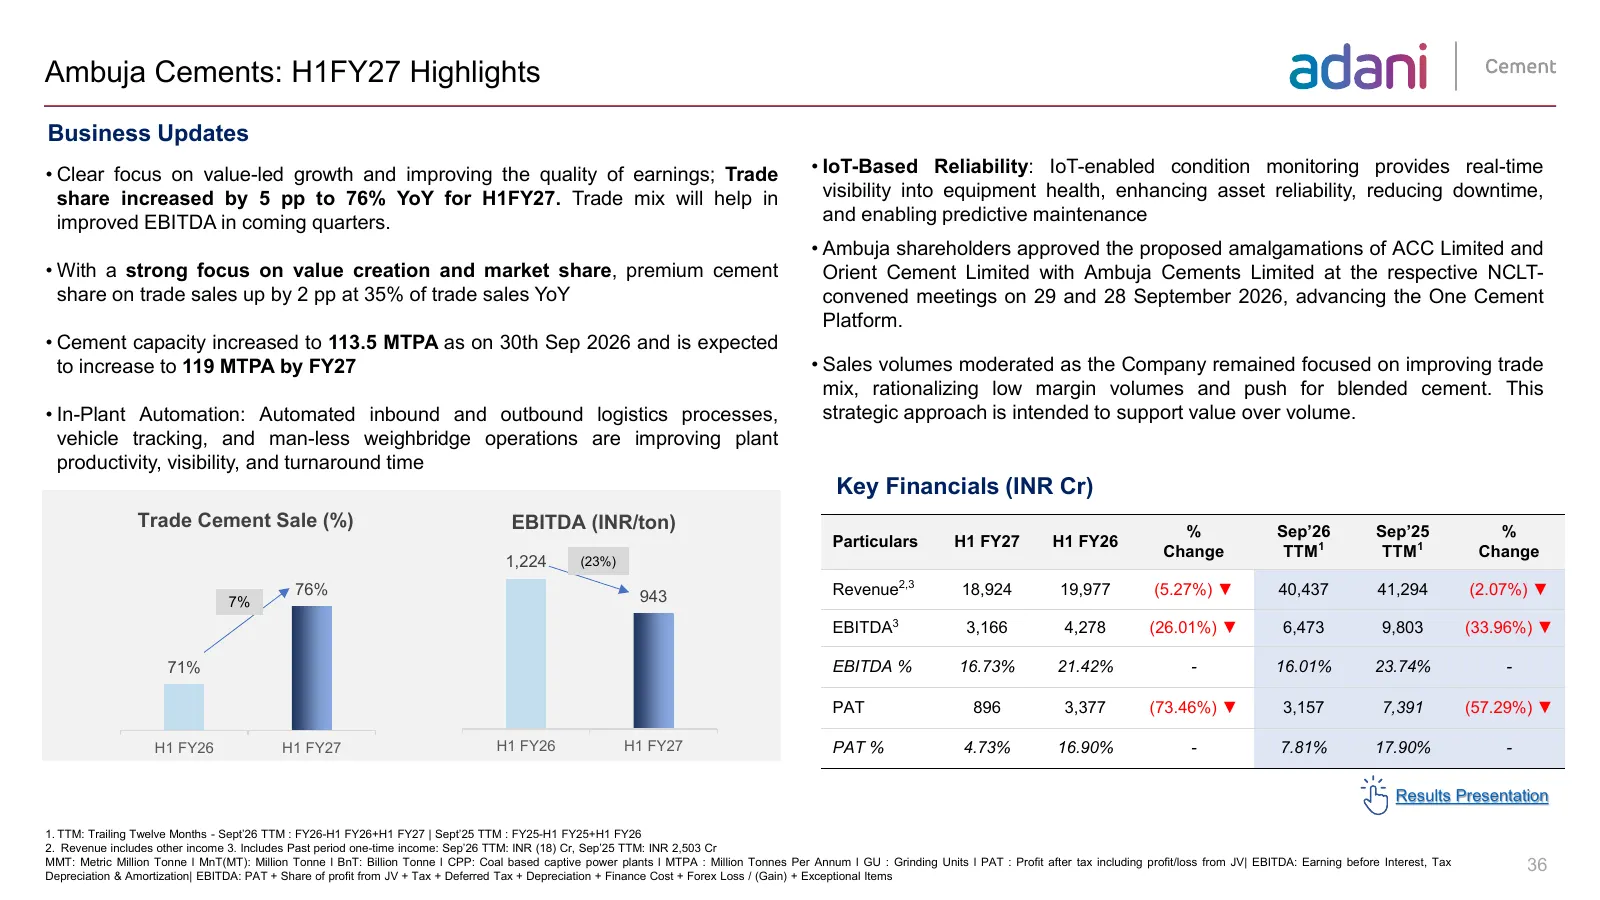
Slide 36: Ambuja Cements: H1FY27 Highlights
Ambuja Cements: H1FY27 Highlights Business Updates • Clear focus on value-led growth and improving the quality of earnings; Trade • IoT-Based Reliability: IoT-enabled condition monitoring provides real-time share increased by 5 pp to 76% YoY for H1FY27. Trade mix will help in visibility into equipme
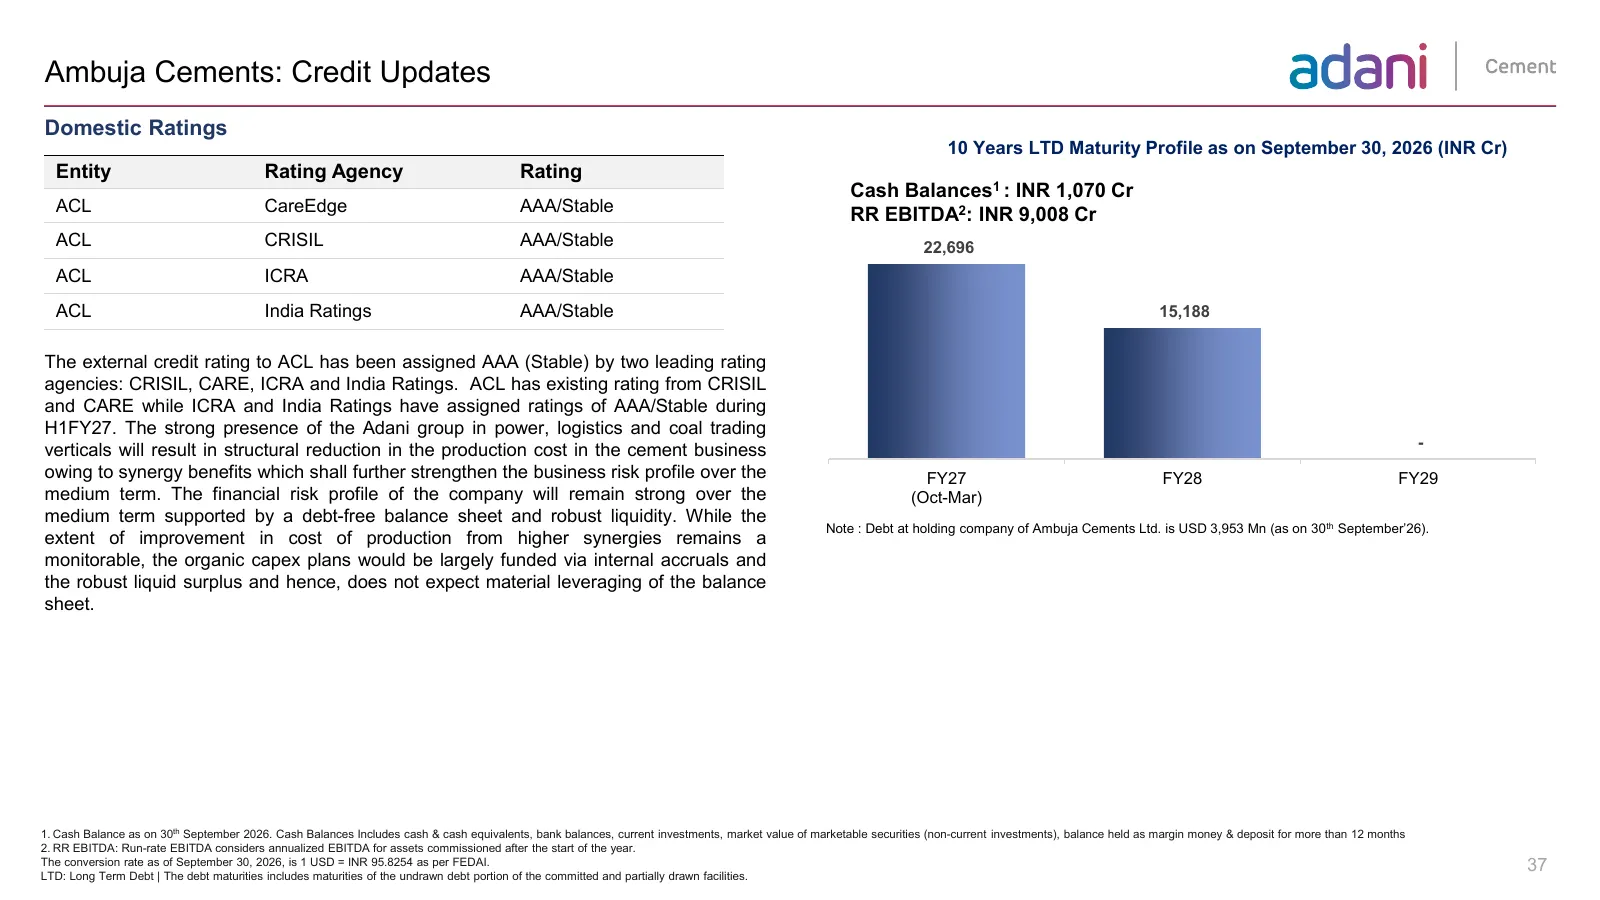
Slide 37: Ambuja Cements: Credit Updates
Ambuja Cements: Credit Updates Domestic Ratings 10 Years LTD Maturity Profile as on September 30, 2026 (INR Cr) Entity Rating Agency Rating Cash Balances1 : INR 1,070 Cr ACL CareEdge AAA/Stable RR EBITDA2: INR 9,008 Cr ACL CRISIL AAA/Stable 22,696 ACL ICRA AAA/Stable ACL India Ratings AAA/Stable 15,
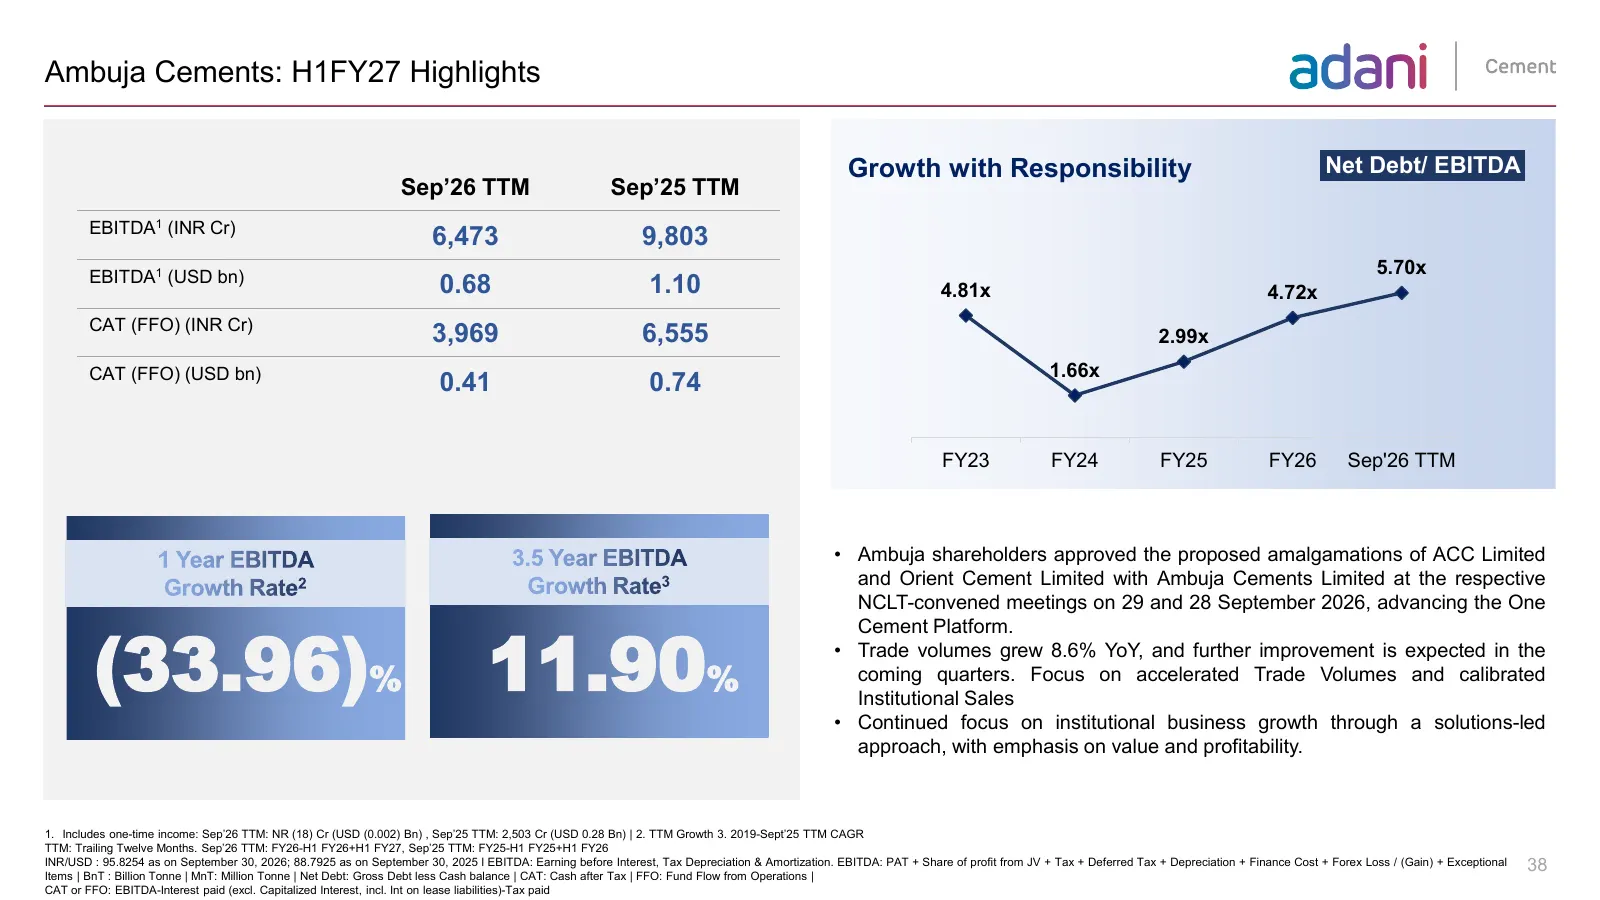
Slide 38: Ambuja Cements: H1FY27 Highlights
Ambuja Cements: H1FY27 Highlights Growth with Responsibility Net Debt/ EBITDA Sep’26 TTM Sep’25 TTM EBITDA1 (INR Cr) 6,473 9,803 EBITDA1 (USD bn) 5.70x 0.68 1.10 4.81x 4.72x CAT (FFO) (INR Cr) 3,969 6,555 2.99x CAT (FFO) (USD bn) 1.66x 0.41 0.74 FY23 FY24 FY25 FY26 Sep'26 TTM 1 Year EBITDA 3.5 Year
Slide 39: Disclaimer
Disclaimer Certain statements made in this presentation may not be based on historical information or facts and may be “forward-looking statements,” including those relating t o general business plans and strategy of Adani group, the future outlook and growt h prospects, and fut ure developments o f

Slide 40: Thank You
Thank You V16 – Main common portfolio EBIDTA Slide change
Source: company website
More decks from Ambuja Cements Limited
 Adani Portfolio — Investor Presentation (November 2026)56 slides · November 2026
 H1 FY27 Earnings Presentation40 slides · November 2026
 Adani Portfolio — ESG Presentation (November 2026)18 slides · November 2026
 Q2 FY2027 Earnings Presentation39 slides · Oct 29, 2026
 Q2 FY2027 Earnings Presentation40 slides · Oct 29, 2026
 Q2 FY2027 Earnings Presentation40 slides · Oct 29, 2026