Somerset Hills Bancorp — Shareholder Meeting (April 2006)
36 slides from Somerset Hills Bancorp's shareholder meeting presentation, Apr 26, 2006

Slide 1: Annual Meeting April 26, 2006 Welcome
Annual Meeting April 26, 2006 Welcome To

Slide 2: Forward-Looking Statements
Forward - Looking Statements This presentation contains estimates and other forward - looking statements within the meaning of the Private Securities Litigation Reform Act of 1995. SOMH cautions that the assumptions forming the basis for forward - looking statem ents include many factors that are be
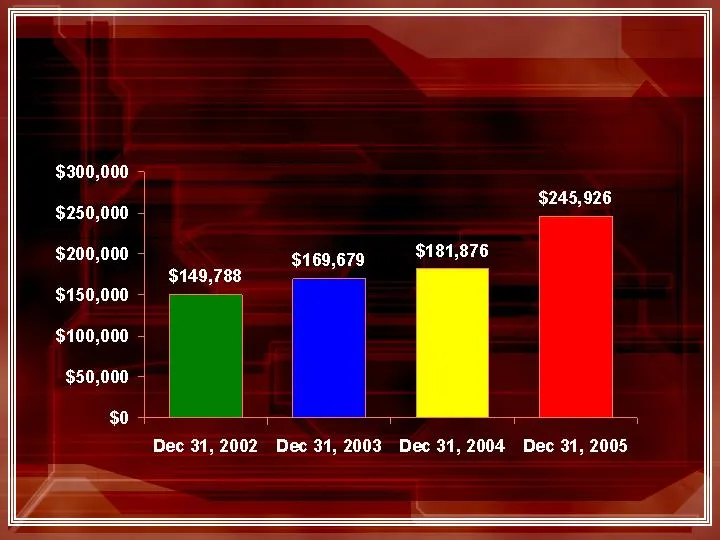
Slide 3: Total Assets
13% Increase Over 2002 Total Assets 26% Increase Over 2001 7% Increase Over 2003 35% Increase Over 2004
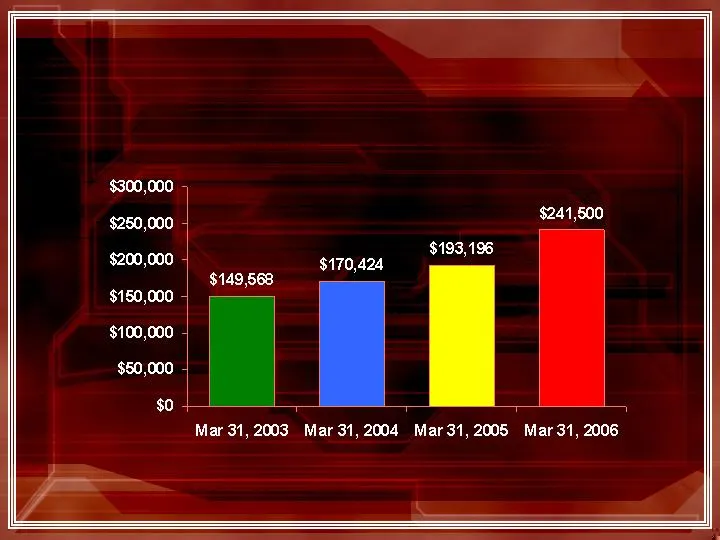
Slide 4: Total Assets
Total Assets 14% Increase Over 2003 28% Increase Over 2002 25% Increase Over 2005 13% Increase Over 2004

Slide 5: Statement of Operations
Statement of Operations Year Net Income/Loss Change From Prior Year 2001 $ (560) 2002 $ 179 + 132% 2003 $1,173 + 555% 2004 $1,359 + 16% 2005 $2,115 + 56%

Slide 6: Income Trend
Income Trend 2001 2002 2003 2004 2005 2006 1 st Qtr. $ (232) $ 17 $ 110 $ 222 $ 262 $ 475 2 nd Qtr. (181) 130 272 313 345 3 rd Qtr. (81) 4 454 410 457 4 th Qtr. (66) 28 338 414 1,051 * *reflects a one time $449,000 reversal of the valuation allowance for taxes
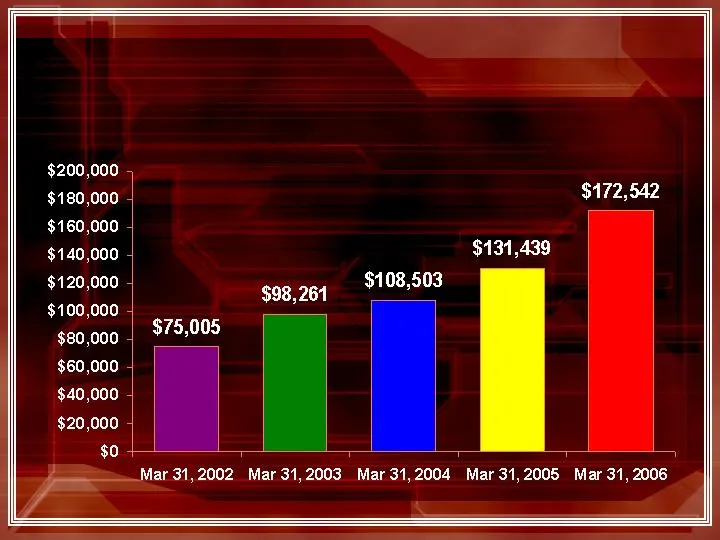
Slide 7: Loan Growth - Total Balances
Loan Growth - Total Balances 31% Increase Over 2002 10% Increase Over 2003 33% Increase Over 2001 31% Increase Over 2005 21% Increase Over 2004
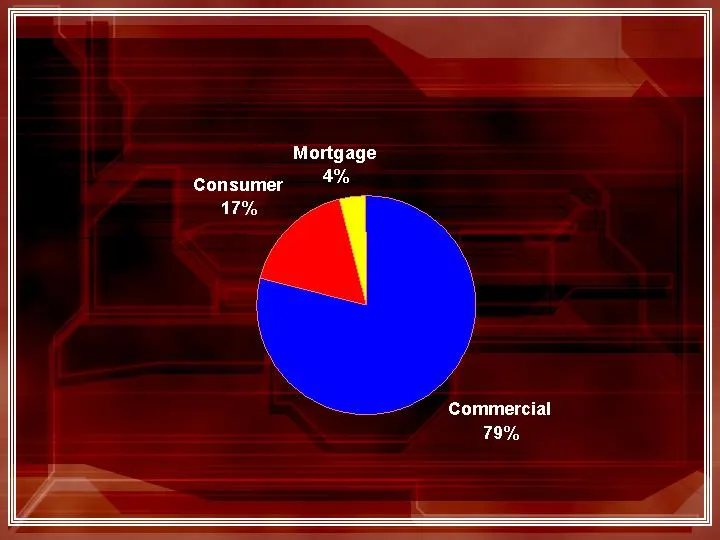
Slide 8: Loan Mix Composition
Loan Mix Composition Total Balances March 31, 2006
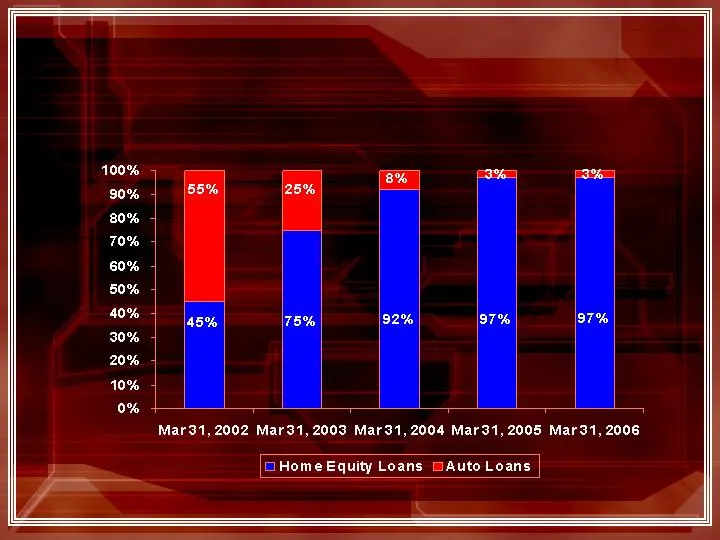
Slide 9: Consumer Loan Portfolio – Loan Composition
Consumer Loan Portfolio – Loan Composition

Slide 10: Net Interest Margin
Net Interest Margin 4.31% 12/31/2005 3.78% 12/31/2004 3.40% 12/31/2003 3.52% 12/31/2002 2.98% 12/31/2001

Slide 11: Net Interest Margin - continued
Net Interest Margin - continued 4.24% 3/31/2006 4.21% 3/31/2005 3.44% 3/31/2004 3.31% 3/31/2003 3.36% 3/31/2002 2.99% 3/31/2001
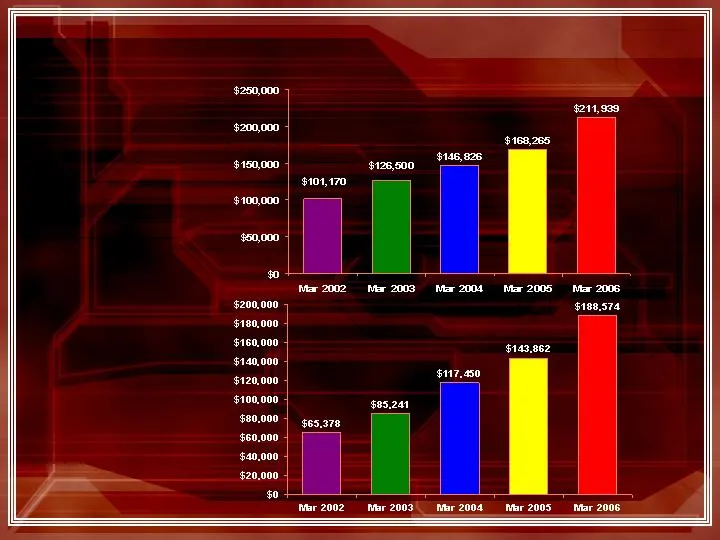
Slide 12: Deposit Growth
Deposit Growth Total Deposits Core Deposits 25% Increase 35% Increase 30% Increase 74% Increase 16% Increase 38% Increase 22% Increase 26% Increase 31% Increase 15% Increase

Slide 13: Deposit Mix - Total Balances
Deposit Mix - Total Balances 90% 20,731 141,846 45,667 12/31/2005 85% 23,748 94,066 37,061 12/31/2004 79% 30,545 86,111 28,995 12/31/2003 66% 42,538 67,520 15,386 12/31/2002 65% $35,783 $53,898 $13,272 12/31/2001 Core Deposits as a % of Total Deposits Time Deposits NOW/Money Market/Savings Demand
![Slide 14: 6,000 5119 5,000 4,000 3,000 2,490 2,000 1763] I 1,423 1,028 961 975 tT](https://6ix-events-pro.s3.amazonaws.com/decks/p/8tzeqh4y/14.webp)
Slide 14: 6,000 5119 5,000 4,000 3,000 2,490 2,000 1763] I 1,423 1,028 961 975 tT
6,000 5119 5,000 4,000 5 3,000 2,490 2,000 1763] I 1,423 1,028 961 975 tT | Transaction Accounts Savings and MMA Time Deposit 1,000 | O-+ (Mar 31,2002 4 Mar 31,2003 0 Mar 31, 2004 m Mar 31,2005 Mar 31, 2006
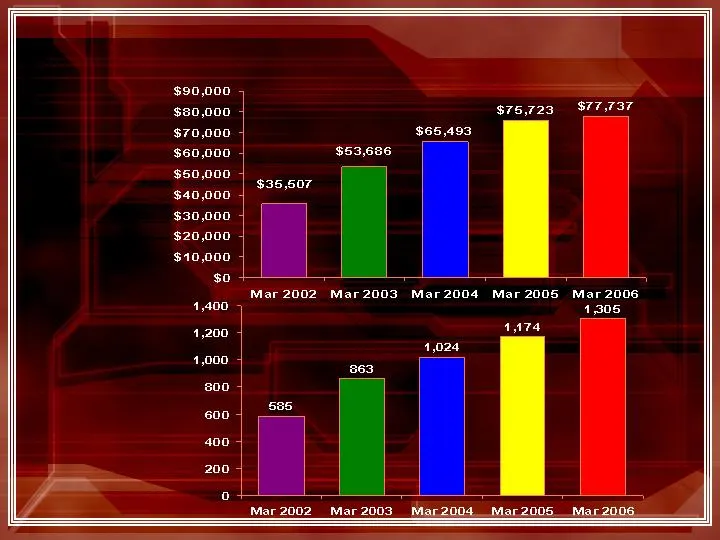
Slide 15: Paramount Checking
Paramount Checking Total Balances Number of Accounts 51% Increase 48% Increase 224% Increase 293% Increase 3% Increase 11% Increase 22% Increase 19% Increase 16% Increase 15% Increase
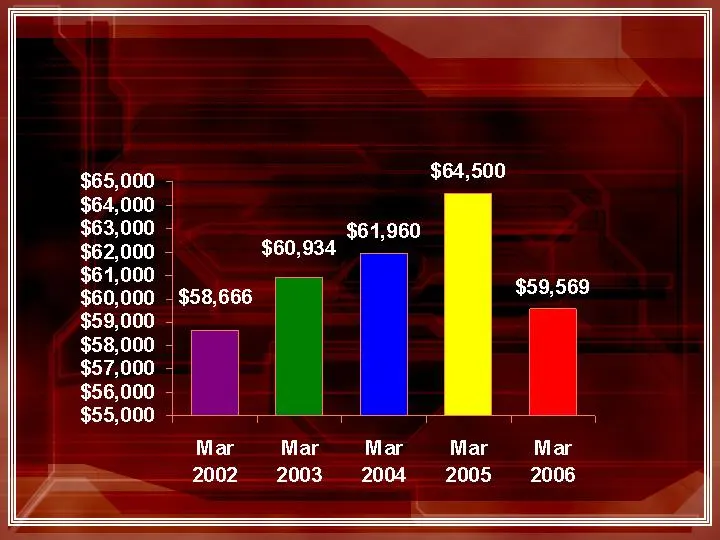
Slide 16: Paramount Checking - continued
Paramount Checking -continued Average Balance Per Account
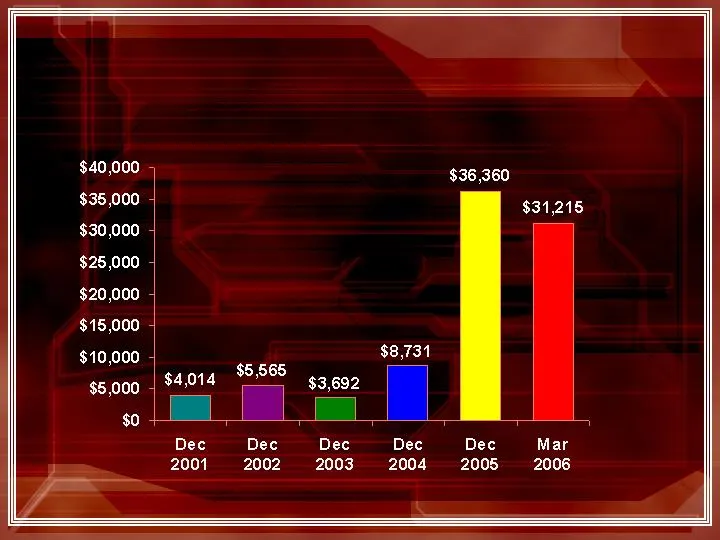
Slide 17: $40,000 $35,000 $30,000 $25,000 $20,000 $15,000 $10,000 $5,000 $0 | $401 Dec 2001 $36,360
$40,000 $35,000 $30,000 $25,000 $20,000 $15,000 $10,000 $5,000 $0 | $401 Dec 2001 $36,360 $31,215 $8,731 | 4 $5865 6. ea, [| = -_ Dec Dec Dec Dec Mar 2002 2003 2004 2005 © «©2006
Slide 18: Escrow Ease - continued
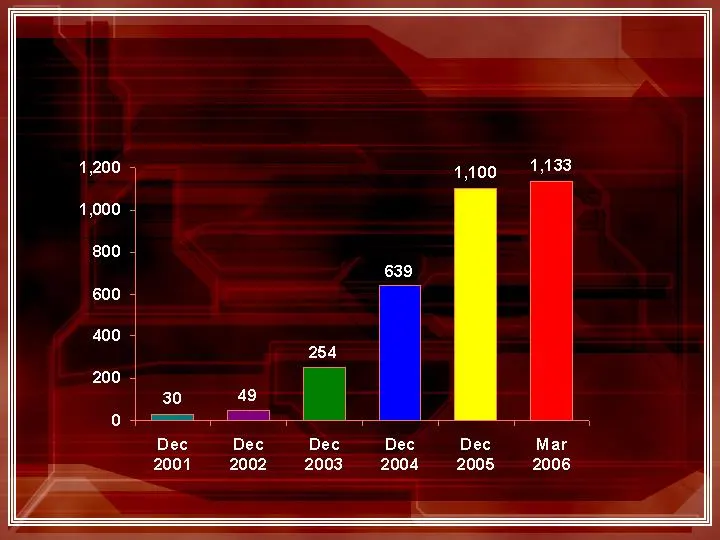
Escrow Ease - continued Number of Client Accounts
Slide 19: Transaction Activity
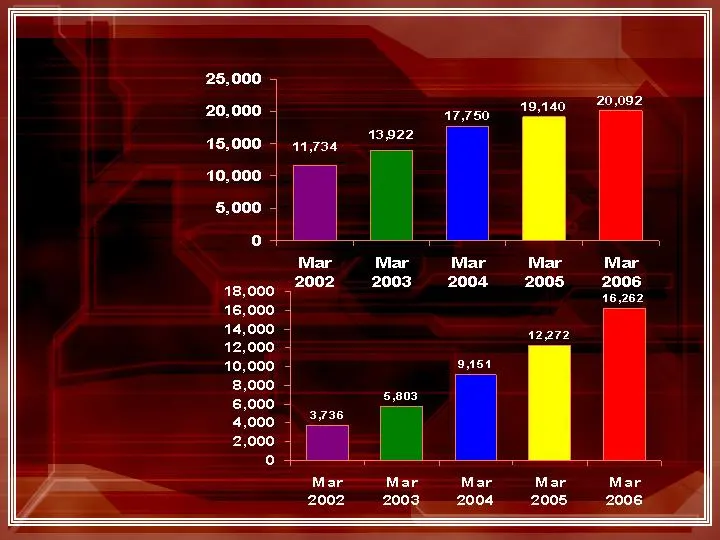
Transaction Activity Teller Transactions Per Month ACH Transactions Per Month 19% Increase 27% Increase 55% Increase 58% Increase 41% Increase 88% Increase 5% Increase 33% Increase 8% Increase 34% Increase

Slide 20: Asset Quality and Reserves
Asset Quality and Reserves From the outset, we have implemented a strong credit culture through the application of sound banking principles. As of December 31, 2005 Somerset Hills Bancorp had no non-performing loans. Loan loss reserves as of the same date totaled $2.0 million. Loan Loss Reserve 1.21

Slide 21: Capital Ratios
Capital Ratios Actual Well Capitalized December 31, 2005 Amount Ratio Amount Ratio Total Capital (to risk - weighted assets) $26,450 12.73% $20,772 > 10.00% Tier I Capital (to risk - weighted assets) 24,421 11.76 12,463 > 6.00 Tier I Capital (to average asse ts) 24,421 10.40 11,739 > 5.00 December 3

Slide 22: Sullivan Financial Services, Inc.
Sullivan Financial Services, Inc. a subsidiary of Somerset Hills Bank Headquarters 100 Executive Drive, Suite 140 West Orange, NJ 07052 Phone: 973-325-5000 Fax: 973-325-6791

Slide 23: Sullivan Financial Services Products and Services
Sullivan Financial Services, Inc. Products and Services Conventional Mortgage Loans Fixed and Adjustable Rate Loans FHA/VA Loans Jumbo Mortgages 1st Time Buyer Programs No Doc Loans No Cost Refinances

Slide 24: Sullivan Financial Services Loan Volume
Sullivan Financial Services, Inc. Loan Volume 2001 2002 2003 2004 2005 Originations $304,179 $404,513 $530,913 $330,491 $379,114 Originations 1530 1701 2159 1297 1362 Closings $220,261 $320,978 $505,384 $270,803 $311,273 Closings 1153 1384 2098 1091 1132

Slide 25: Sullivan Financial Services Loan Volume - Continued
Sullivan Financial Services, Inc. Loan Volume - Continued 1 st Quarter 2002 1 st Quarter 2003 1 st Quarter 2004 1 st Quarter 2005 1 st Quarter 200 6 Originations $81,482 $140,159 $93,843 $87,750 $76,094 Originations 371 572 396 309 295 Closings $59,185 $95,953 $52,379 $55,623 $65,725 Closings 270 39

Slide 26: Average Loan Amount
Average Loan Amount 2001 $194,000 2002 $232,000 2003 $240,888 2004 $248,216 2005 $274,976 1 st Quarter 2006 $387,551 Sullivan Financial Services, Inc. Loan Volume - Continued

Slide 27: Somerset Hills Wealth Management, LLC
Somerset Hills Wealth Management, LLC a subsidiary of Somerset Hills Bank

Slide 28: Wealth Management: For the Individual
Somerset Hills Wealth Management, LLC For the Individual: Financial Planning Investment Management Estate Review Life, Health & Long Term Care Insurance Property and Casualty Insurance

Slide 29: Wealth Management: For the Business Owner
Somerset Hills Wealth Management, LLC For the Business Owner: Business Succession Planning Buy-Sell & Key Person Agreements Retirement Plans & Group Insurance Property and Casualty Insurance

Slide 30: Somerset Hills Title Company, LLC
Somerset Hills Title Company, LLC PROVIDING TITLE SERVICE IN CONNECTION WITH THE CLOSING OF REAL ESTATE TRANSACTIONS 2004 2005 1 st Qtr 2006 Total Transactions 30 62 12 Amount of Closed Transactions (approximate) $30 Million $57 Million $6 Million Net Income to Bank $20,000 $ 64,000 $ 10,000

Slide 31: Look to the Future
Look to the Future Building the Franchise New Branch Opportunities Acquisition Opportunities Staffing Opportunities
Slide 32: Long Valley
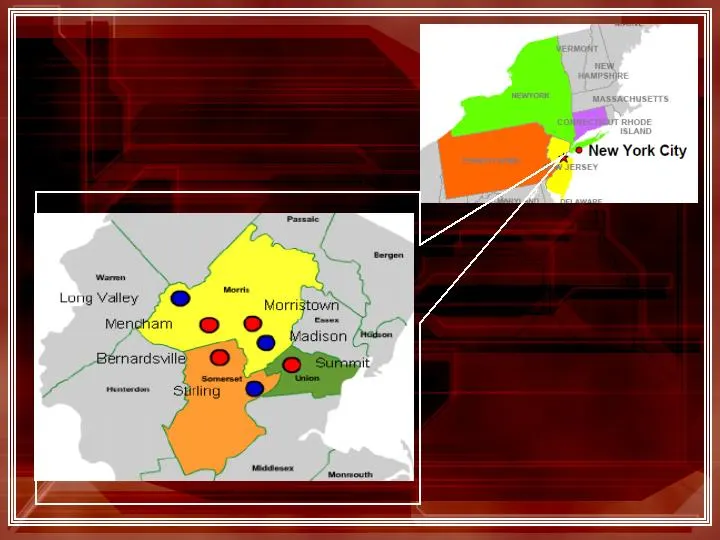
Long Valley Mencl Bérnardswill

Slide 33: 5% Stock Dividend
5% Stock Dividend !!!

Slide 34: $0.03 per quarter Cash Dividend
$0.03 per quarter Cash Dividend !!! 50% Increase!!!

Slide 35: Stock Price
Stock Price Stock - SOMH Warrants SOMHW 12/31/2002 $6.84 $1.21 3/31/2003 6.49 1.16 6/30/2003 7.97 1.90 9/30/2003 8.35 2.20 12/31/2003 10.78 3.20 3/31/2004 11.71 4.05 6/30/2004 11.51 4.44 9/30/2004 11.36 4.50 12/31/2004 12.20 5.00 * Prices Adjusted to reflect 5% Stock Dividend of June 30, 2003 and Ju

Slide 36: Stock Price (continued)
Stock Price (continued) Stock - SOMH Warrants SOMHW 3/31/2005 $10.90 $3.92 6/30/2005 11.60 3.25 9/30/2005 11.34 3.55 12/31/2005 12.66 5.00 3/31/2006 14.45 7.49 4/20/2006 14.30 6.78 * Prices Adjusted to reflect 5% Stock Dividend of June 30, 2003 and June 2, 2004 and June 30, 2005 Declared 5% Stock Di
Source: SEC EDGAR · 8-K filed Apr 26, 2006
More decks from Somerset Hills Bancorp
 Shareholder Meeting (May 2013)10 slides · May 8, 2013
 Merger or Acquisition (February 2013)32 slides · Feb 7, 2013
 Merger or Acquisition (January 2013)13 slides · Jan 29, 2013
 Shareholder Meeting (April 2012)25 slides · Apr 19, 2012
 Investor Presentation (November 2011)26 slides · Nov 1, 2011
 Shareholder Meeting (April 2011)29 slides · Apr 26, 2011