Loomis AB · OMXSTO:LOOMIS
Loomis AB — Q3 2016 Earnings Presentation
14 slides from Loomis AB's earnings presentation, Nov 4, 2016

Slide 1: Q3 - 2016
Q3 - 2016 President & CEO Patrik Andersson Stockholm November 4, 2016
Slide 2: Content
Content Highlights Q3 2016 Segments Financials Q&A 2
Slide 3: Highlights Q3 2016
Highlights Q3 2016 Organic growth 3 percent (3) - Strong growth in US - Continued positive development in Spain, Turkey and Argentina - Slight decline in Nordic countries Operating margin 12.6 percent (11.6) - Highest operating margin since the IPO in 2008 - Margin improvement in all segments -
Slide 4: Operating margin development
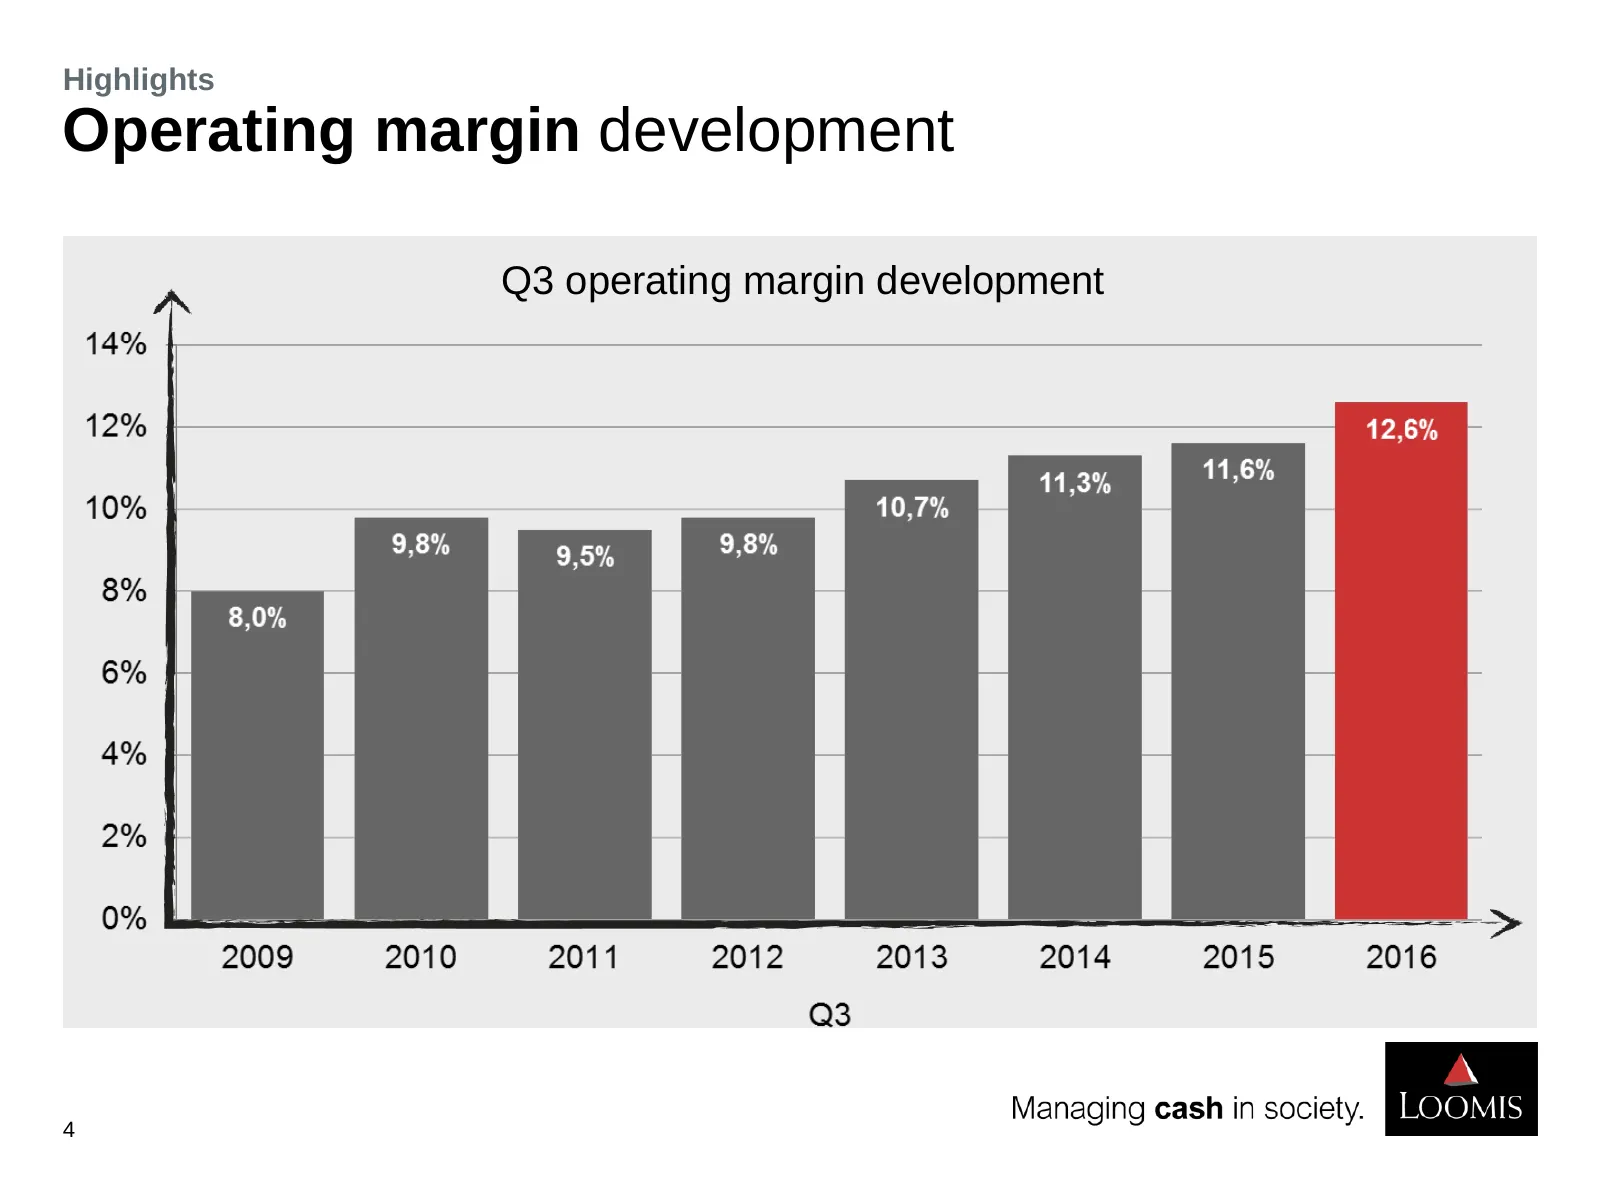
Highlights Operating margin development Q3 operating margin development 4
Slide 5: Operating margin development – rolling 12
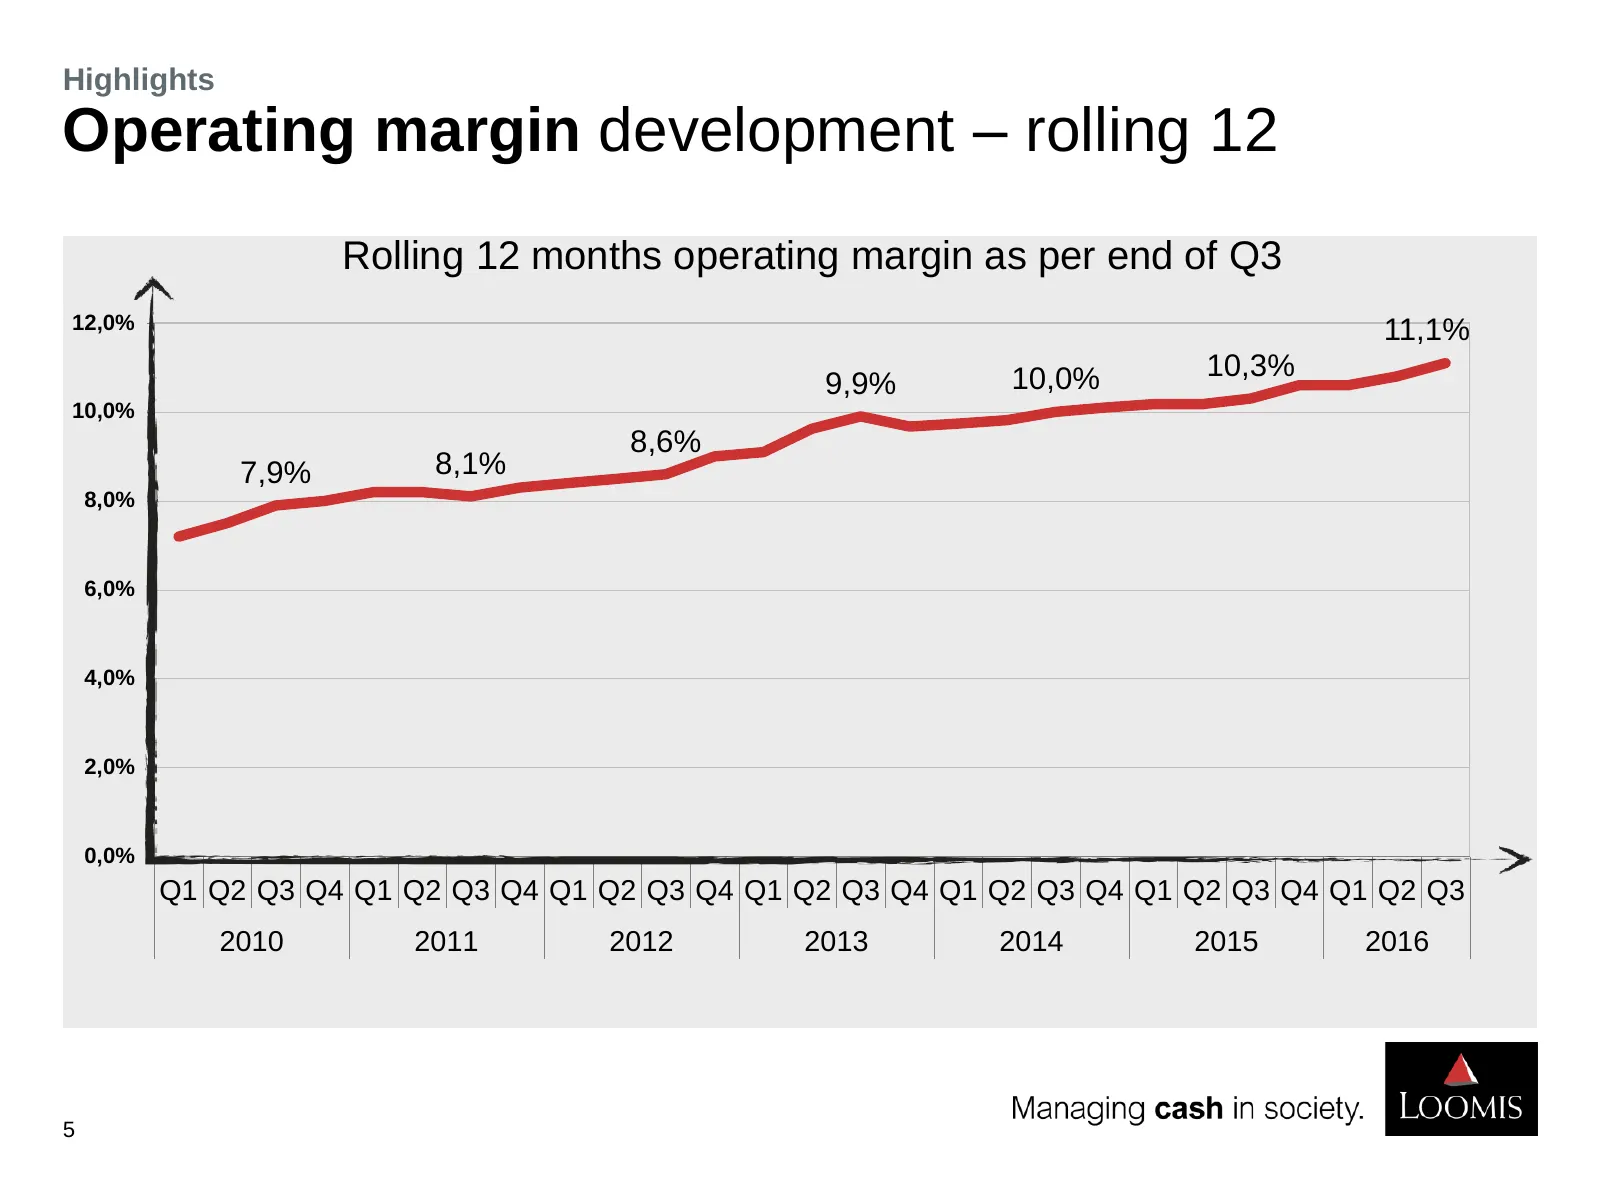
Highlights Operating margin development – rolling 12 Rolling 12 months operating margin as per end of Q3 12,0% 11,1% 10,0% 10,3% 9,9% 10,0% 8,6% 7,9% 8,1% 8,0% 6,0% 4,0% 2,0% 0,0% Q1 Q2 Q3 Q4 Q1 Q2 Q3 Q4 Q1 Q2 Q3 Q4 Q1 Q2 Q3 Q4 Q1 Q2 Q3 Q4 Q1 Q2 Q3 Q4 Q1 Q2 Q3 2010 2011 2012 2013 2014 2015 2016 5
Slide 6: Branch performance
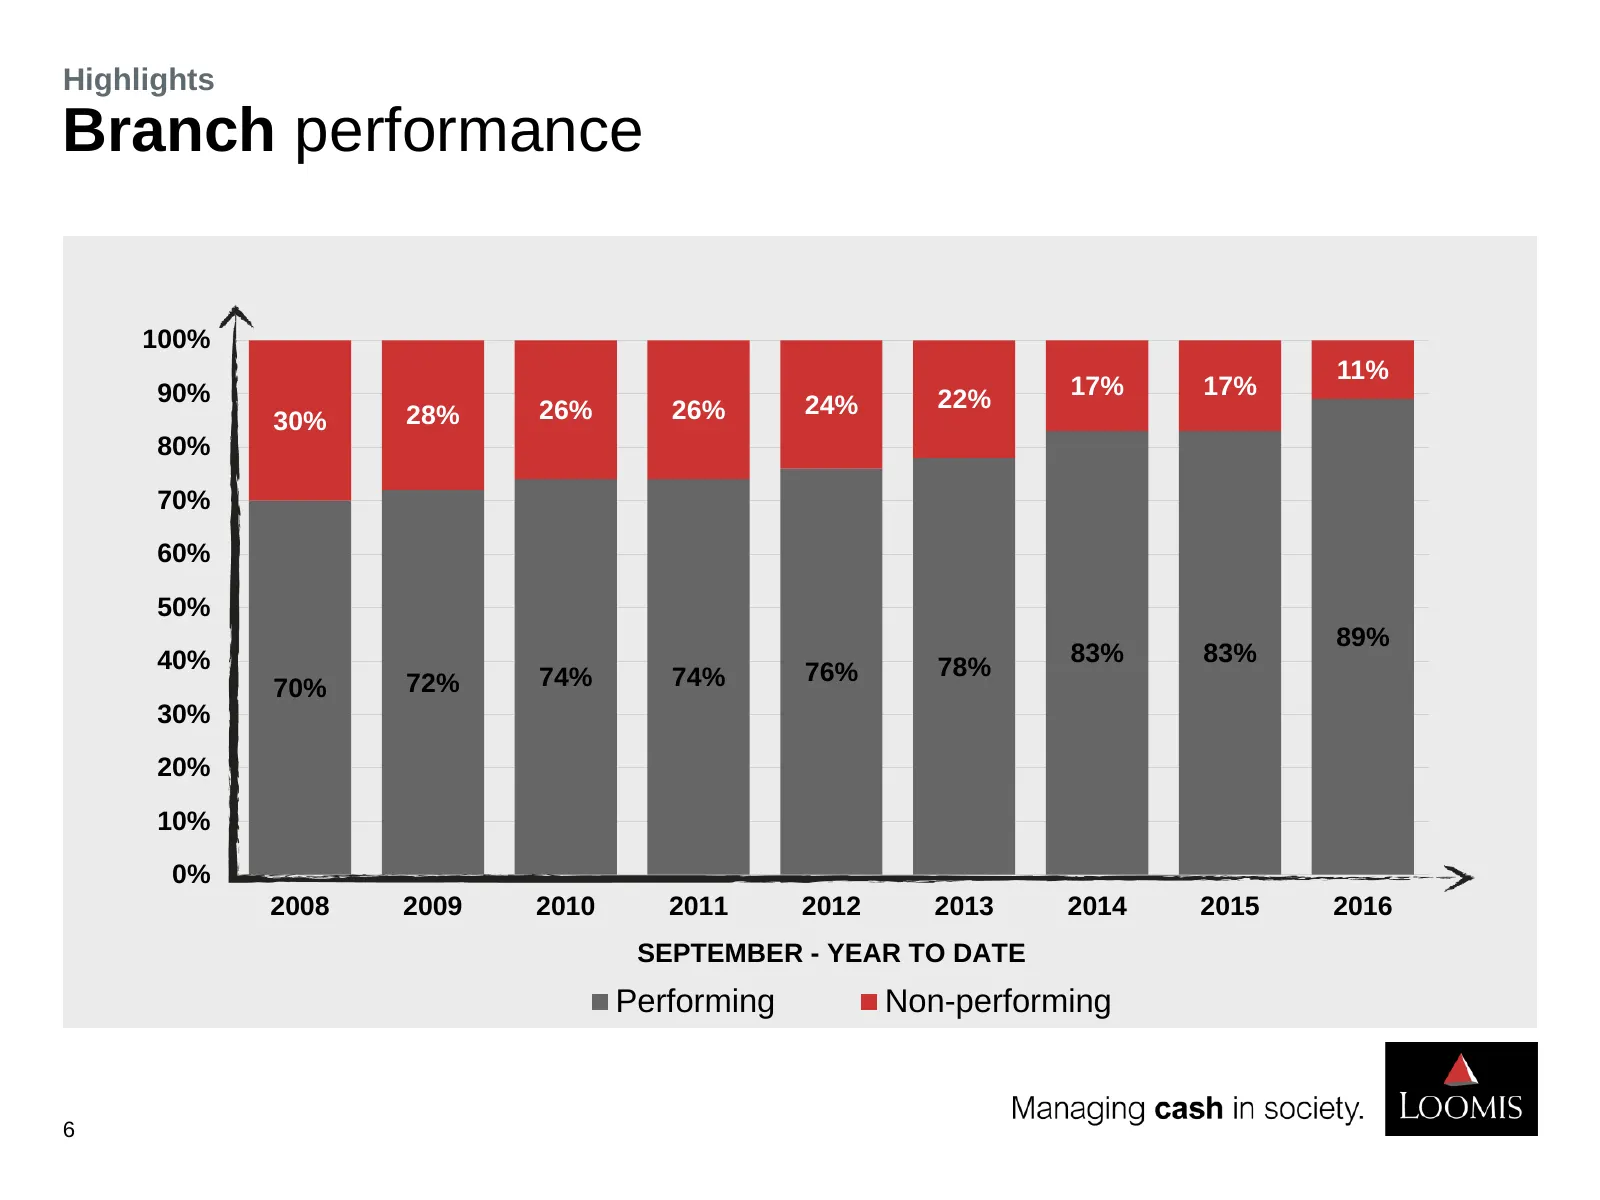
Highlights Branch performance 100% 11% 90% 17% 17% 26% 26% 24% 22% 30% 28% 80% 70% 60% 50% 89% 40% 83% 83% 74% 74% 76% 78% 70% 72% 30% 20% 10% 0% 2008 2009 2010 2011 2012 2013 2014 2015 2016 SEPTEMBER - YEAR TO DATE Performing Non-performing 6
Slide 7: USA Q3 2016
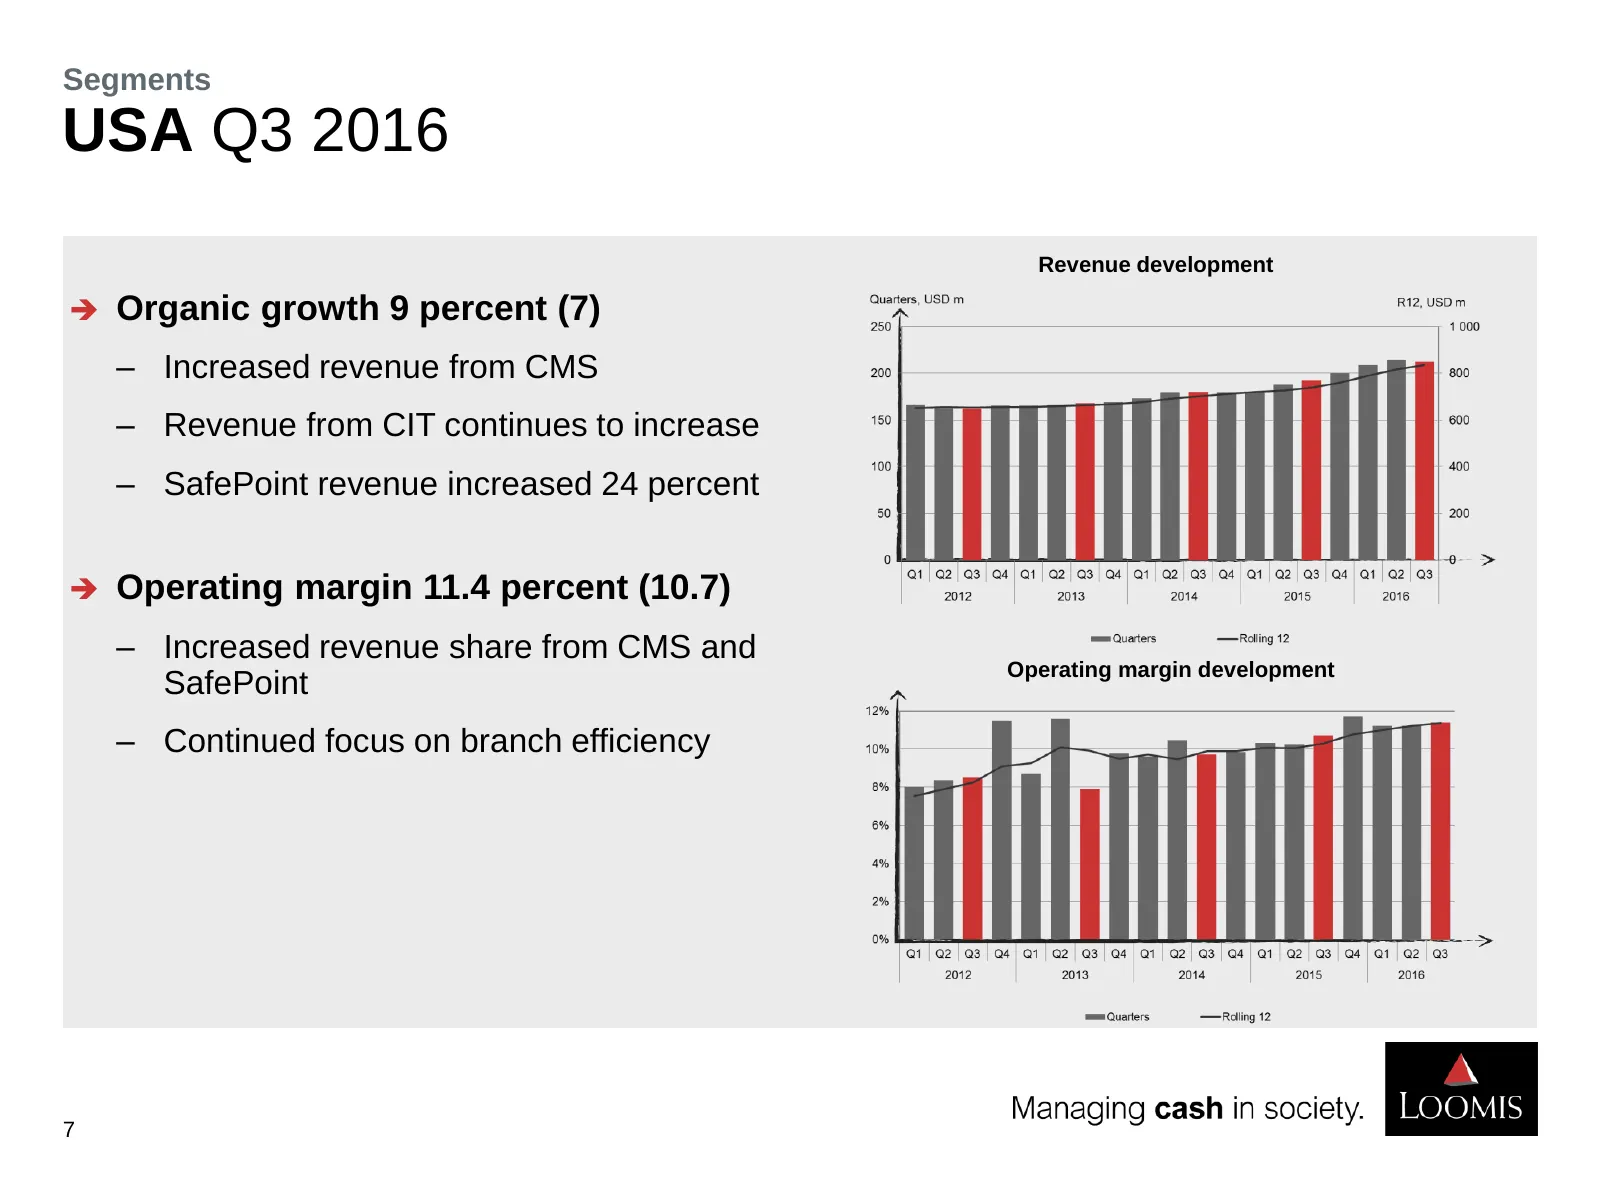
Segments USA Q3 2016 Revenue development Organic growth 9 percent (7) ‒ Increased revenue from CMS ‒ Revenue from CIT continues to increase ‒ SafePoint revenue increased 24 percent Operating margin 11.4 percent (10.7) ‒ Increased revenue share from CMS and Operating margin development SafePoint
Slide 8: SafePoint in the USA as of end Q3, 2016
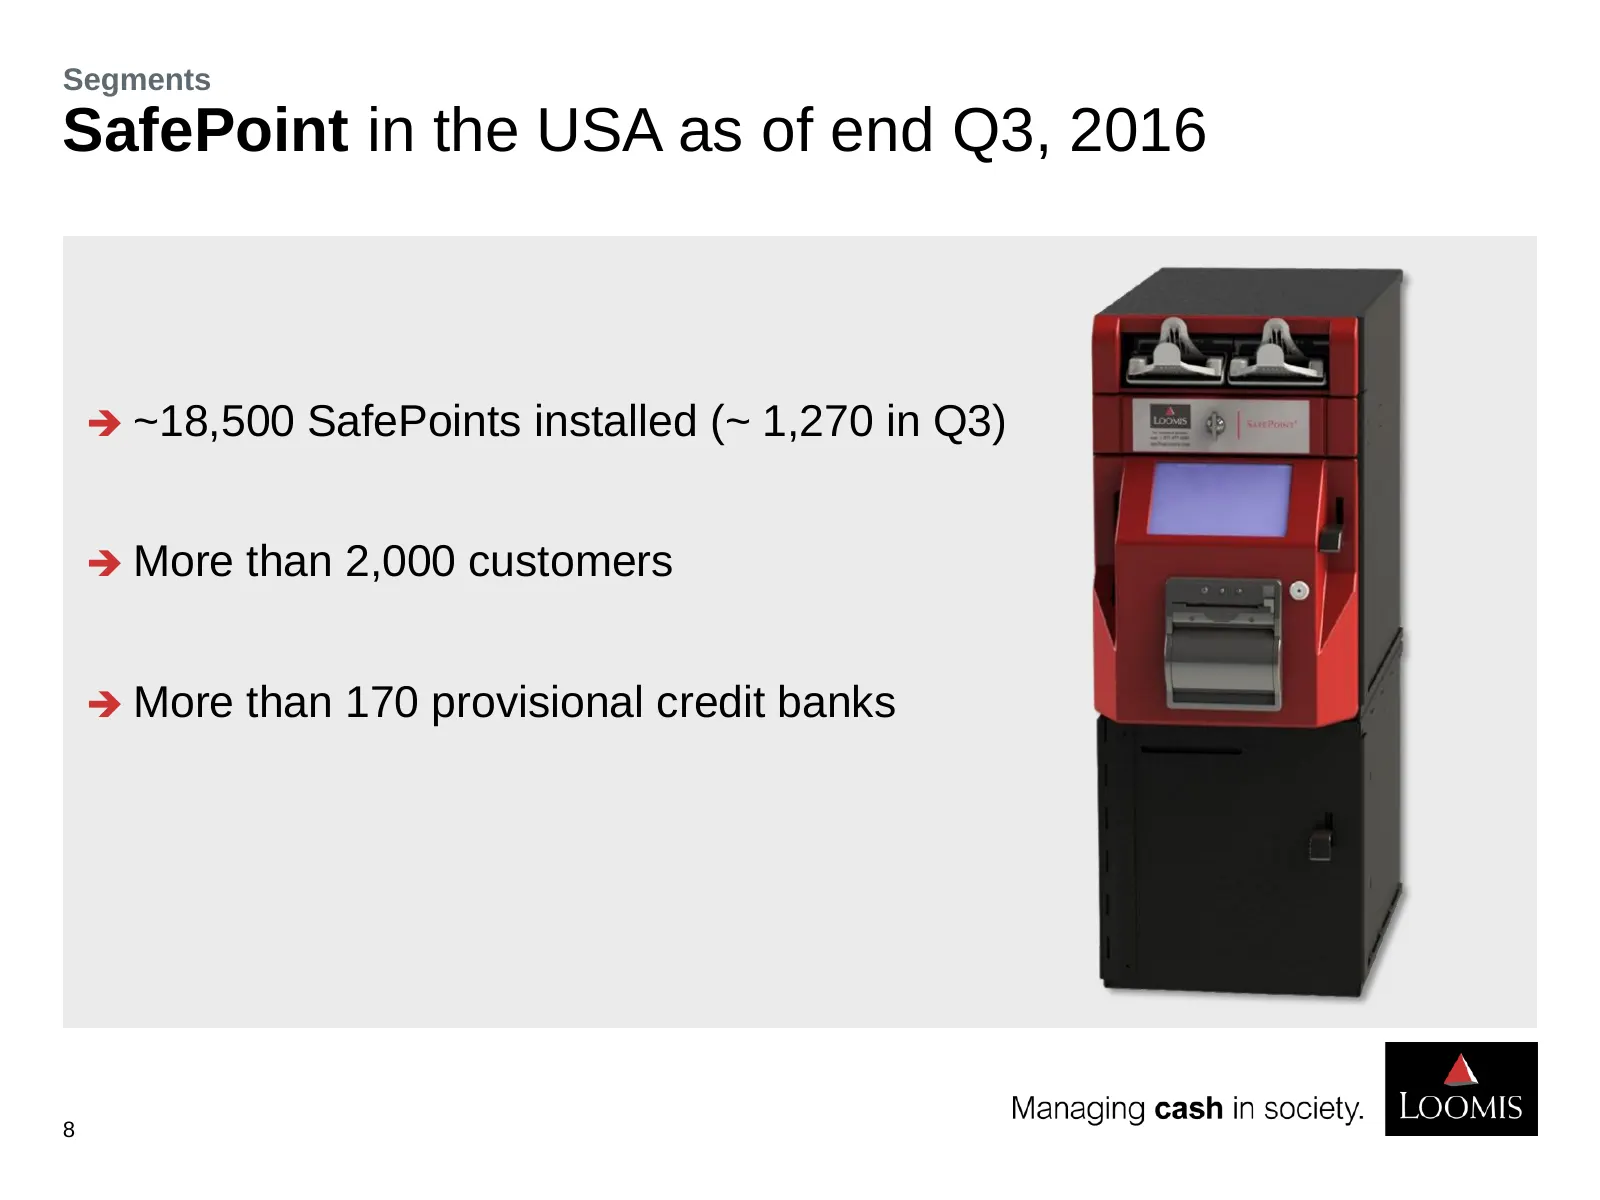
Segments SafePoint in the USA as of end Q3, 2016 ~18,500 SafePoints installed (~ 1,270 in Q3) More than 2,000 customers More than 170 provisional credit banks 8
Slide 9: USA Q3 2016
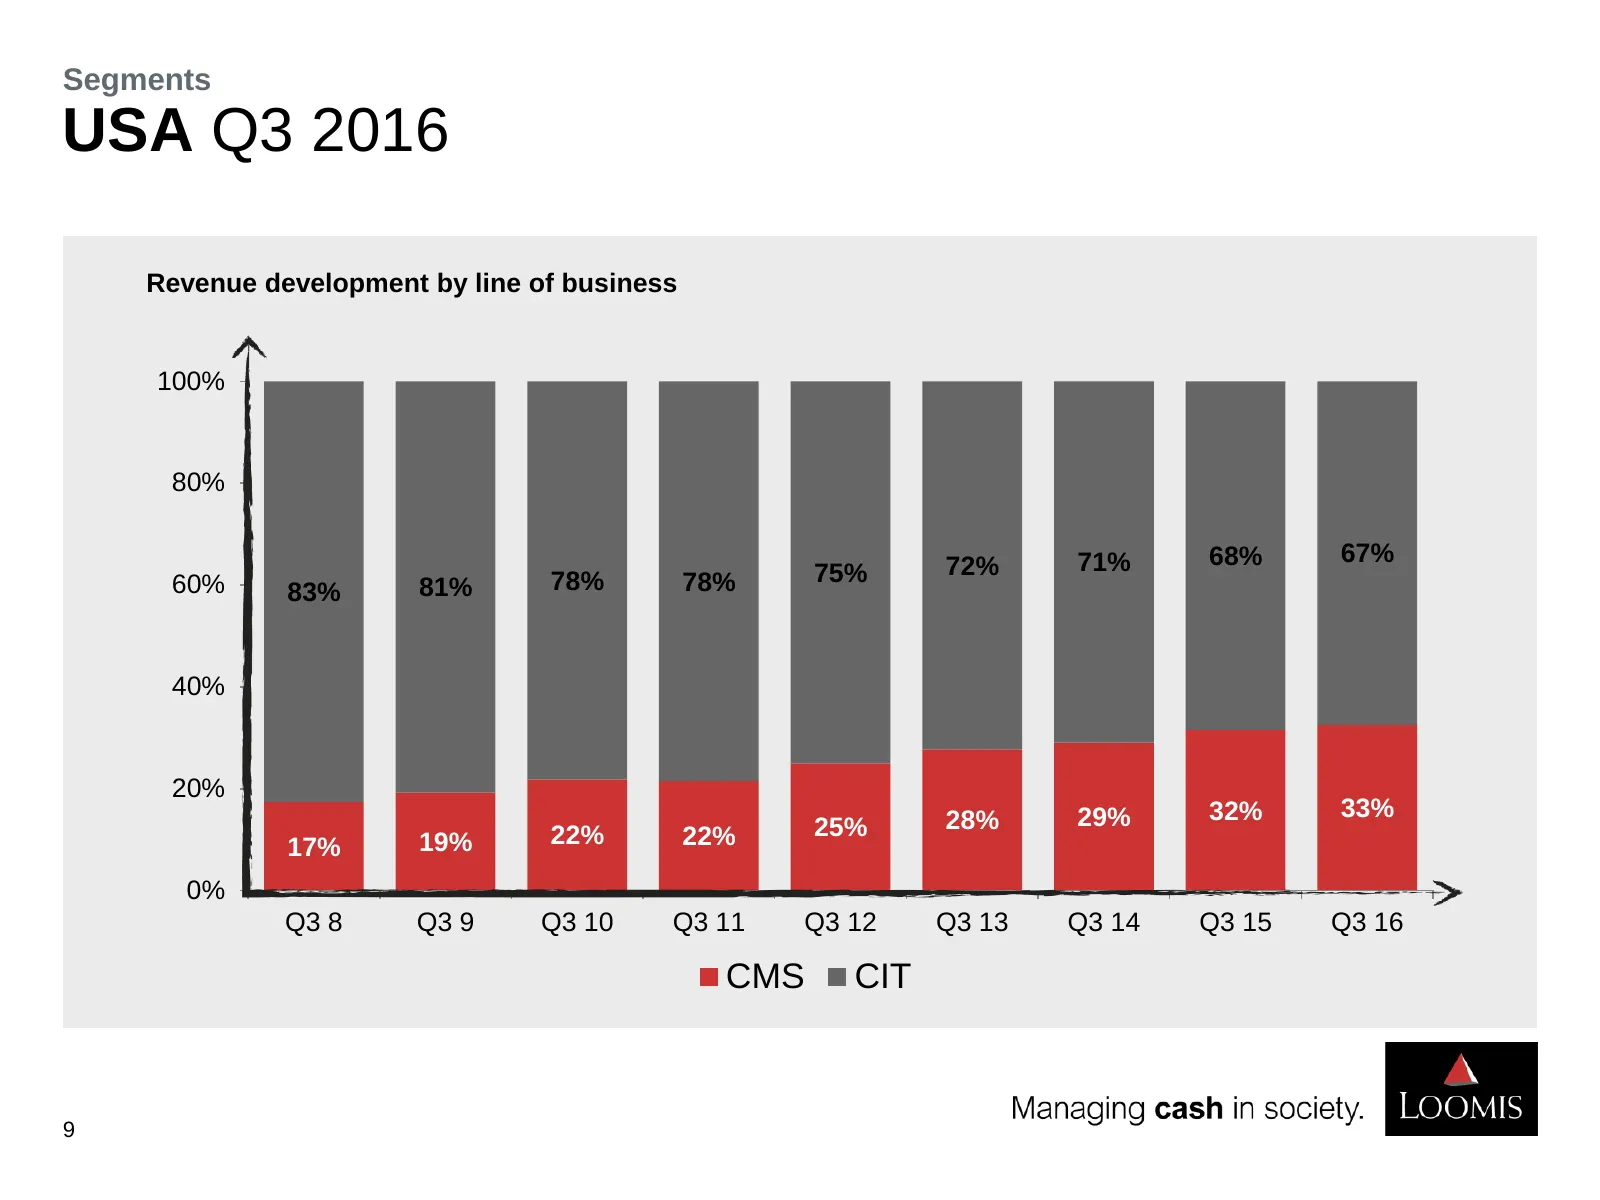
Segments USA Q3 2016 Revenue development by line of business 100% 80% 72% 71% 68% 67% 60% 78% 78% 75% 83% 81% 40% 20% 28% 29% 32% 33% 22% 22% 25% 17% 19% 0% Q3 8 Q3 9 Q3 10 Q3 11 Q3 12 Q3 13 Q3 14 Q3 15 Q3 16 CMS CIT 9
Slide 10: Europe Q3 2016
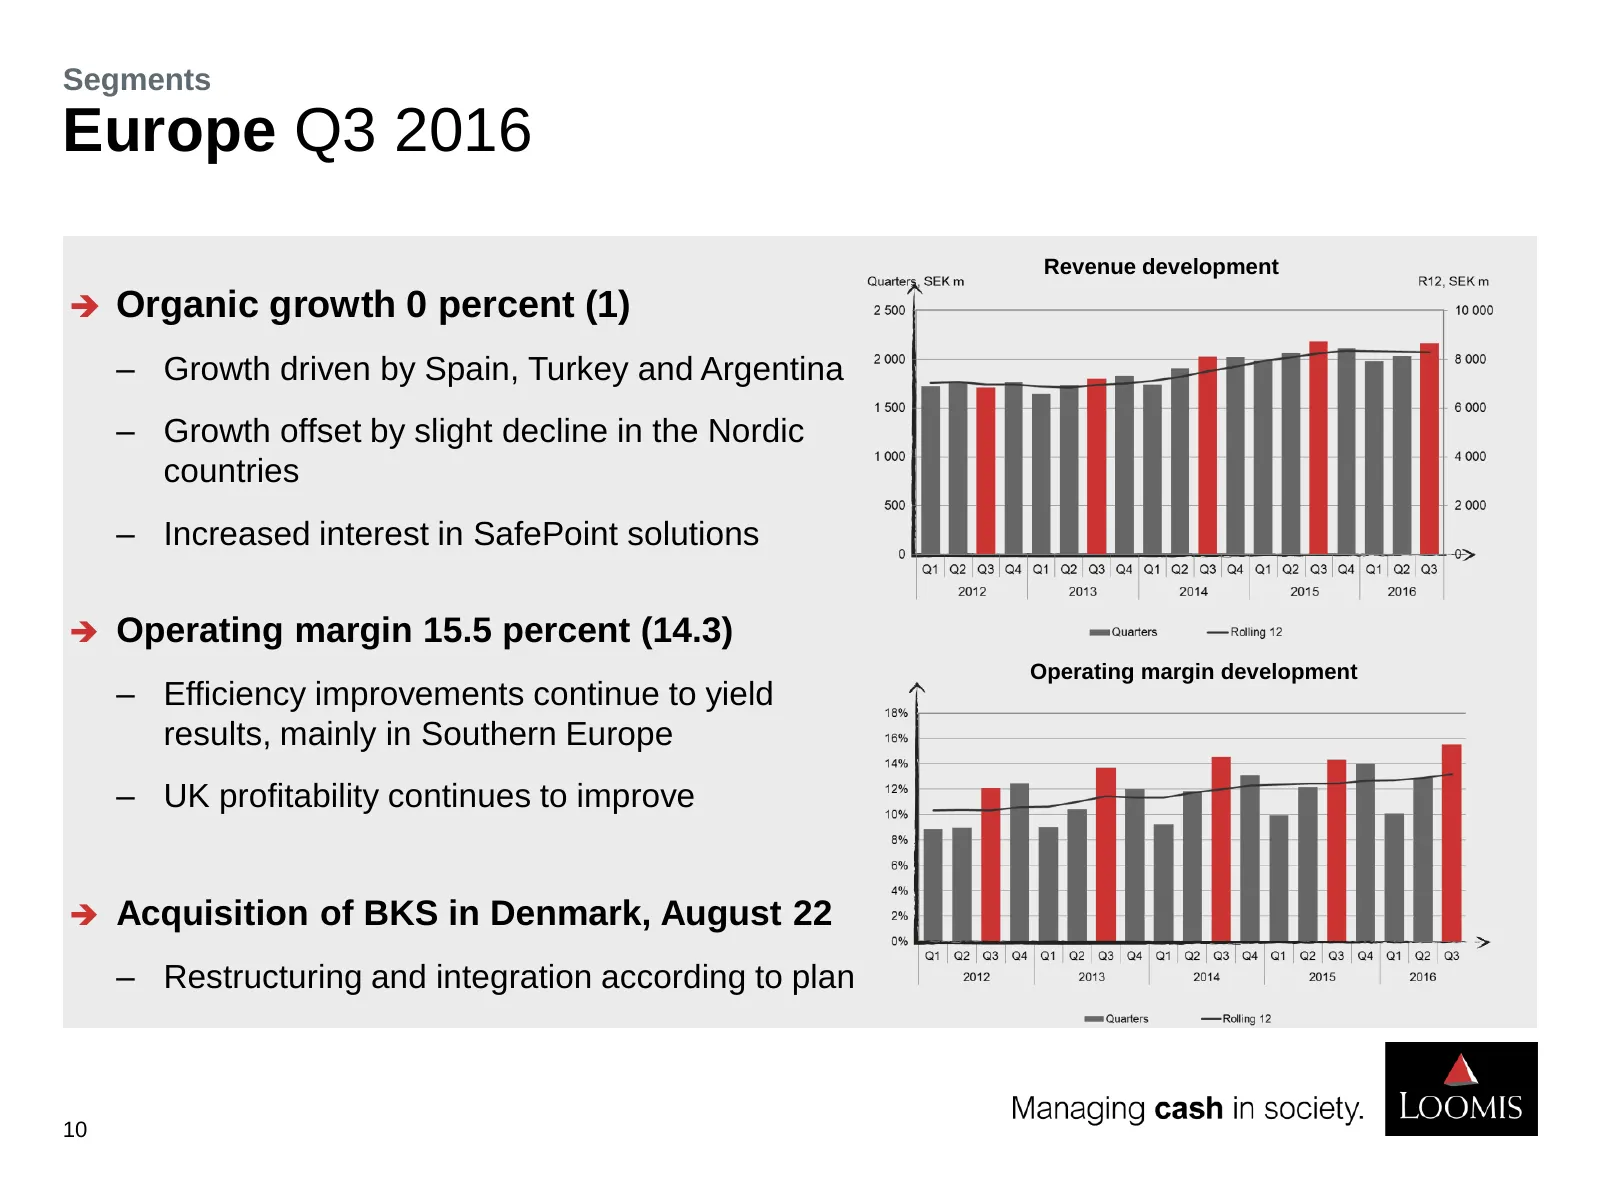
Segments Europe Q3 2016 Revenue development Organic growth 0 percent (1) ‒ Growth driven by Spain, Turkey and Argentina ‒ Growth offset by slight decline in the Nordic countries ‒ Increased interest in SafePoint solutions Operating margin 15.5 percent (14.3) Operating margin development ‒ Effici
Slide 11: International Q3 2016
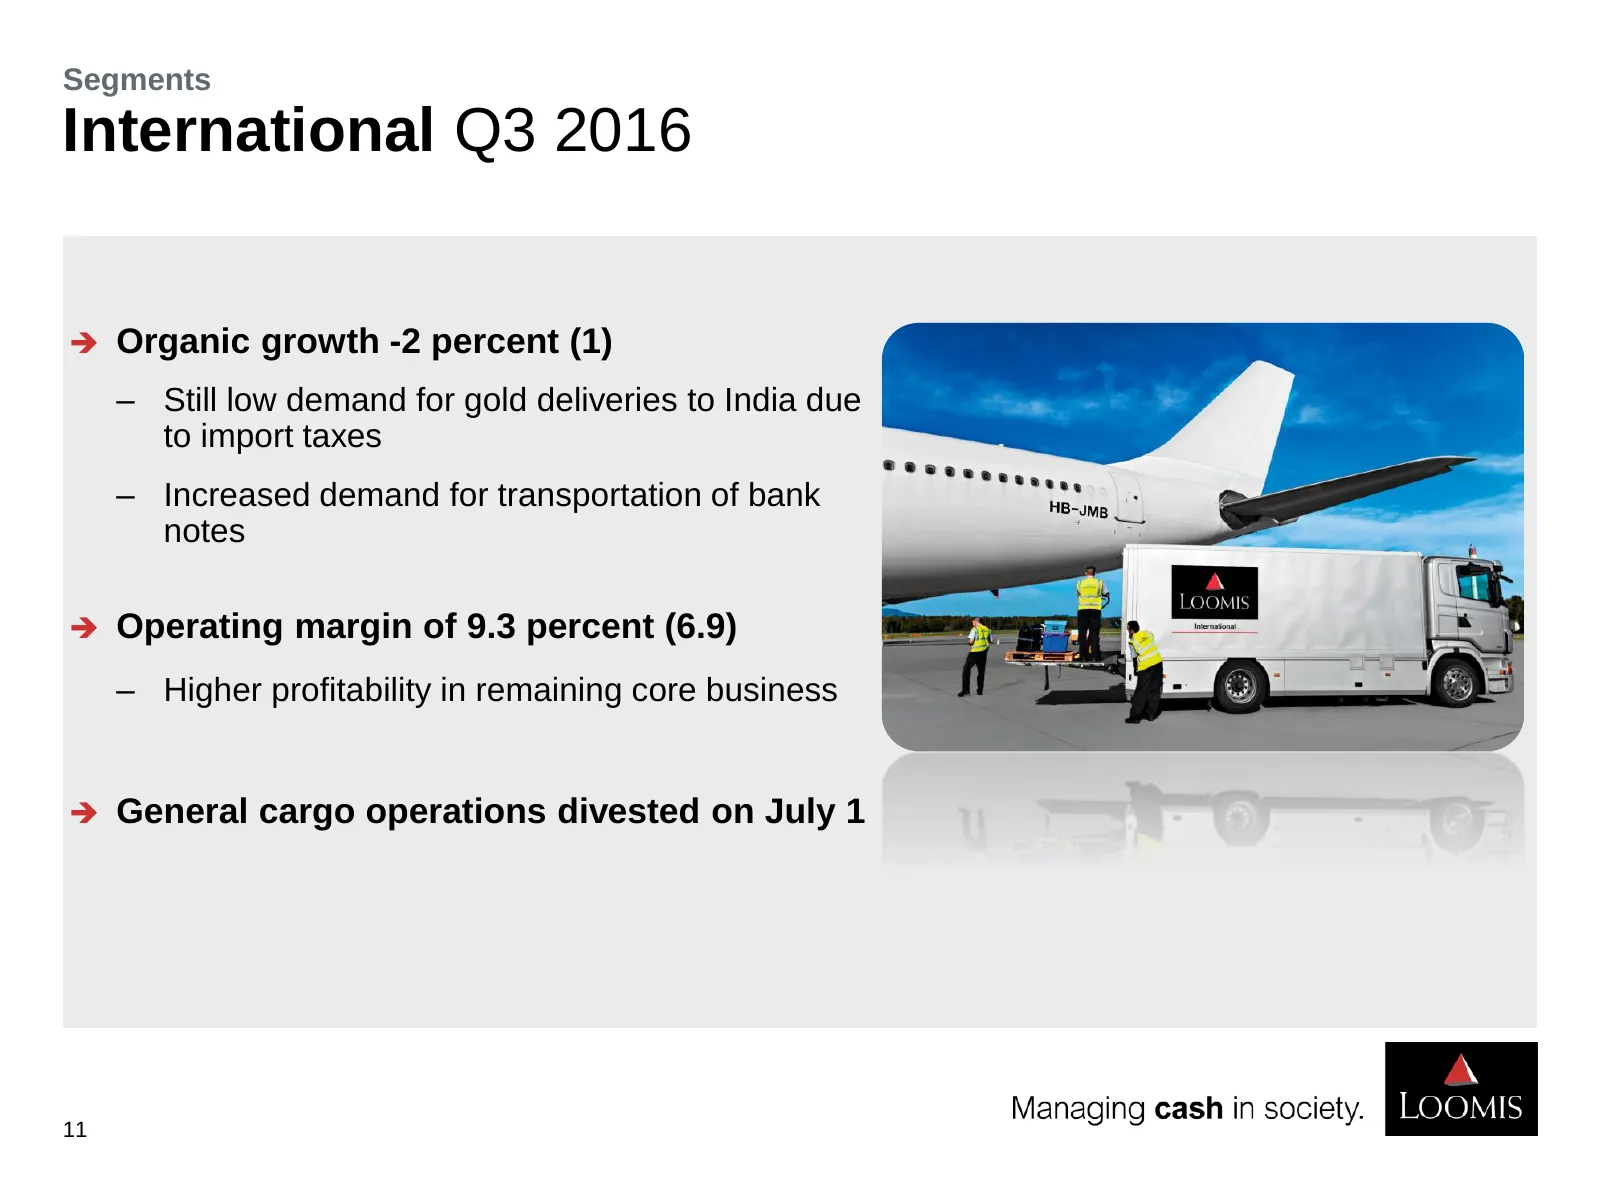
Segments International Q3 2016 Organic growth -2 percent (1) ‒ Still low demand for gold deliveries to India due to import taxes ‒ Increased demand for transportation of bank notes Operating margin of 9.3 percent (6.9) ‒ Higher profitability in remaining core business General cargo operations
Slide 12: Statement of income
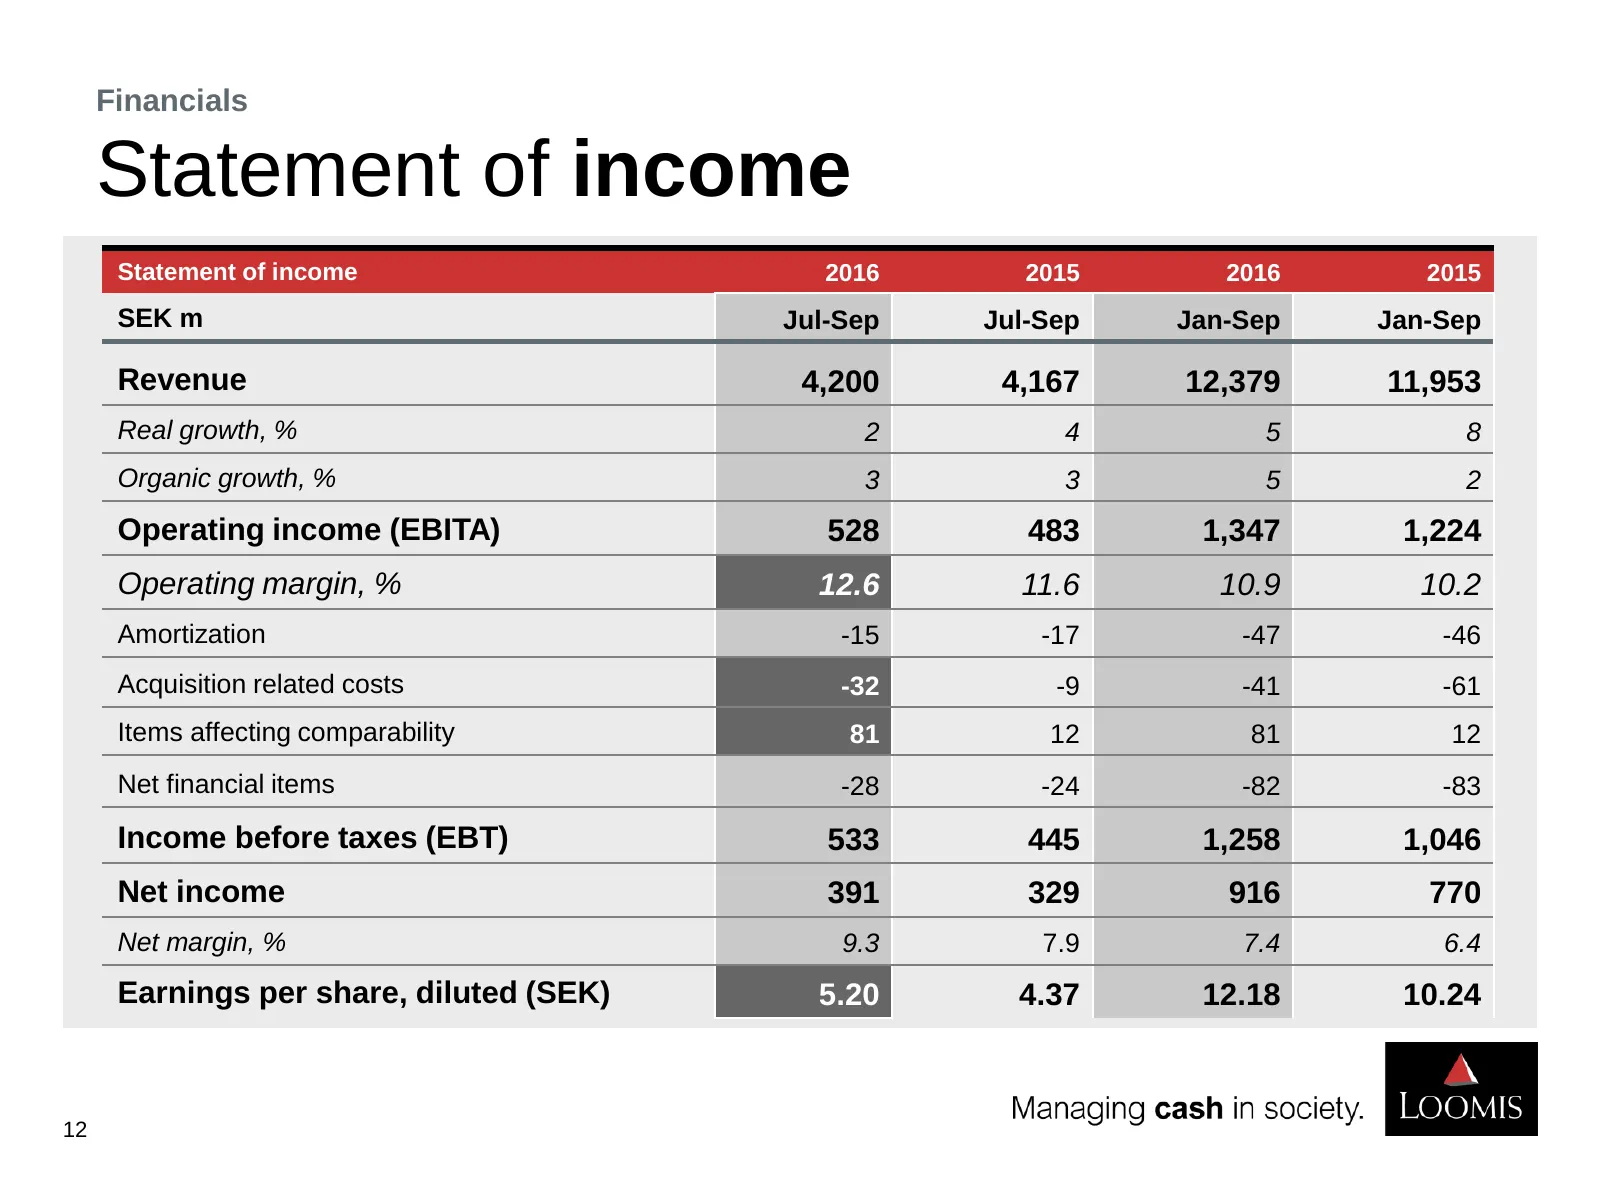
Financials Statement of income Statement of income 2016 2015 2016 2015 SEK m Jul-Sep Jul-Sep Jan-Sep Jan-Sep Revenue 4,200 4,167 12,379 11,953 Real growth, % 2 4 5 8 Organic growth, % 3 3 5 2 Operating income (EBITA) 528 483 1,347 1,224 Operating margin, % 12.6 11.6 10.9 10.2 Amortization -15 -17 -4
Slide 13: Financial targets
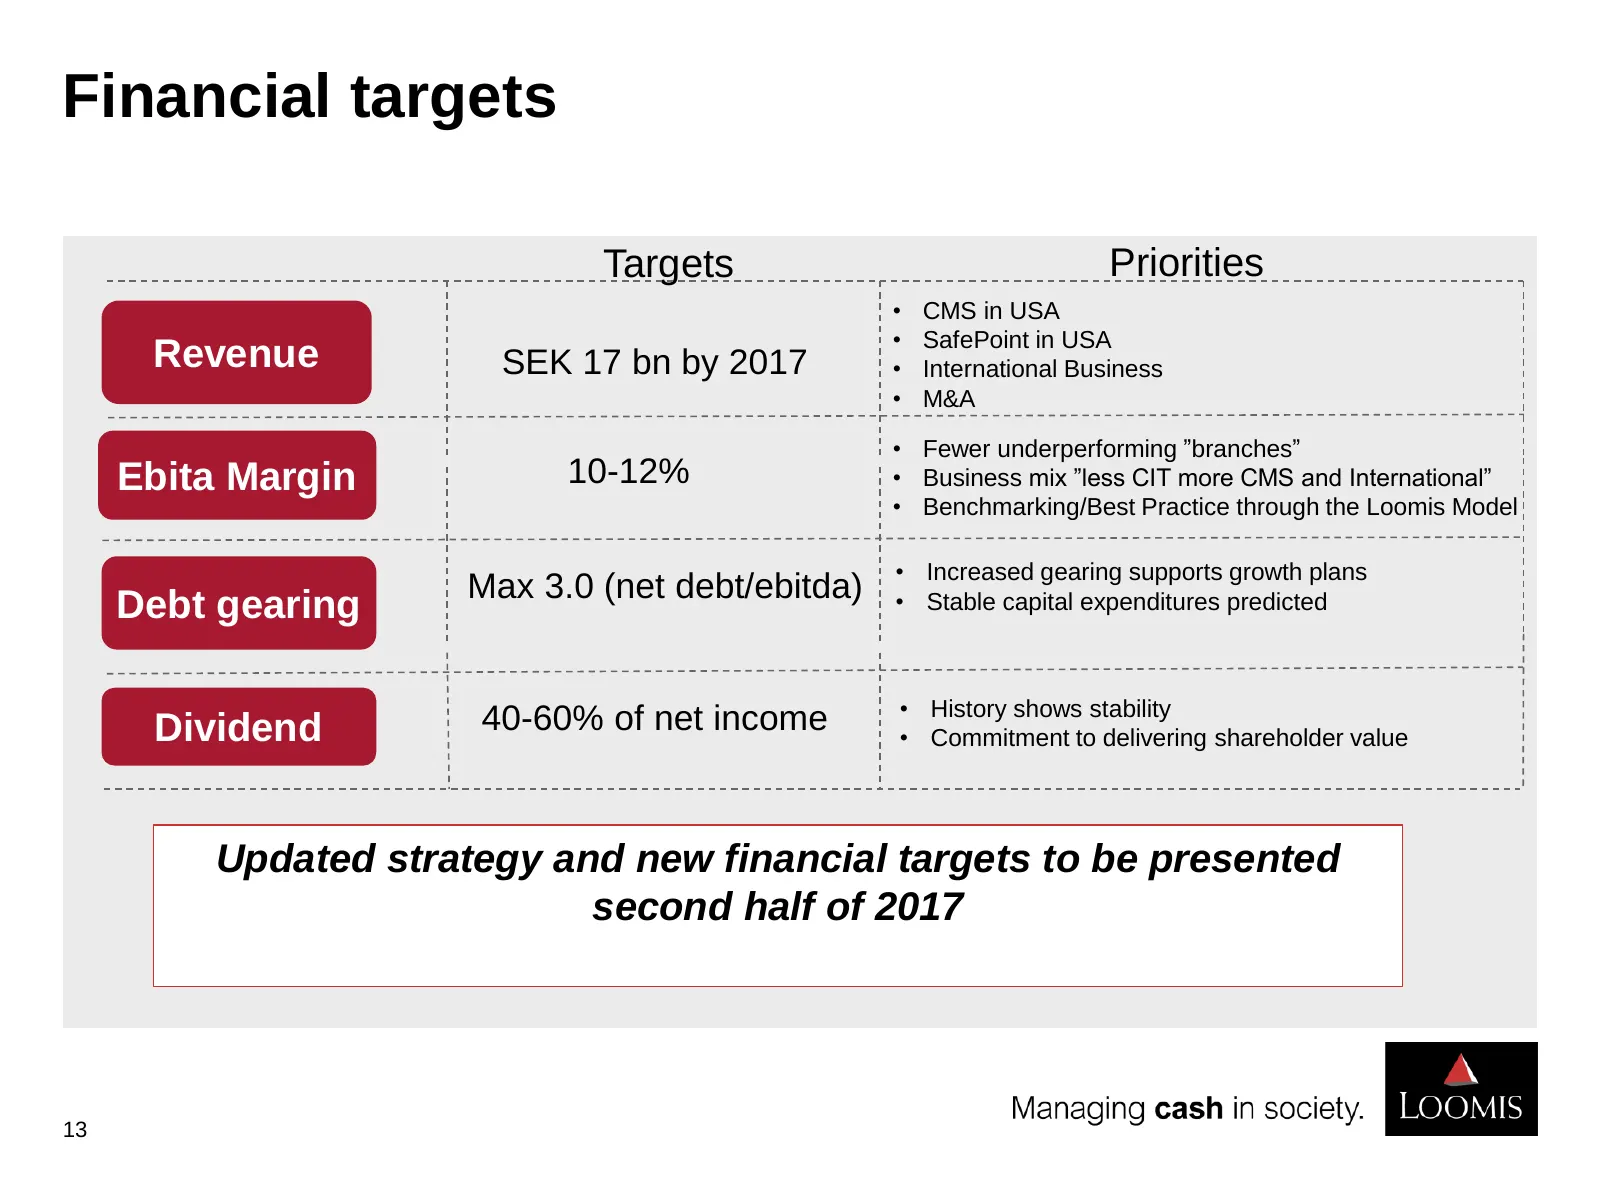
Financial targets Targets Priorities • CMS in USA • SafePoint in USA Revenue SEK 17 bn by 2017 • International Business • M&A • Fewer underperforming ”branches” Ebita Margin 10-12% • Business mix ”less CIT more CMS and International” • Benchmarking/Best Practice through the Loomis Model • Increased
Slide 14: Managing cash in society
14 N Managing cash in society. BGO
Source: Internet Archive copy of loomis.com
More decks from Loomis AB
 Q3 2026 Earnings Presentation11 slides · Oct 30, 2026
 Q2 2026 Earnings Presentation11 slides · Jul 24, 2026
 Q1 2026 Earnings Presentation13 slides · May 7, 2026
 Q4 2025 Earnings Presentation12 slides · Feb 4, 2026
 Q2 2025 Earnings Presentation10 slides · Jul 25, 2025
 Q1 2025 Earnings Presentation11 slides · May 7, 2025