Loomis AB · OMXSTO:LOOMIS
Loomis AB — Q2 2026 Earnings Presentation
11 slides from Loomis AB's earnings presentation, Jul 24, 2026
Slide 1: Quarter 2 2026
Quarter 2 2026 Aritz Larrea, President and CEO July 24, 2026
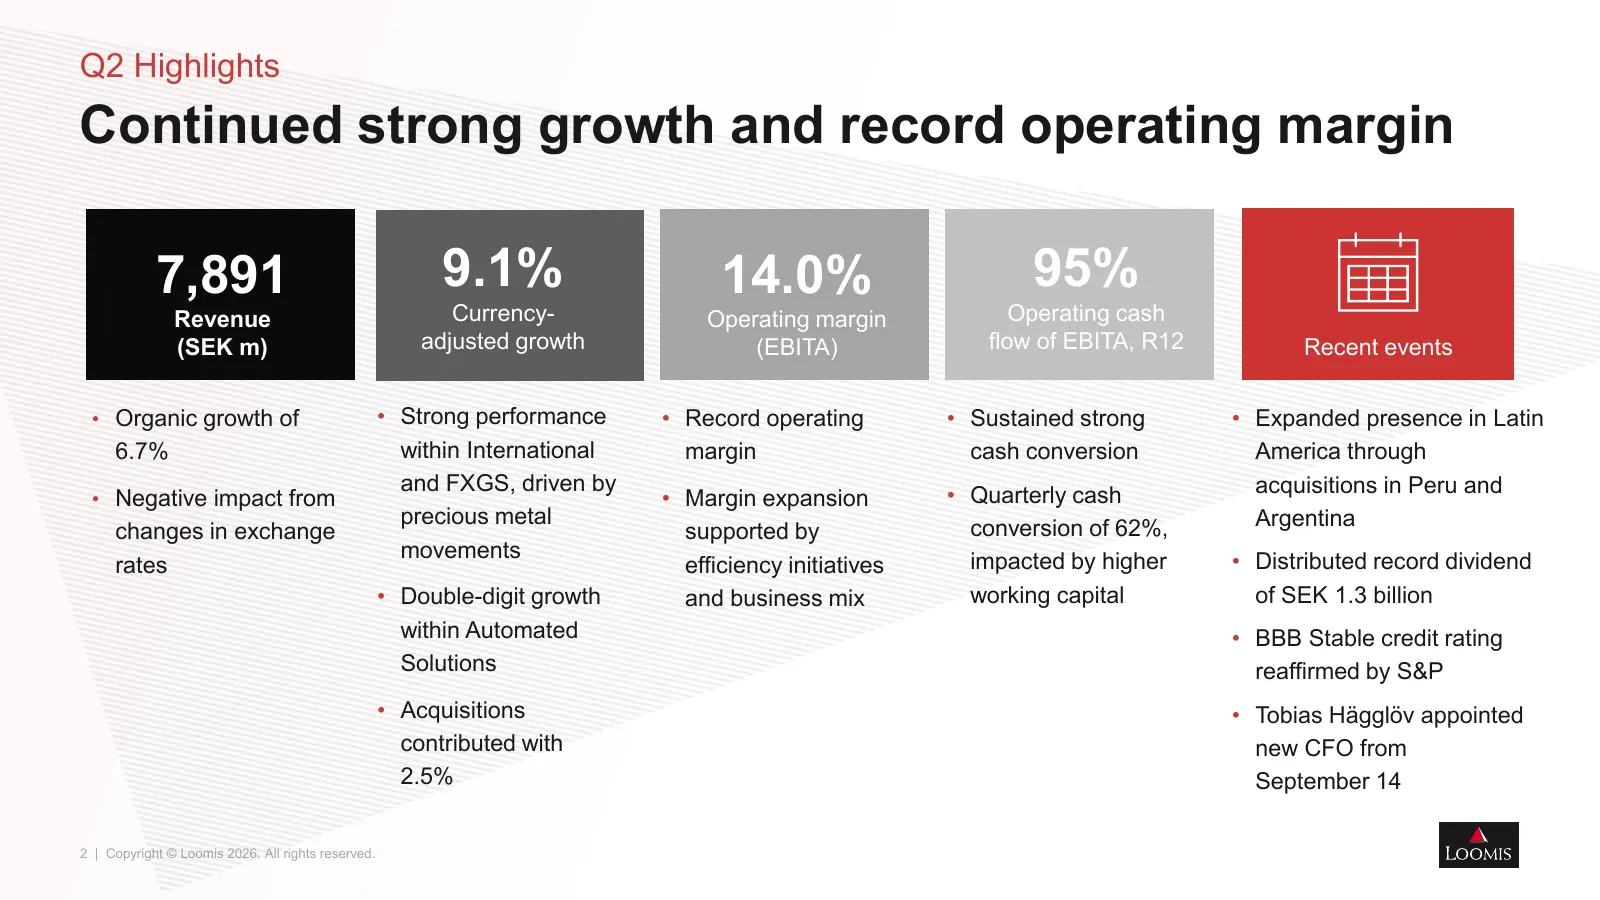
Slide 2: Q2 Highlights: Continued strong growth and record operating margin
Q2 Highlights Continued strong growth and record operating margin 7,891 9.1% 14.0% 95% Revenue Currency- Operating margin Operating cash (SEK m) adjusted growth (EBITA) flow of EBITA, R12 Recent events • Organic growth of • Strong performance • Record operating • Sustained strong • Expanded presence
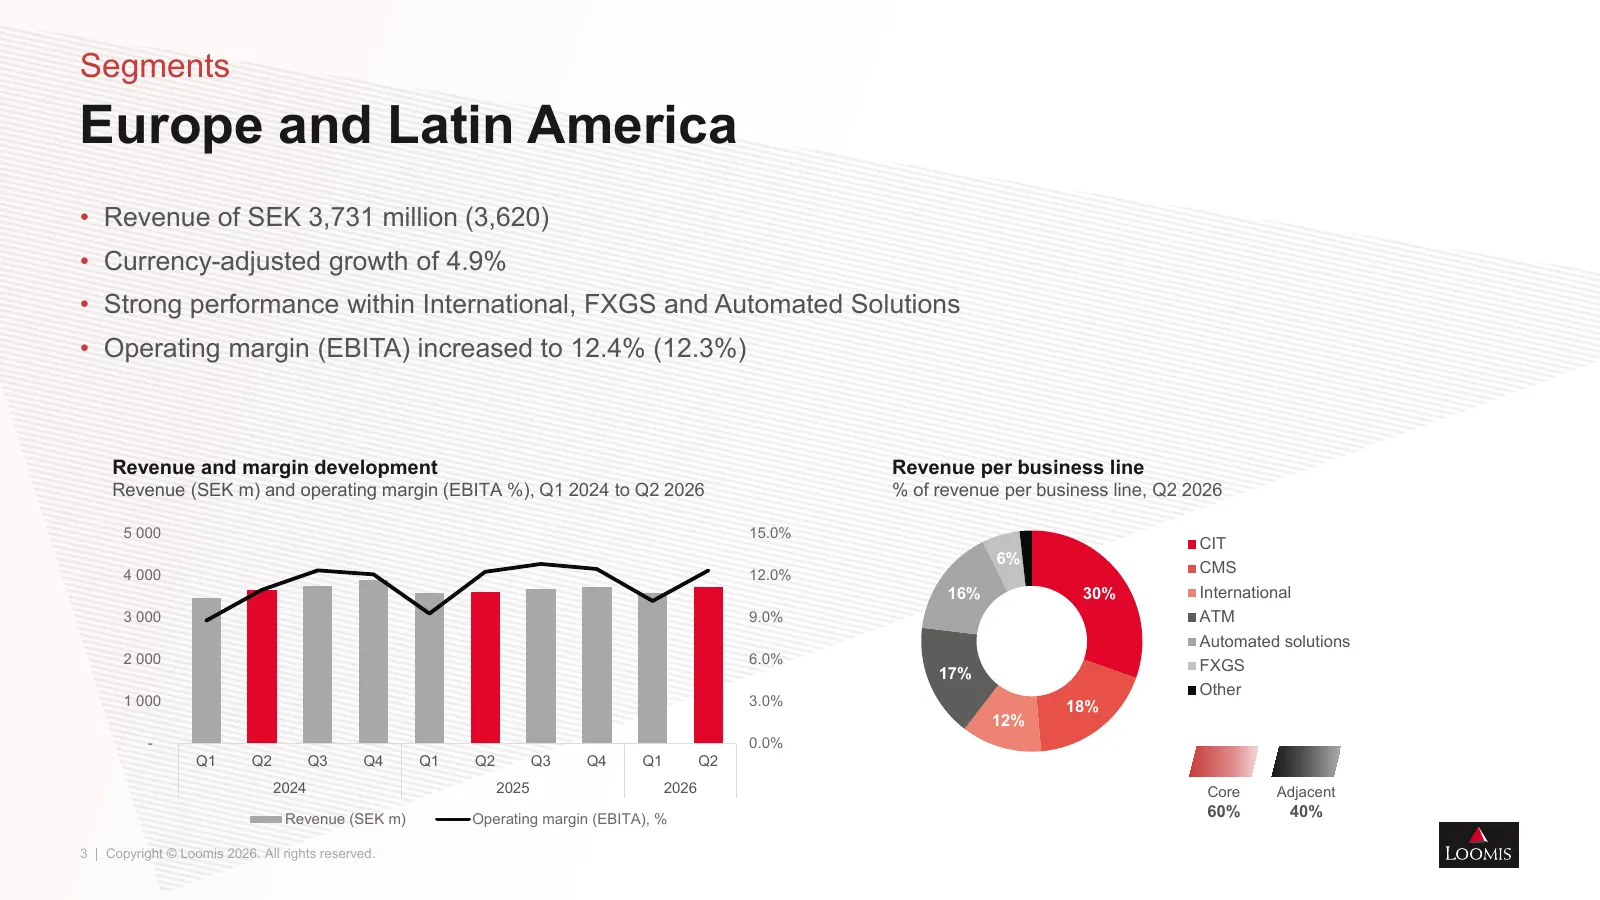
Slide 3: Segments: Europe and Latin America
Segments Europe and Latin America • Revenue of SEK 3,731 million (3,620) • Currency-adjusted growth of 4.9% • Strong performance within International, FXGS and Automated Solutions • Operating margin (EBITA) increased to 12.4% (12.3%) Revenue and margin development Revenue per business line Revenue (
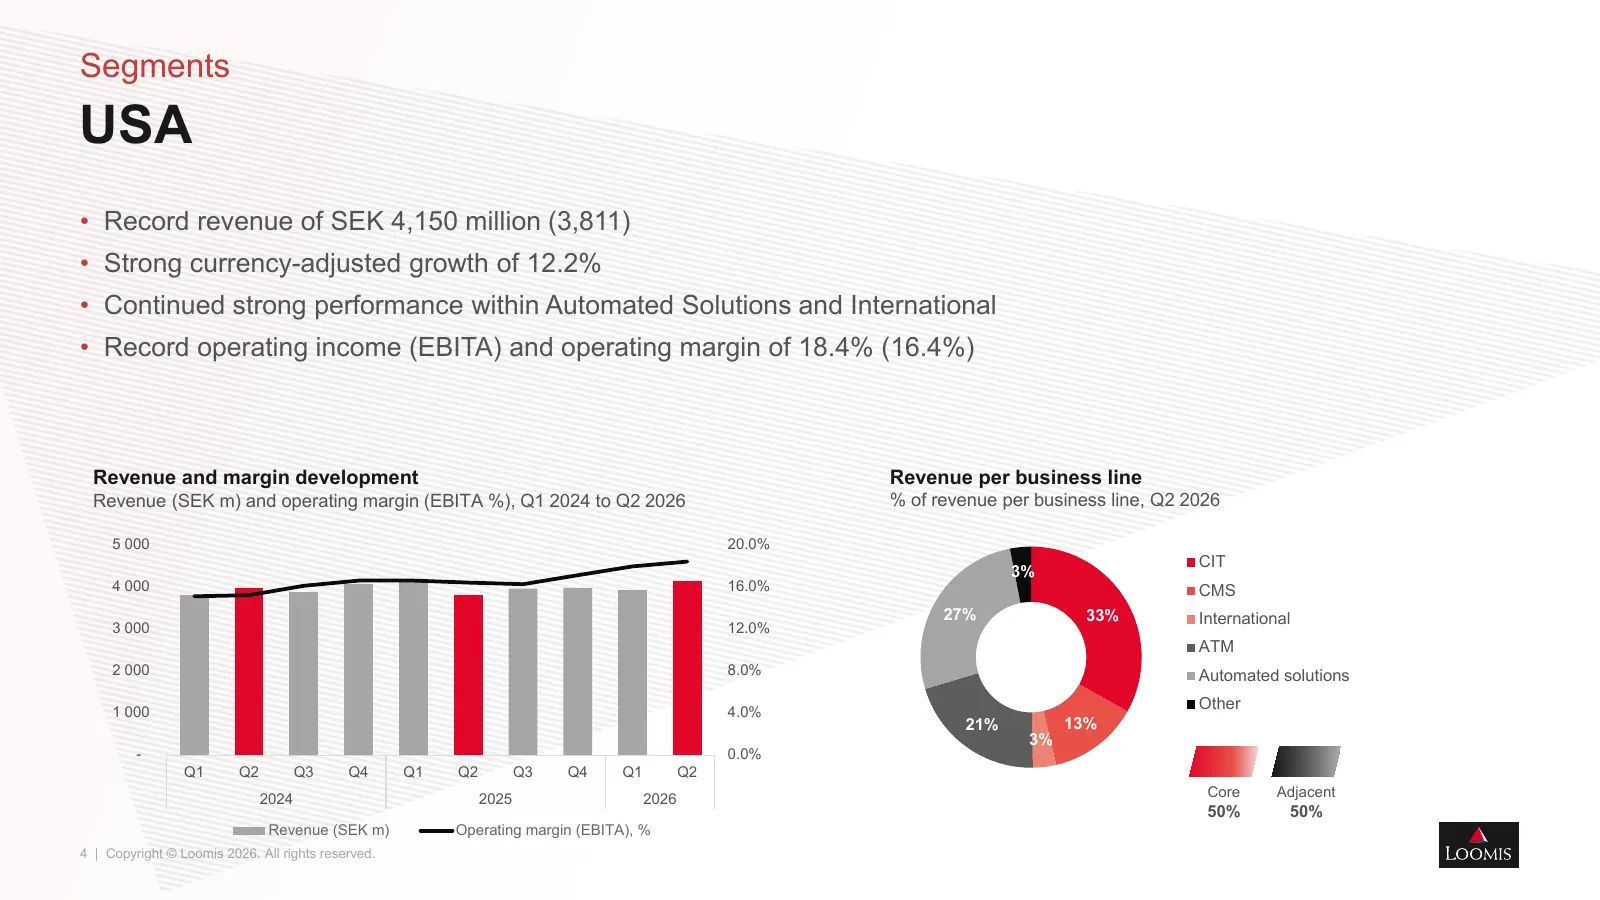
Slide 4: Segments: USA
Segments USA • Record revenue of SEK 4,150 million (3,811) • Strong currency-adjusted growth of 12.2% • Continued strong performance within Automated Solutions and International • Record operating income (EBITA) and operating margin of 18.4% (16.4%) Revenue and margin development Revenue per busines
Slide 5: Segments: SME/Pay
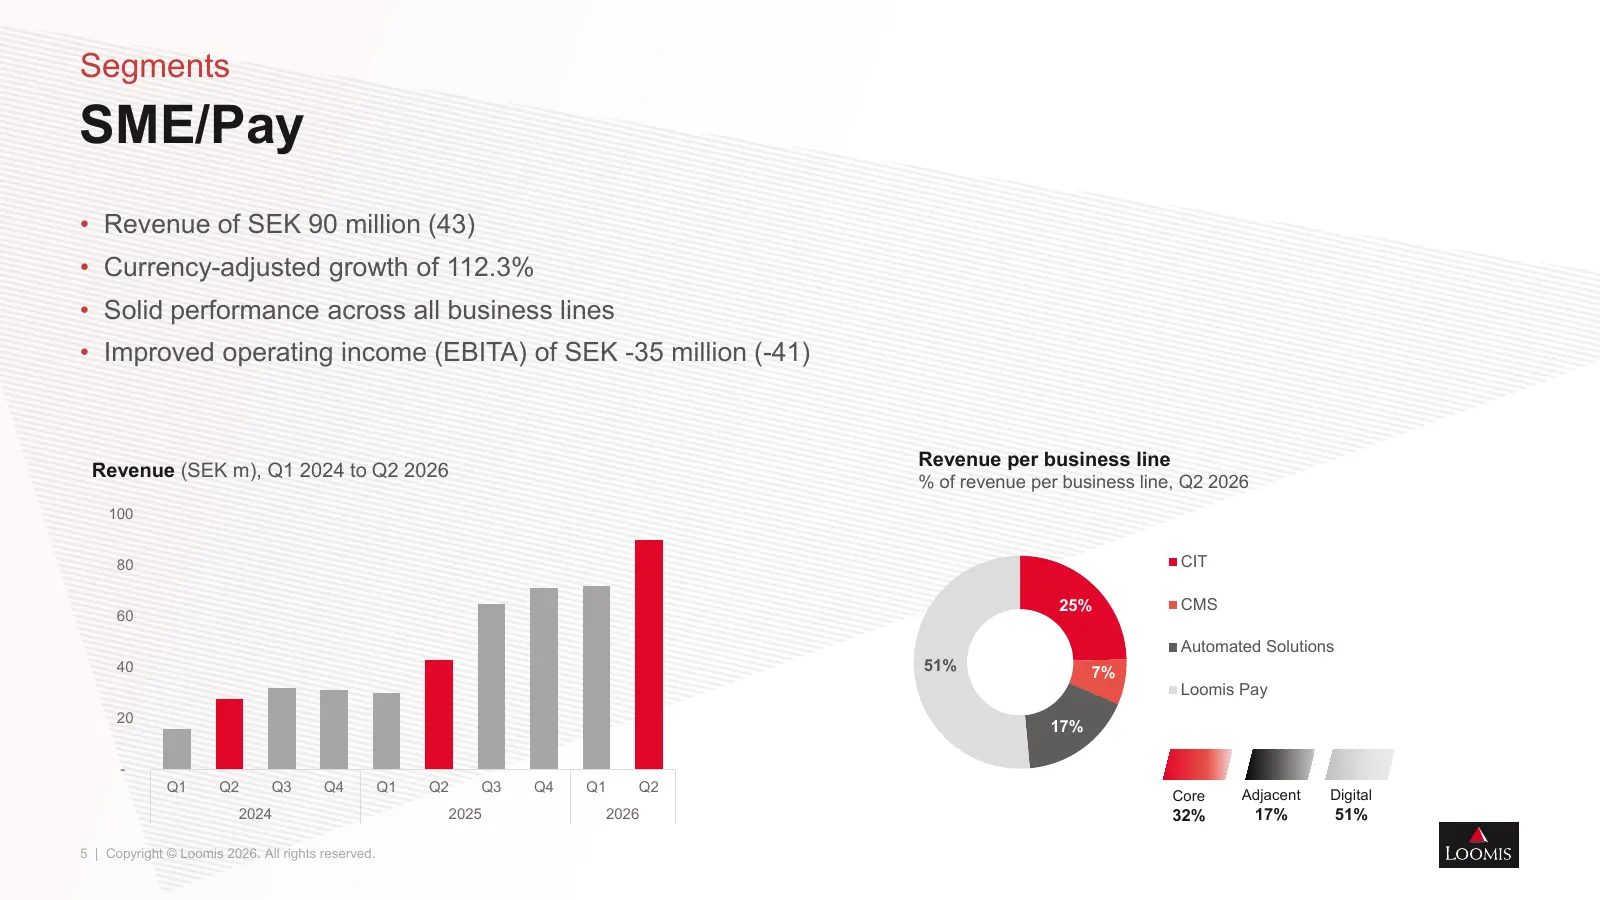
Segments SME/Pay • Revenue of SEK 90 million (43) • Currency-adjusted growth of 112.3% • Solid performance across all business lines • Improved operating income (EBITA) of SEK -35 million (-41) Revenue per business line Revenue (SEK m), Q1 2024 to Q2 2026 % of revenue per business line, Q2 2026 100
Slide 6: Advancing on our sustainability targets
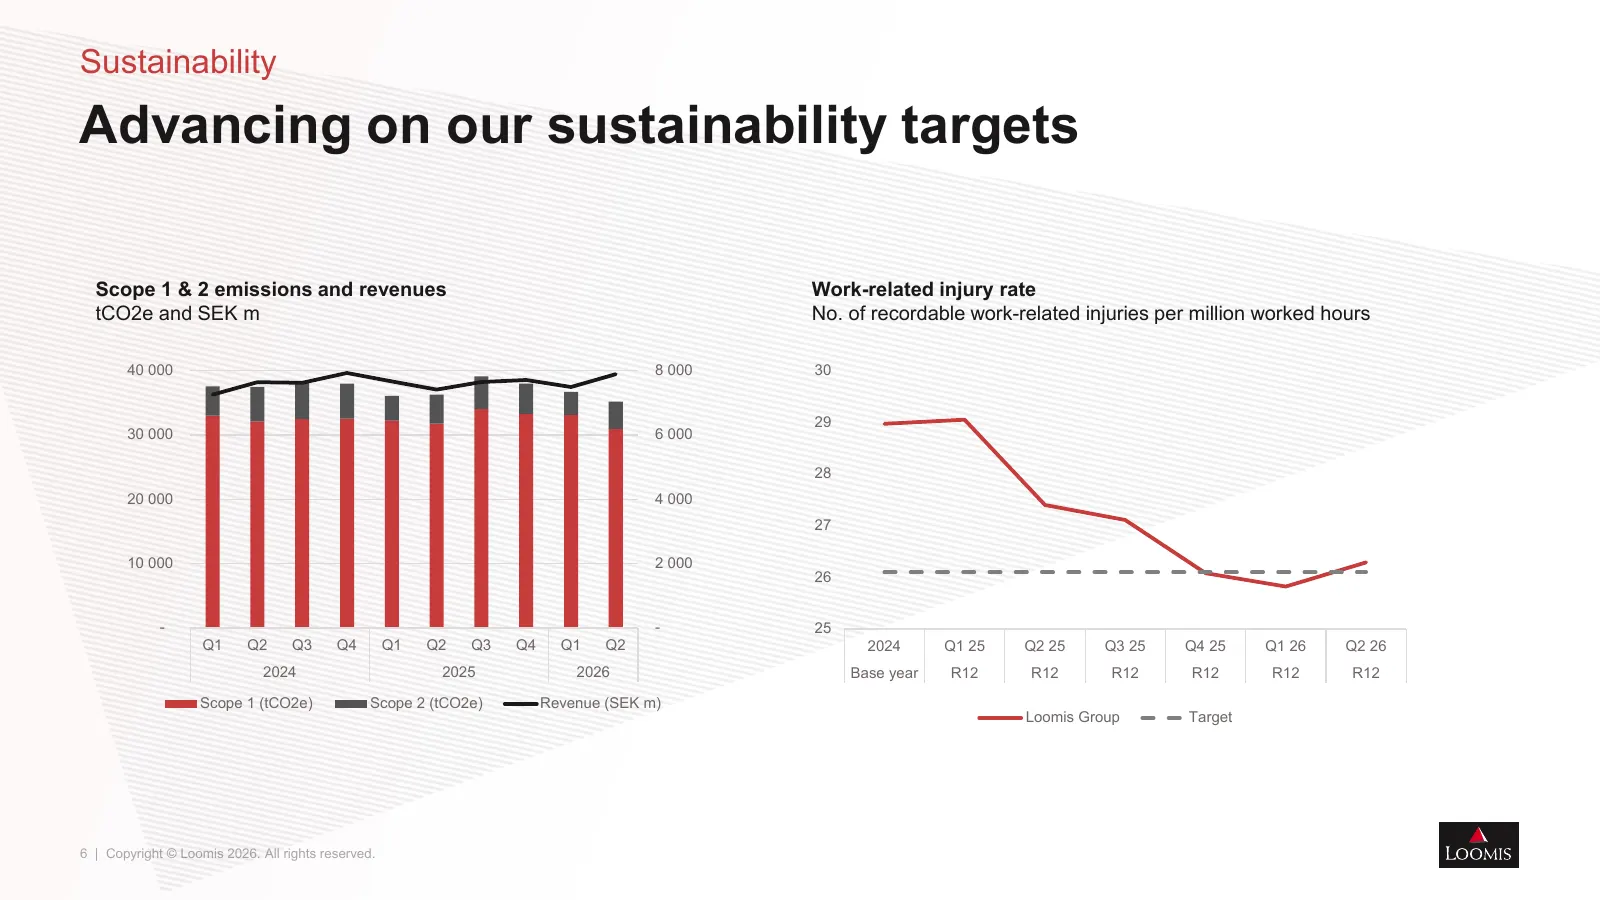
Sustainability Advancing on our sustainability targets Scope 1 & 2 emissions and revenues Work-related injury rate tCO2e and SEK m No. of recordable work-related injuries per million worked hours 40 000 8 000 30 29 30 000 6 000 28 20 000 4 000 27 10 000 2 000 26 - - 25 Q1 Q2 Q3 Q4 Q1 Q2 Q3 Q4 Q1 Q2
Slide 7: Income Statement
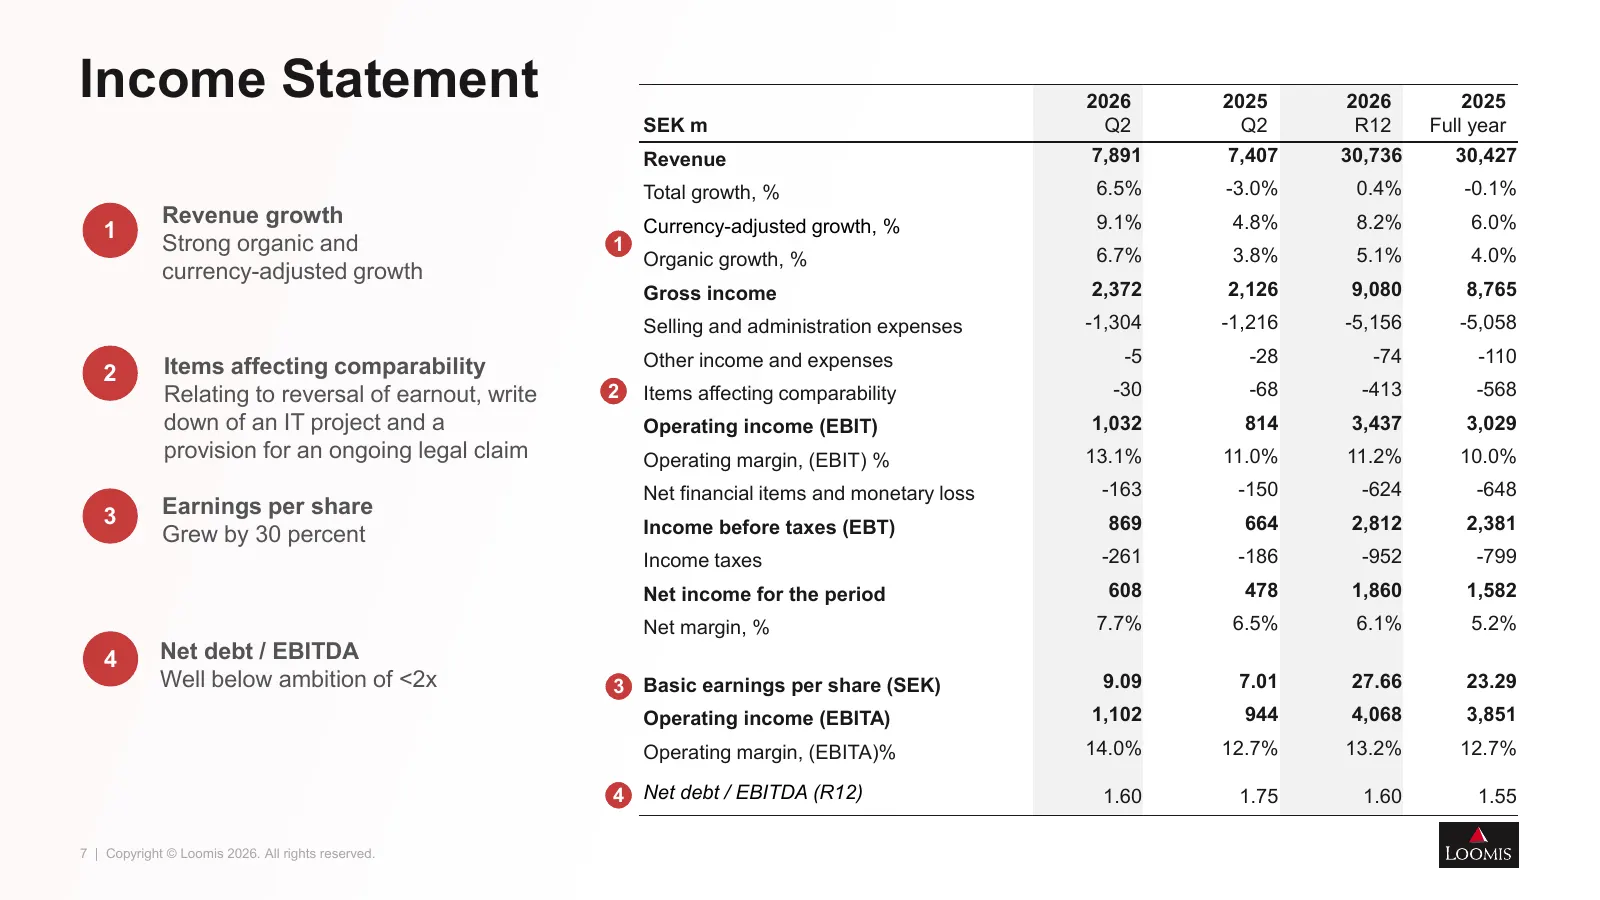
Income Statement 2026 2025 2026 2025 SEK m Q2 Q2 R12 Full year Revenue 7,891 7,407 30,736 30,427 Total growth, % 6.5% -3.0% 0.4% -0.1% Revenue growth Currency-adjusted growth, % 9.1% 4.8% 8.2% 6.0% 1 Strong organic and 1 6.7% 3.8% 5.1% 4.0% Organic growth, % currency-adjusted growth Gross income 2,3
Slide 8: Record revenue and operating margin
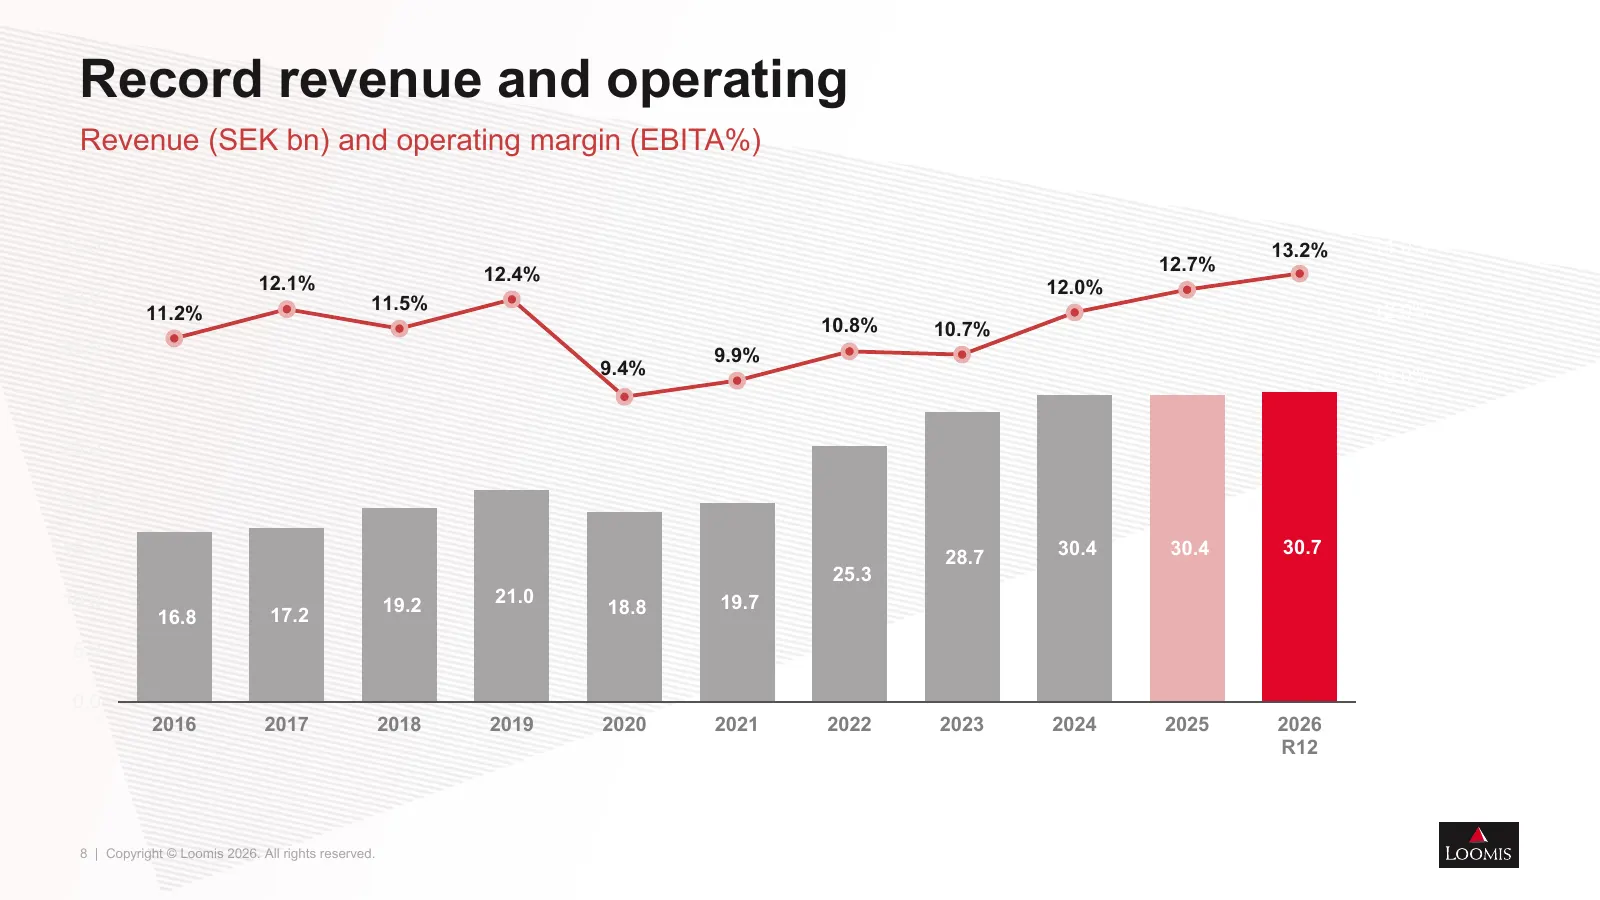
Record revenue and operating Revenue (SEK bn) and operating margin (EBITA%) 45.0 13.2% 14.0% 12.4% 12.7% 12.1% 12.0% 40.0 11.5% 11.2% 12.0% 10.8% 10.7% 35.0 9.9% 9.4% 10.0% 30.0 25.0 8.0% 20.0 6.0% 15.0 30.4 30.4 30.7 28.7 25.3 4.0% 10.0 19.2 21.0 19.7 17.2 18.8 16.8 2.0% 5.0 0.0 0.0% 2016 2017 2018

Slide 9: Q&A
Q&A 9 | Copyright © Loomis 2026. All rights reserved.

Slide 10: www.loomis.com
www.loomis.com
Slide 11: Disclaimer: Forward looking statements
Disclaimer ”Forward looking statements” This presentation contains, or may be deemed to contain, forward-looking statements. These statements relate to future events or our future financial performance, including, but not limited to, strategic plans, potential growth, planned operational changes, ex
Source: company website
More decks from Loomis AB
 Q3 2026 Earnings Presentation11 slides · Oct 30, 2026
 Q1 2026 Earnings Presentation13 slides · May 7, 2026
 Q4 2025 Earnings Presentation12 slides · Feb 4, 2026
 Q2 2025 Earnings Presentation10 slides · Jul 25, 2025
 Q1 2025 Earnings Presentation11 slides · May 7, 2025
 Q4 2024 Earnings Presentation13 slides · Feb 5, 2025