Railamerica — Q1 2010 Earnings Presentation
23 slides from Railamerica's earnings presentation, Apr 29, 2010
Slide 1: RailAmerica, Inc. First Quarter 2010 Earnings Conference Call
RailAmerica, Inc. First Quarter 2010 Earnings Conference Call April 29, 2010
Slide 2: Forward-Looking Statements
2 Certain items in this presentation and other information we provide from time to time may constitute forward-looking statements within the meaning of the Private Securities Litigation Reform Act of 1995 including, but not necessarily limited to, statements relating to future events and financial p
Slide 3: Executive Summary
3 Executive Summary John Giles, President and Chief Executive Officer
Slide 4: First Quarter 2010 Overview
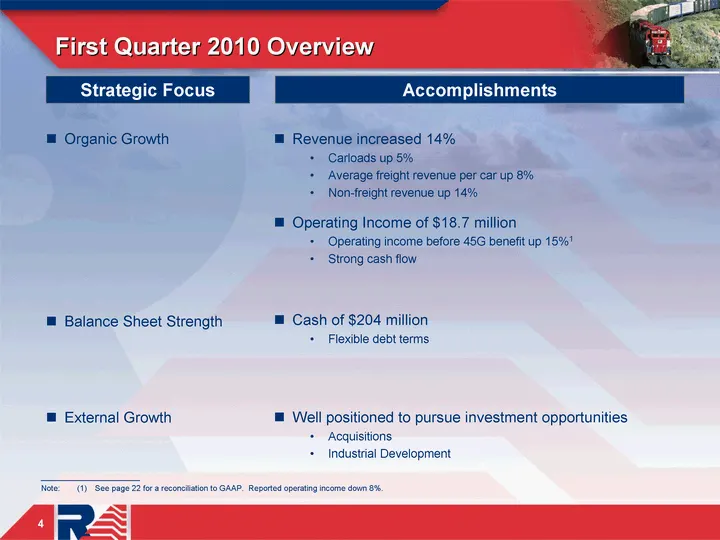
First Quarter 2010 Overview 4 Strategic Focus Accomplishments Organic Growth Balance Sheet Strength External Growth Revenue increased 14% Carloads up 5% Average freight revenue per car up 8% Non-freight revenue up 14% Operating Income of $18.7 million Operating income before 45G benefit up 15%1 Stro
Slide 5: First Quarter 2010 Revenue
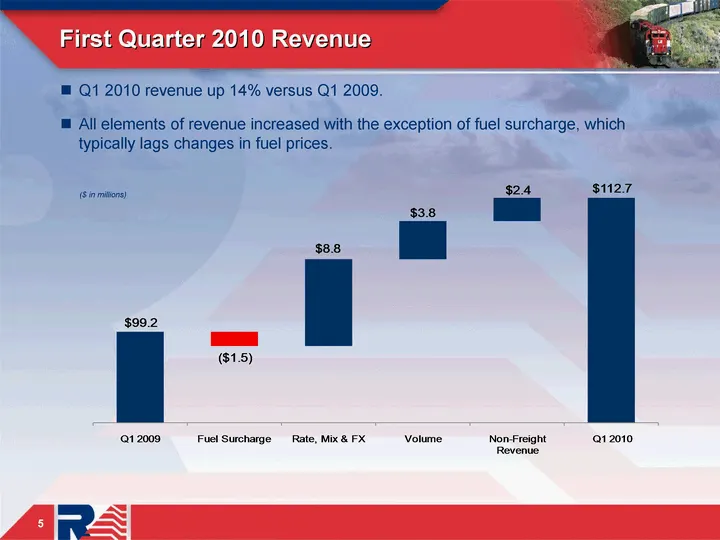
First Quarter 2010 Revenue 5 Q1 2010 revenue up 14% versus Q1 2009. All elements of revenue increased with the exception of fuel surcharge, which typically lags changes in fuel prices. ($ in millions)
Slide 6: First Quarter 2010 Carloads
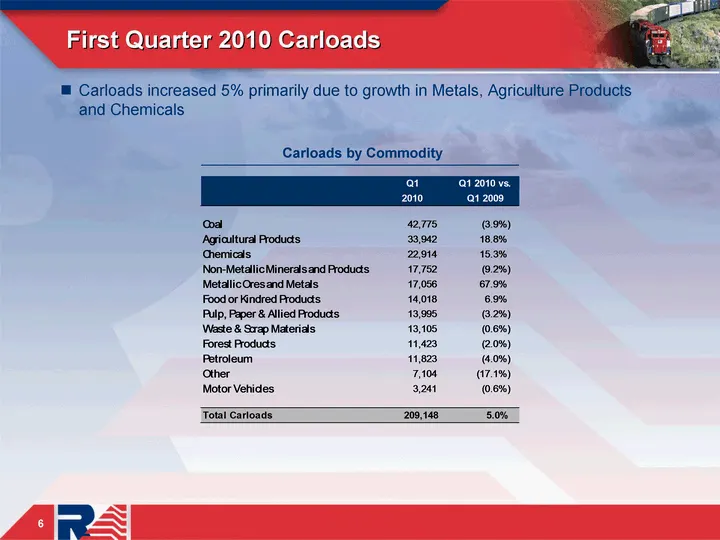
6 First Quarter 2010 Carloads 6 Carloads by Commodity Carloads increased 5% primarily due to growth in Metals, Agriculture Products and Chemicals
Slide 7: Average Freight Revenue Per Carload
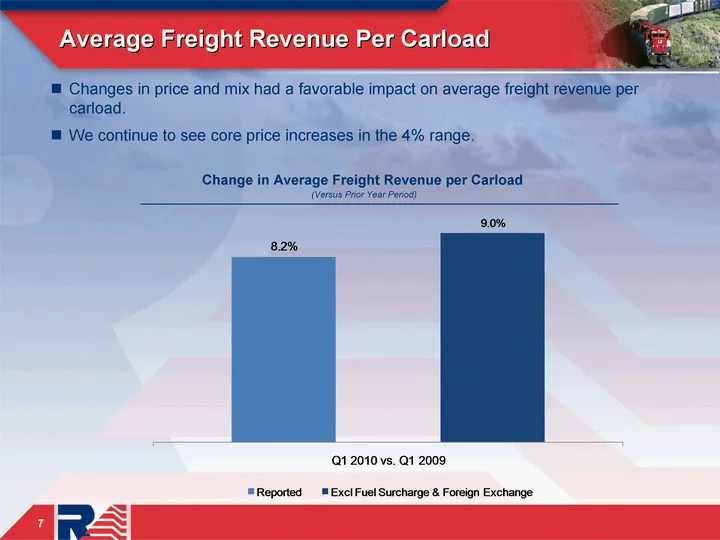
Average Freight Revenue Per Carload 7 Change in Average Freight Revenue per Carload (Versus Prior Year Period) Changes in price and mix had a favorable impact on average freight revenue per carload. We continue to see core price increases in the 4% range.
Slide 8: First Quarter 2010 Non-Freight Revenue
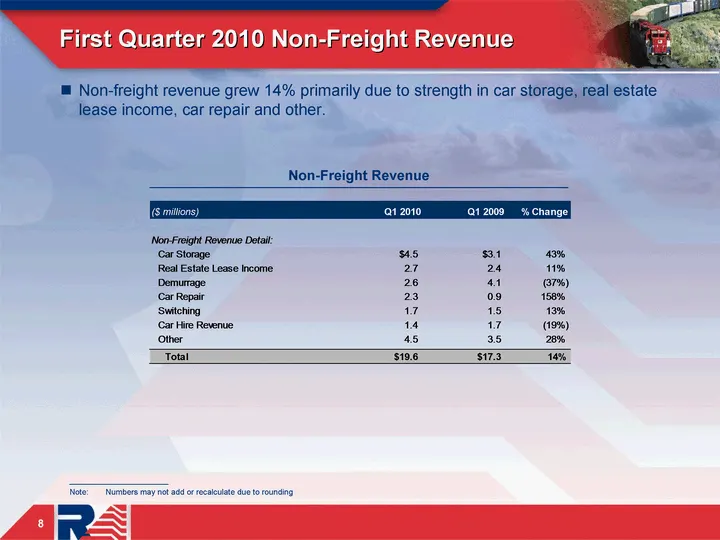
First Quarter 2010 Non-Freight Revenue 8 Non-Freight Revenue ______________________ Note: Numbers may not add or recalculate due to rounding Non-freight revenue grew 14% primarily due to strength in car storage, real estate lease income, car repair and other.
Slide 9: First Quarter Operating Ratio
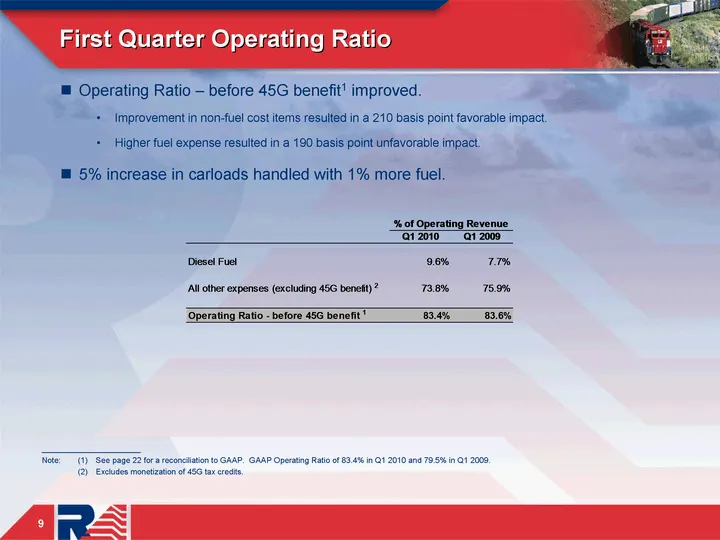
First Quarter Operating Ratio 9 ______________________ Note: (1) See page 22 for a reconciliation to GAAP. GAAP Operating Ratio of 83.4% in Q1 2010 and 79.5% in Q1 2009. (2) Excludes monetization of 45G tax credits. Operating Ratio - before 45G benefit1 improved. Improvement in non-fuel cost items r
Slide 10: Productivity Q1 2009 versus Q1 2010
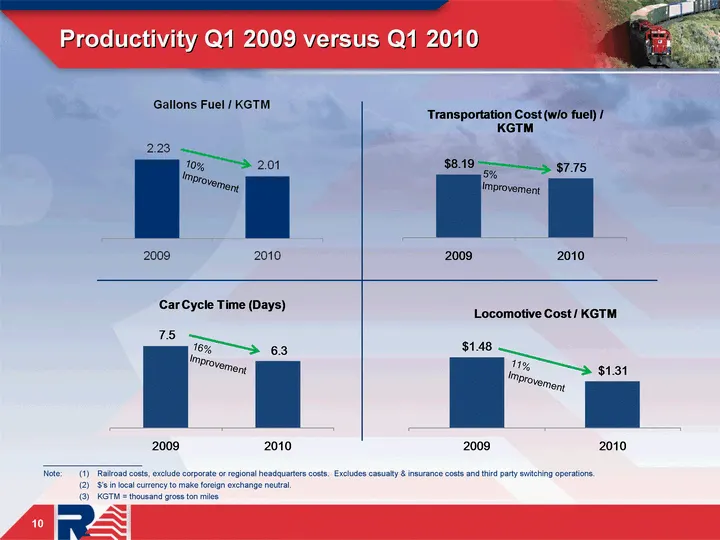
Productivity Q1 2009 versus Q1 2010 10 10% Improvement 5% Improvement 16% Improvement 11% Improvement ______________________ Note: (1) Railroad costs, exclude corporate or regional headquarters costs. Excludes casualty & insurance costs and third party switching operations. (2) $'s in local currency
Slide 11: Safety Performance
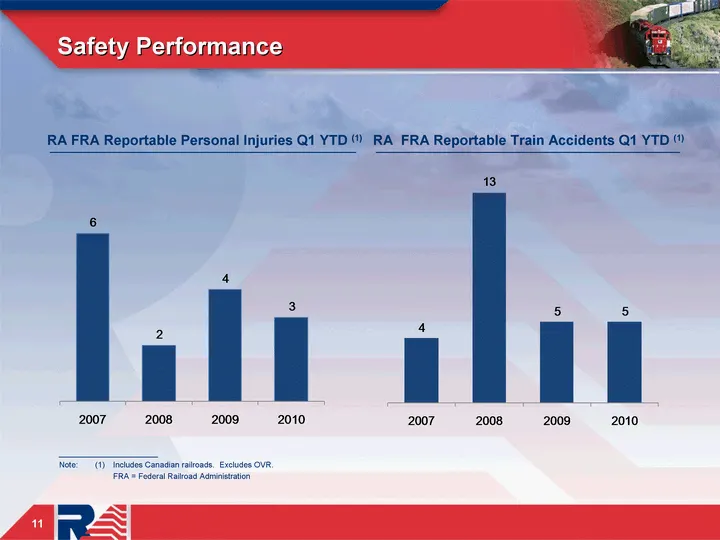
Safety Performance 11 RA FRA Reportable Personal Injuries Q1 YTD (1) RA FRA Reportable Train Accidents Q1 YTD (1) ______________________ Note: (1) Includes Canadian railroads. Excludes OVR. FRA = Federal Railroad Administration
Slide 12: 2010 Agenda
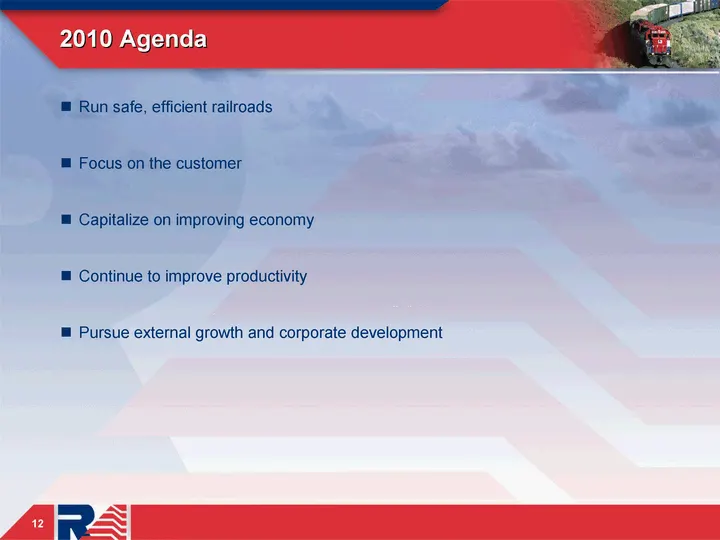
2010 Agenda 12 Run safe, efficient railroads Focus on the customer Capitalize on improving economy Continue to improve productivity Pursue external growth and corporate development
Slide 13: Q1 2010 Financial Review
13 First Quarter Q1 2010 Financial Review Clyde Preslar, Chief Financial Officer
Slide 14: First Quarter 2010 Results Compared to Prior Year
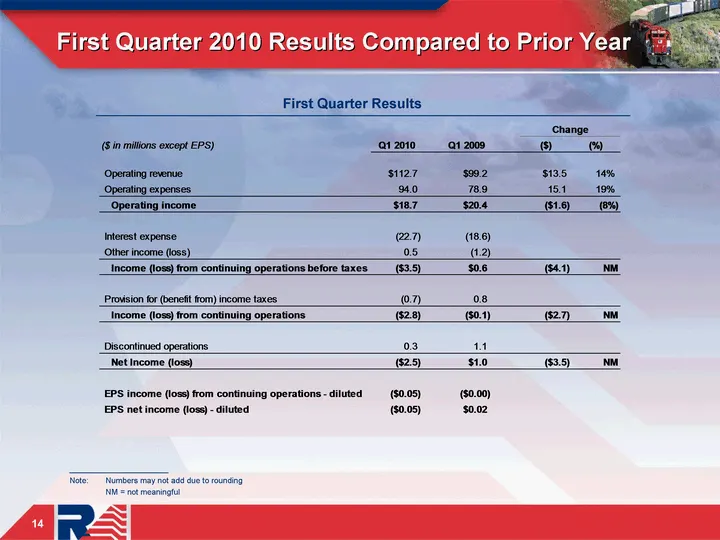
14 First Quarter 2010 Results Compared to Prior Year 14 First Quarter Results ______________________ Note: Numbers may not add due to rounding NM = not meaningful
Slide 15: First Quarter 2010 Selected Items
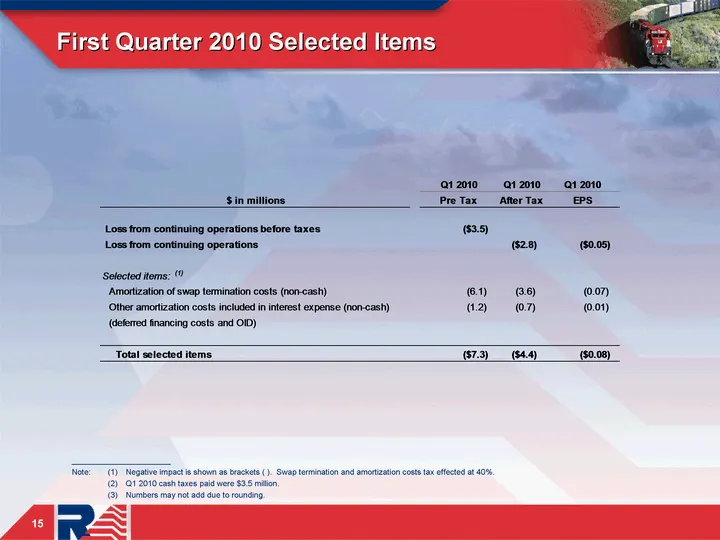
15 First Quarter 2010 Selected Items 15 ______________________ Note: (1) Negative impact is shown as brackets ( ). Swap termination and amortization costs tax effected at 40%. (2) Q1 2010 cash taxes paid were $3.5 million. (3) Numbers may not add due to rounding.
Slide 16: First Quarter 2010 Detailed Results Compared to Prior Year
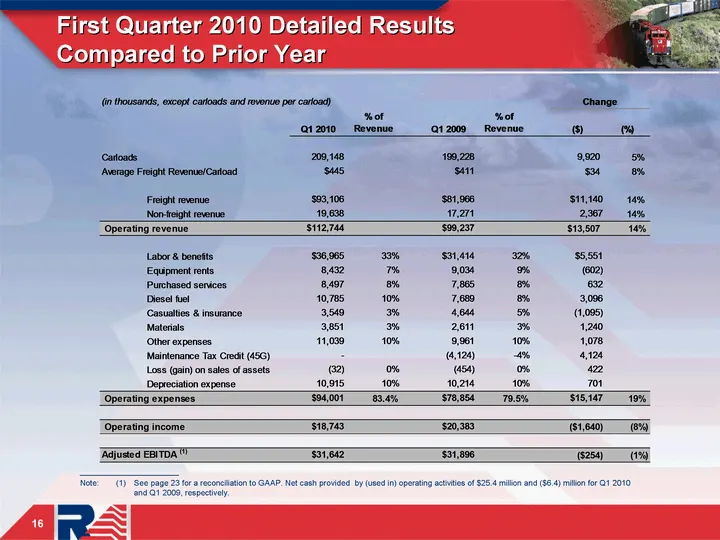
16 16 First Quarter 2010 Detailed Results Compared to Prior Year ______________________ Note: (1) See page 23 for a reconciliation to GAAP. Net cash provided by (used in) operating activities of $25.4 million and ($6.4) million for Q1 2010 and Q1 2009, respectively.
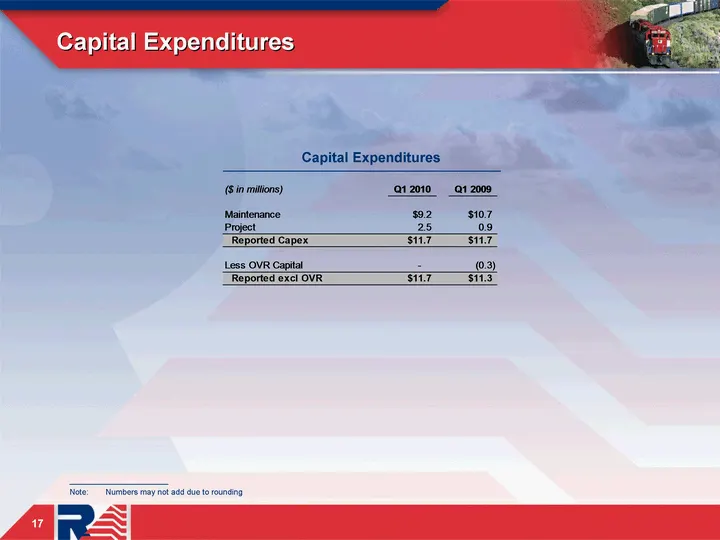
Slide 17: Capital Expenditures
17 Capital Expenditures 17 Capital Expenditures ______________________ Note: Numbers may not add due to rounding
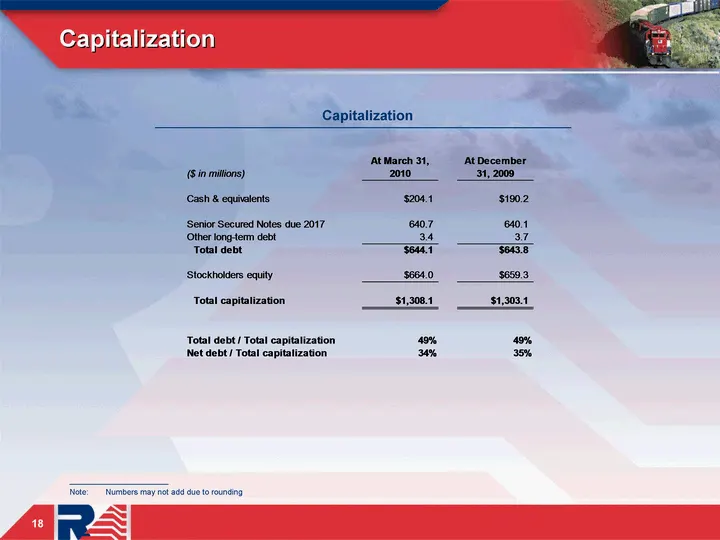
Slide 18: Capitalization
Capitalization 18 Capitalization ______________________ Note: Numbers may not add due to rounding
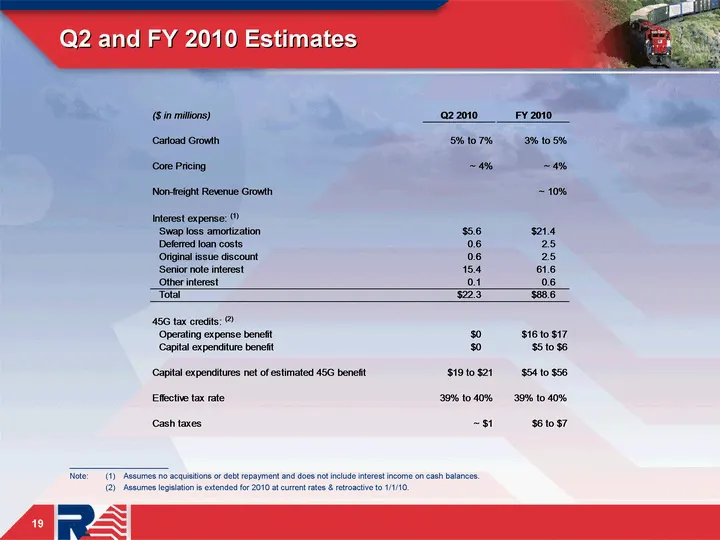
Slide 19: Q2 and FY 2010 Estimates
Q2 and FY 2010 Estimates 19 ______________________ Note: (1) Assumes no acquisitions or debt repayment and does not include interest income on cash balances. (2) Assumes legislation is extended for 2010 at current rates & retroactive to 1/1/10.

Slide 20: 20
20
Slide 21: Appendix
21 Appendix
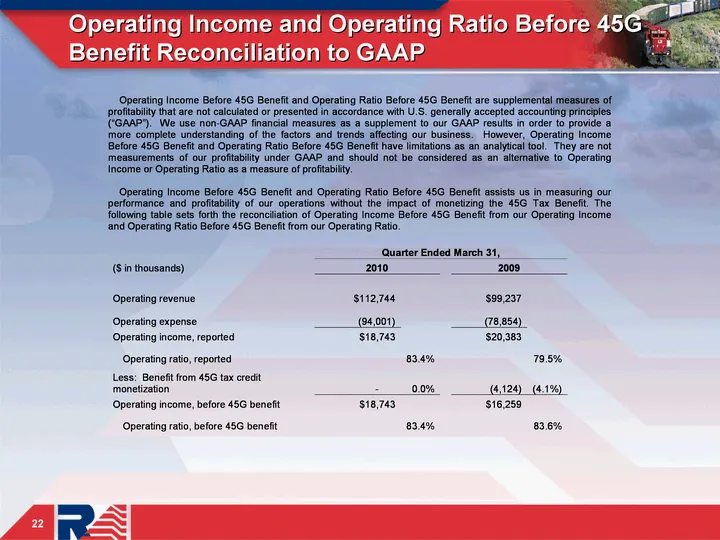
Slide 22: Operating Income and Operating Ratio Before 45G Benefit Reconciliation to GAAP
22 Operating Income and Operating Ratio Before 45G Benefit Reconciliation to GAAP 22
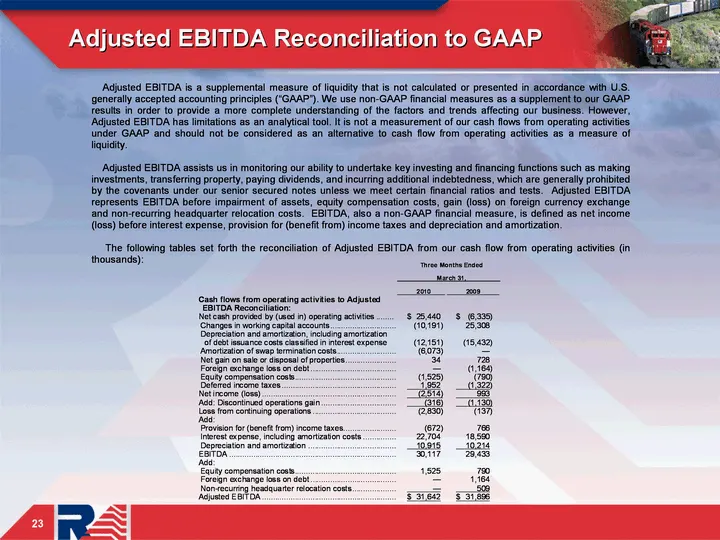
Slide 23: Adjusted EBITDA Reconciliation to GAAP
23 Adjusted EBITDA Reconciliation to GAAP 23
Source: SEC EDGAR · 8-K filed Apr 29, 2010
More decks from Railamerica Inc
 Q2 2012 Earnings Presentation25 slides · Jul 25, 2012
 Q1 2012 Earnings Presentation29 slides · Apr 26, 2012
 Q4 2011 Earnings Presentation33 slides · Feb 9, 2012
 Q3 2011 Earnings Presentation28 slides · Oct 26, 2011
 Q2 2011 Earnings Presentation27 slides · Jul 28, 2011
 Q1 2011 Earnings Presentation28 slides · Apr 28, 2011