CyberAgent Incorporated · TSE:4751
CyberAgent — Q3 FY2010 Earnings Presentation
49 slides from CyberAgent's earnings presentation, August 2010
Slide 1: Table of Contents
0 Table of Contents 1 Overview of Consolidated Financial Results 2 Consolidated Business Forecast 3 Major Business 4 Ameba Business 5 Summary 1
Slide 2: Overview of Consolidated Financial Results for 3Q
1 Overview of Consolidated Financial Results Overview of Consolidated Financial Results for 3Q (April-June 2010) 2
Slide 3: Third Quarter Highlights (Apr. – Jun. 2010)
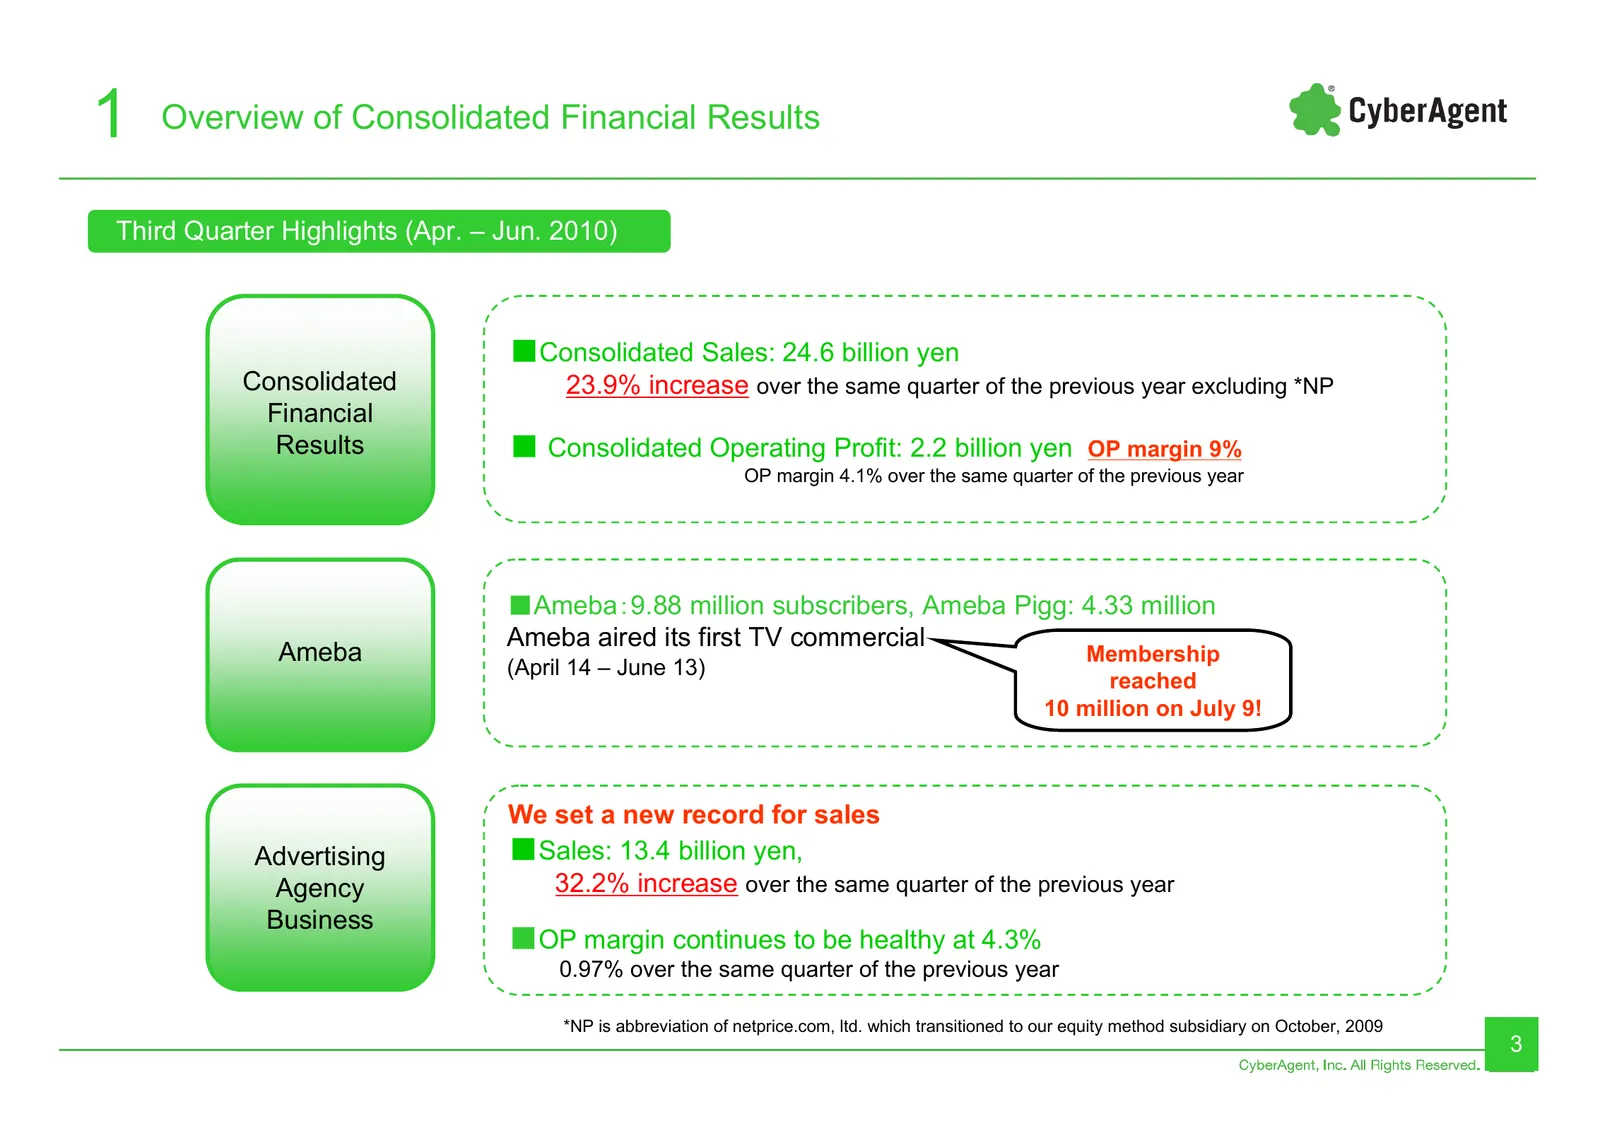
1 Overview of Consolidated Financial Results Third Quarter Highlights (Apr. – Jun. 2010) ■Consolidated Sales: 24.6 billion yen Consolidated 23.9% increase over the same quarter of the previous year excluding *NP Financial Results ■ Consolidated Operating Profit: 2.2 billion yen OP margin 9% OP margi
Slide 4: Quarterly Consolidated Sales
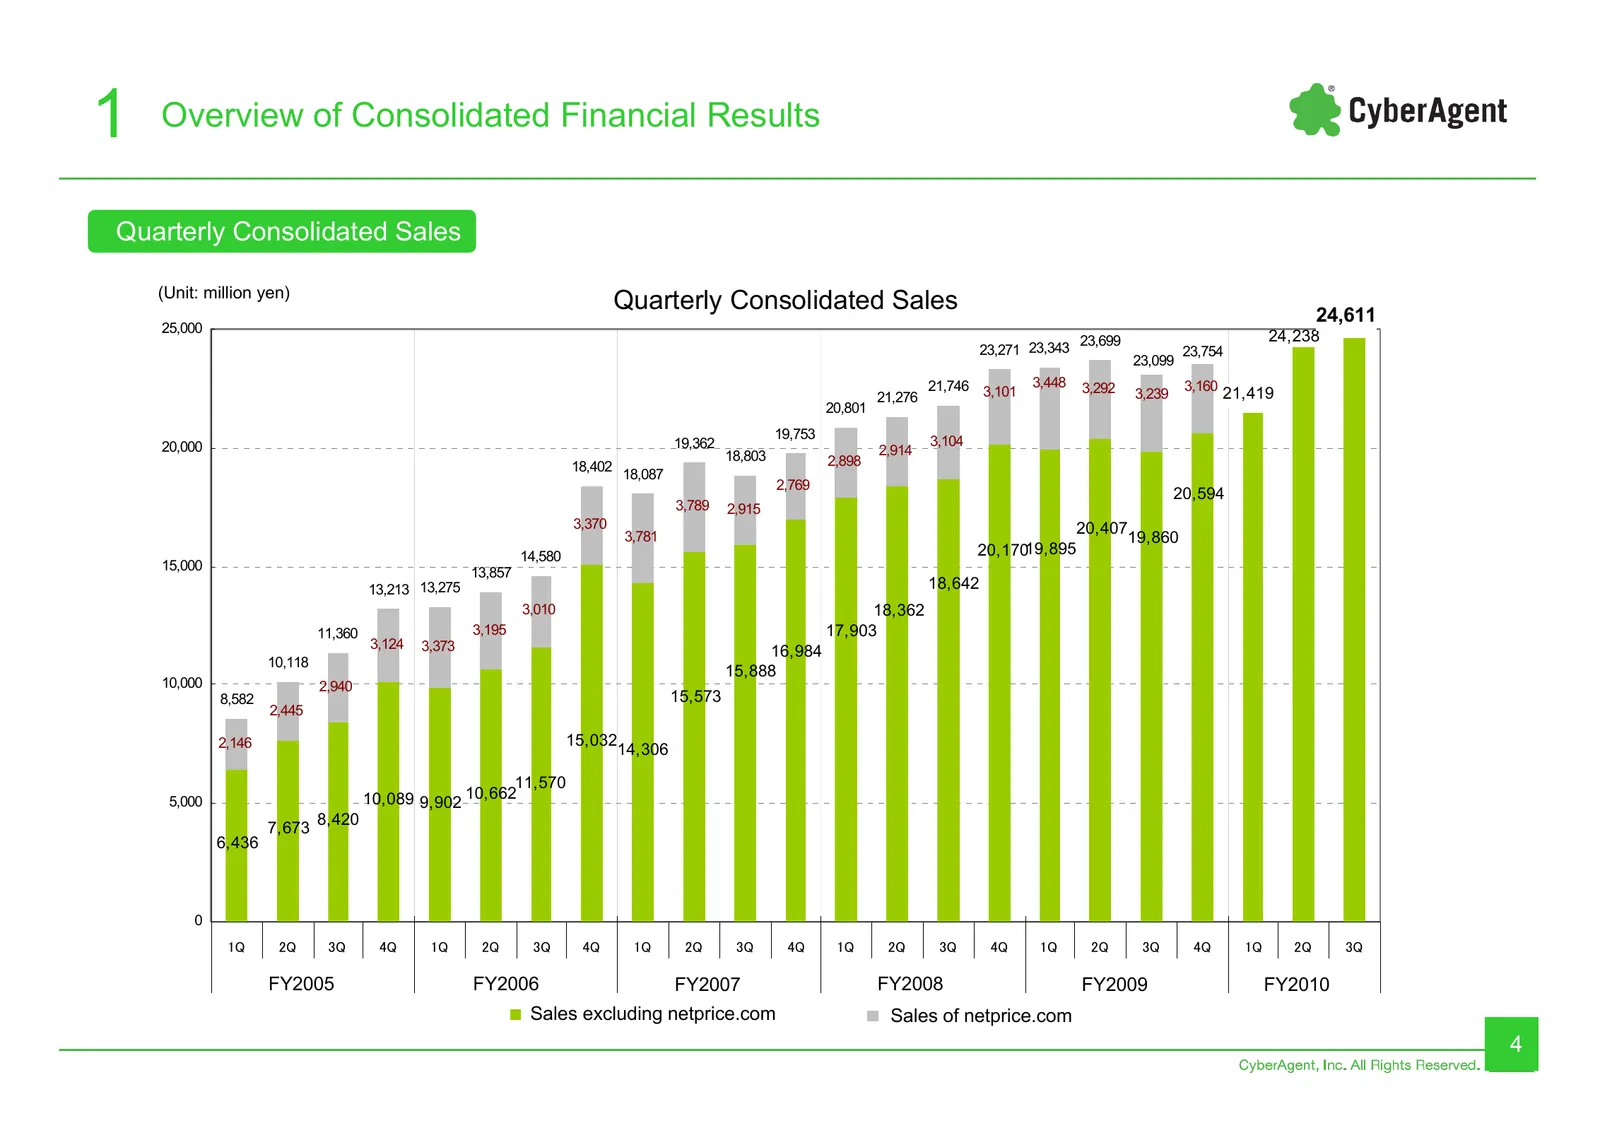
1 Overview of Consolidated Financial Results Quarterly Consolidated Sales (Unit: million yen) Quarterly Consolidated Sales 24,611 25,000 24,238 23,271 23,343 23,699 23,754 23,099 21,746 3,101 3,448 3,292 3,160 21,419 21,276 3,239 20,801 19,753 3,104 20,000 19,362 2,914 18,803 2,898 18,402 18,087 2,7
Slide 5: Consolidated PL
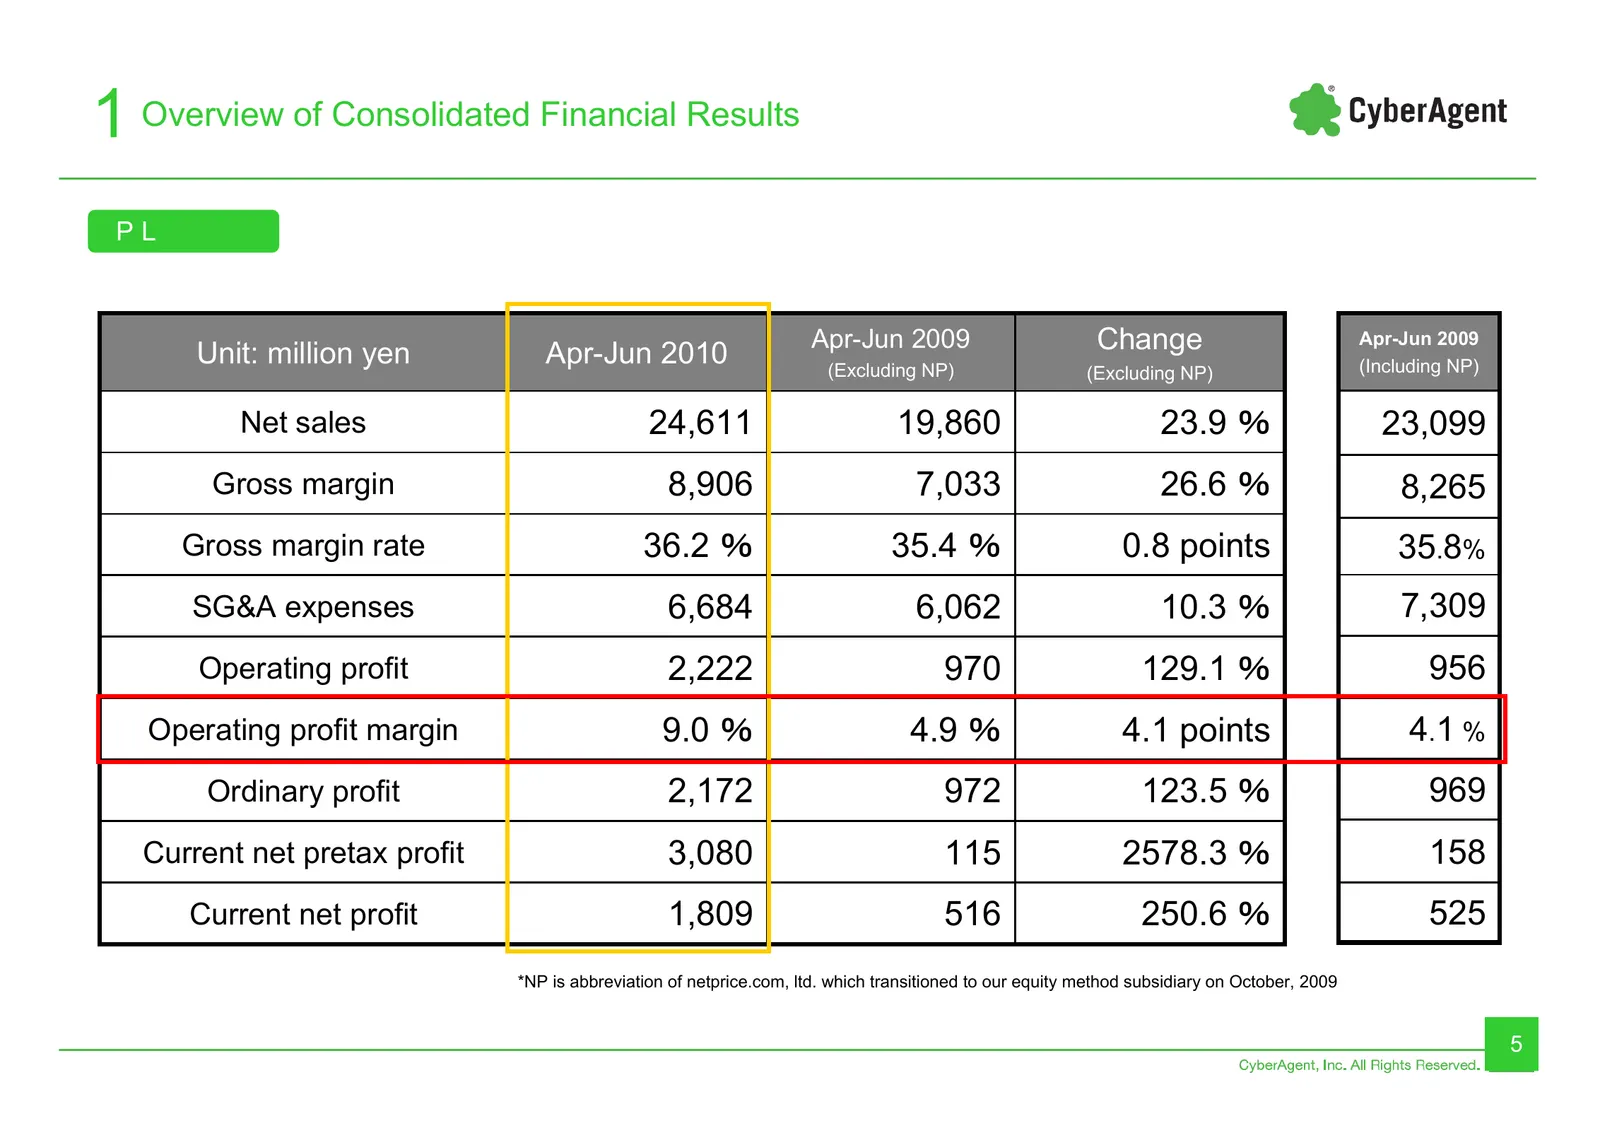
1 Overview of Consolidated Financial Results PL Unit: million yen Apr-Jun 2010 Apr-Jun 2009 Change Apr-Jun 2009 (Excluding NP) (Excluding NP) (Including NP) Net sales 24,611 19,860 23.9 % 23,099 Gross margin 8,906 7,033 26.6 % 8,265 Gross margin rate 36.2 % 35.4 % 0.8 points 35.8% SG&A expenses 6,68
Slide 6: Quarterly Number of Employees in Consolidated Companies
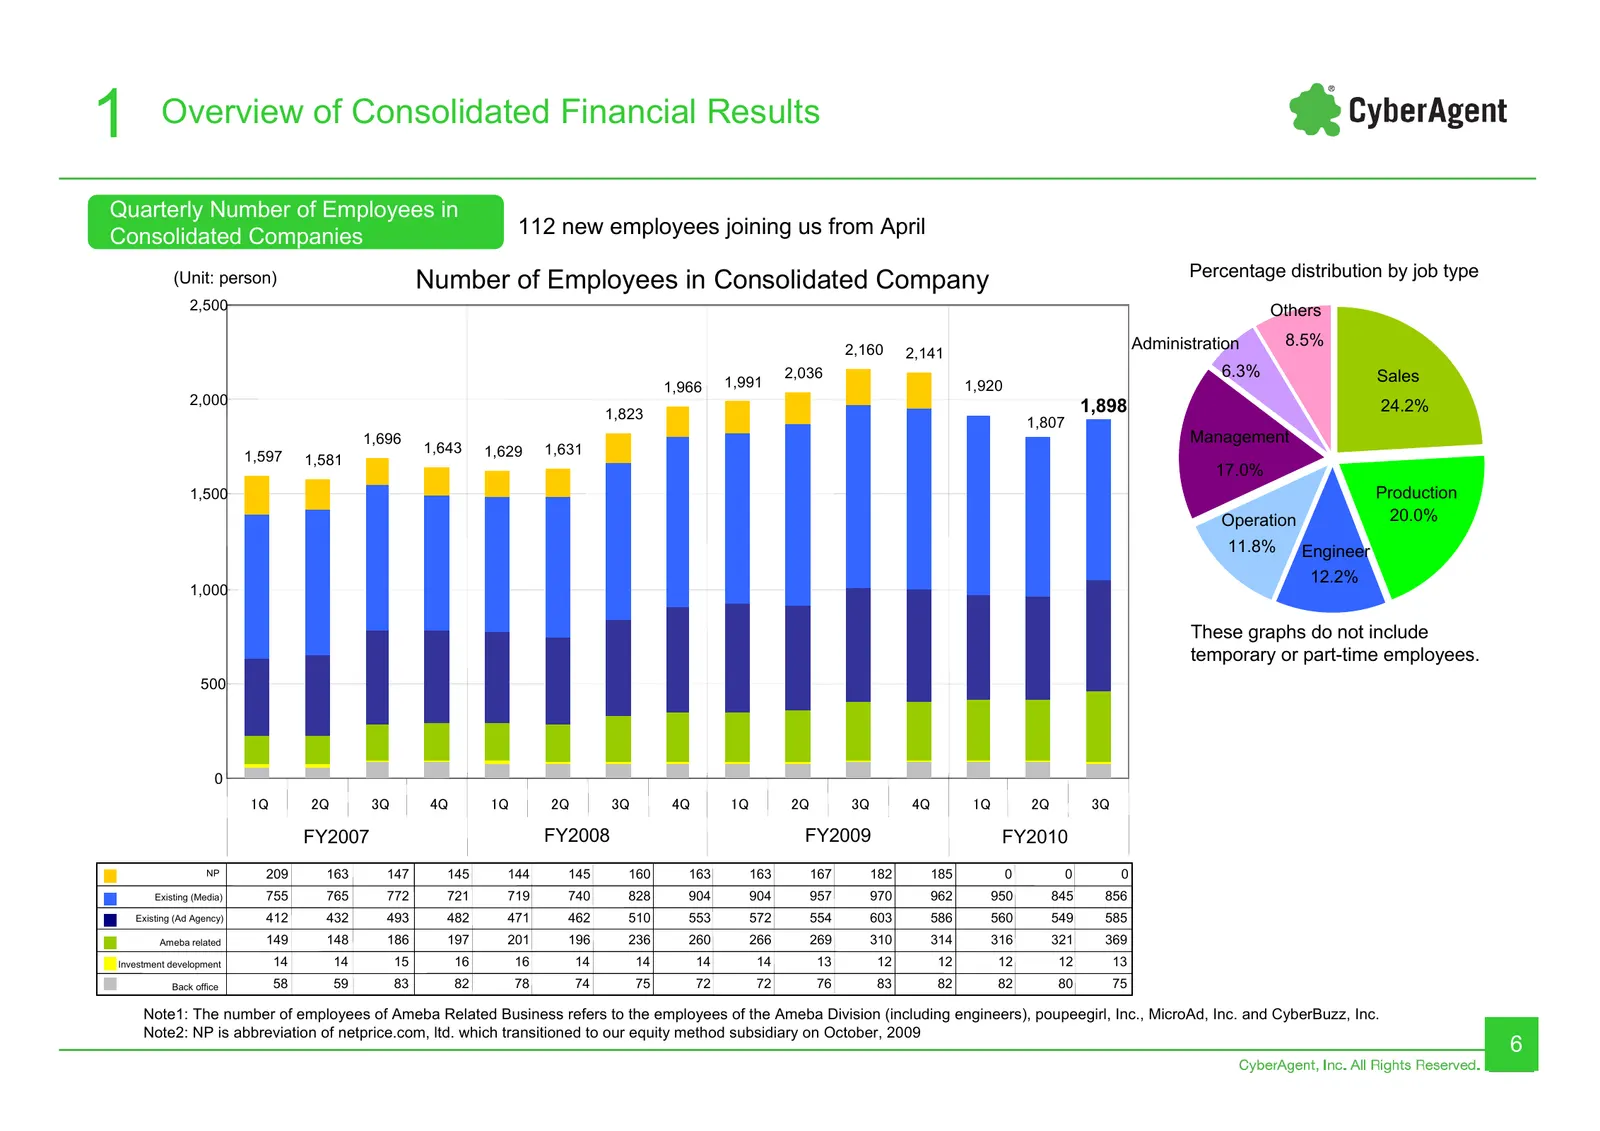
1 Overview of Consolidated Financial Results Quarterly Number of Employees in Consolidated Companies 112 new employees joining us from April Percentage distribution by job type (Unit: person) Number of Employees in Consolidated Company 2,500 Others Administration 8.5% 2,160 2,141 2,036 6.3% Sales 1,
Slide 7: Quarterly SG&A Expenses
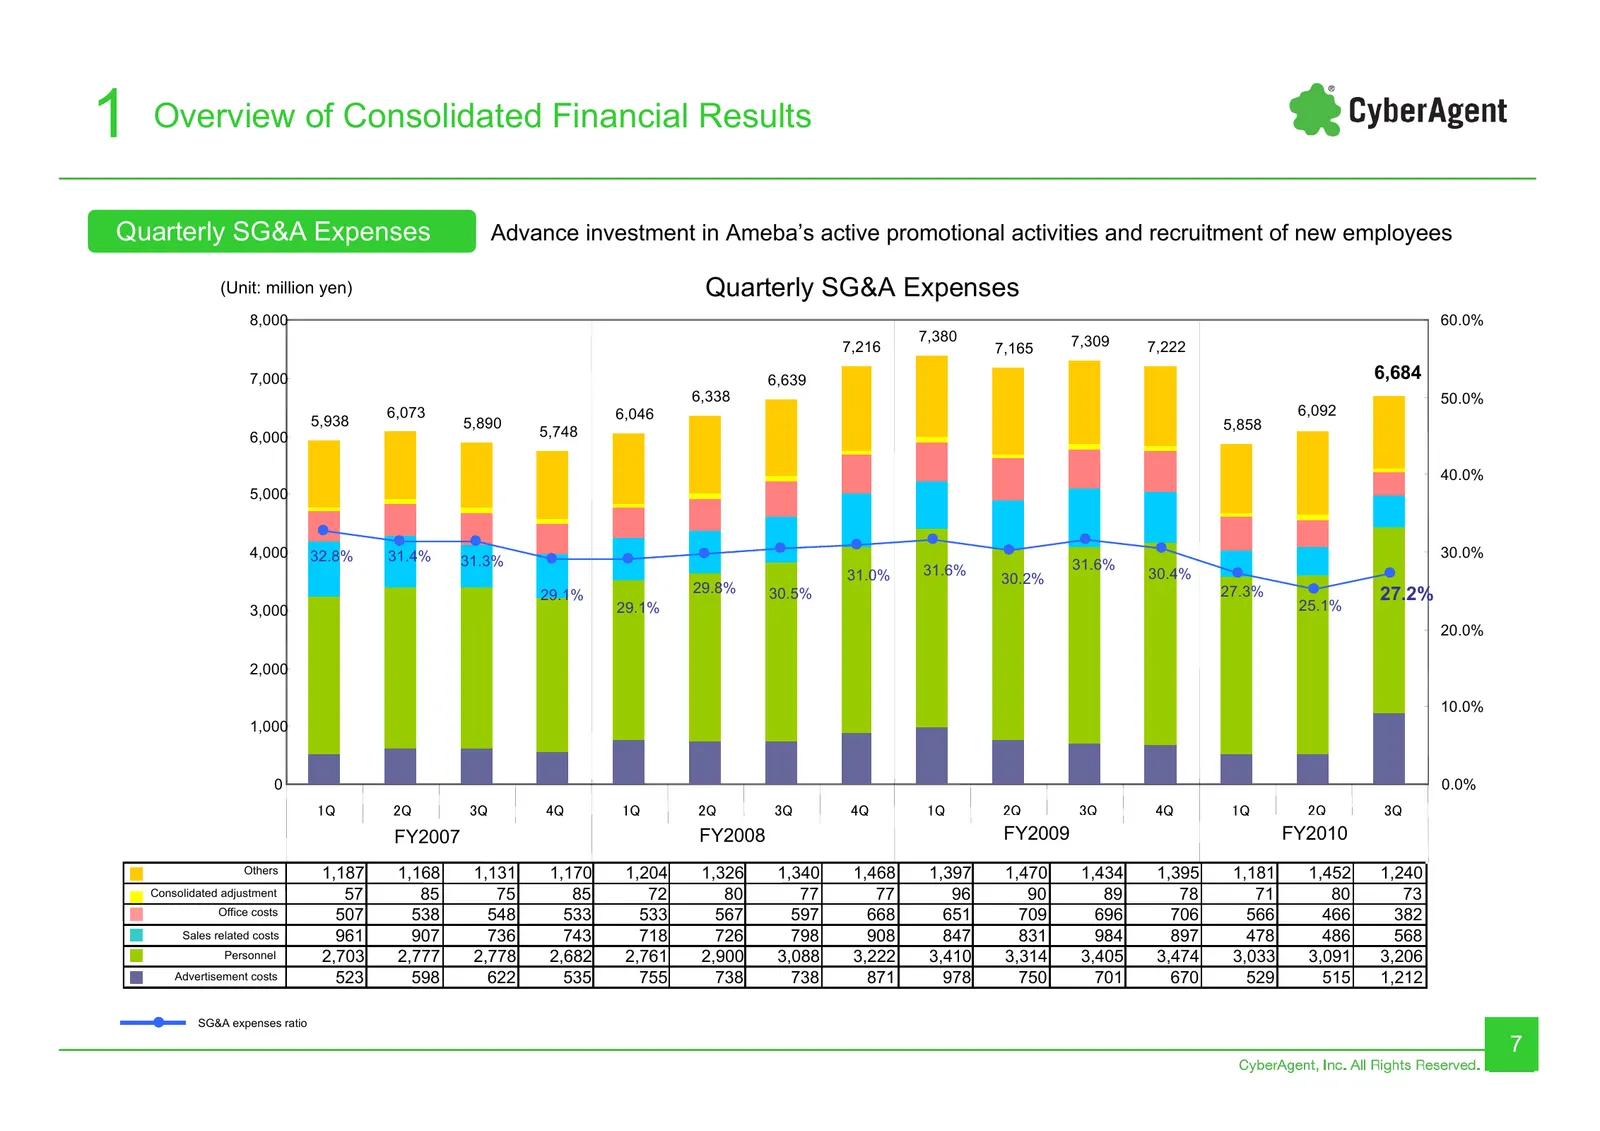
1 Overview of Consolidated Financial Results Quarterly SG&A Expenses Advance investment in Ameba’s active promotional activities and recruitment of new employees (Unit: million yen) Quarterly SG&A Expenses 8,000 60.0% 7,380 7,309 7,216 7,165 7,222 7,000 6,639 6,684 6,338 50.0% 6,073 6,046 6,092 5,93
Slide 8: Quarterly Operating Profit by Business Segments
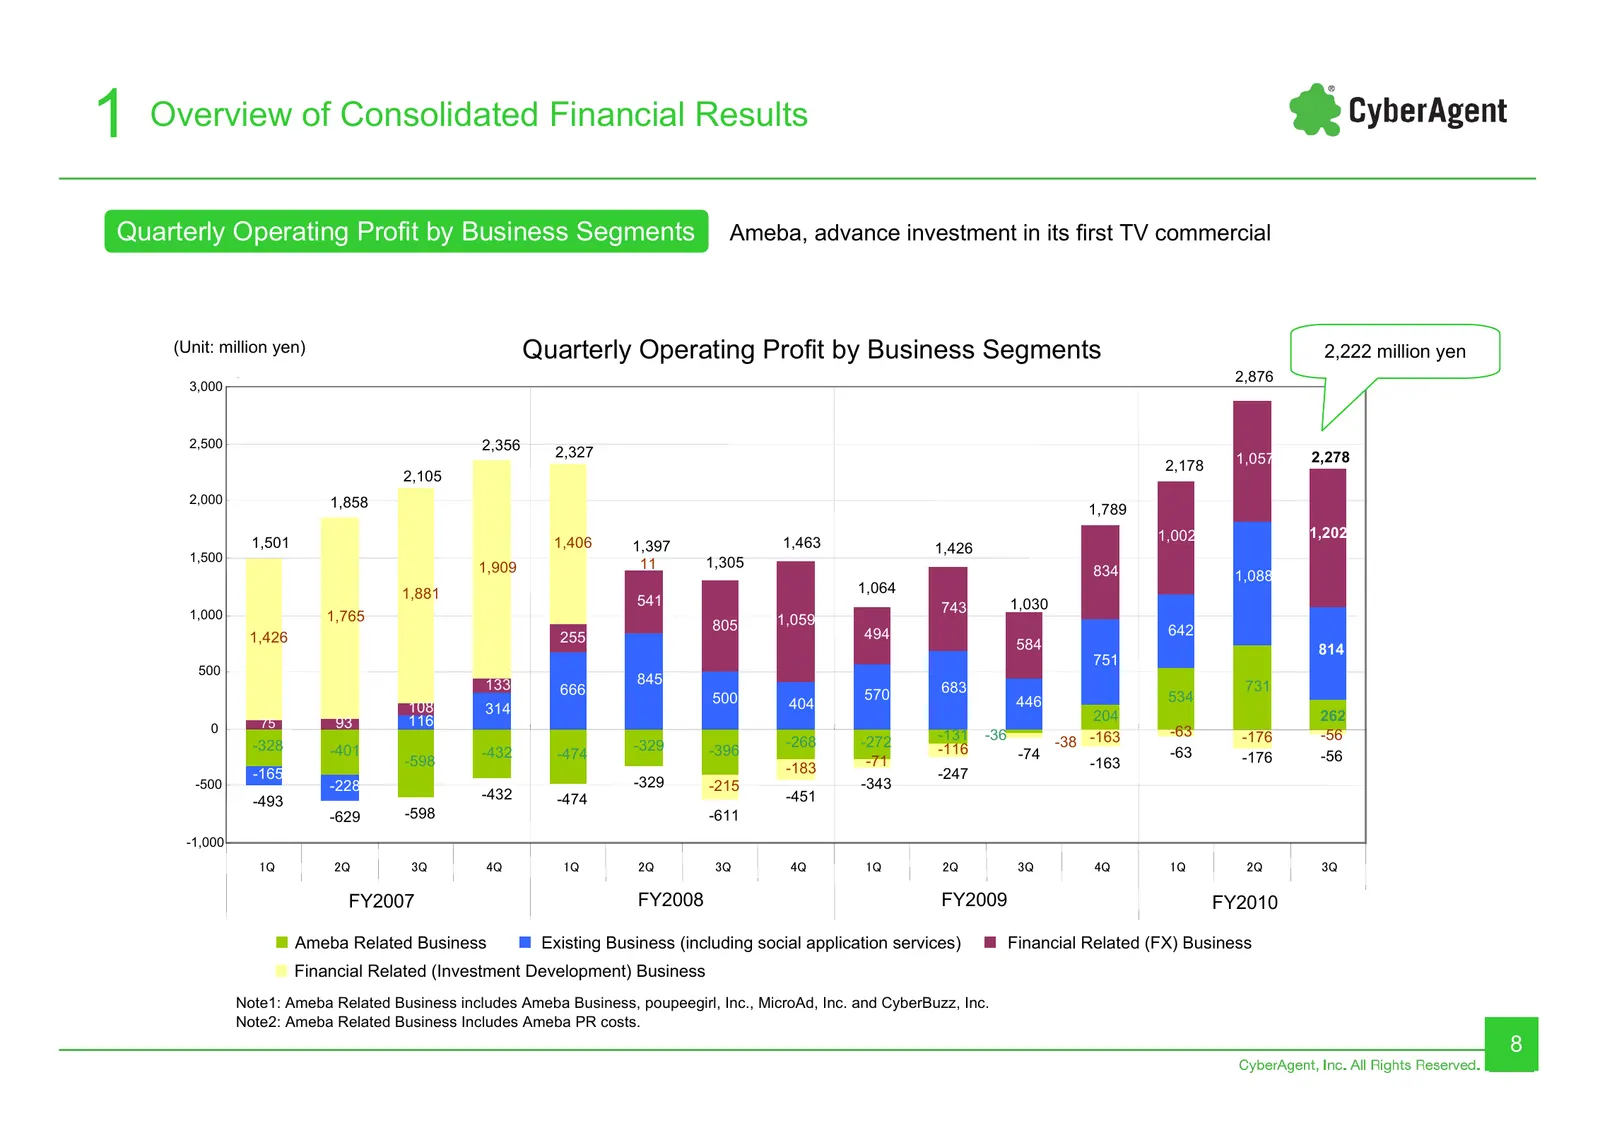
1 Overview of Consolidated Financial Results Quarterly Operating Profit by Business Segments Ameba, advance investment in its first TV commercial (Unit: million yen) 単位: 百万円 Quarterly Operating Profit by Business Segments 2,222 million yen 営業利益四半期推移 2,876 2,876 3,000 3,000 2,500 2,500 2,356 2,356 2,
Slide 9: Balance Sheet
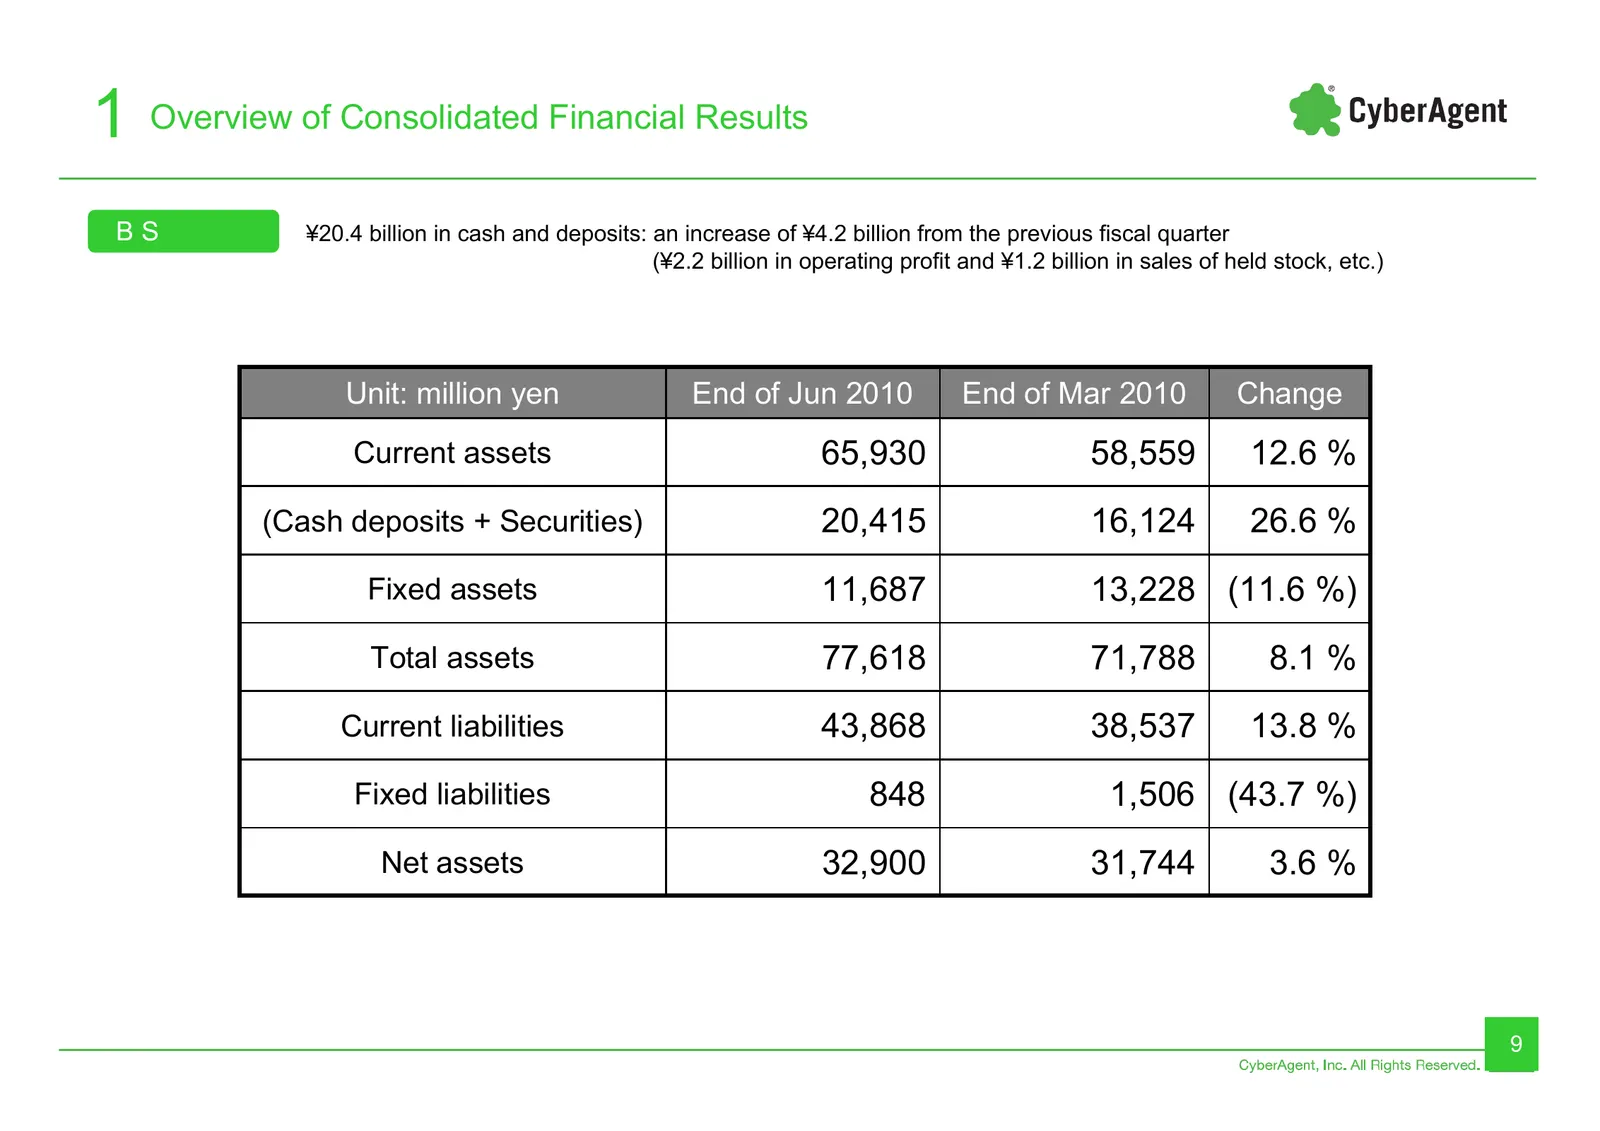
1 Overview of Consolidated Financial Results BS ¥20.4 billion in cash and deposits: an increase of ¥4.2 billion from the previous fiscal quarter (¥2.2 billion in operating profit and ¥1.2 billion in sales of held stock, etc.) Unit: million yen End of Jun 2010 End of Mar 2010 Change Current assets 65
Slide 10: Consolidated Business Forecast for the Year Ending September 2010
2 Consolidated Business Forecast Consolidated Business Forecast for the Year Ending September 2010 10
Slide 11: Consolidated Business Forecast for FY2010
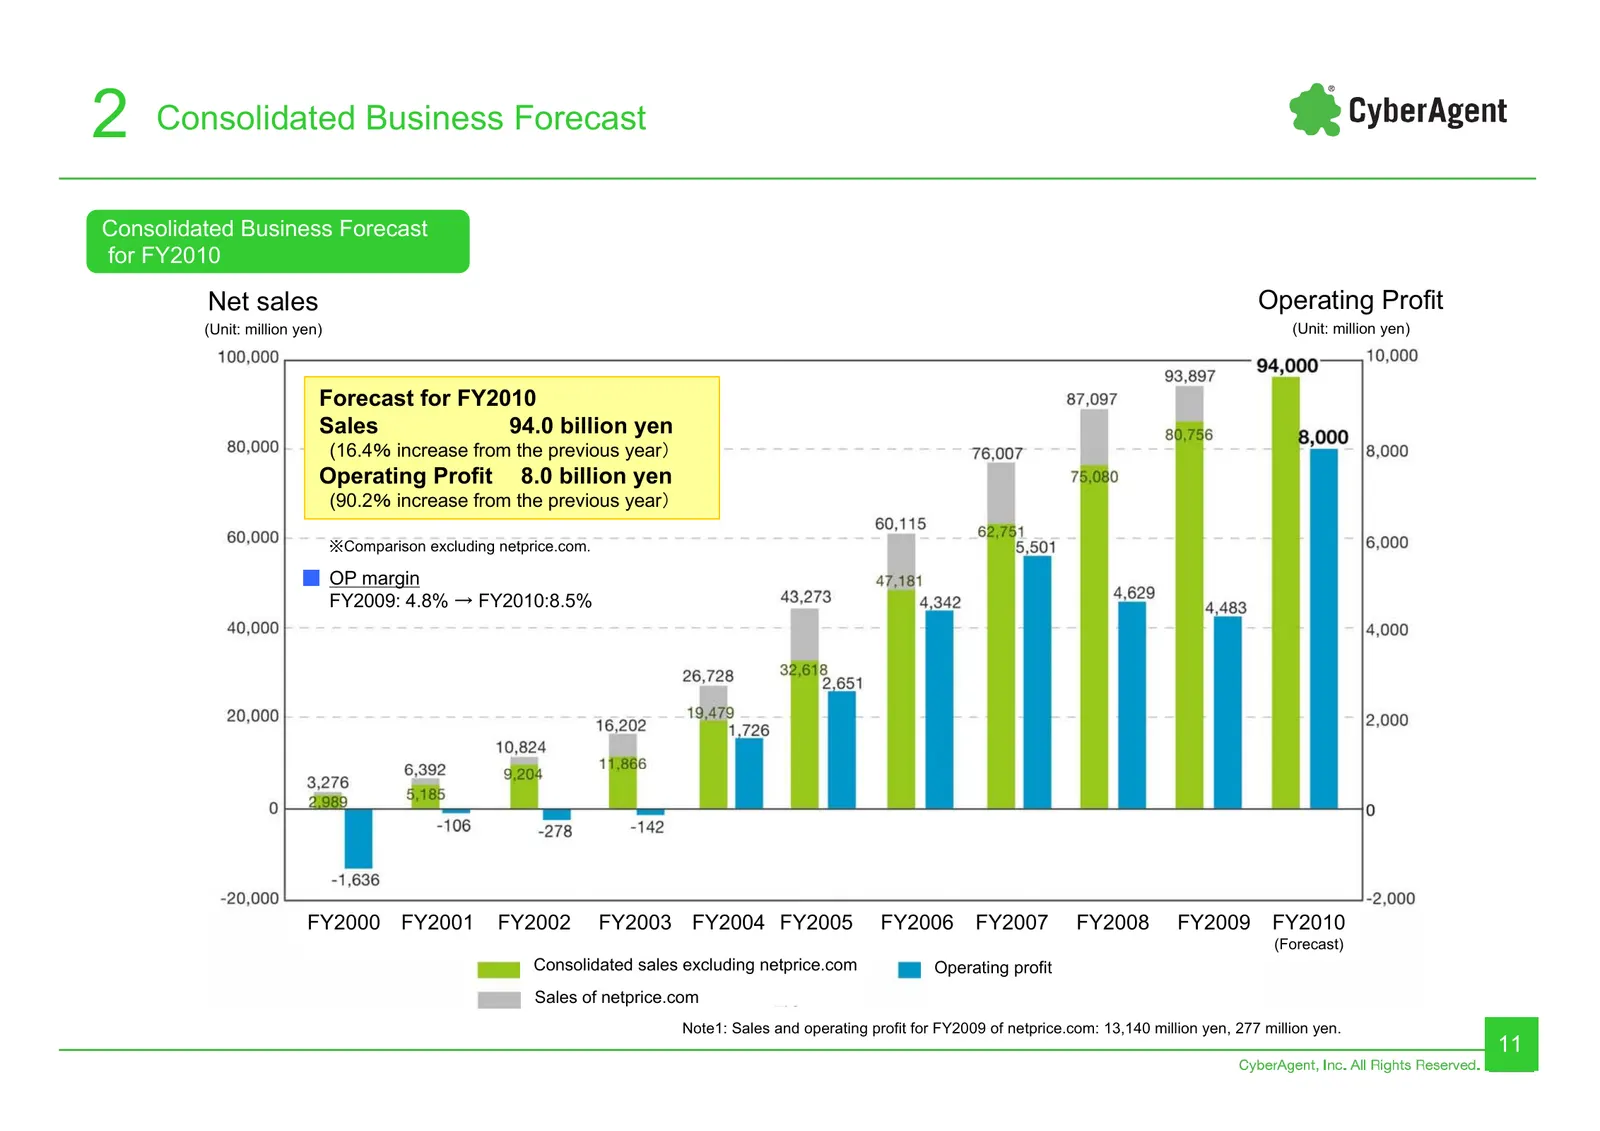
2 Consolidated Business Forecast Consolidated Business Forecast for FY2010 Net sales Operating Profit (Unit: million yen) (Unit: million yen) Forecast for FY2010 Sales 94.0 billion yen (16.4% increase from the previous year) Operating Profit 8.0 billion yen (90.2% increase from the previous year) ※C
Slide 12: Business Forecast for FY2010: Third quarter progress rate
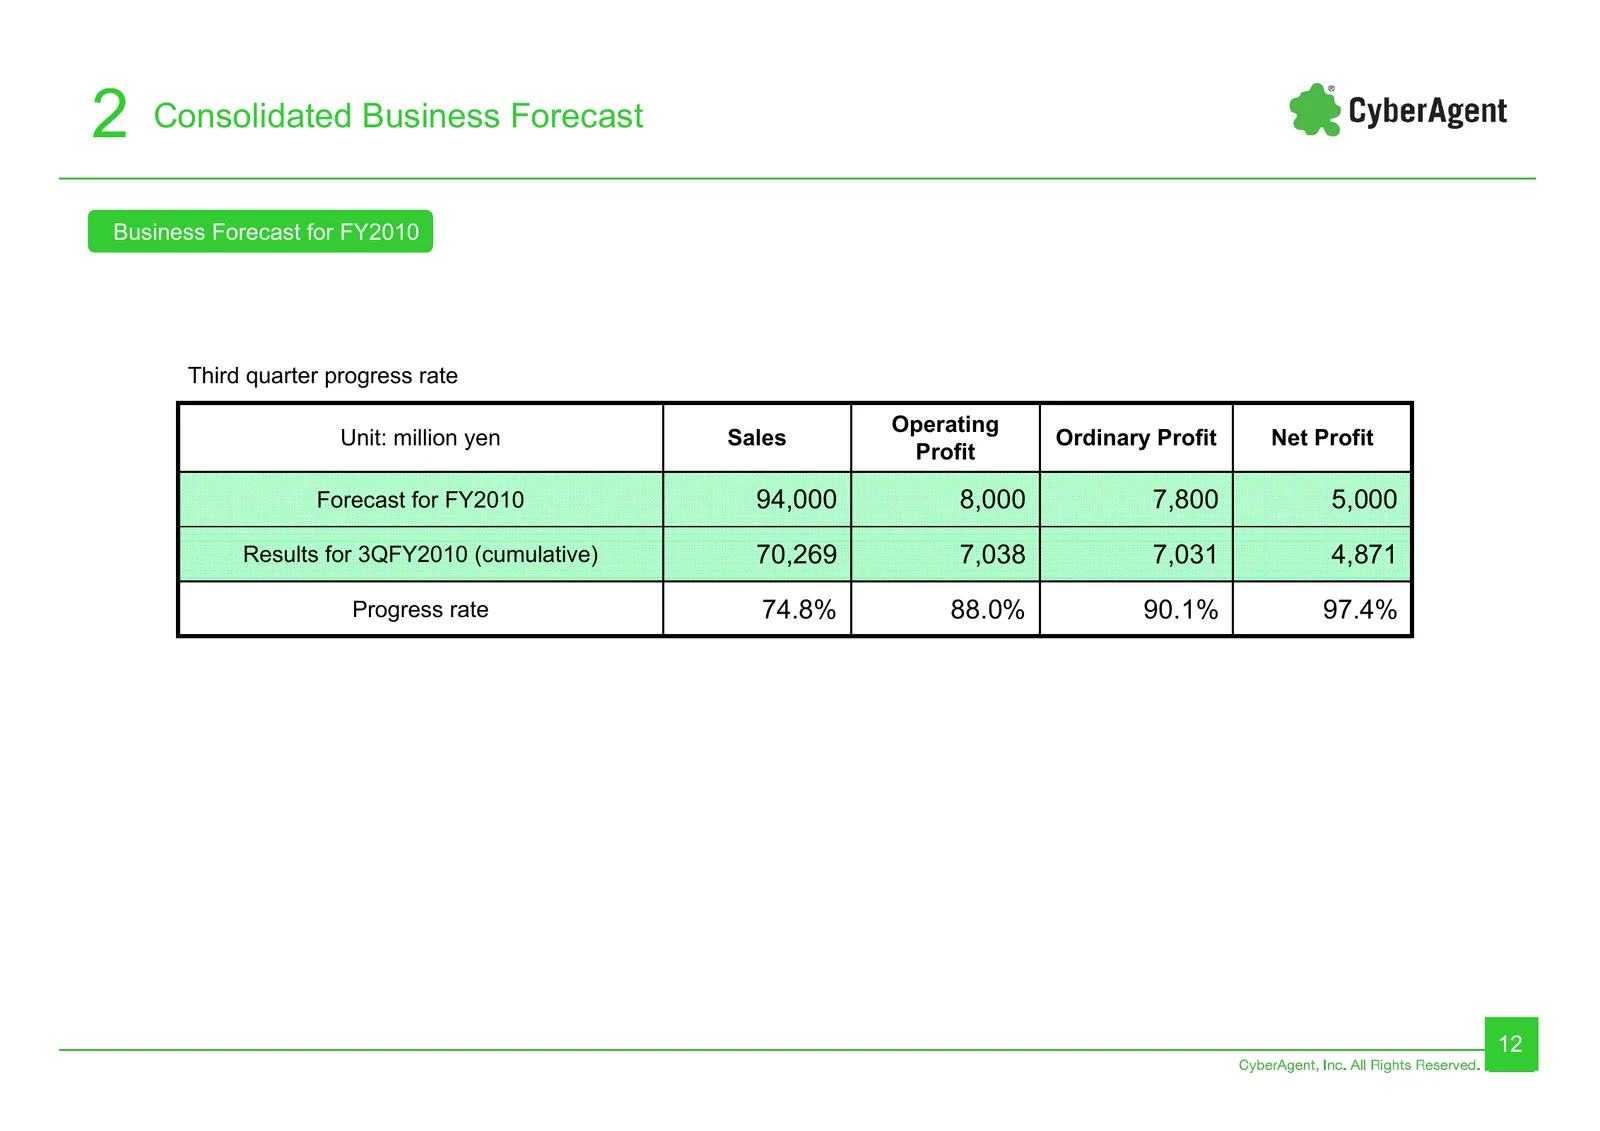
2 Consolidated Business Forecast Business Forecast for FY2010 Third quarter progress rate Operating Unit: million yen Sales Ordinary Profit Net Profit Profit Forecast for FY2010 94,000 8,000 7,800 5,000 Results for 3QFY2010 (cumulative) 70,269 7,038 7,031 4,871 Progress rate 74.8% 88.0% 90.1% 97.4%
Slide 13: Measure for returning profit to shareholders
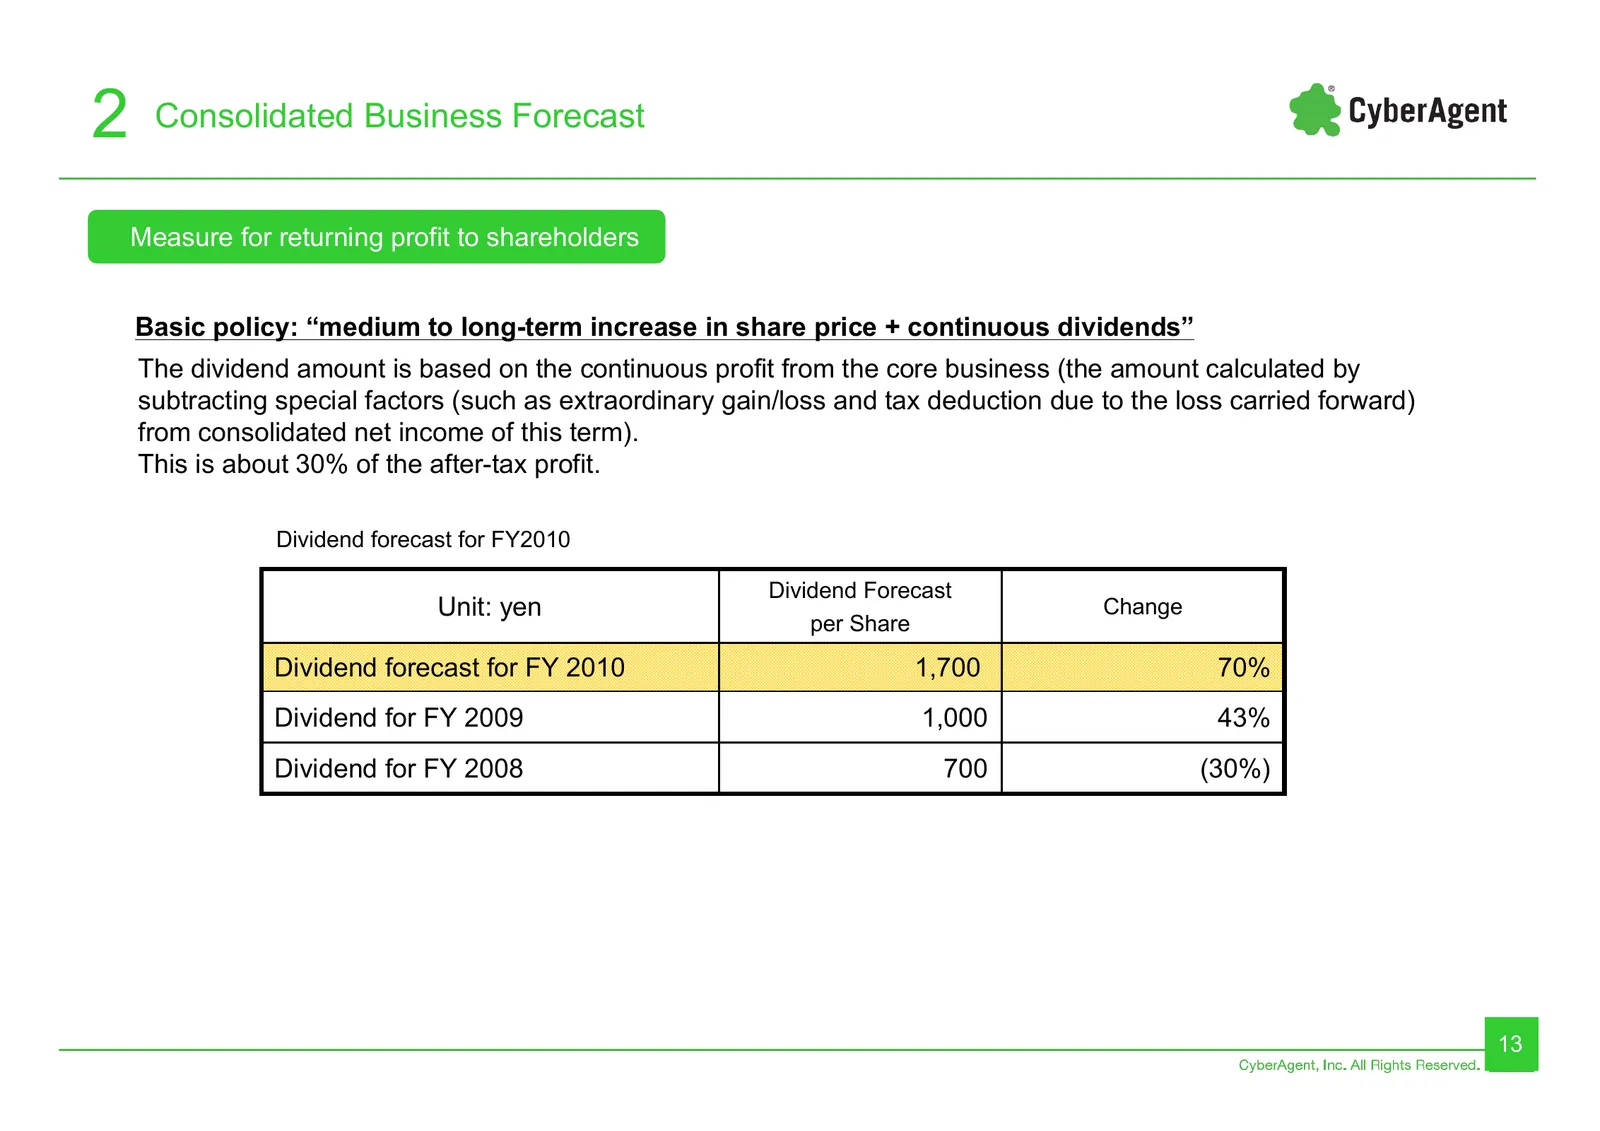
2 Consolidated Business Forecast Measure for returning profit to shareholders Basic policy: “medium to long-term increase in share price + continuous dividends” The dividend amount is based on the continuous profit from the core business (the amount calculated by subtracting special factors (such as
Slide 14: Business forecast for FY2010: operating profit breakdown
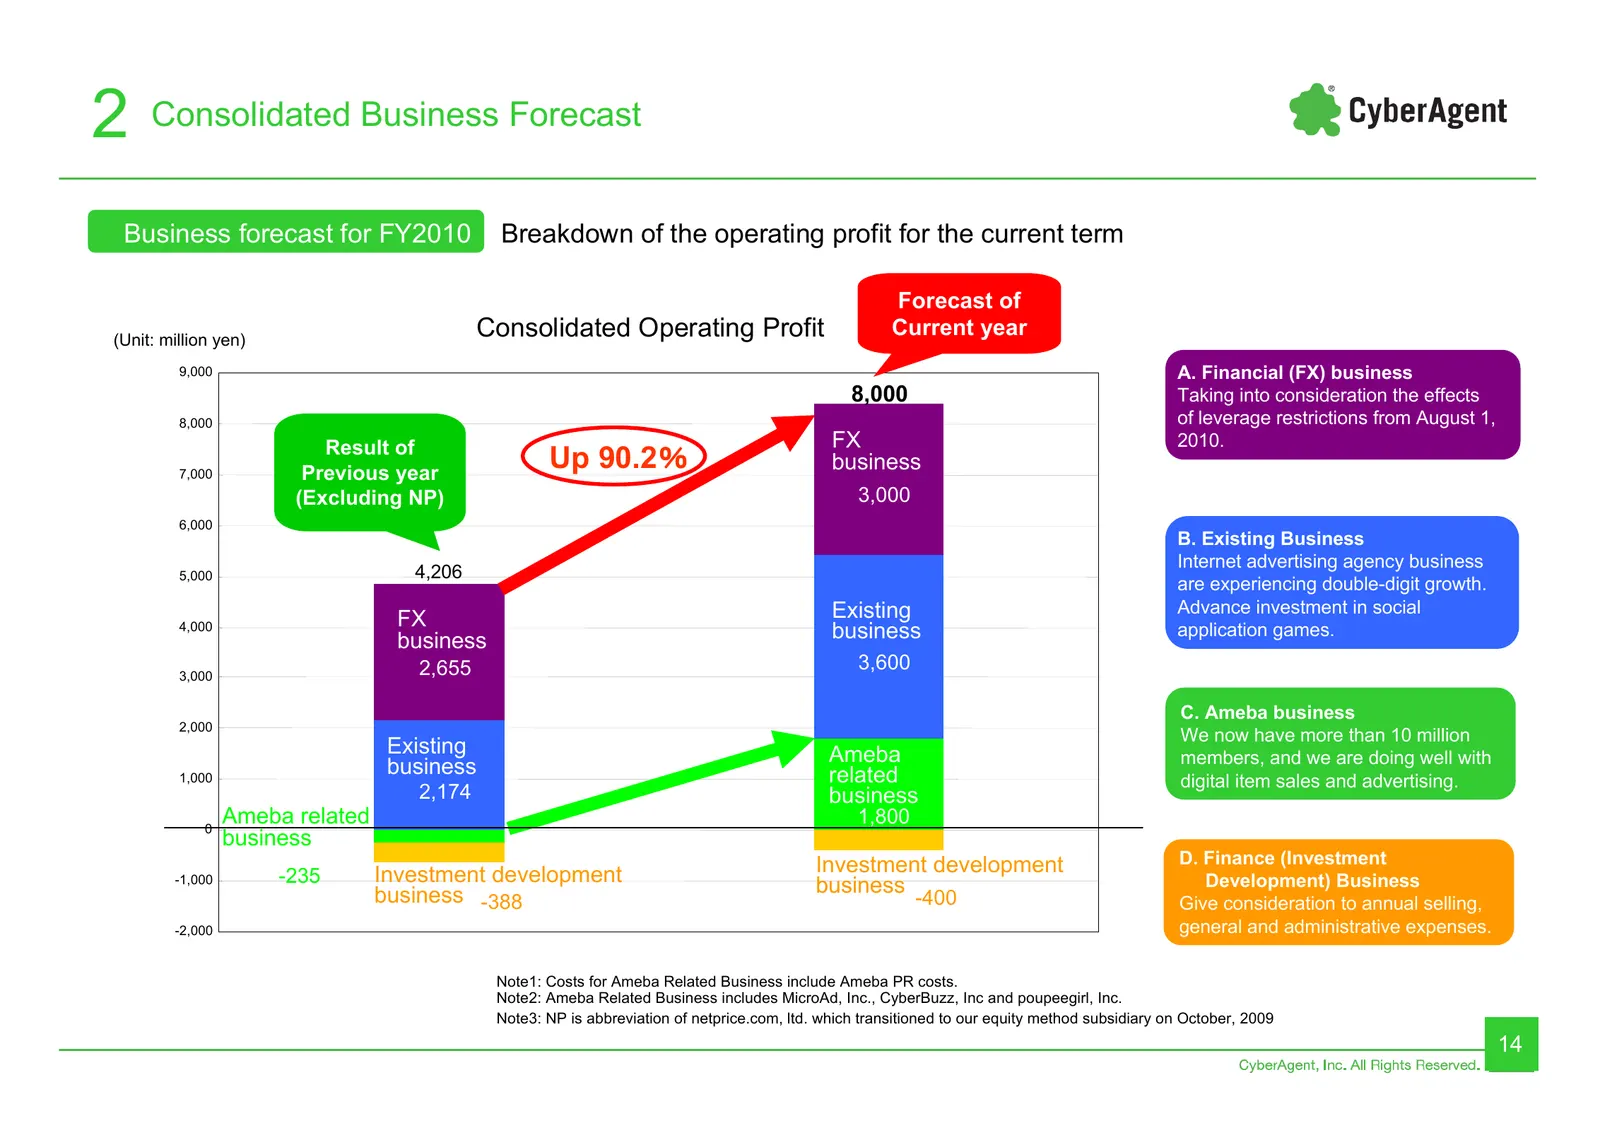
2 Consolidated Business Forecast 2009年9月期業績見通し Business forecast for FY2010 Breakdown of the operating profit for the current term Forecast of (Unit: million yen) Consolidated Operating Profit Current year 9,000 A. Financial (FX) business 8,000 Taking into consideration the effects 8,000 A.金融関連(FX)事
Slide 15: Major Business
3 Major Business Major Business 15
Slide 16: Major Business (Internet Advertising Agency Business)
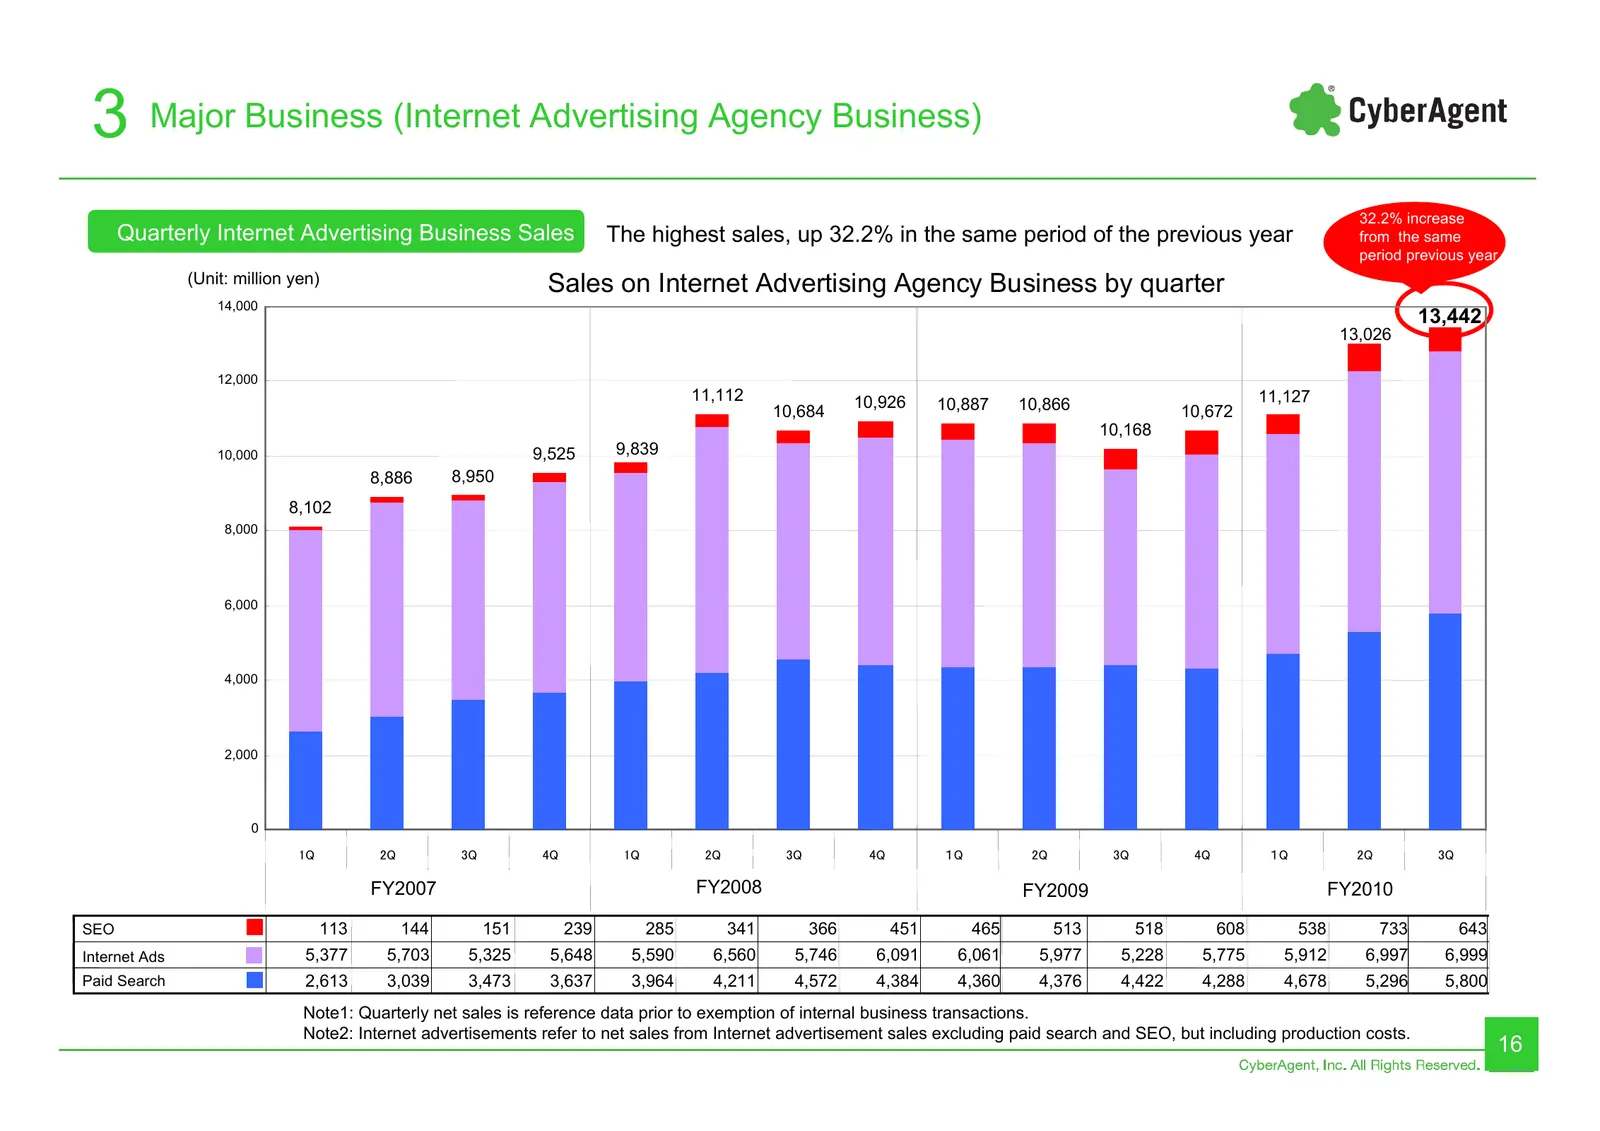
3 Major Business (Internet Advertising Agency Business) 32.2% increase Quarterly Internet Advertising Business Sales The highest sales, up 32.2% in the same period of the previous year from the same period previous year (Unit: million yen) Sales on Internet Advertising Agency Business by quarter 14,
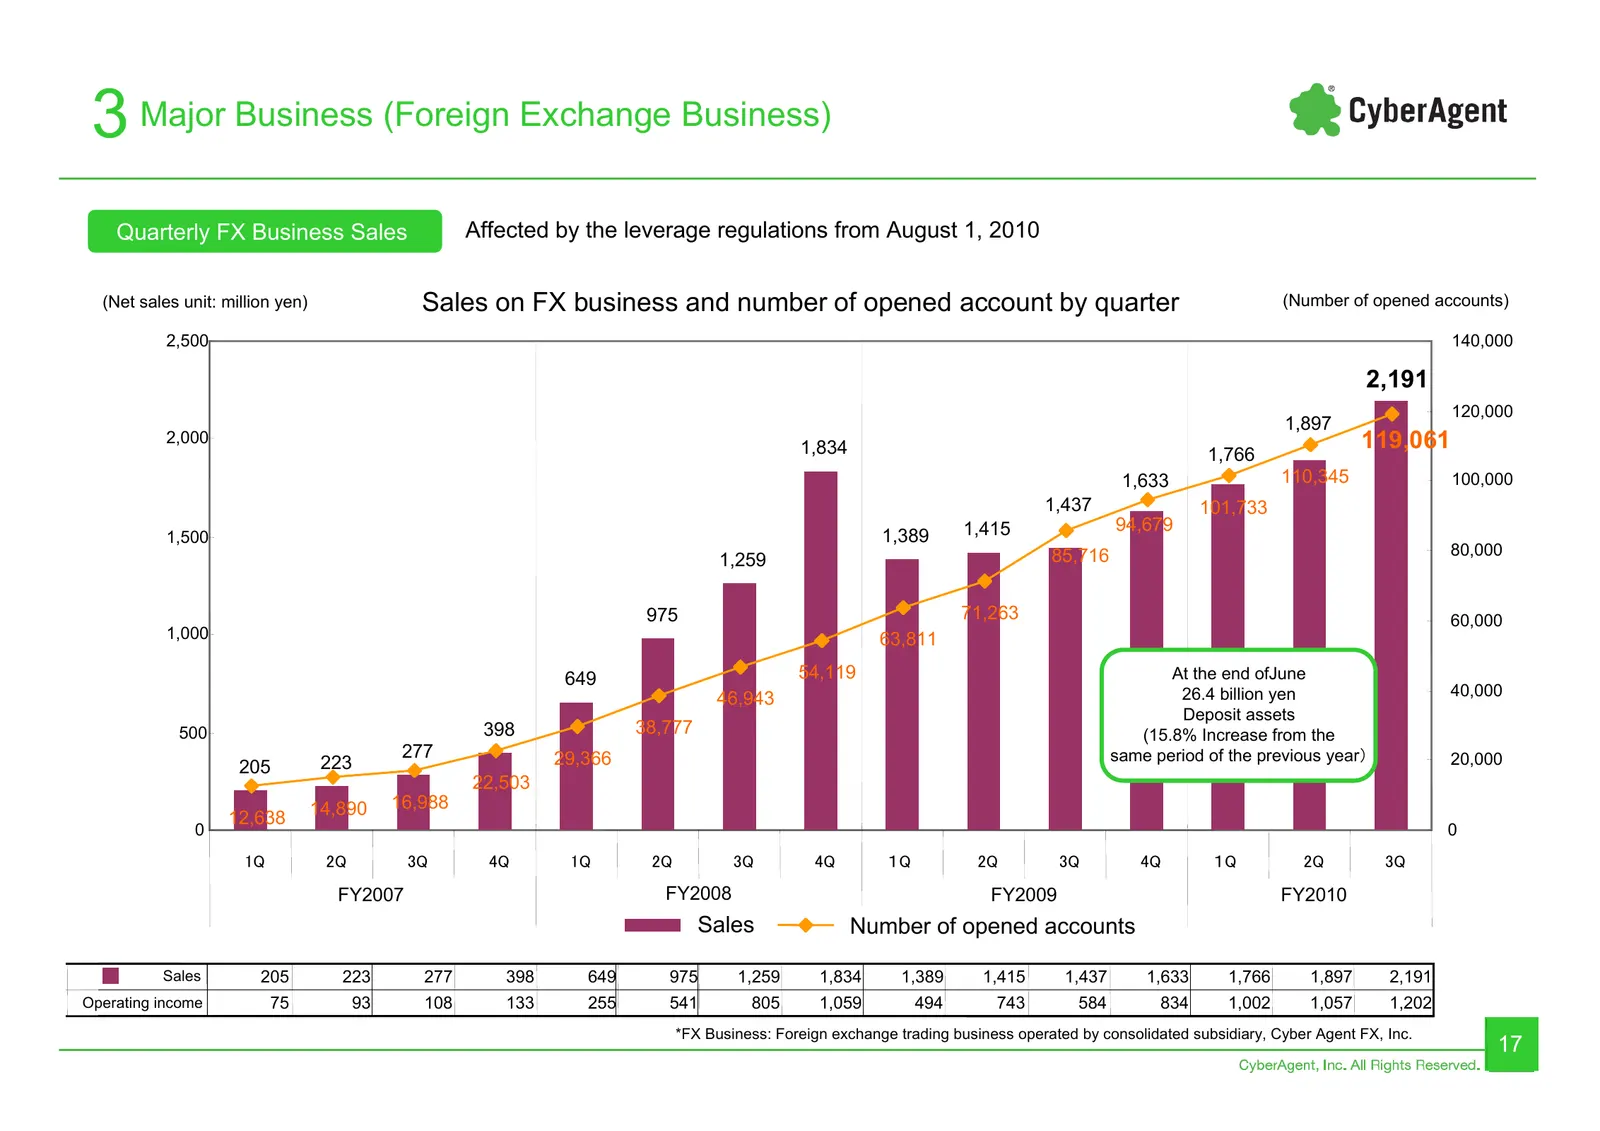
Slide 17: Major Business (Foreign Exchange Business)
3 Major Business (Foreign Exchange Business) Quarterly FX Business Sales Affected by the leverage regulations from August 1, 2010 (Net sales unit: million yen) Sales on FX business and number of opened account by quarter (Number of opened accounts) 2,500 140,000 2,191 120,000 1,897 2,000 1,834 1,766
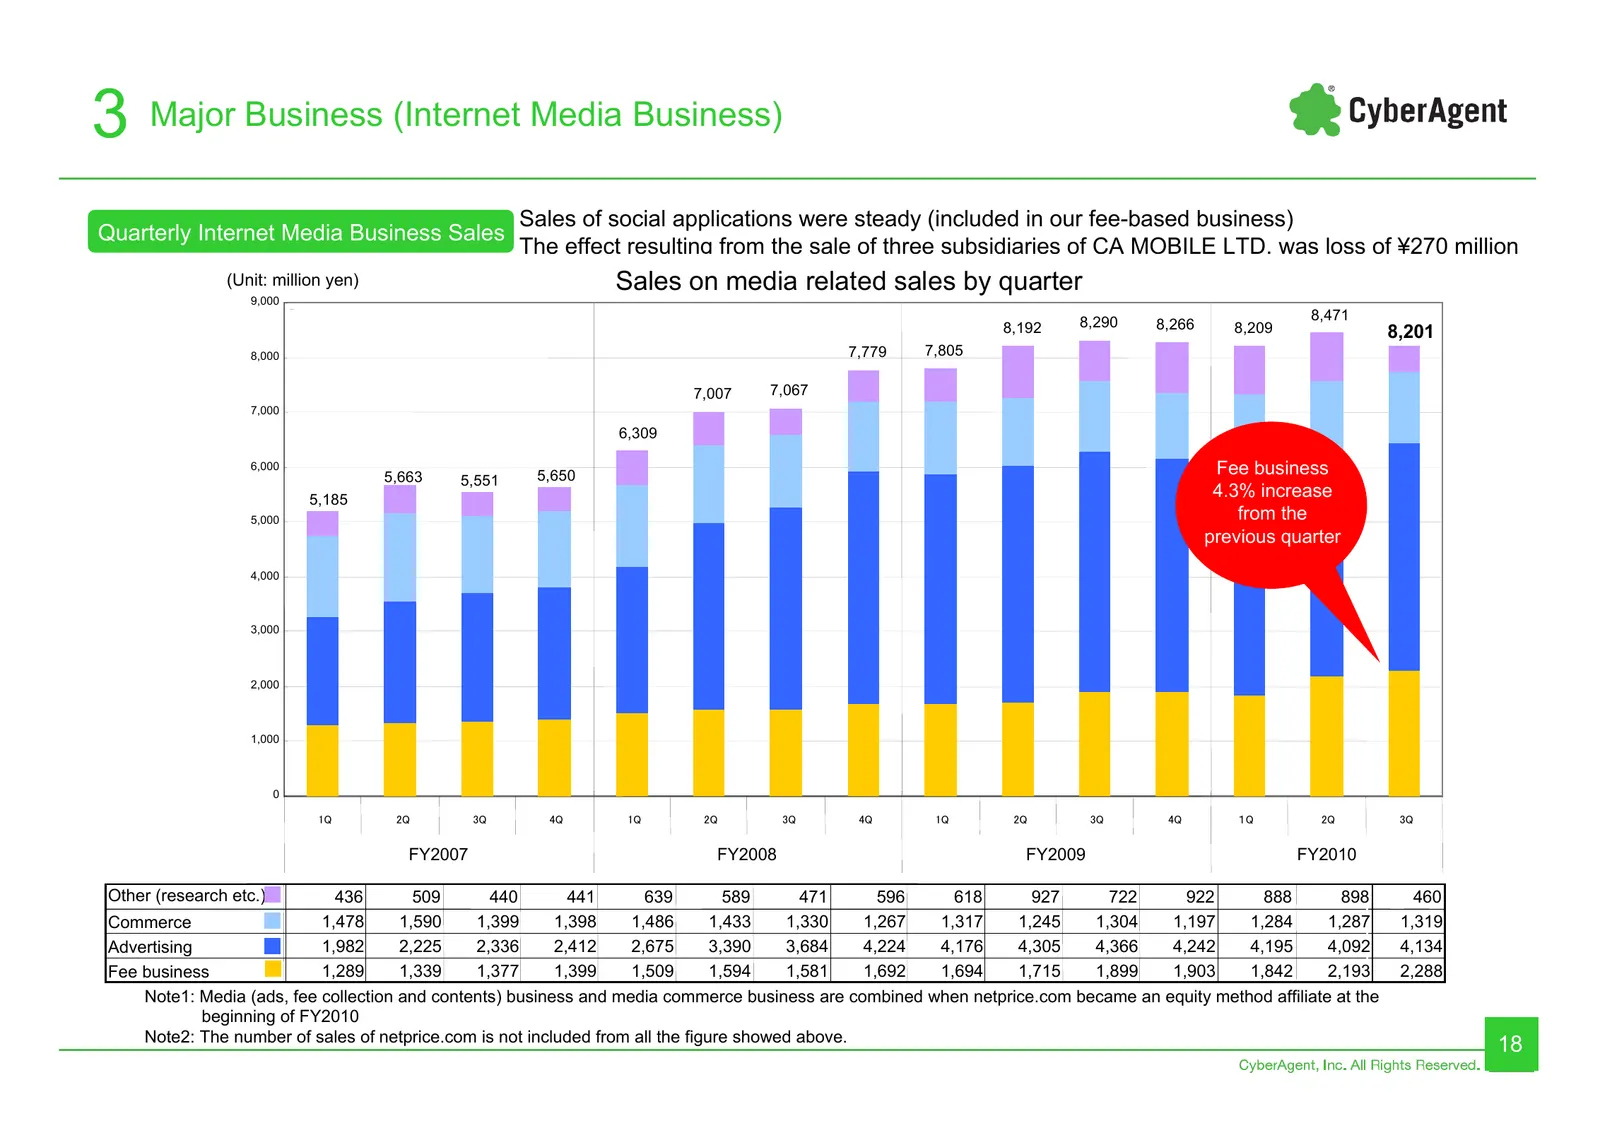
Slide 18: Major Business (Internet Media Business)
3 Major Business (Internet Media Business) Sales of social applications were steady (included in our fee-based business) Quarterly Internet Media Business Sales The effect resulting from the sale of three subsidiaries of CA MOBILE LTD. was loss of ¥270 million (Unit: million yen) Sales on media rela

Slide 19: Major social applications
3 Major Business (Internet Media Business) Major social applications Supplying social application games from our group of subsidiaries to other companies’ platforms As of July 27: 10 titles As of July 27: 3 titles 「Love☆situation for GREE」 「Sengoku hero taisen」 From June 29; From June 29; approx. 20
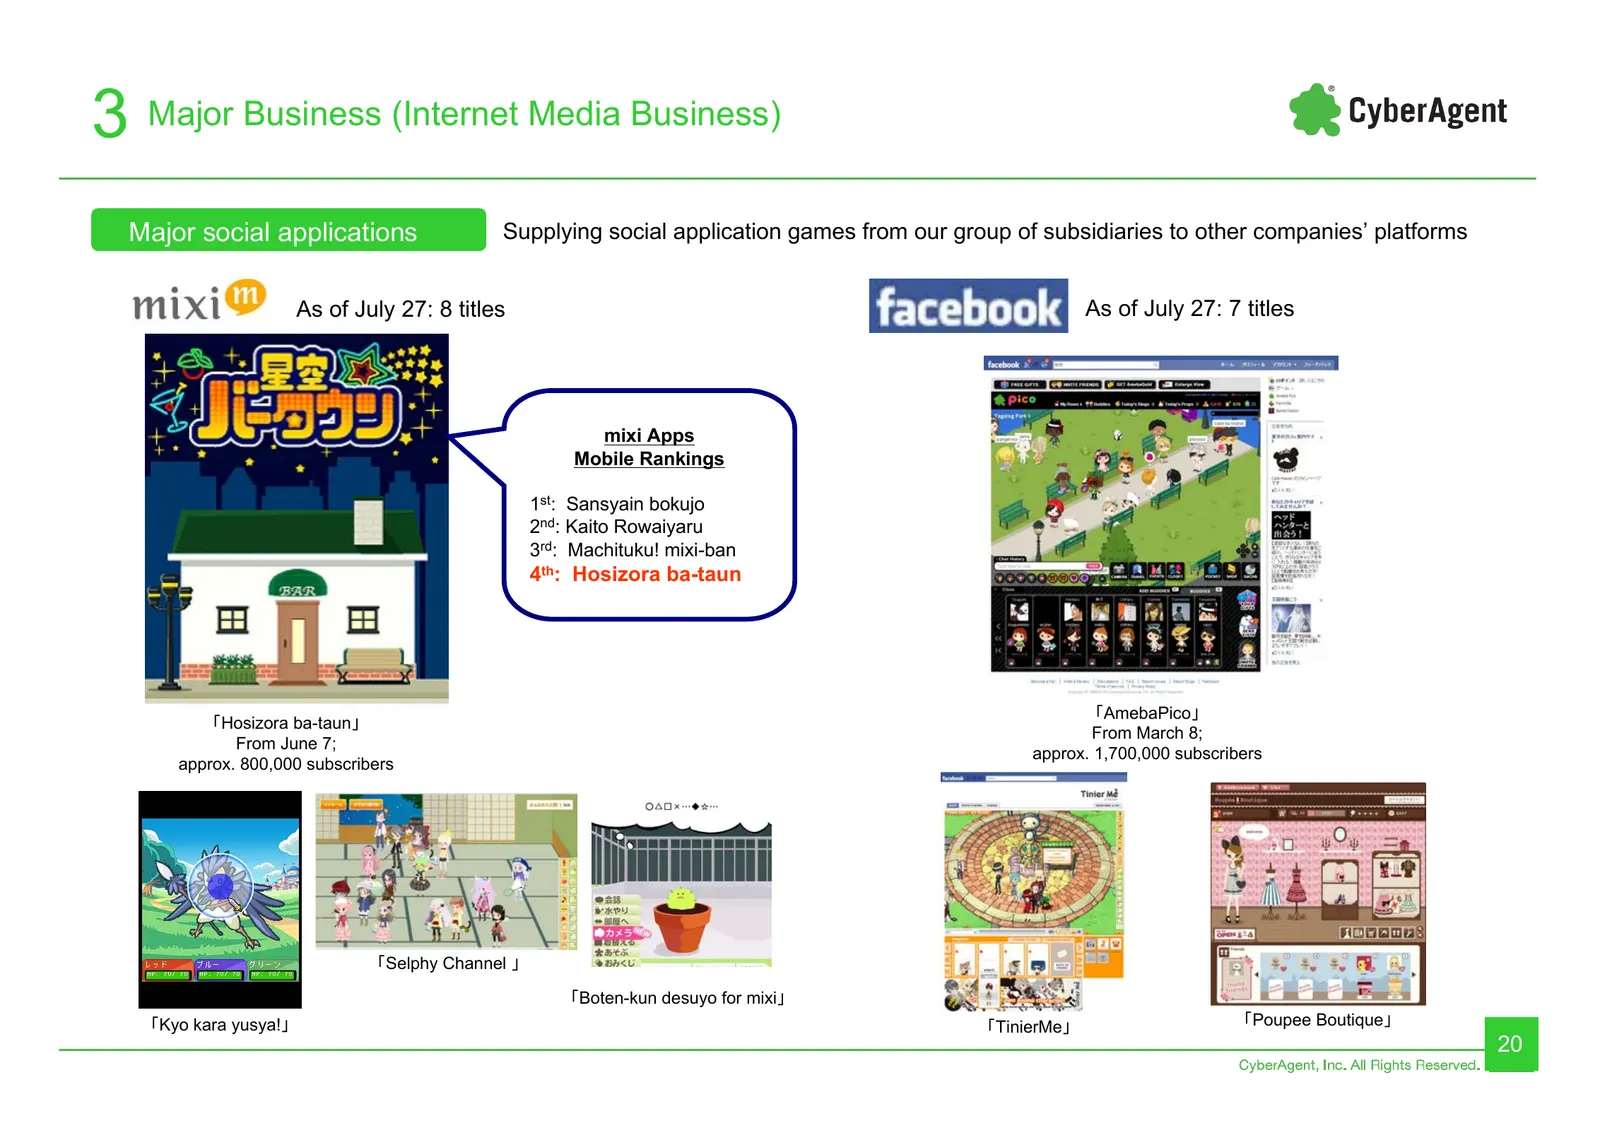
Slide 20: Major social applications
3 Major Business (Internet Media Business) Major social applications Supplying social application games from our group of subsidiaries to other companies’ platforms As of July 27: 8 titles As of July 27: 7 titles mixi Apps Mobile Rankings 1st: Sansyain bokujo 2nd: Kaito Rowaiyaru 3rd: Machituku! mix
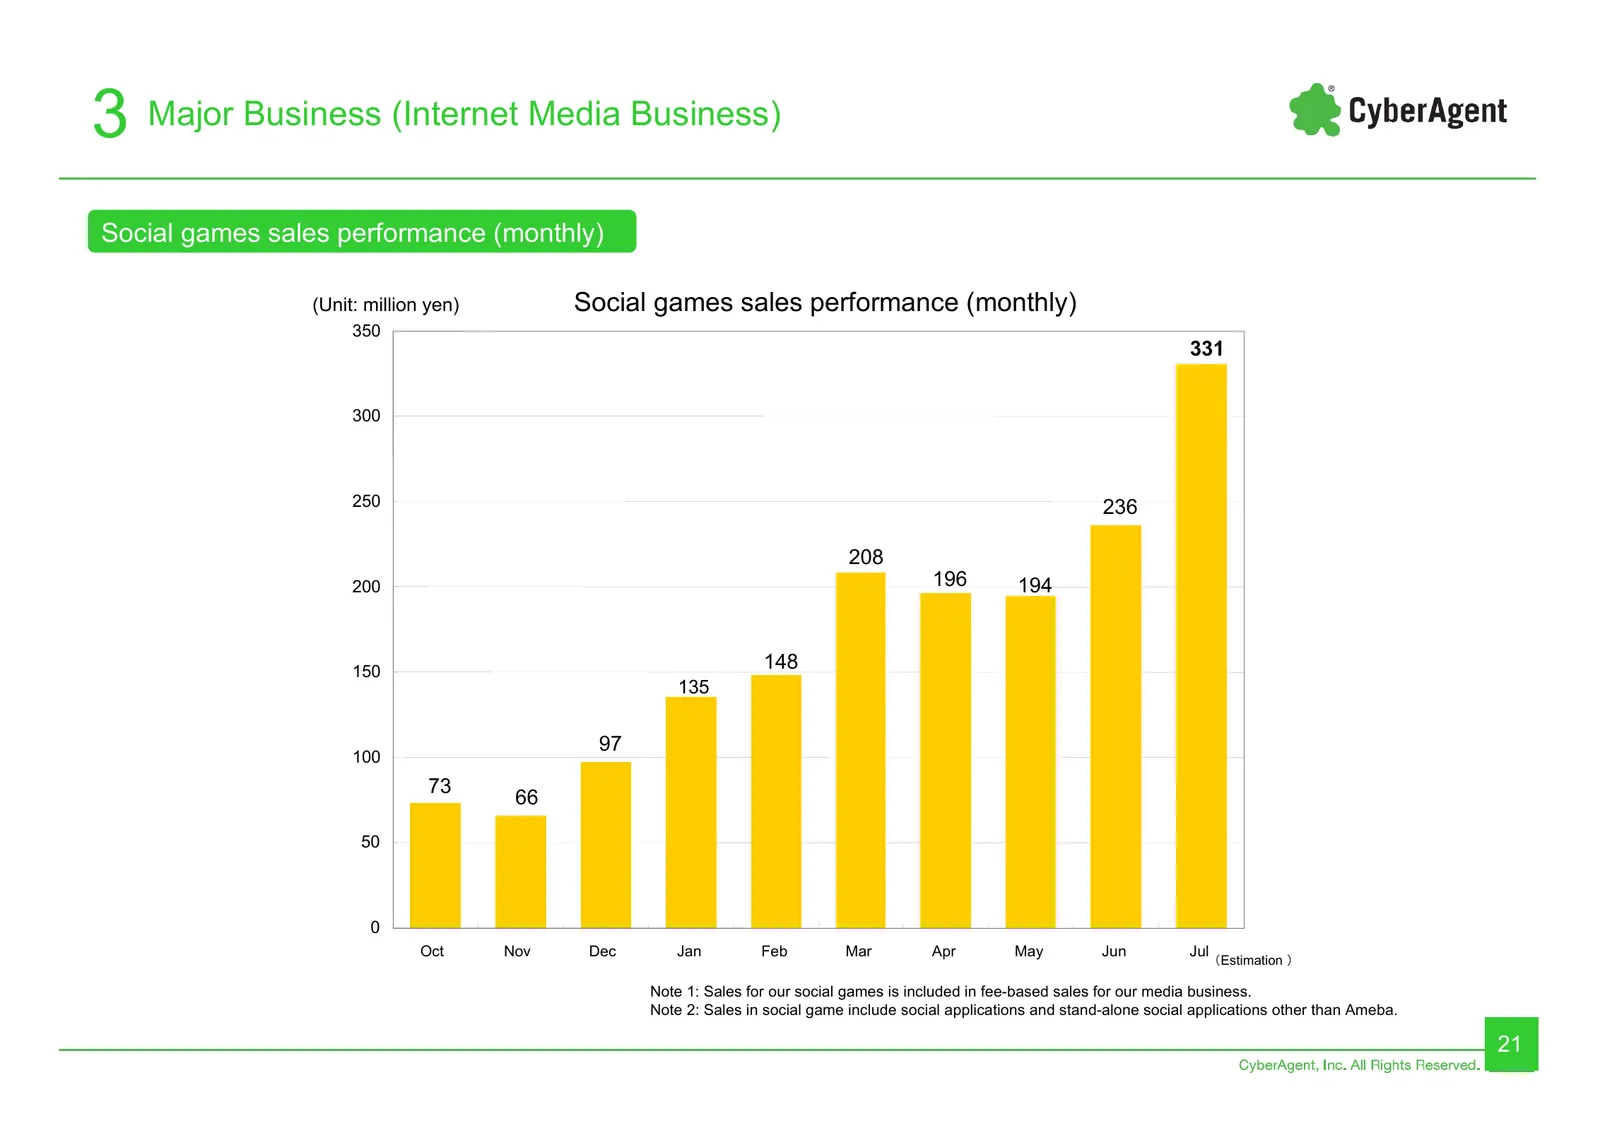
Slide 21: Social games sales performance (monthly)
3 Major Business (Internet Media Business) Social games sales performance (monthly) (Unit: million yen) Social games sales performance (monthly) 350 331 300 250 236 208 200 196 194 150 148 135 97 100 73 66 50 0 Oct Nov Dec Jan Feb Mar Apr May Jun Jul (Estimation ) Note 1: Sales for our social games
Slide 22: Ameba Business
4 Ameba Business Ameba business 22
Slide 23: Ameba Monthly Page Views
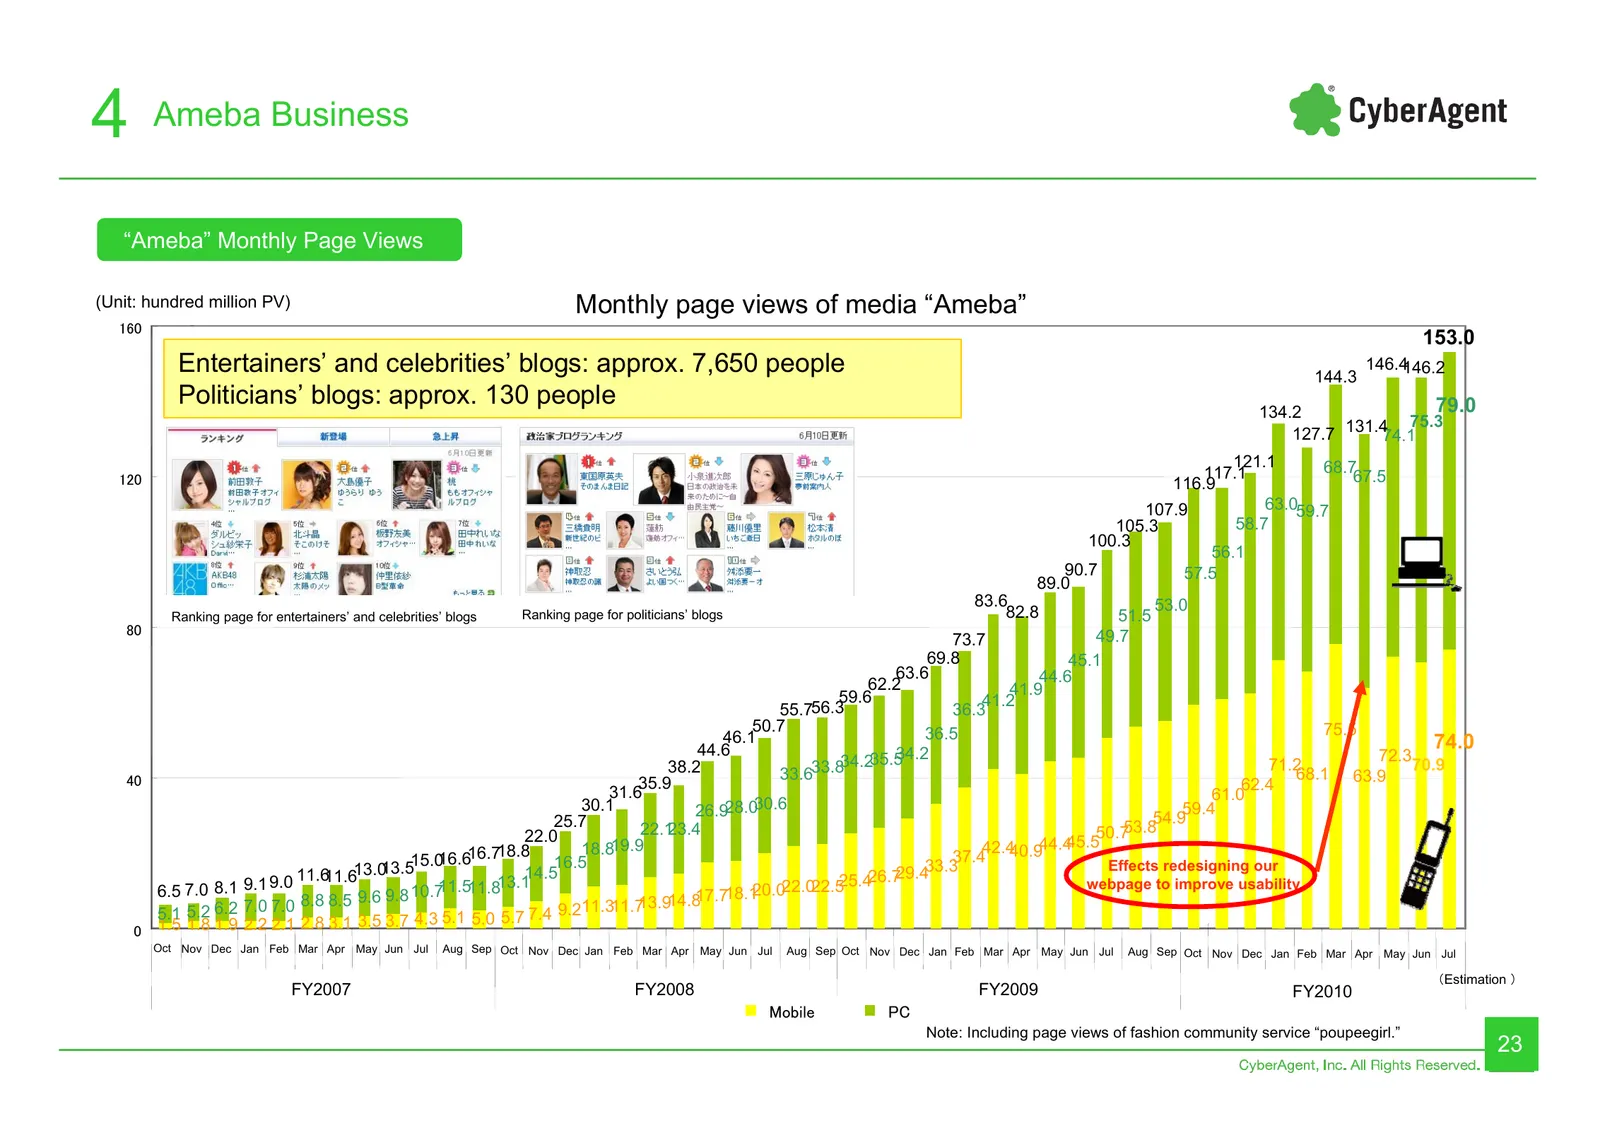
4 Ameba Business “Ameba” Monthly Page Views (Unit: hundred million PV) Monthly page views of media “Ameba” 160 153.0 Entertainers’ and celebrities’ blogs: approx. 7,650 people 144.3 146.4146.2 Politicians’ blogs: approx. 130 people 79.0 134.2 75.3 127.7 131.474.1 121.1 68.7 120 117.1 67.5 116.9 107.
Slide 24: Monthly Number of Ameba Subscribers
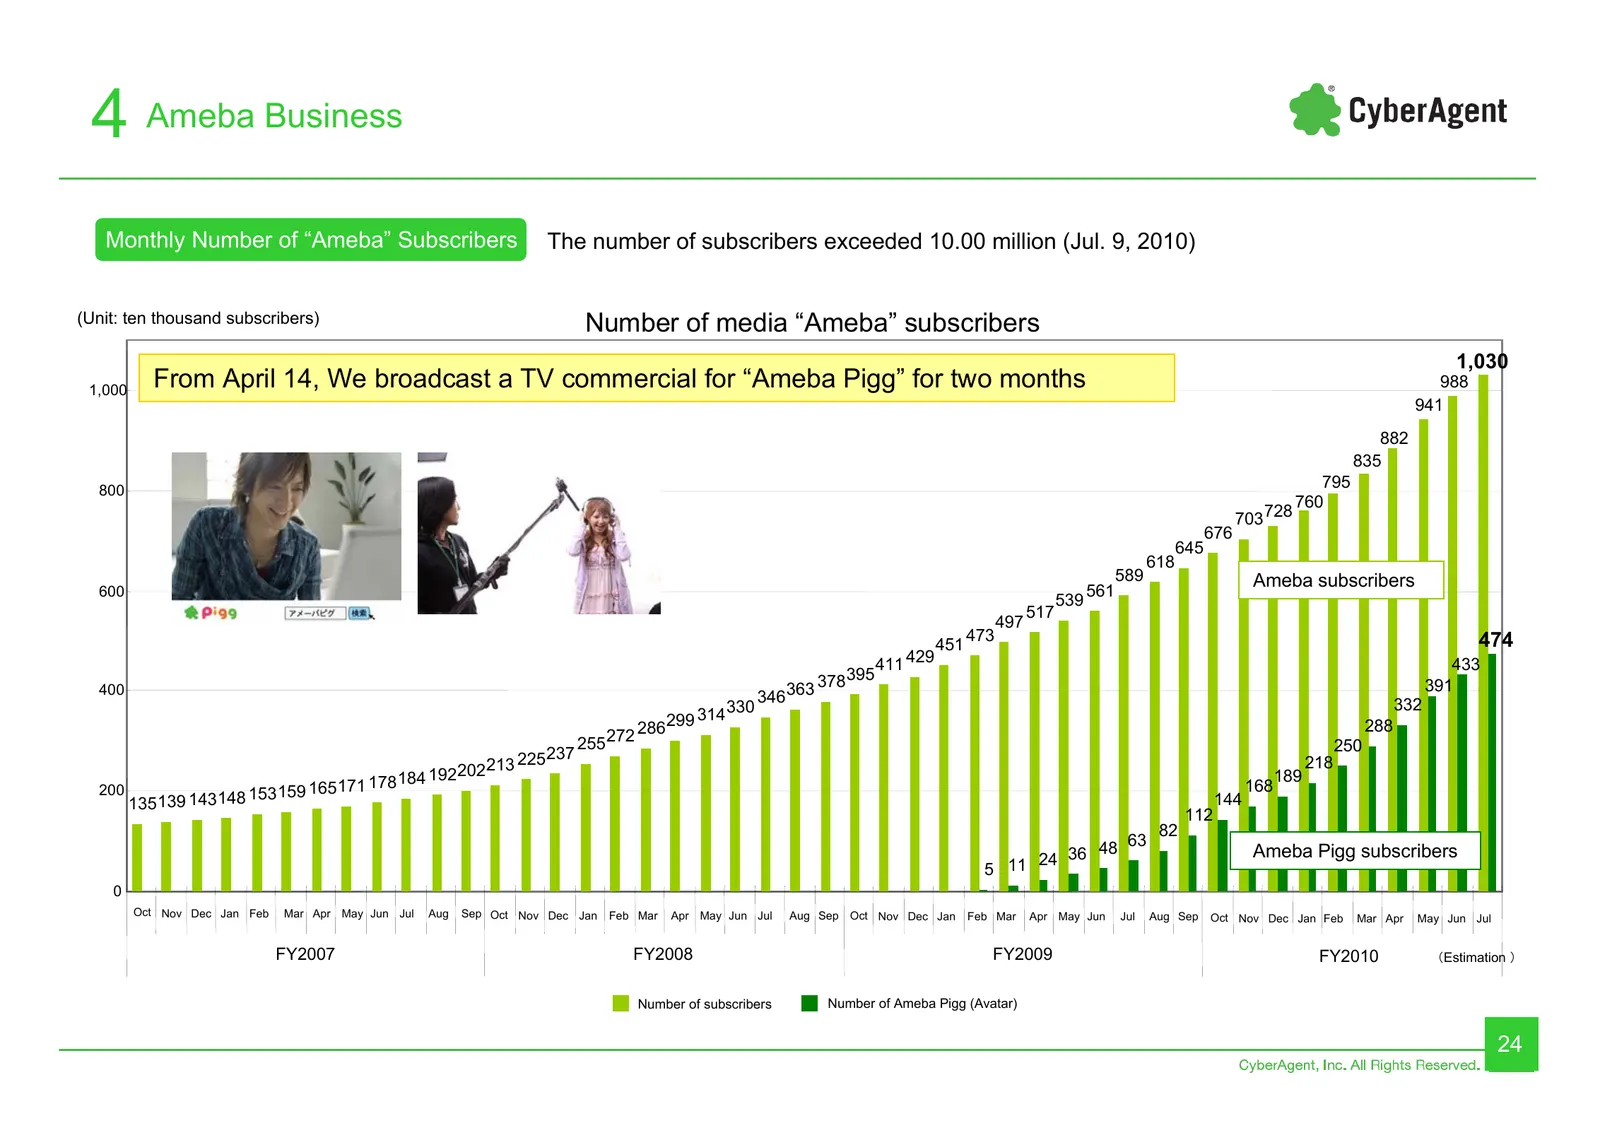
4 Ameba Business Monthly Number of “Ameba” Subscribers The number of subscribers exceeded 10.00 million (Jul. 9, 2010) (Unit: ten thousand subscribers) Number of media “Ameba” subscribers 1,030 1,000 From April 14, We broadcast a TV commercial for “Ameba Pigg” for two months 988 941 882 835 800 795
Slide 25: Quarterly Sales of Ameba Business
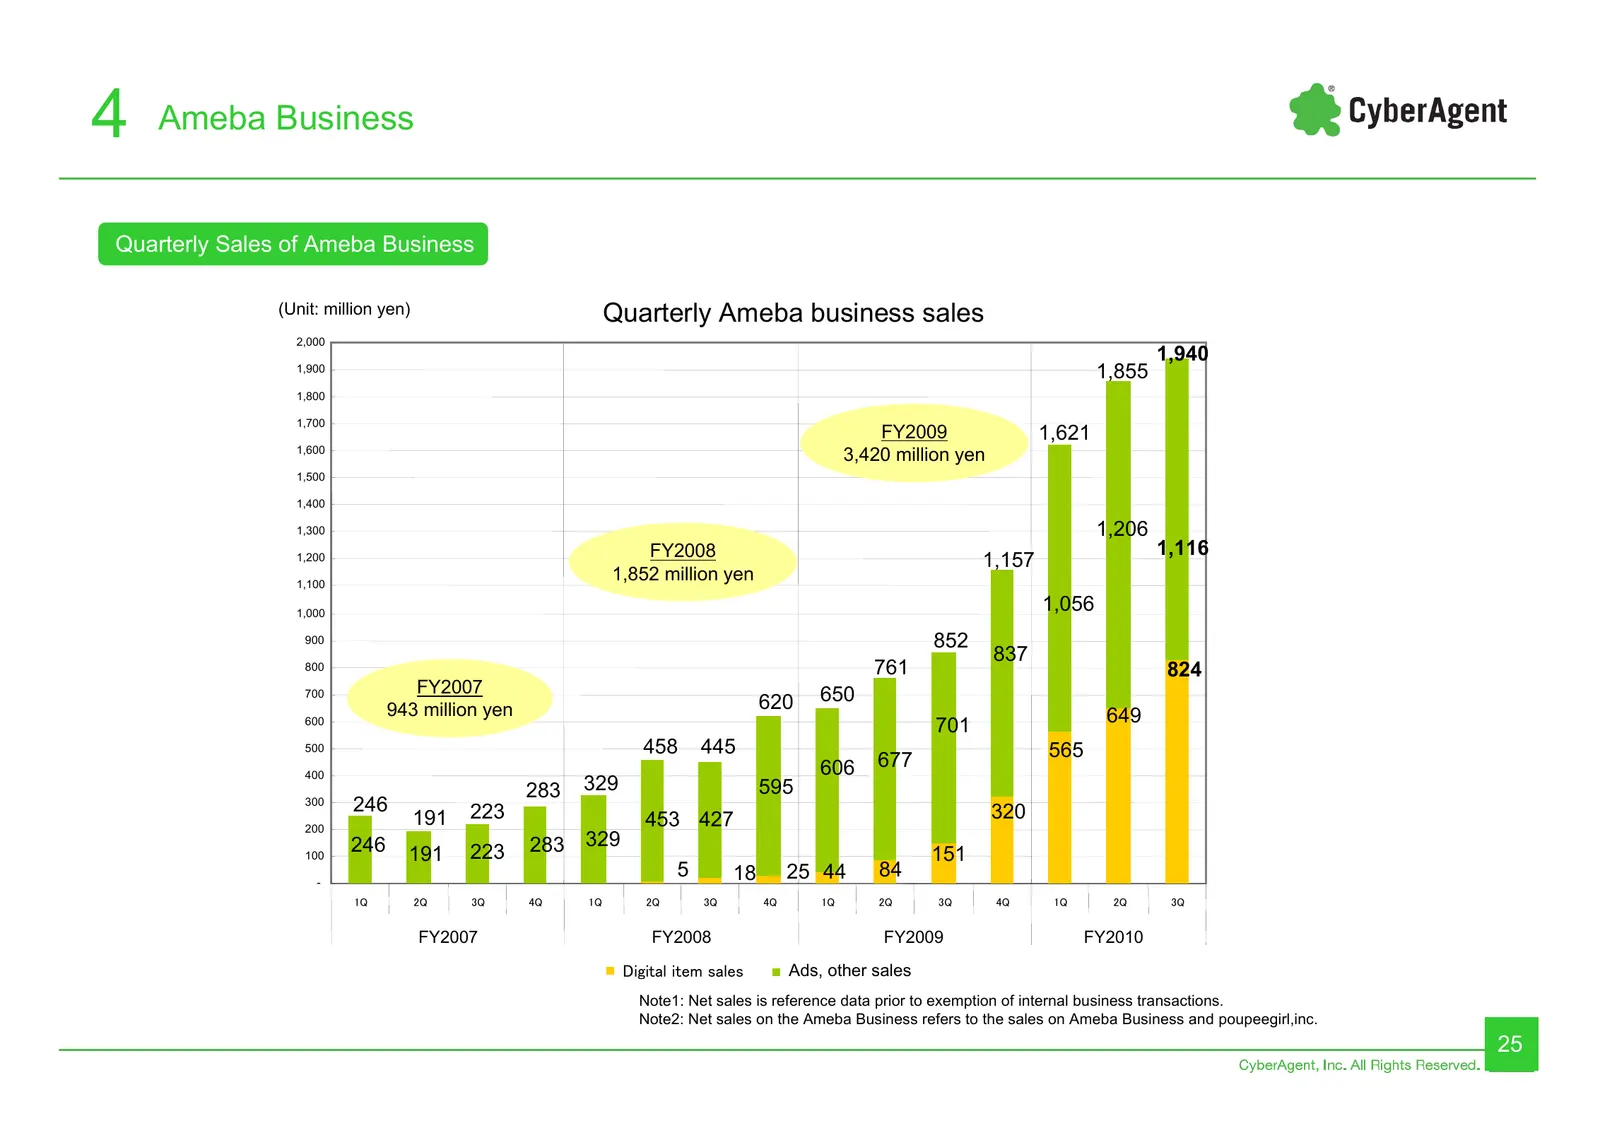
4 Ameba Business Ameba事業売上高(四半期) Quarterly Sales of Ameba Business (Unit: million yen) Quarterly Ameba business sales 2,000 1,940 1,900 1,855 1,800 1,700 FY2009 1,621 1,600 3,420 million yen 1,500 1,400 1,300 1,206 FY2008 1,116 1,200 1,157 1,100 1,852 million yen 1,000 1,056 900 852 837 800 761 824
Slide 26: Quarterly Ameba Business Ads Sales
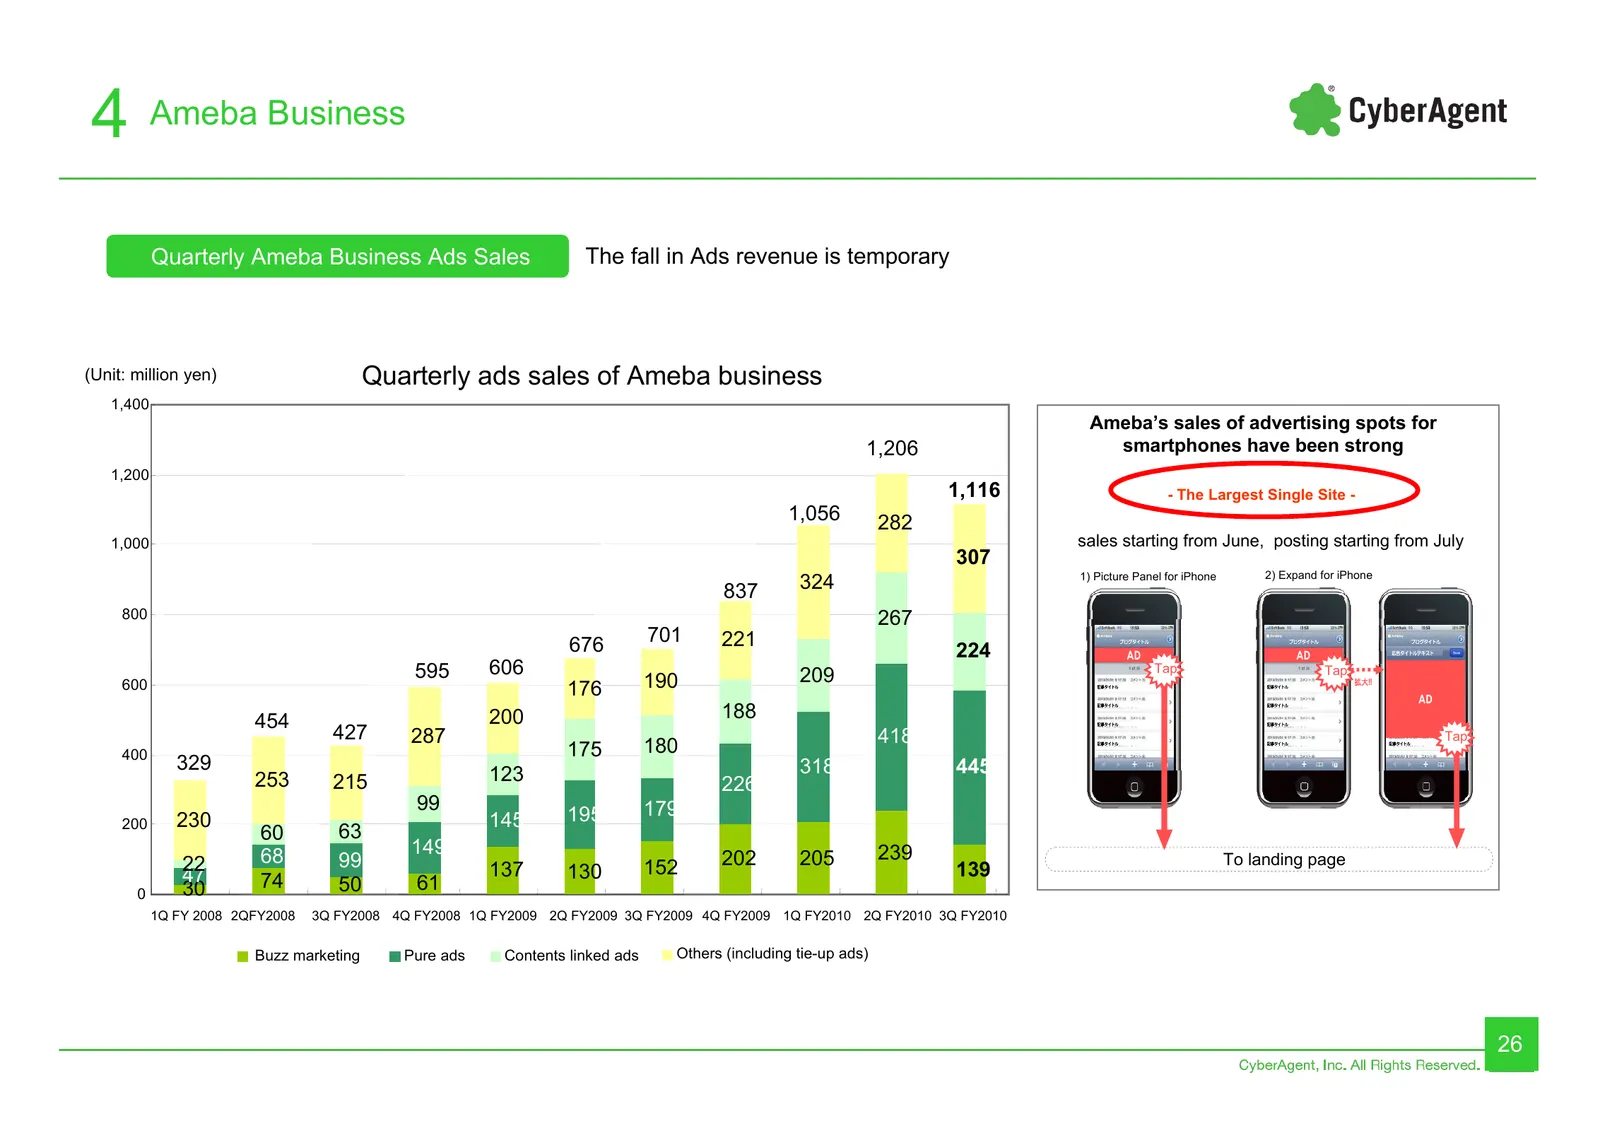
4 Ameba Business Quarterly Ameba Business Ads Sales The fall in Ads revenue is temporary (Unit: million yen) Quarterly ads sales of Ameba business 1,400 Ameba’s sales of advertising spots for 1,206 smartphones have been strong 1,200 1,116 - The Largest Single Site - 1,056 282 1,000 sales starting fr
Slide 27: Quarterly Digital Item Sales of Ameba Business
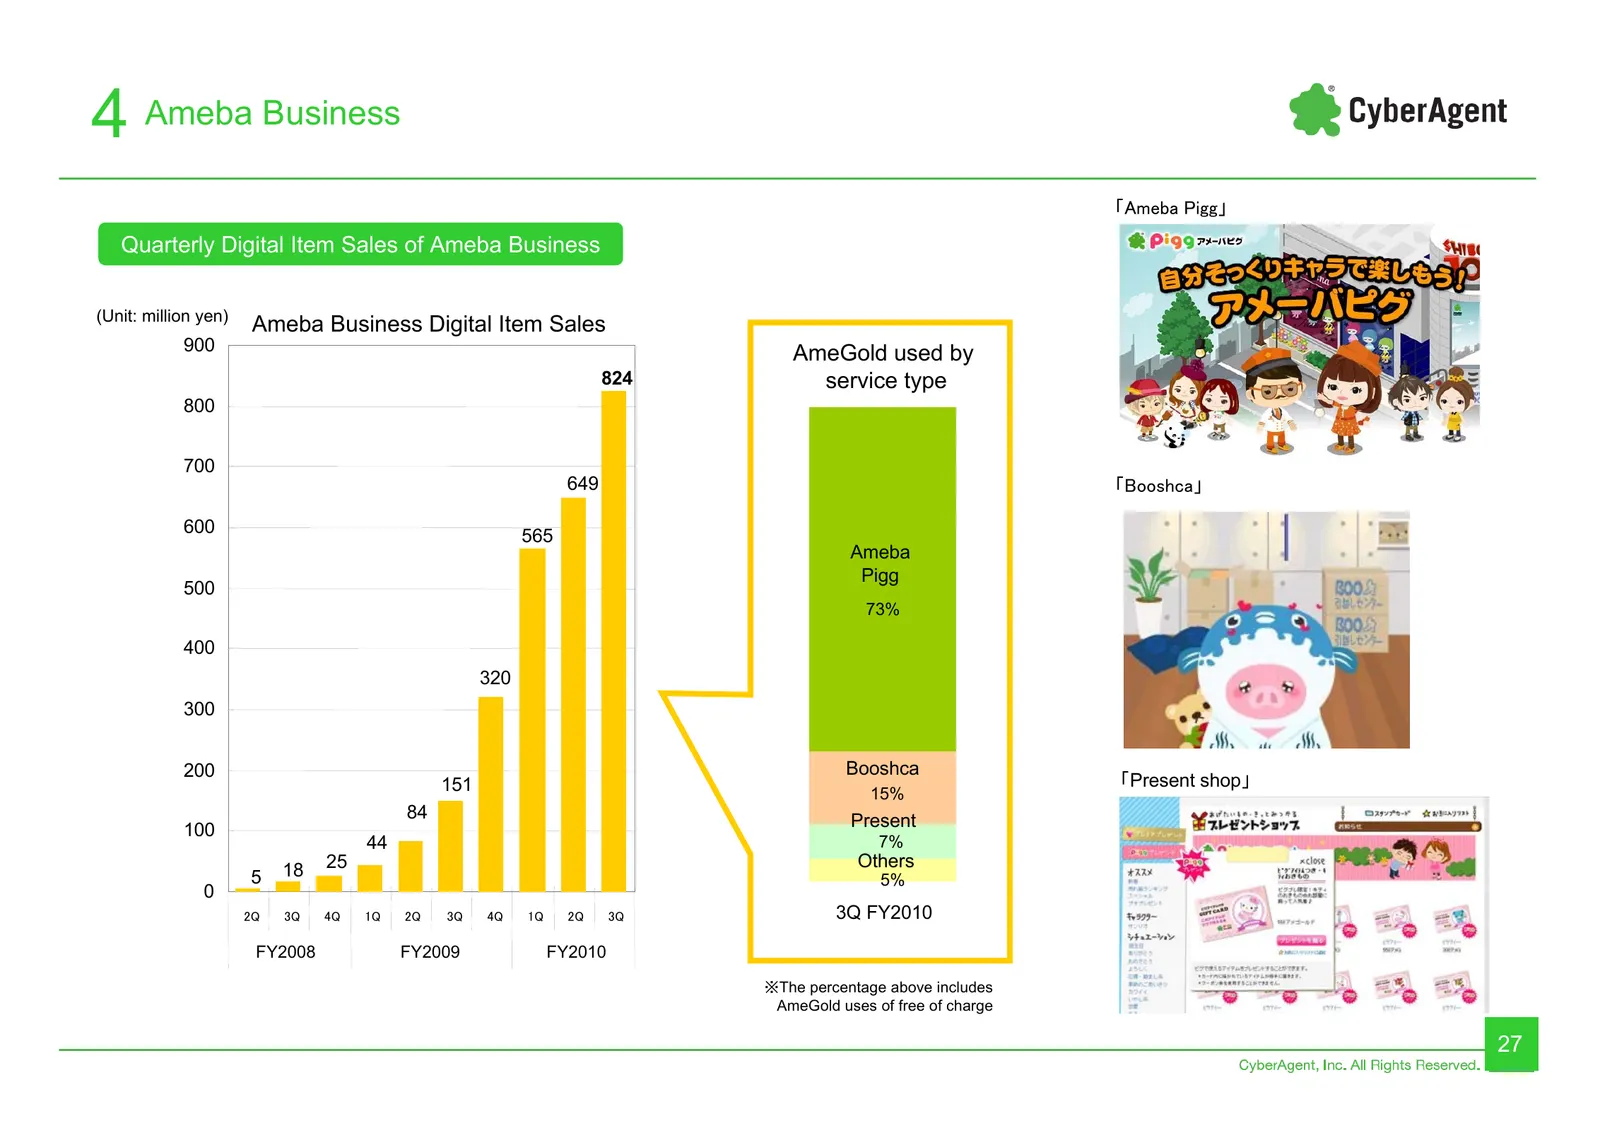
4 Ameba Business 「Ameba Pigg」 Quarterly Digital Item Sales of Ameba Business (Unit: million yen) Ameba Business Digital Item Sales 900 AmeGold used by 824 service type 800 700 649 「Booshca」 600 565 Ameba Pigg 500 73% 400 320 300 200 Booshca 151 「Present shop」 15% 84 Present 100 44 7% 18 25 Others 5
Slide 28: Ameba Pigg subscribers and ARPU
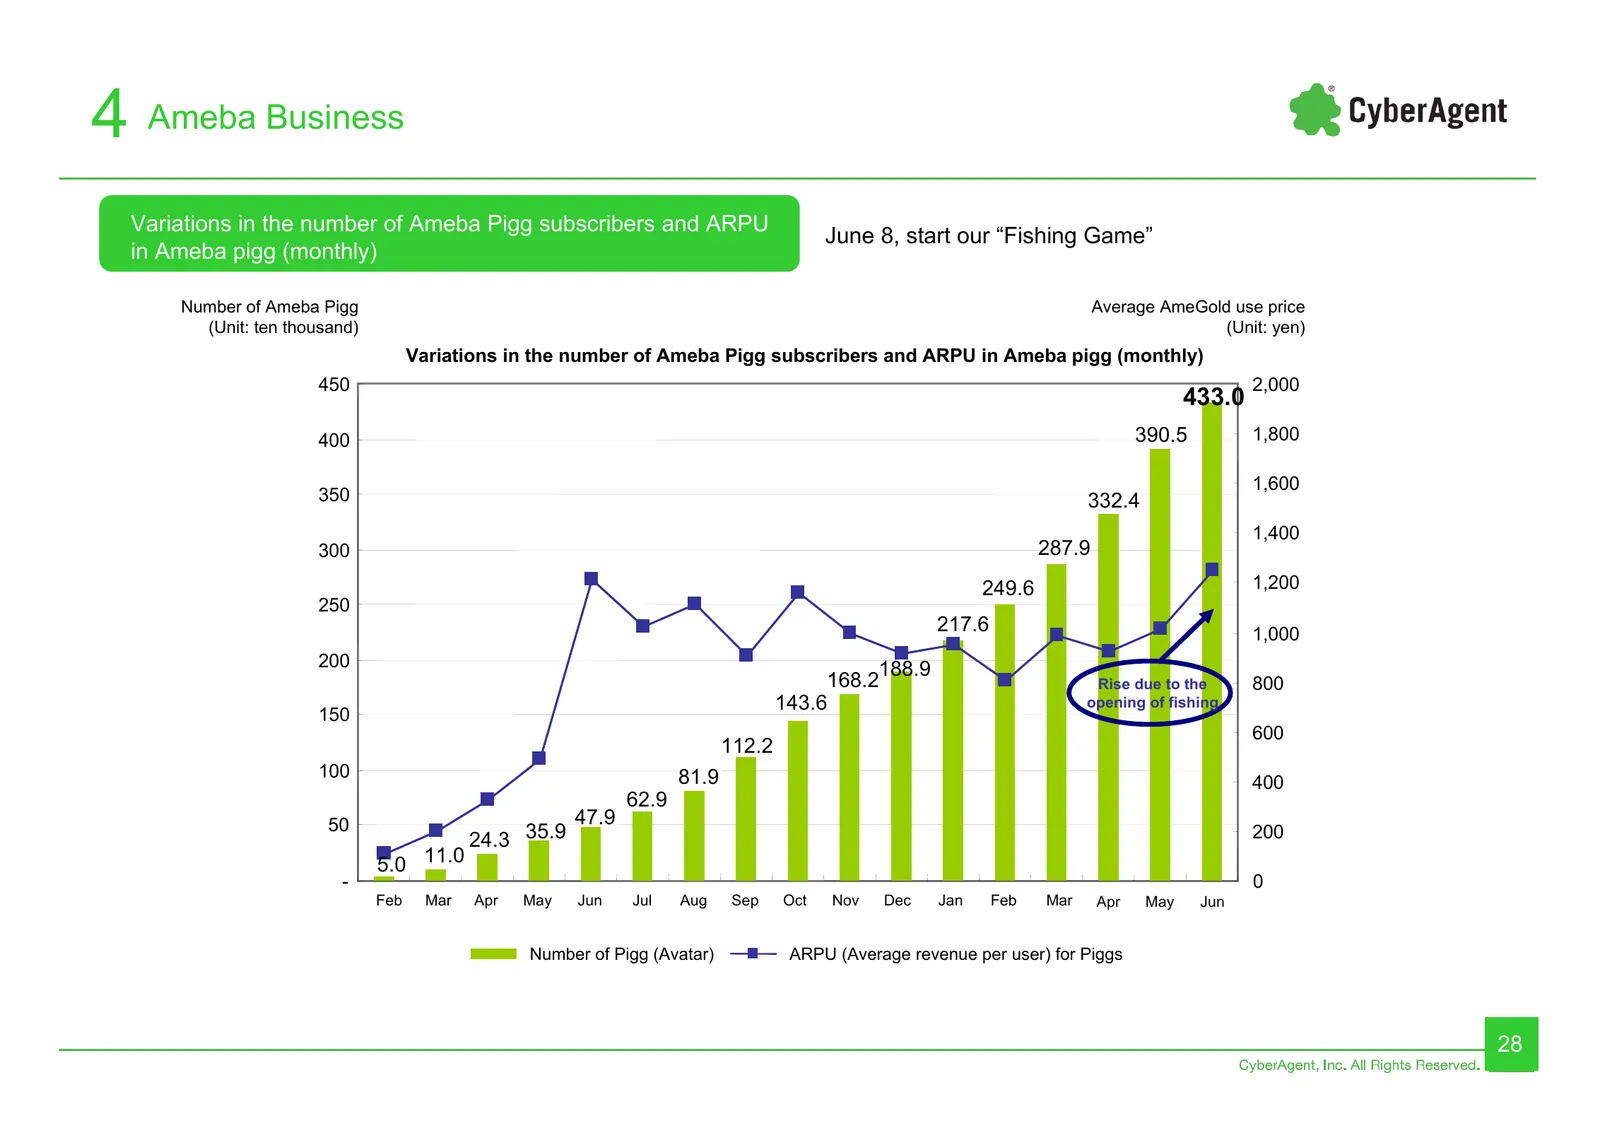
4 Ameba Business Variations in the number of Ameba Pigg subscribers and ARPU June 8, start our “Fishing Game” in Ameba pigg (monthly) Number of Ameba Pigg Average AmeGold use price (Unit: ten thousand) (Unit: yen) Variations in the number of Ameba Pigg subscribers and ARPU in Ameba pigg (monthly) 45
Slide 29: Ameba Pigg, leading our fee charges: fishing area
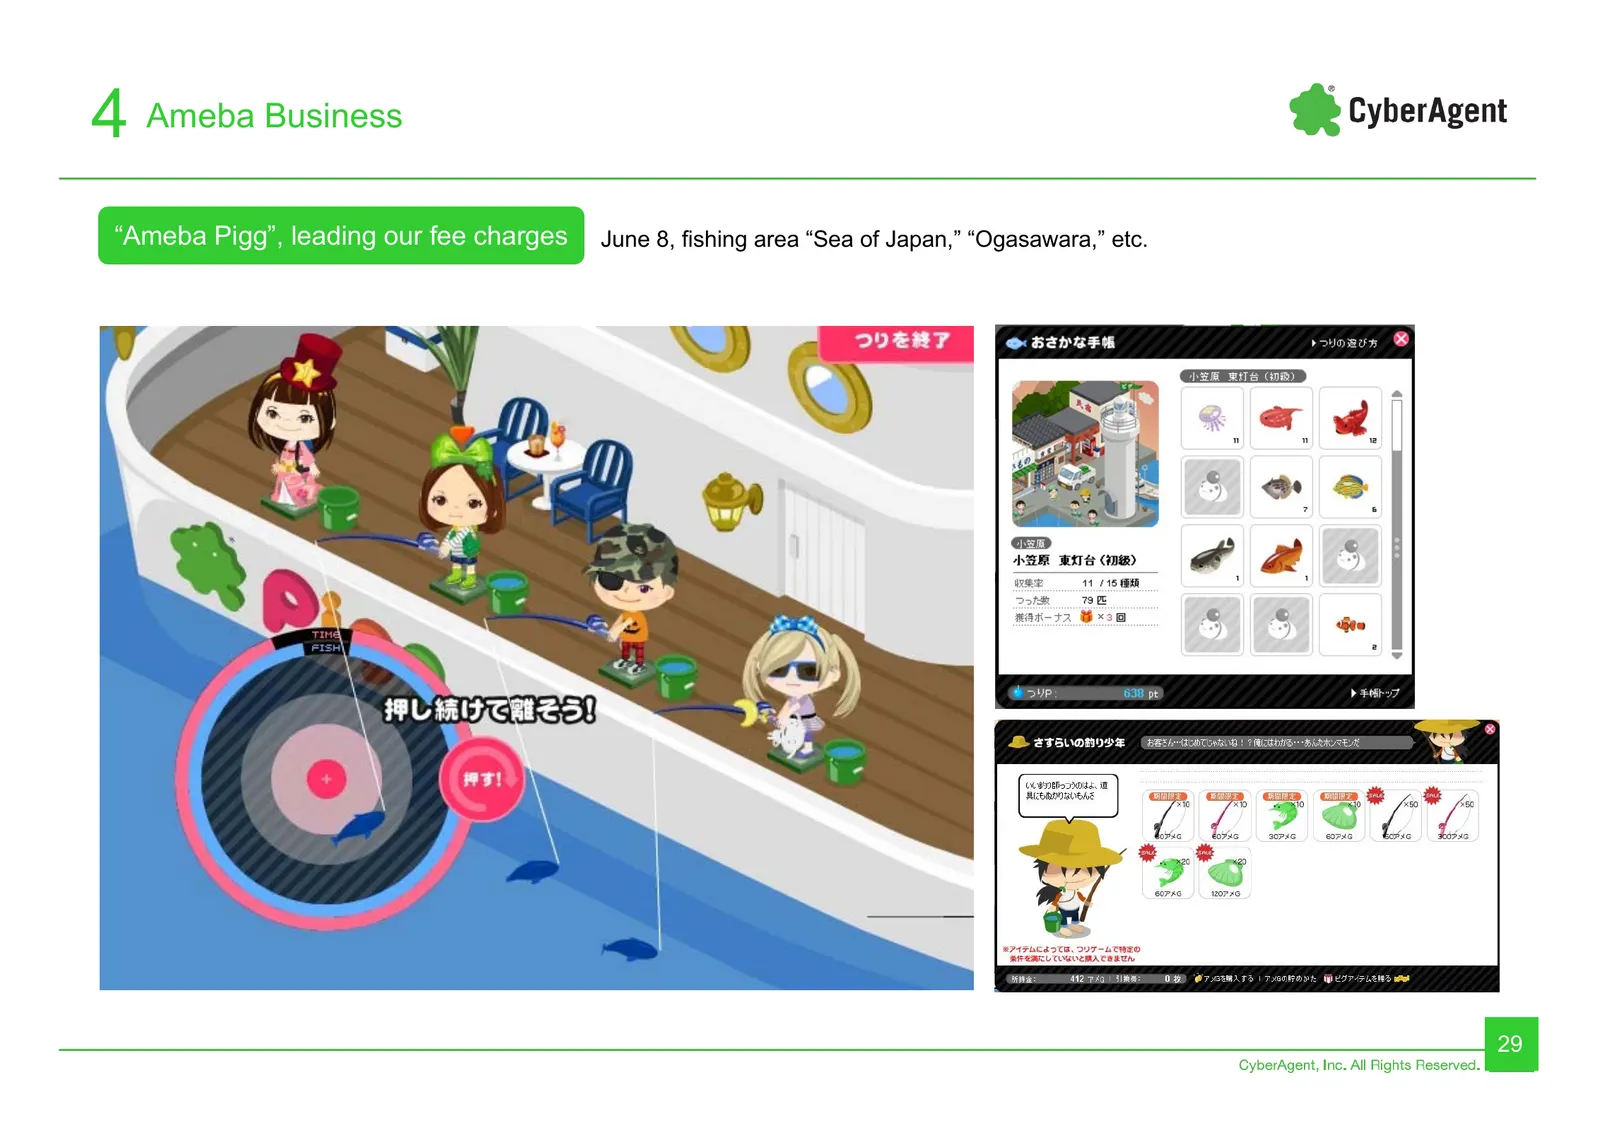
4 Ameba Business “Ameba Pigg”, leading our fee charges June 8, fishing area “Sea of Japan,” “Ogasawara,” etc. 29
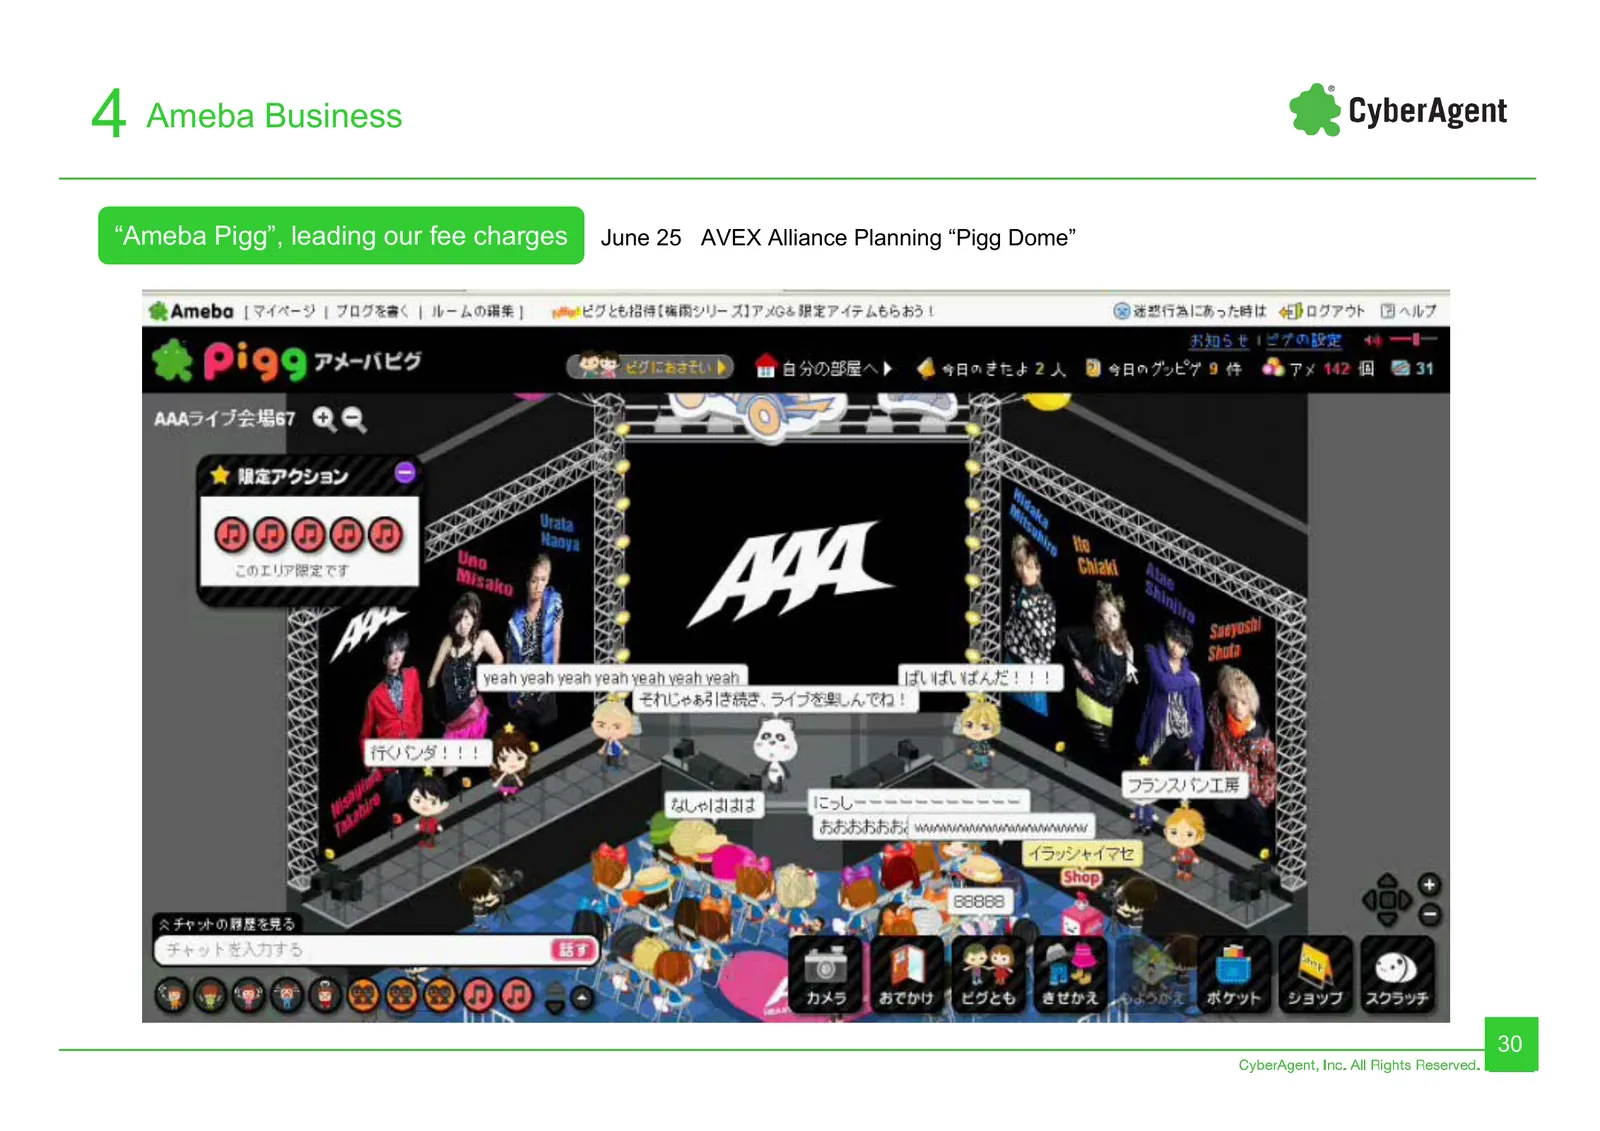
Slide 30: Ameba Pigg: Pigg Dome
4 Ameba Business “Ameba Pigg”, leading our fee charges June 25 AVEX Alliance Planning “Pigg Dome” 30
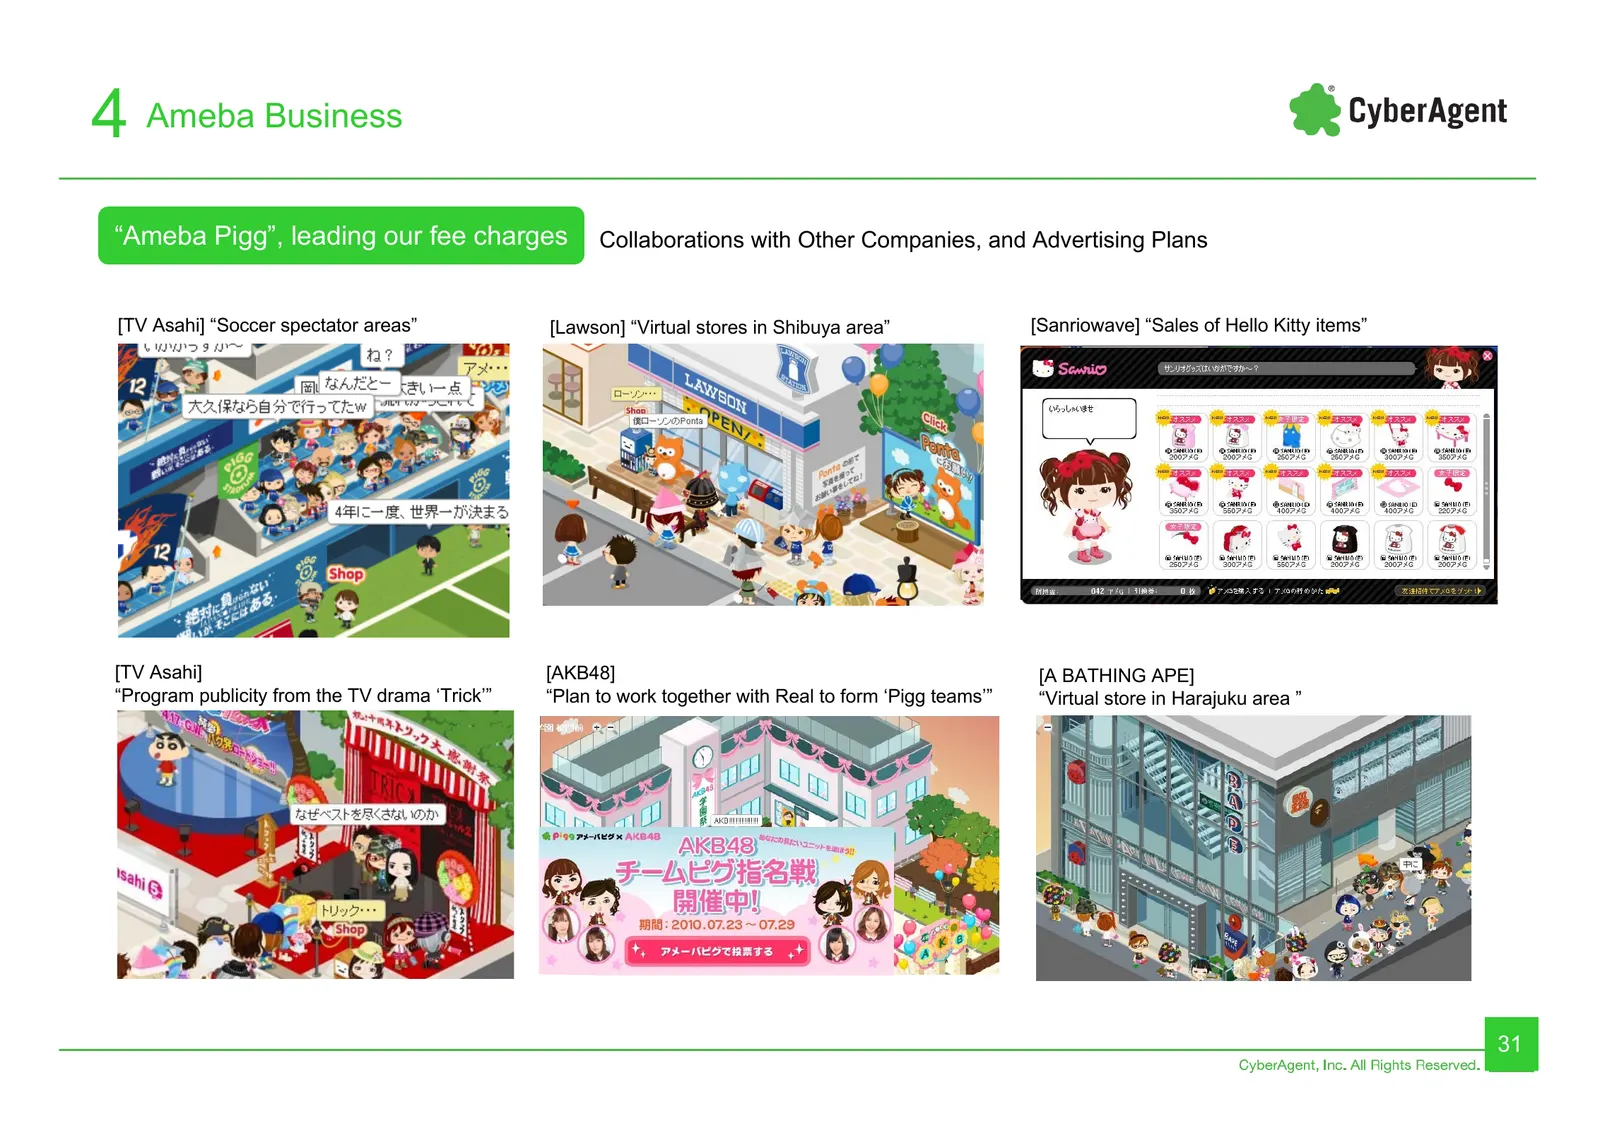
Slide 31: Collaborations with Other Companies, and Advertising Plans
4 Ameba Business “Ameba Pigg”, leading our fee charges Collaborations with Other Companies, and Advertising Plans [TV Asahi] “Soccer spectator areas” [Lawson] “Virtual stores in Shibuya area” [Sanriowave] “Sales of Hello Kitty items” [TV Asahi] [AKB48] [A BATHING APE] “Program publicity from the TV
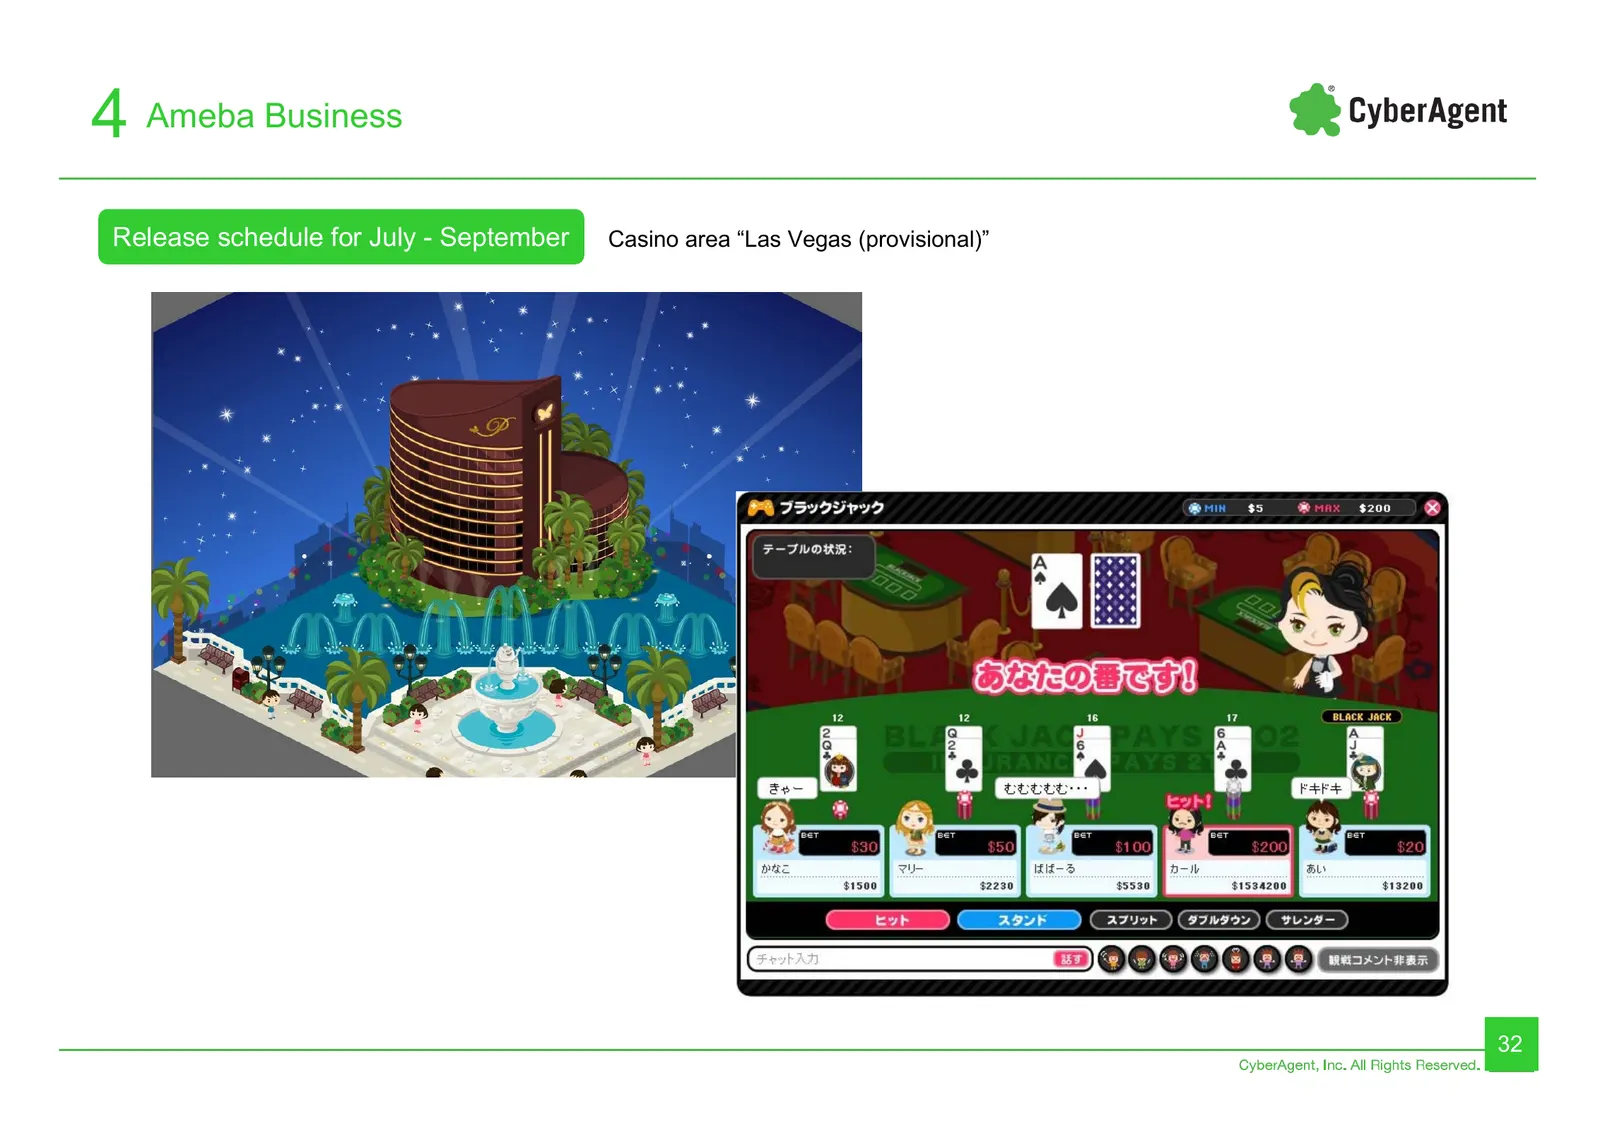
Slide 32: Release schedule for July - September: Casino area
4 Ameba Business Release schedule for July - September Casino area “Las Vegas (provisional)” 32
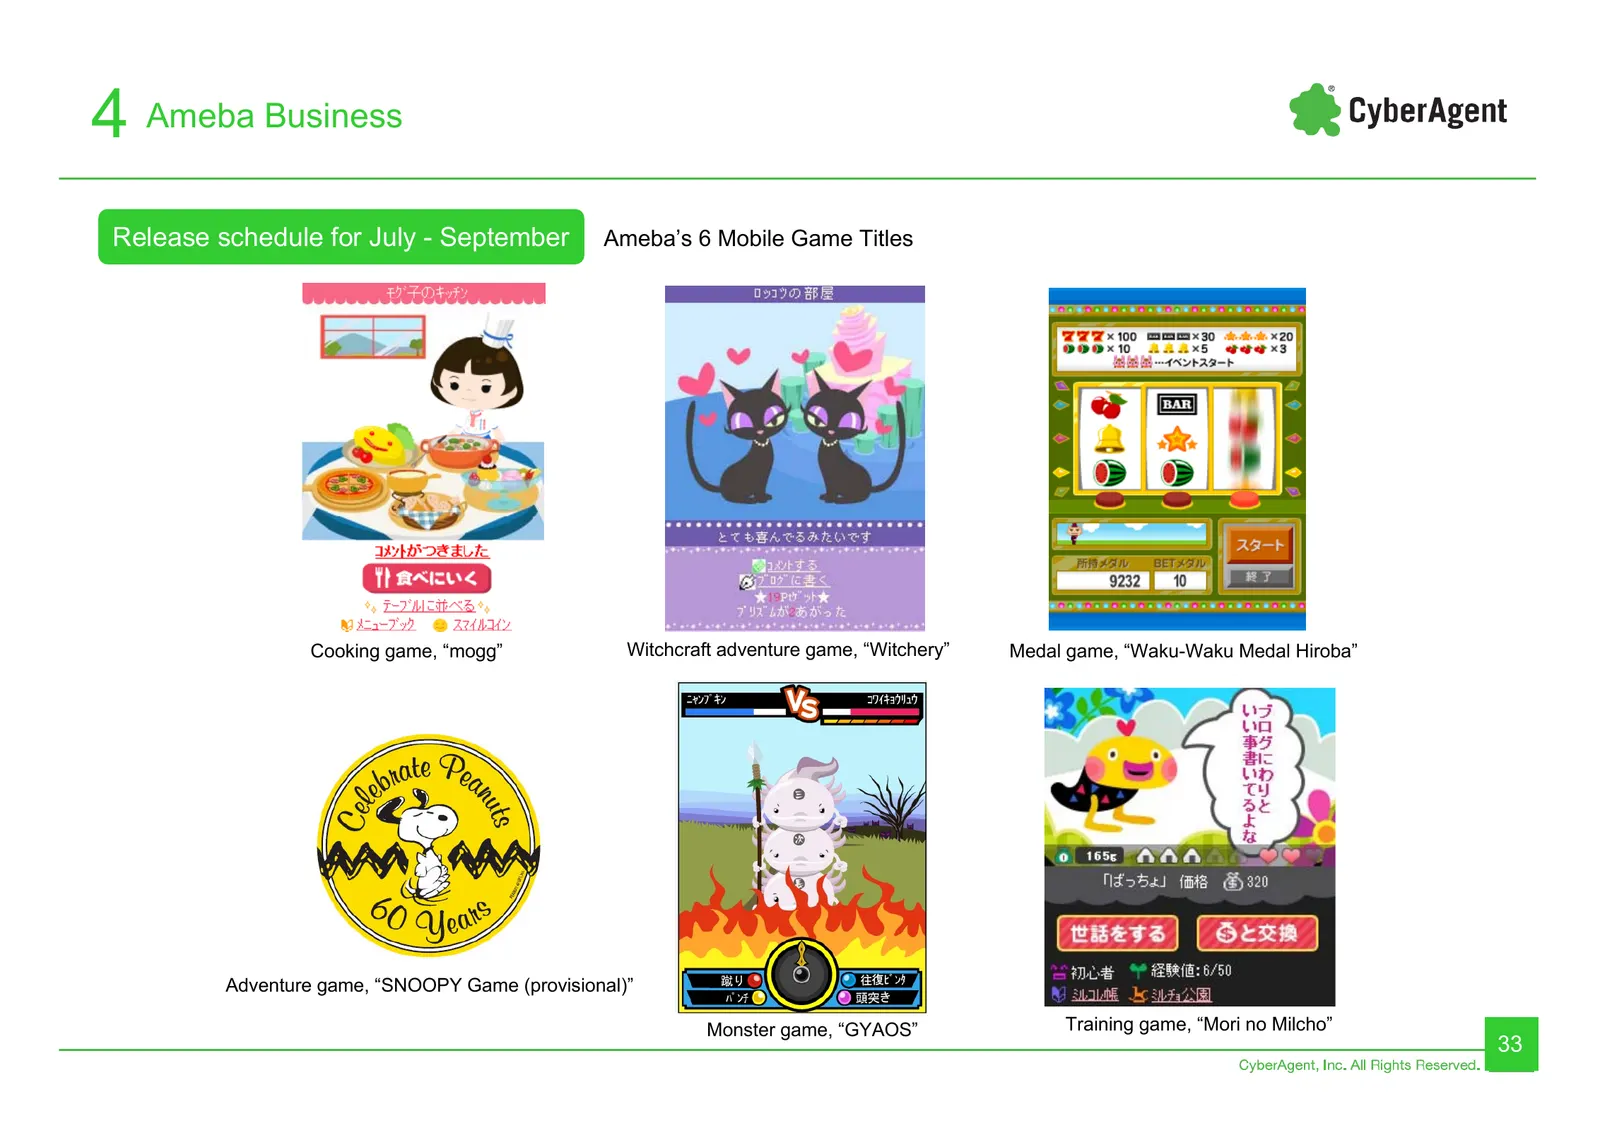
Slide 33: Release schedule: Ameba's 6 Mobile Game Titles
4 Ameba Business Release schedule for July - September Ameba’s 6 Mobile Game Titles Cooking game, “mogg” Witchcraft adventure game, “Witchery” Medal game, “Waku-Waku Medal Hiroba” Adventure game, “SNOOPY Game (provisional)” Monster game, “GYAOS” Training game, “Mori no Milcho” 33
Slide 34: Ameba Related Business Operating profit by quarter
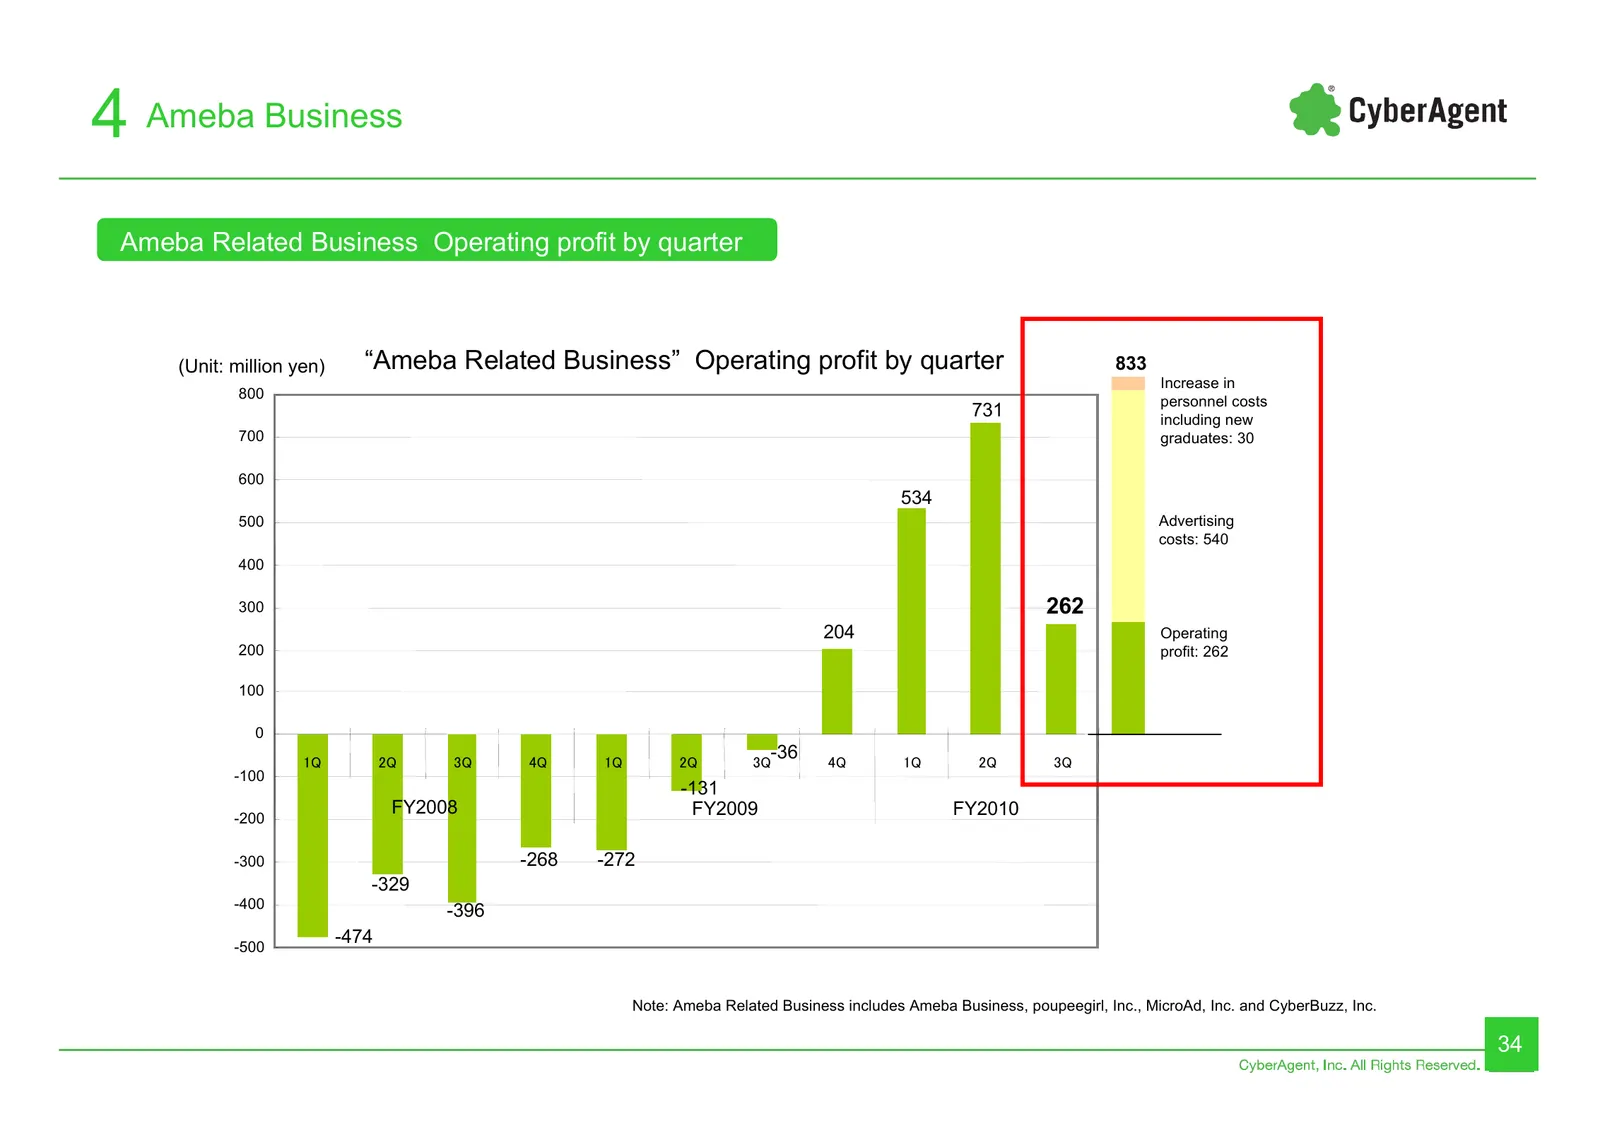
4 Ameba Business Ameba Related Business Operating 課金が好調profit by quarter (Unit: million yen) “Ameba Related Business” Operating profit by quarter 833 Increase in 800 personnel costs 731 including new 700 graduates: 30 600 534 500 Advertising costs: 540 400 300 262 204 Operating 200 profit: 262 100 0
Slide 35: Summary
5 Summary & CyberAgent Summary CyberAgent, Inc. All Rights Reserved.
Slide 36: Summary
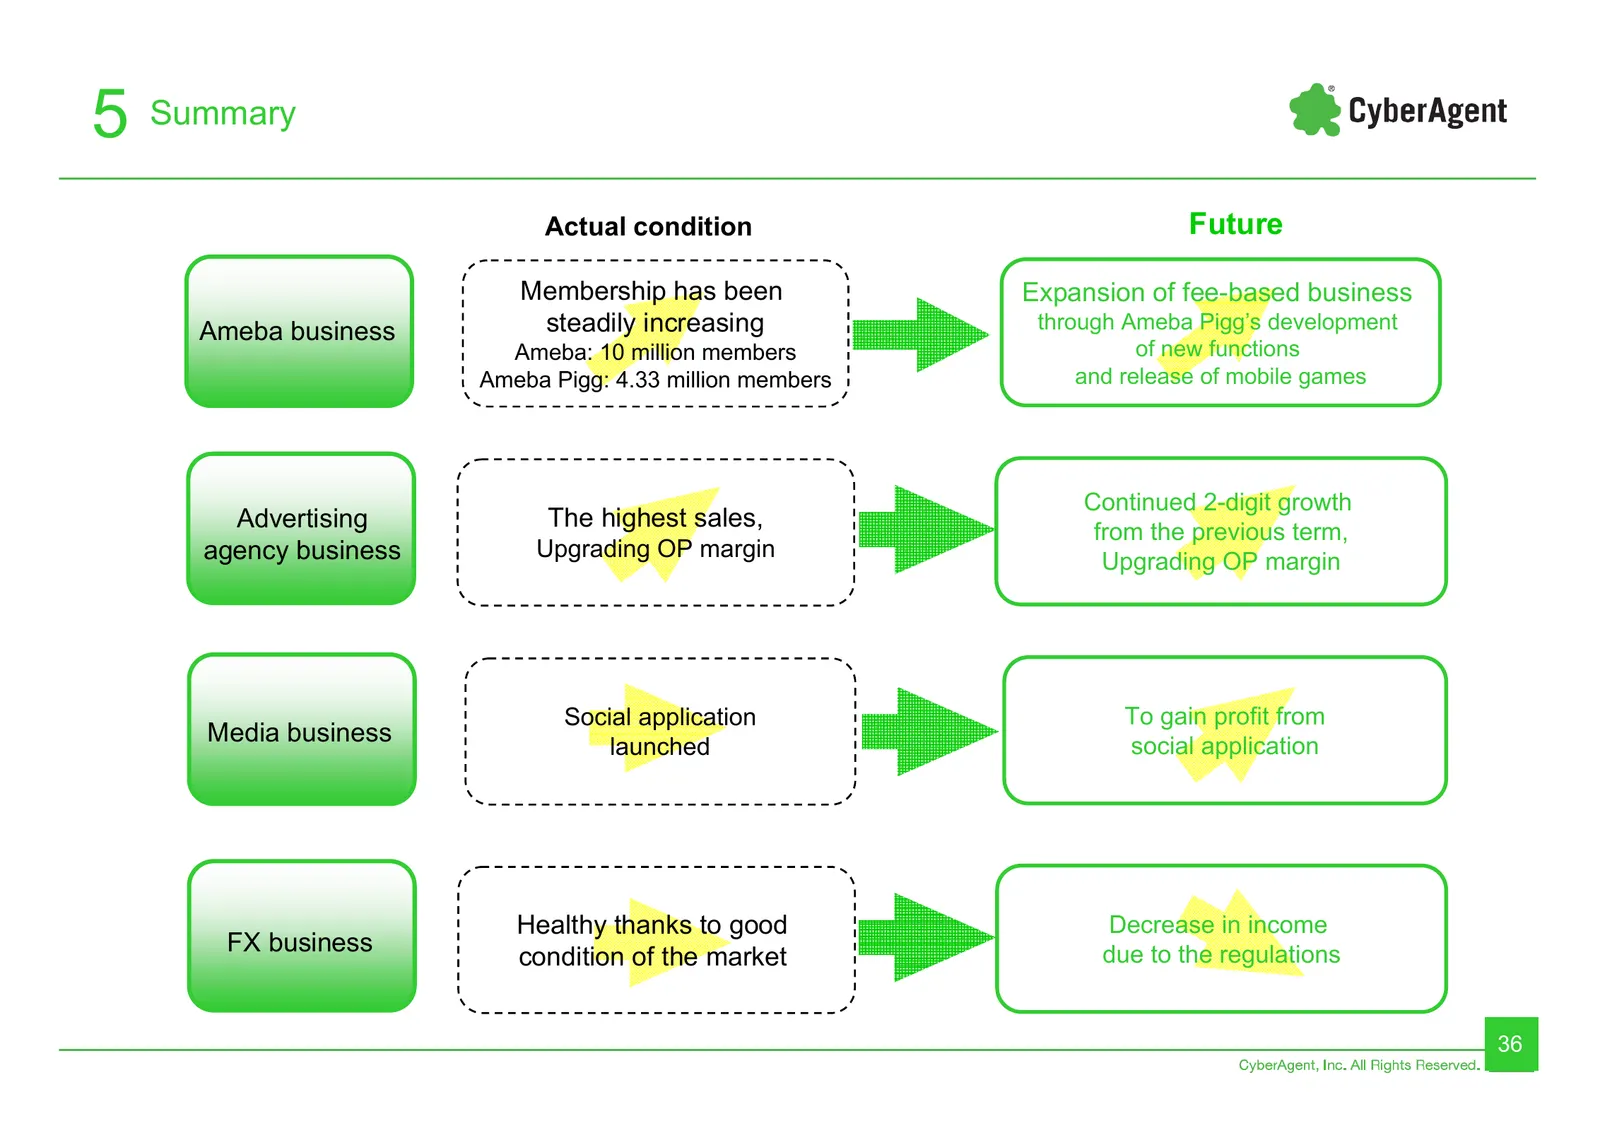
5 Summary Actual condition Future Membership has been Expansion of fee-based business Ameba business steadily increasing through Ameba Pigg’s development Ameba: 10 million members of new functions Ameba Pigg: 4.33 million members and release of mobile games Continued 2-digit growth Advertising The h
Slide 37: Transforming to highly profitable media company focusing on Ameba
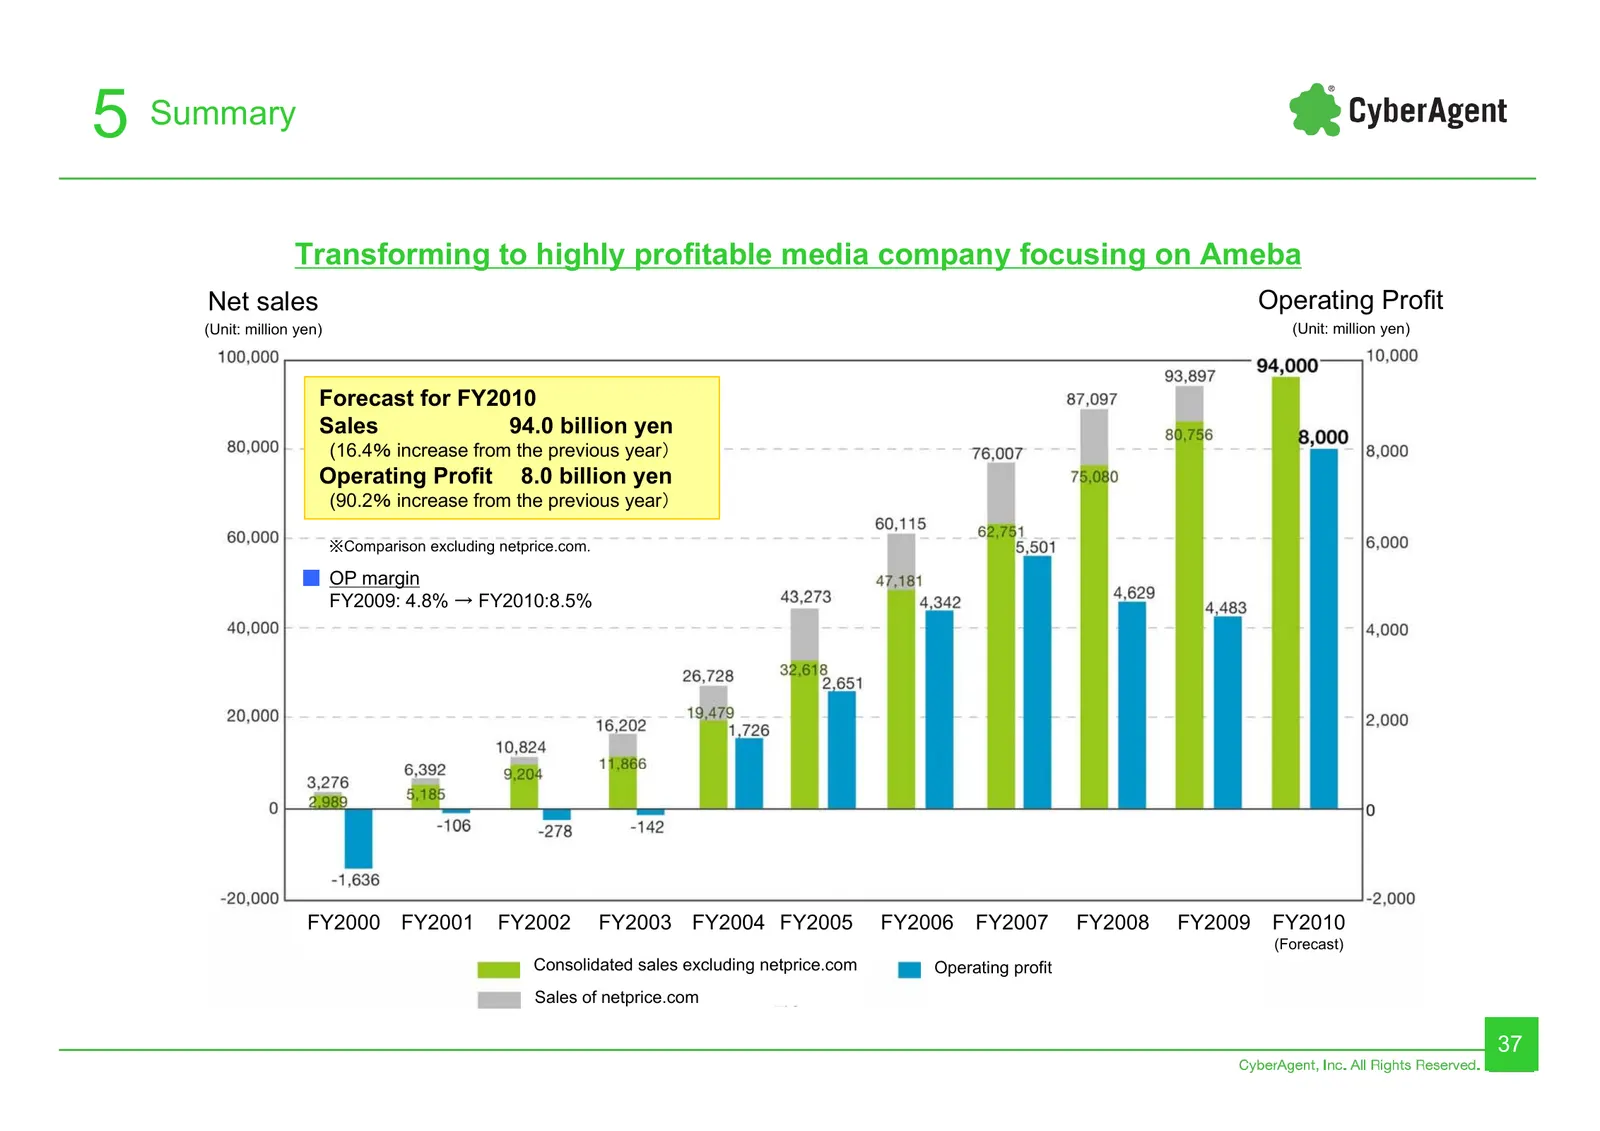
5 Summary Transforming to highly profitable media company focusing on Ameba Net sales Operating Profit (Unit: million yen) (Unit: million yen) Forecast for FY2010 Sales 94.0 billion yen (16.4% increase from the previous year) Operating Profit 8.0 billion yen (90.2% increase from the previous year) ※
Slide 38: We Create The Company that Symbolizes the 21st Century
5 Summary We Create The Company that Symbolizes the 21st Century. 38
Slide 39: Reference
Reference & CyberAgent Reference CyberAgent, Inc. All Rights Reserved.
Slide 40: What is Ameba Pigg?
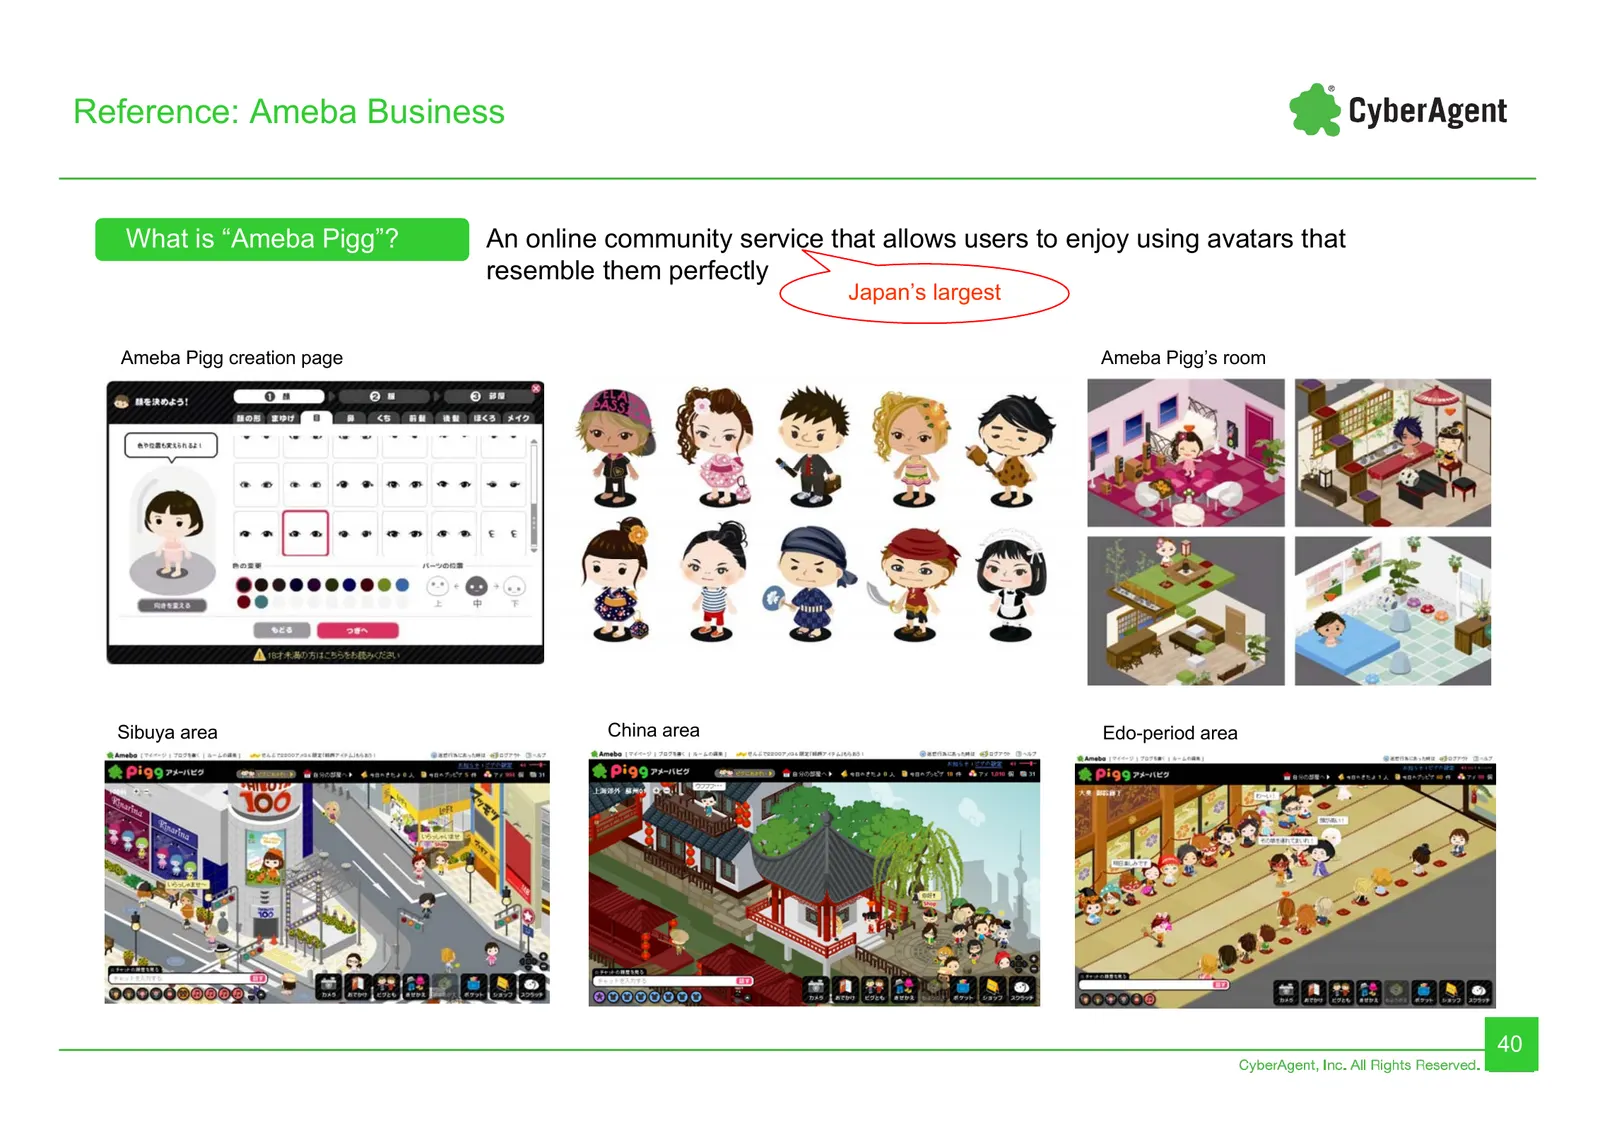
Reference: Ameba Business What is “Ameba Pigg”? An online community service that allows users to enjoy using avatars that resemble them perfectly Japan’s largest Ameba Pigg creation page Ameba Pigg’s room Sibuya area China area Edo-period area 40
Slide 41: Ameba Pigg's Earnings
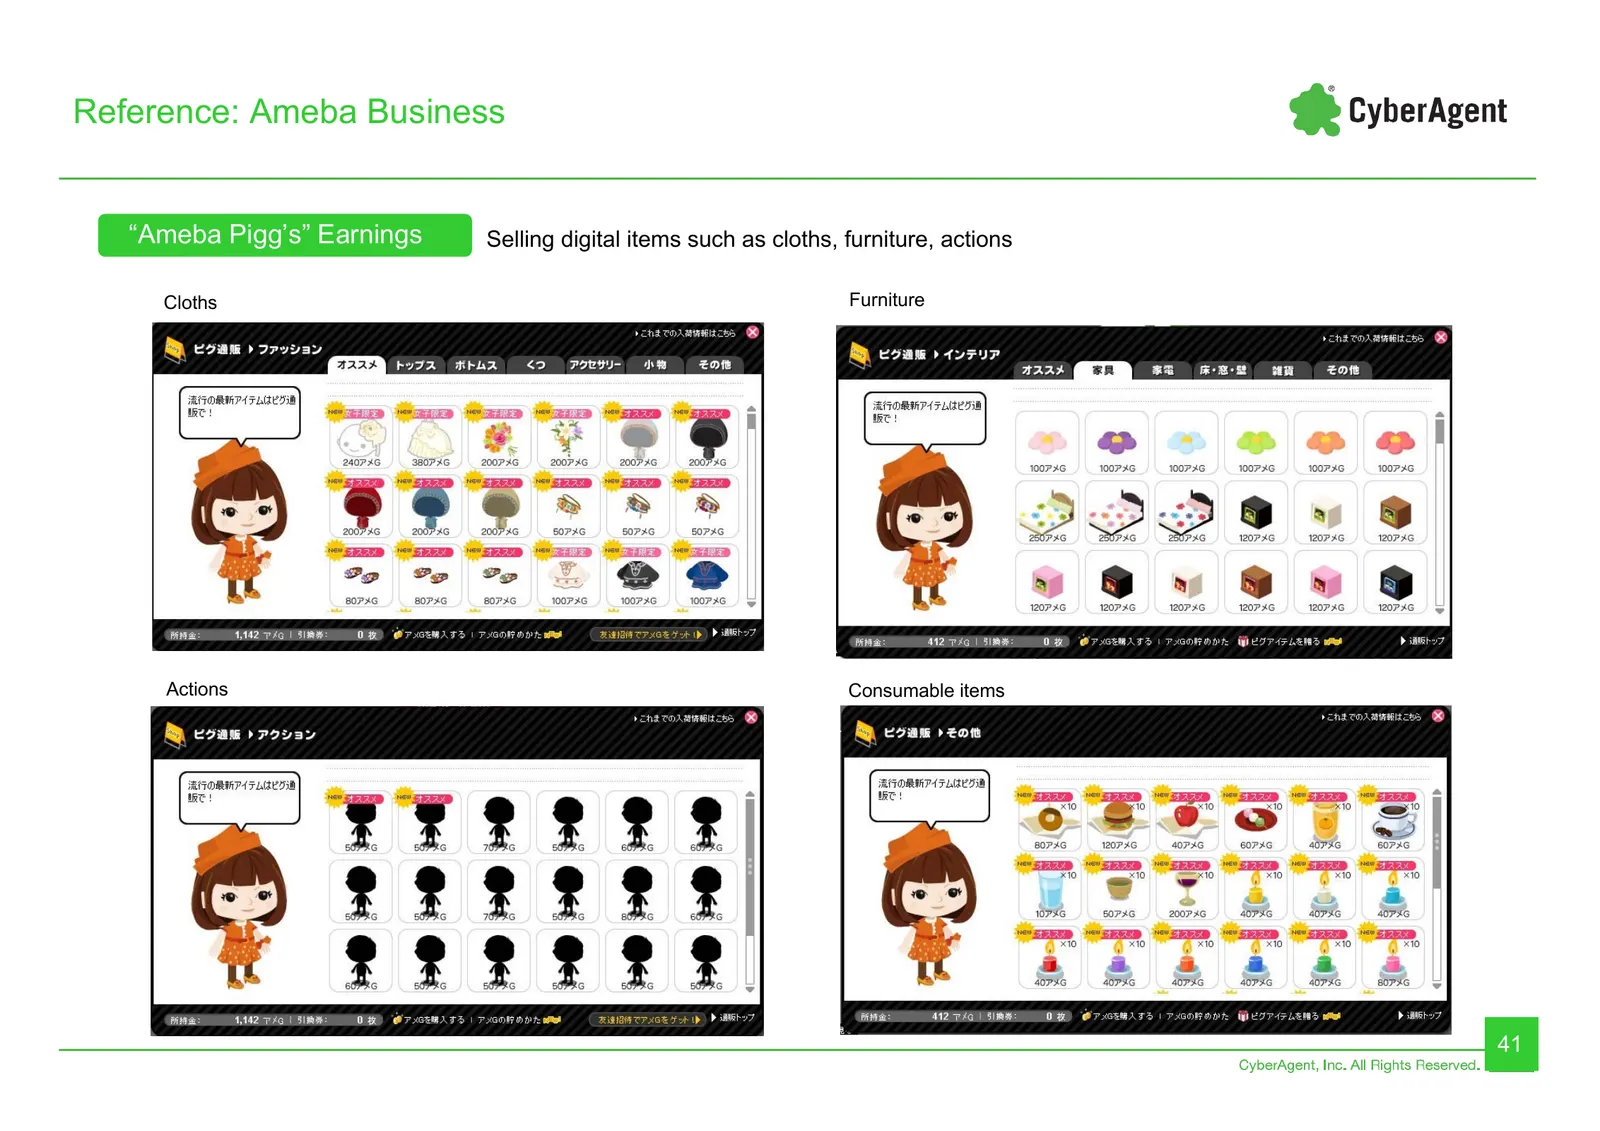
Reference: Ameba Business “Ameba Pigg’s” Earnings Selling digital items such as cloths, furniture, actions Cloths Furniture Actions Consumable items 41
Slide 42: Ameba Pigg's Earnings: Ame-Gold
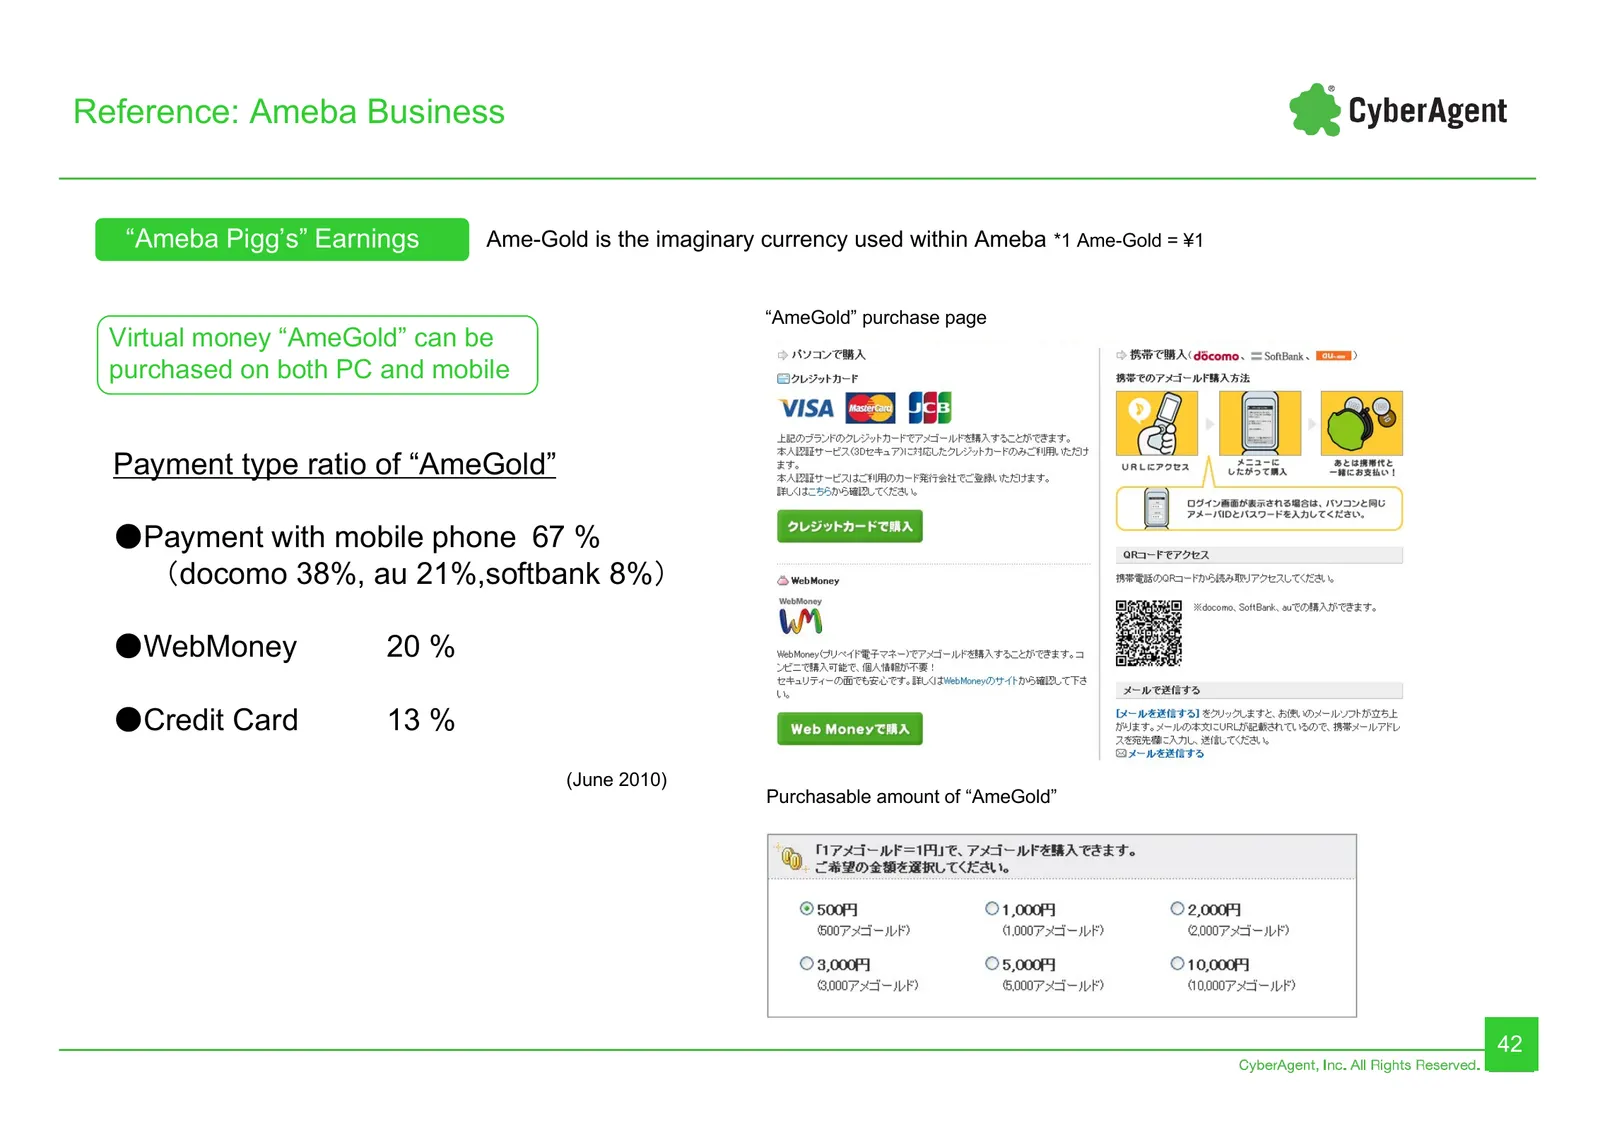
Reference: Ameba Business “Ameba Pigg’s” Earnings Ame-Gold is the imaginary currency used within Ameba *1 Ame-Gold = ¥1 “AmeGold” purchase page Virtual money “AmeGold” can be purchased on both PC and mobile Payment type ratio of “AmeGold” ●Payment with mobile phone 67 % (docomo 38%, au 21%,softbank
Slide 43: Attributes of People Purchasing Ame-Gold
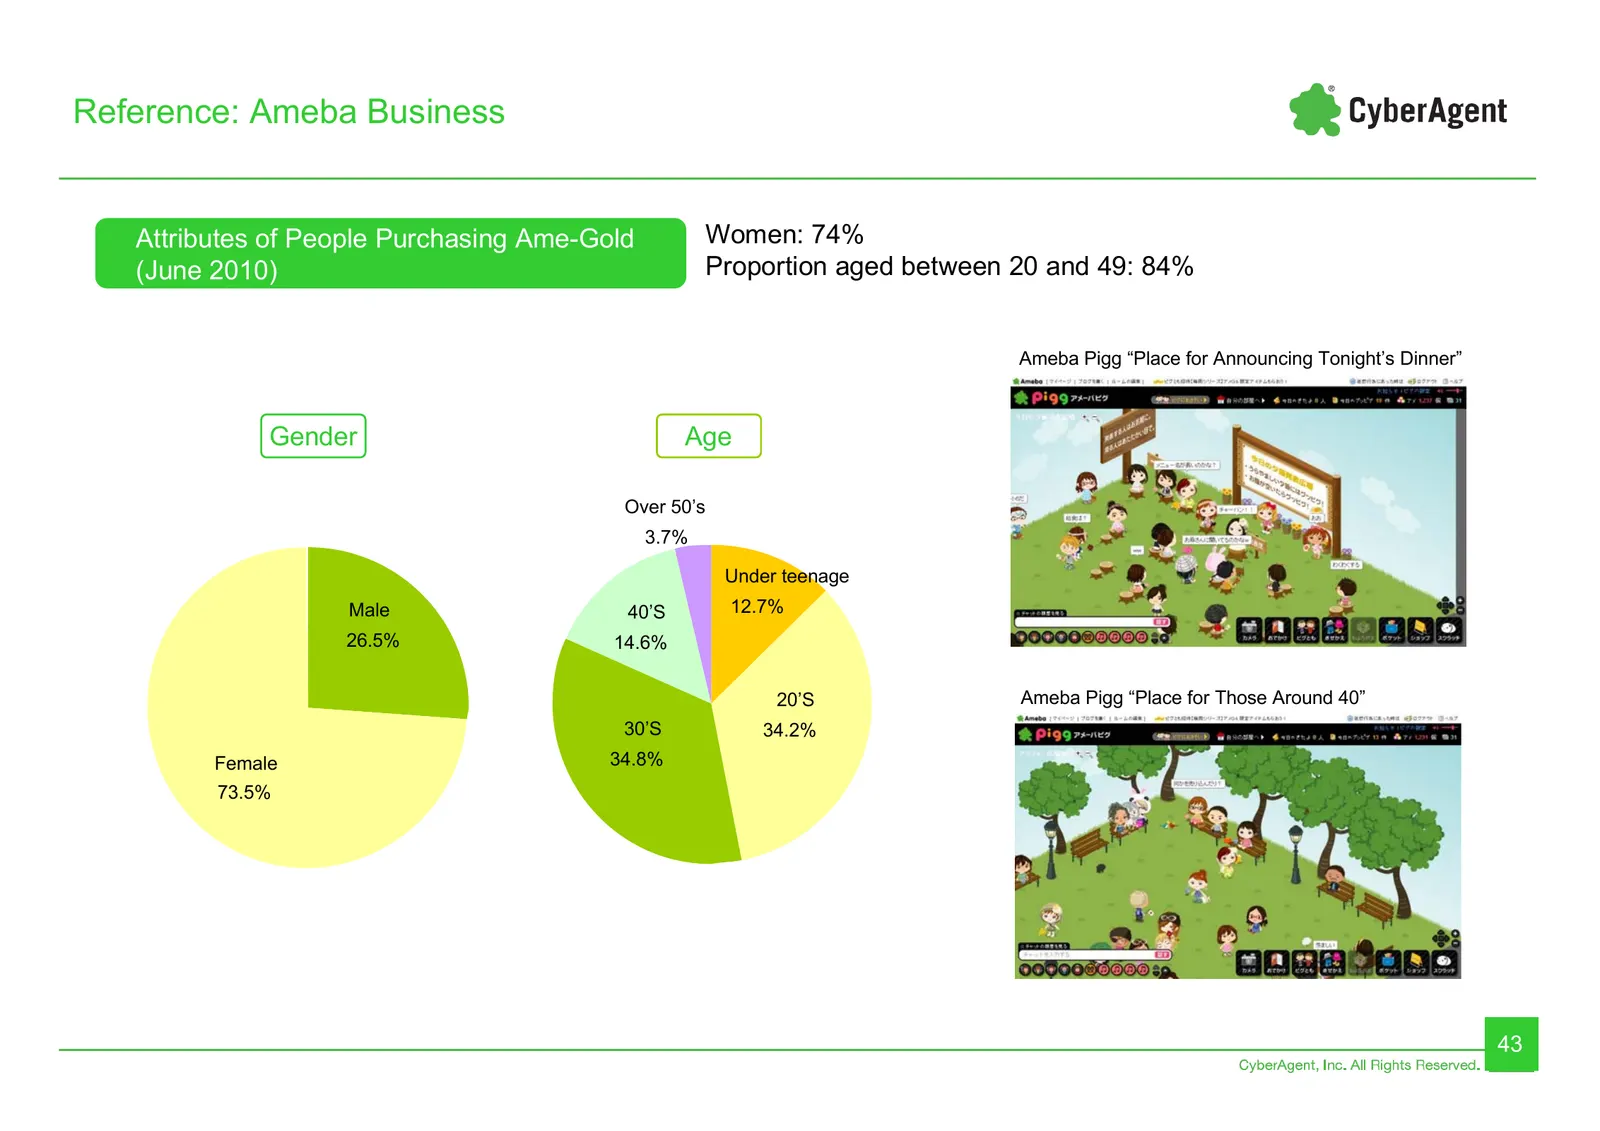
Reference: Ameba Business Attributes of People Purchasing Ame-Gold Women: 74% (June 2010) Proportion aged between 20 and 49: 84% Ameba Pigg “Place for Announcing Tonight’s Dinner” Gender Age Over 50’s 3.7% Under teenage Male 40’S 12.7% 26.5% 14.6% 20’S Ameba Pigg “Place for Those Around 40” 30’S 34.
Slide 44: Features of Ameba Pigg Community
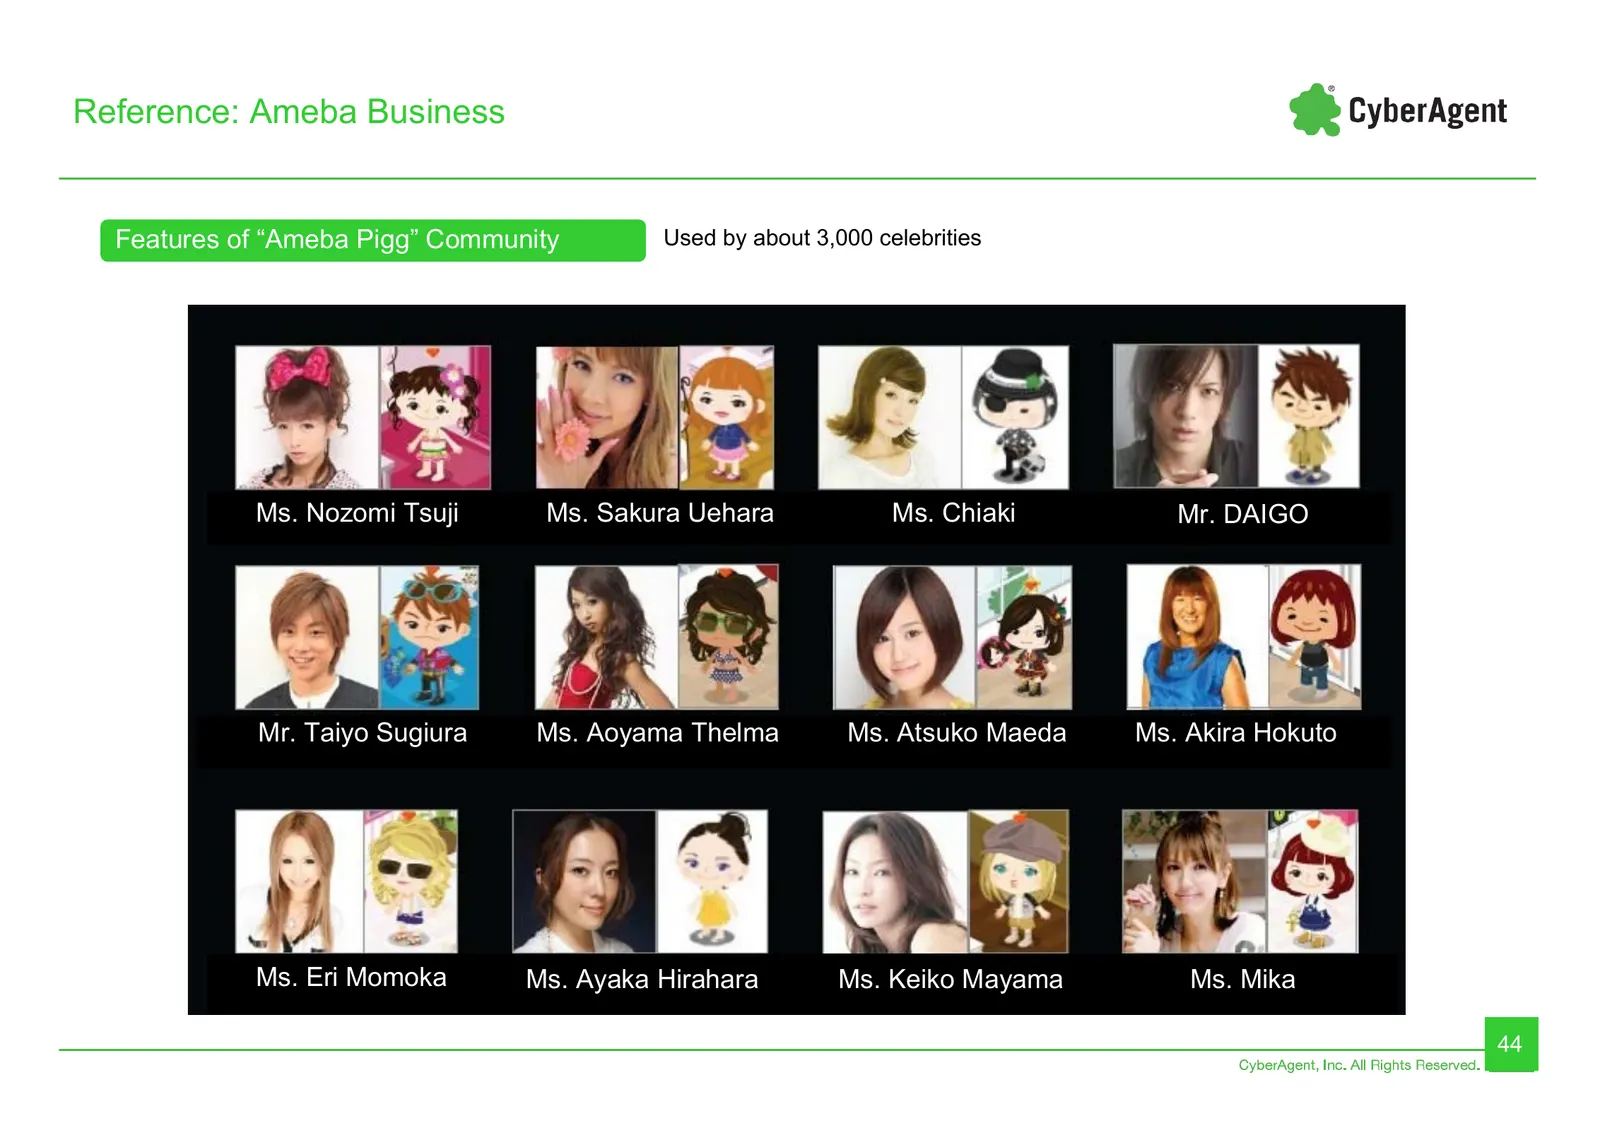
Reference: Ameba Business Features of “Ameba Pigg” Community Used by about 3,000 celebrities Ms. Nozomi Tsuji Ms. Sakura Uehara Ms. Chiaki Mr. DAIGO Mr. Taiyo Sugiura Ms. Aoyama Thelma Ms. Atsuko Maeda Ms. Akira Hokuto Ms. Eri Momoka Ms. Ayaka Hirahara Ms. Keiko Mayama Ms. Mika 44
Slide 45: Characteristics of Ameba Pigg Community
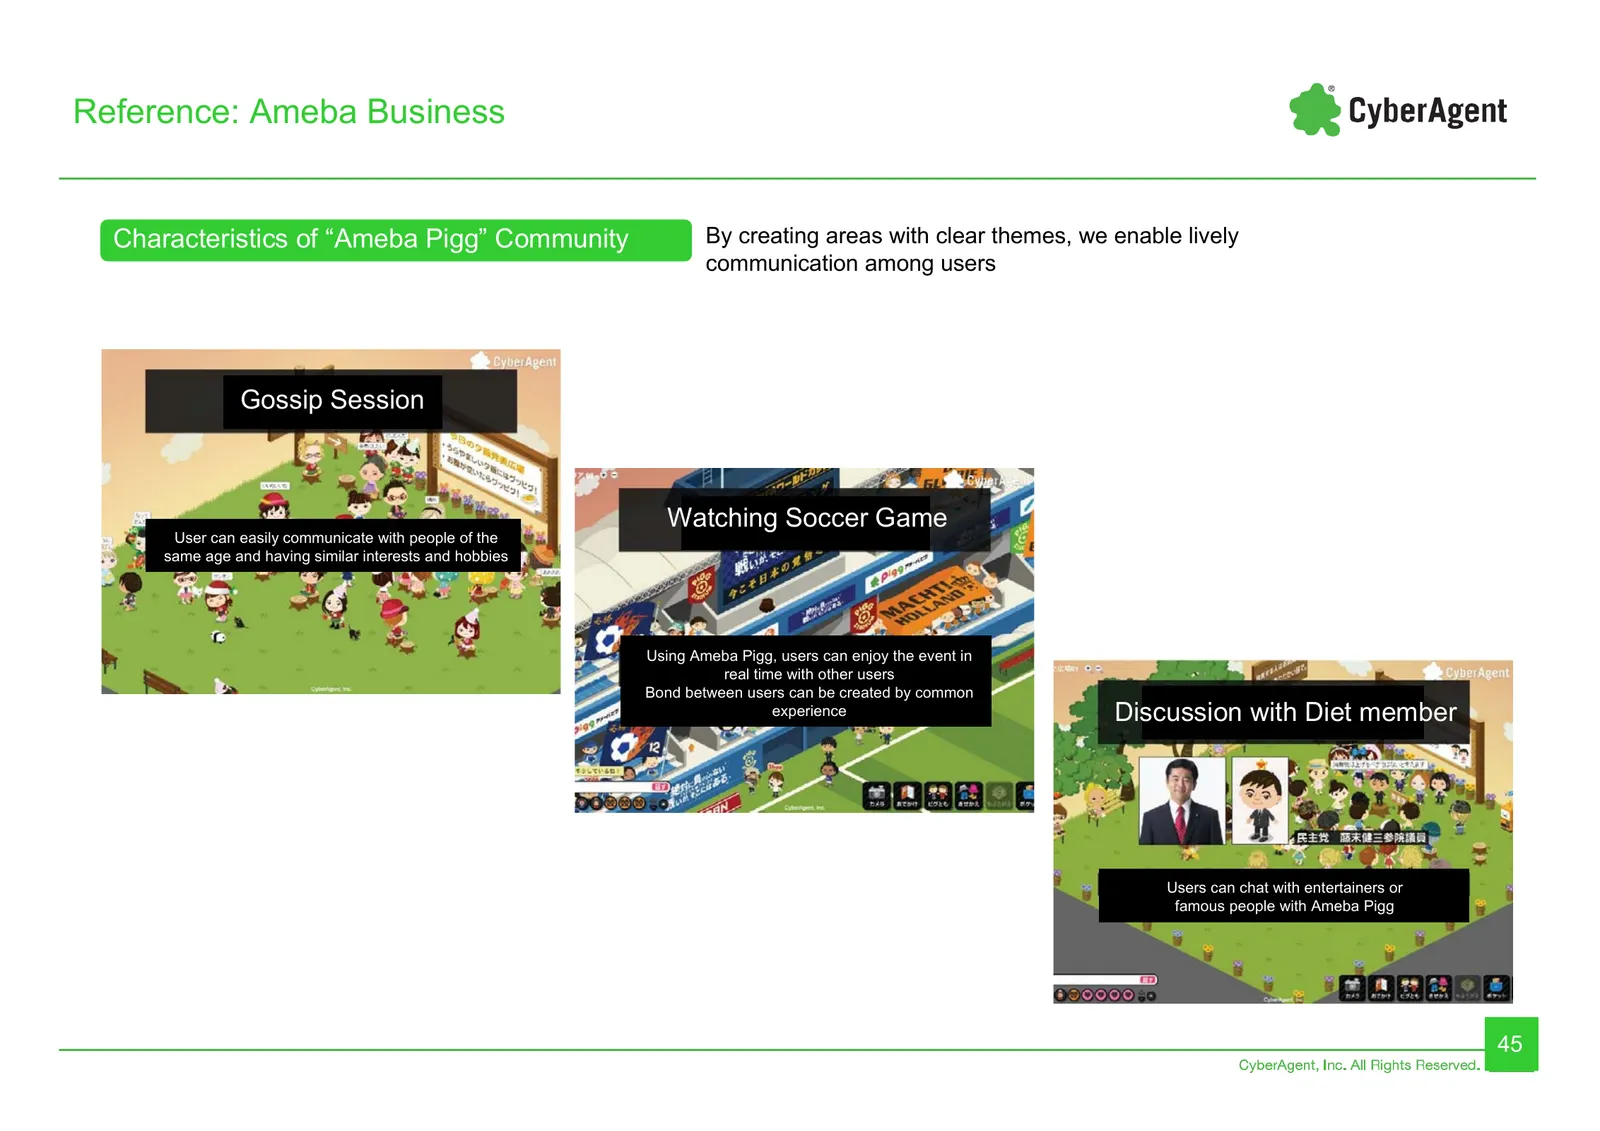
Reference: Ameba Business Characteristics of “Ameba Pigg” Community By creating areas with clear themes, we enable lively communication among users Gossip Session Watching Soccer Game User can easily communicate with people of the same age and having similar interests and hobbies Using Ameba Pigg, u
Slide 46: Characteristics of Ameba Pigg Community
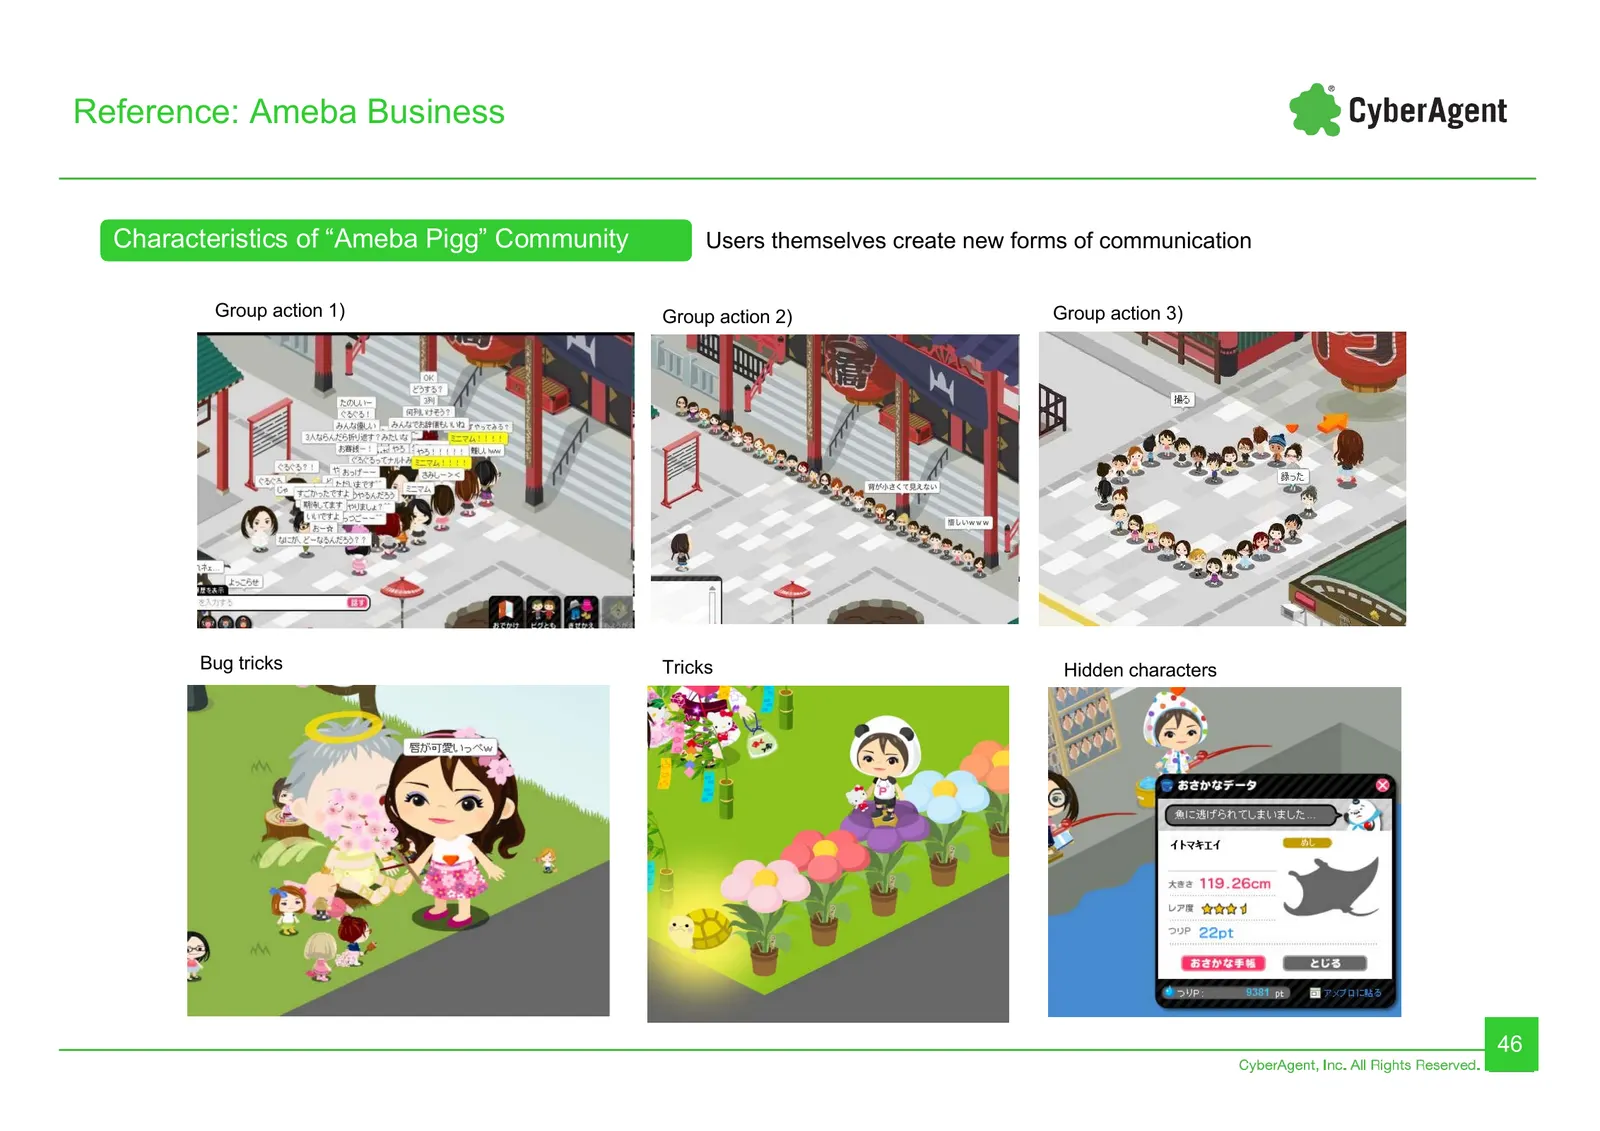
Reference: Ameba Business Characteristics of “Ameba Pigg” Community Users themselves create new forms of communication Group action 1) Group action 2) Group action 3) Bug tricks Tricks Hidden characters 46
Slide 47: Trends Among Ameba Pigg's Heavy Users
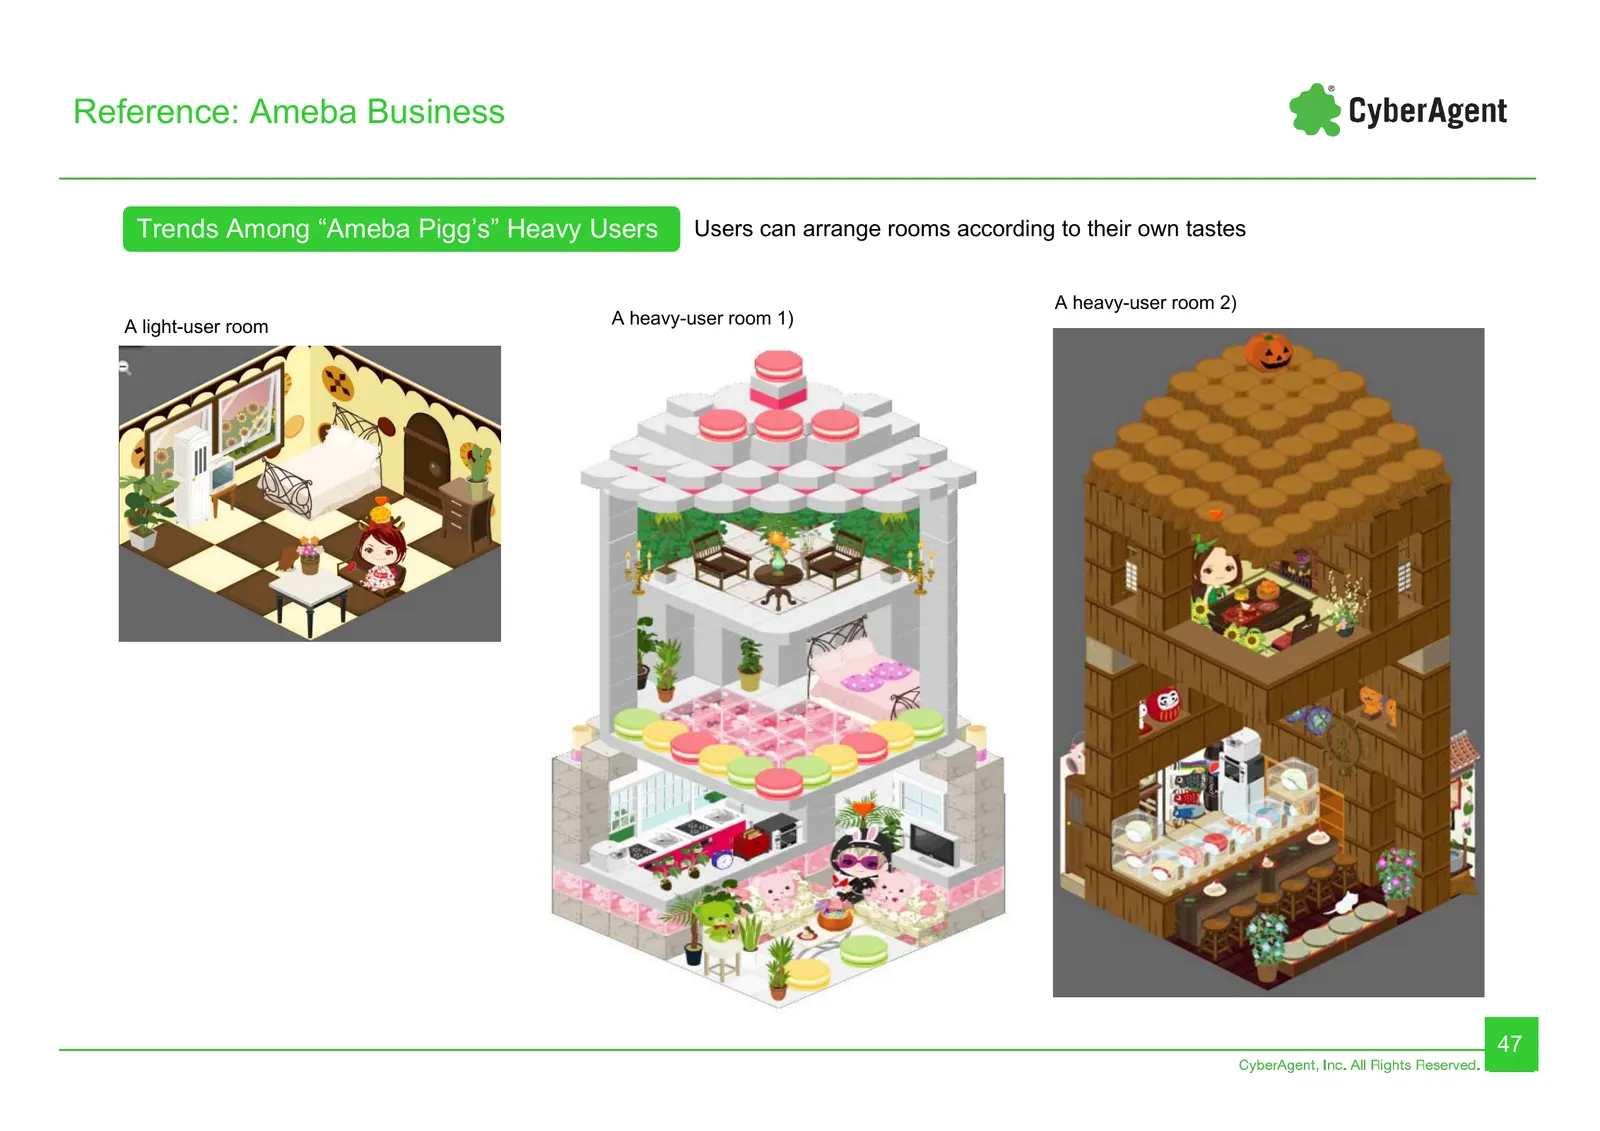
Reference: Ameba Business Trends Among “Ameba Pigg’s” Heavy Users Users can arrange rooms according to their own tastes A heavy-user room 2) A light-user room A heavy-user room 1) 47
Slide 48: Trends Among Ameba Pigg's Heavy Users
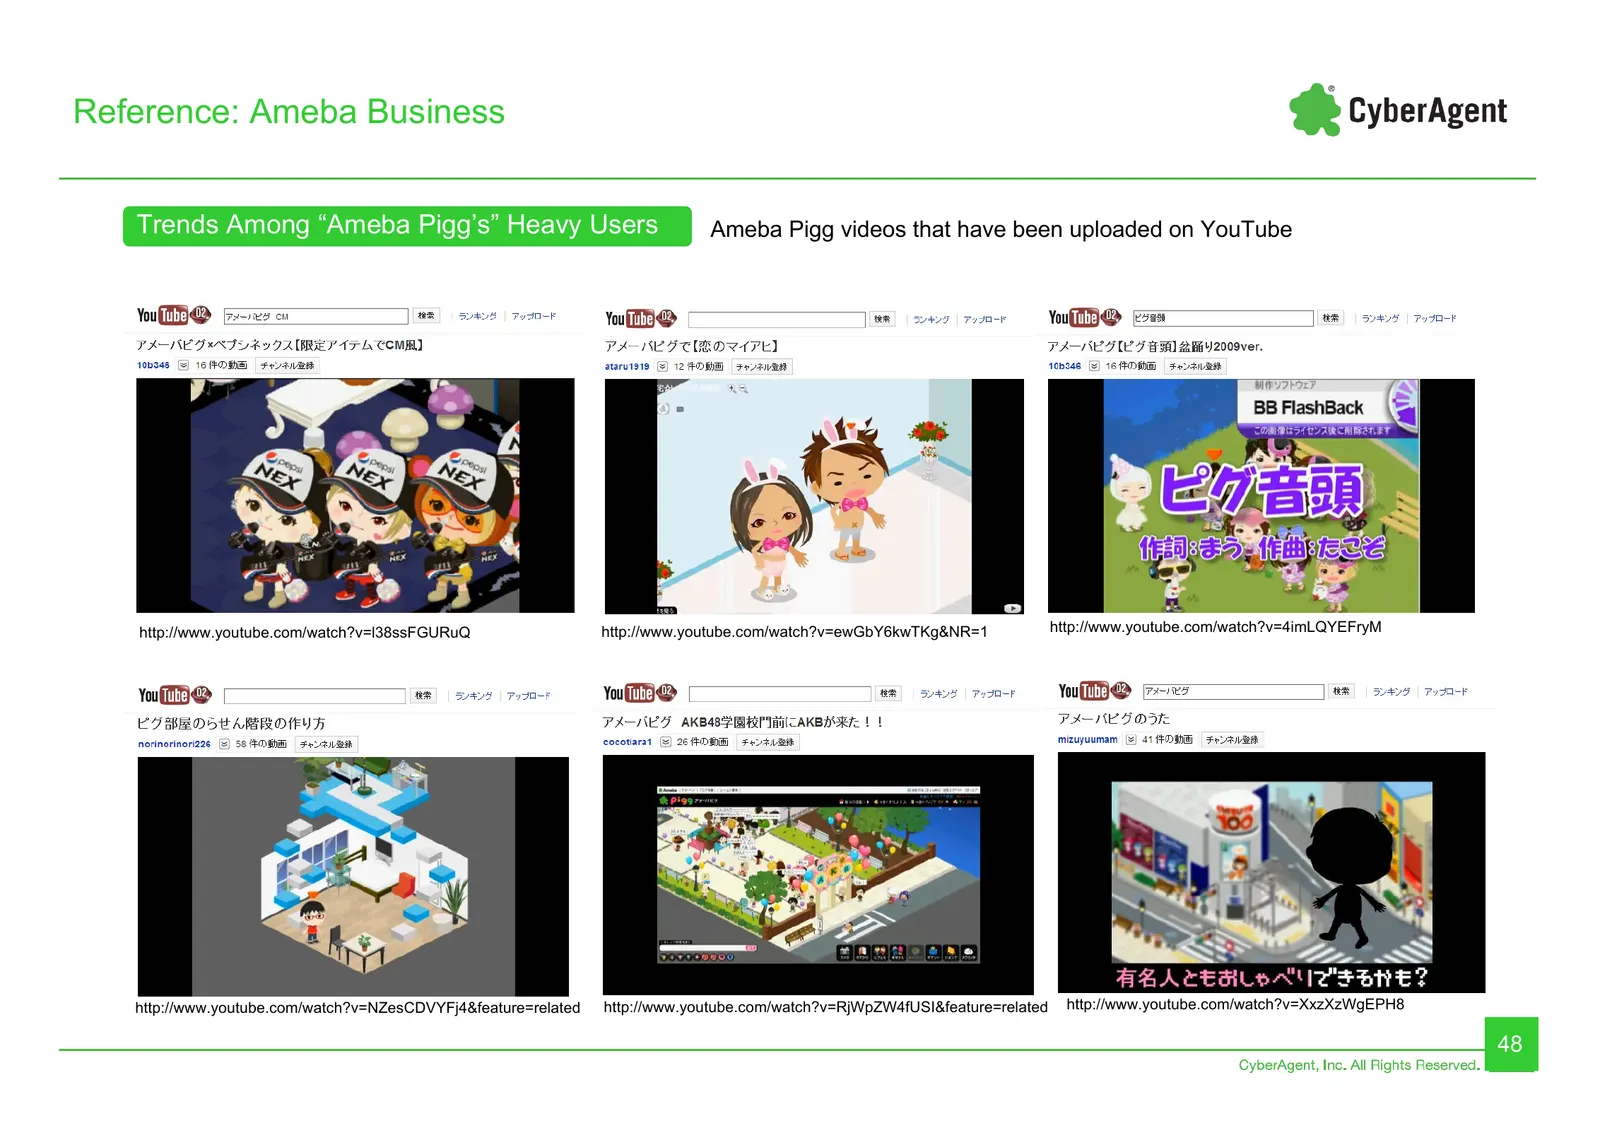
Reference: Ameba Business Trends Among “Ameba Pigg’s” Heavy Users Ameba Pigg videos that have been uploaded on YouTube http://www.youtube.com/watch?v=l38ssFGURuQ http://www.youtube.com/watch?v=ewGbY6kwTKg&NR=1 http://www.youtube.com/watch?v=4imLQYEFryM http://www.youtube.com/watch?v=NZesCDVYFj4&feat
Slide 49: Cases of Ameba Advertising
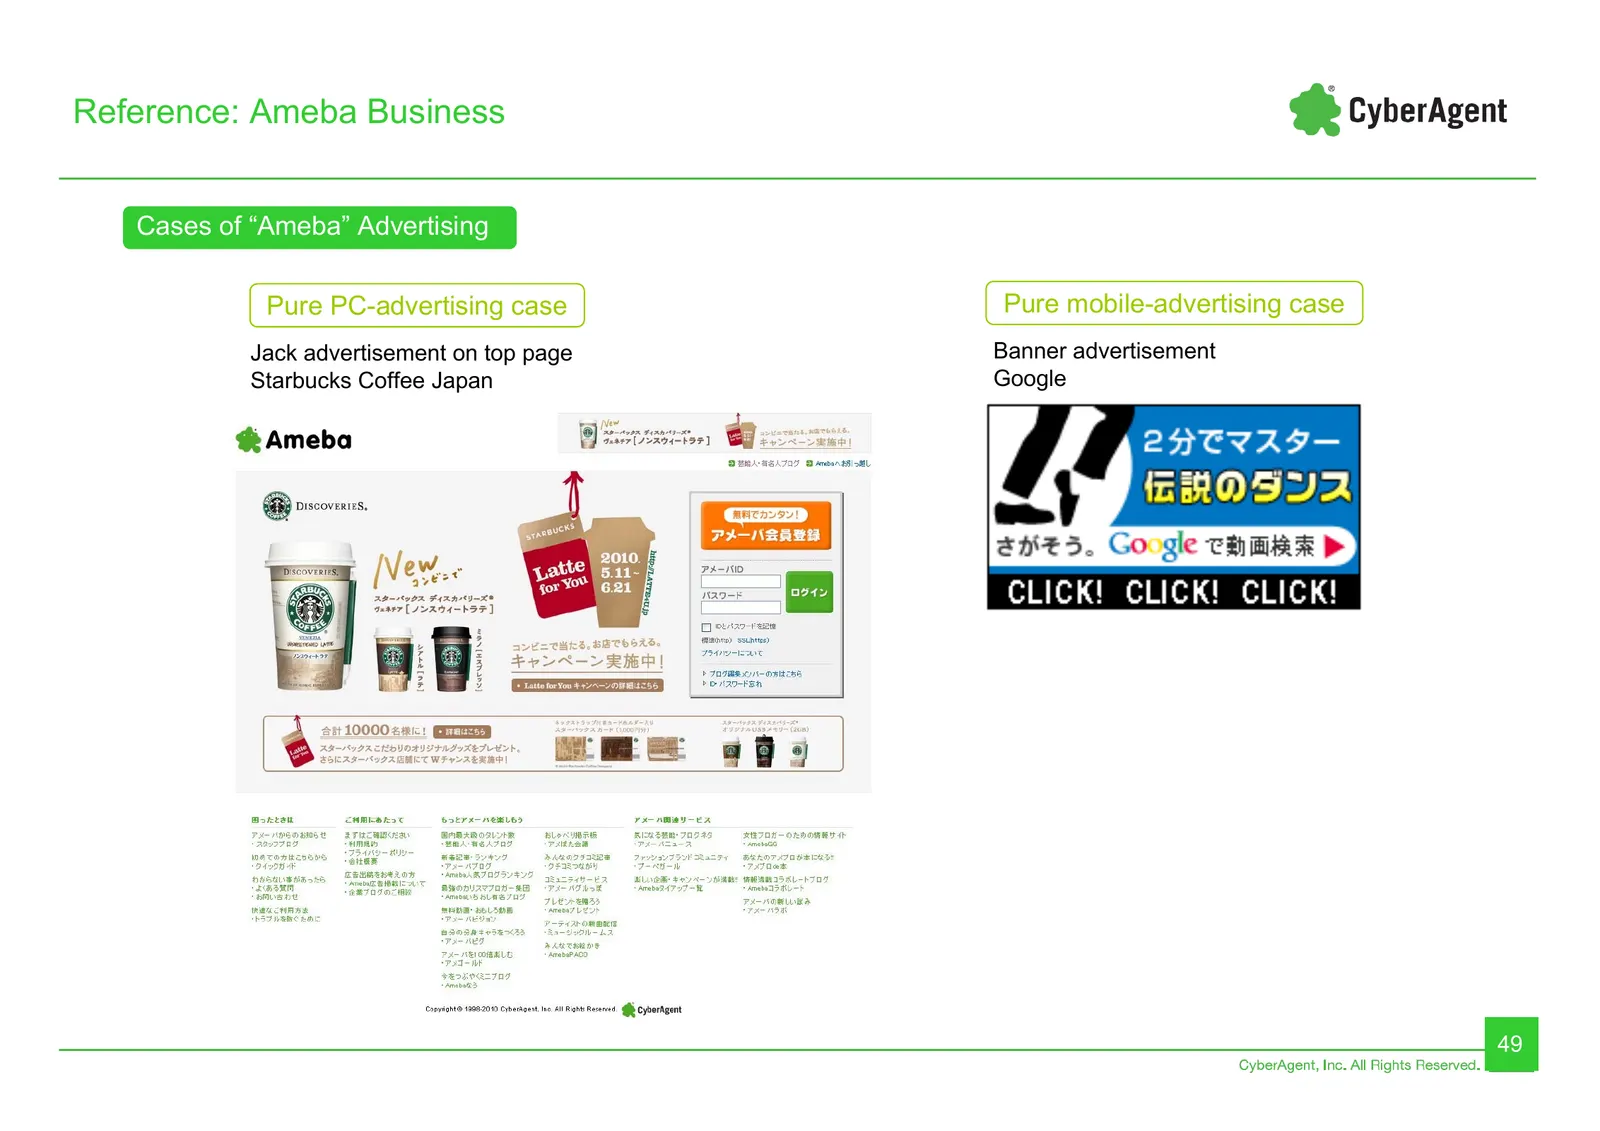
Reference: Ameba Business Cases of “Ameba” Advertising Pure PC-advertising case Pure mobile-advertising case Jack advertisement on top page Banner advertisement Starbucks Coffee Japan Google 49
Source: Internet Archive copy of ir.cyberagent.co.jp
More decks from CyberAgent Incorporated
 FY2026 Earnings Presentation59 slides · Nov 16, 2026
 FY2026 Earnings Presentation60 slides · Nov 12, 2026
 FY2026 Earnings Presentation58 slides · Nov 11, 2026
 Investor Presentation (August 2026)79 slides · Aug 7, 2026
 Q3 2026 Earnings Presentation40 slides · Aug 7, 2026
 Q2 2026 Earnings Presentation39 slides · May 13, 2026