Cognyte Software Ltd. · NASDAQ:CGNT
Cognyte Software — Q4 FYE23 Earnings Presentation
30 slides from Cognyte Software's earnings presentation, Apr 11, 2023

Slide 1: Q4 FYE23 Conference Call
Q4 FYE23 Conference Call +April 11, 2023 1
Slide 2: Disclaimers
Disclaimers Forward Looking Statements This presentation contains "forward-looking statements," including statements regarding expectations, predictions, views, opportunities, plans, strategies, beliefs, and statements of similar effect relating to Cognyte Software Ltd. These forward-looking stateme
Slide 3: Q4 FYE23 Summary
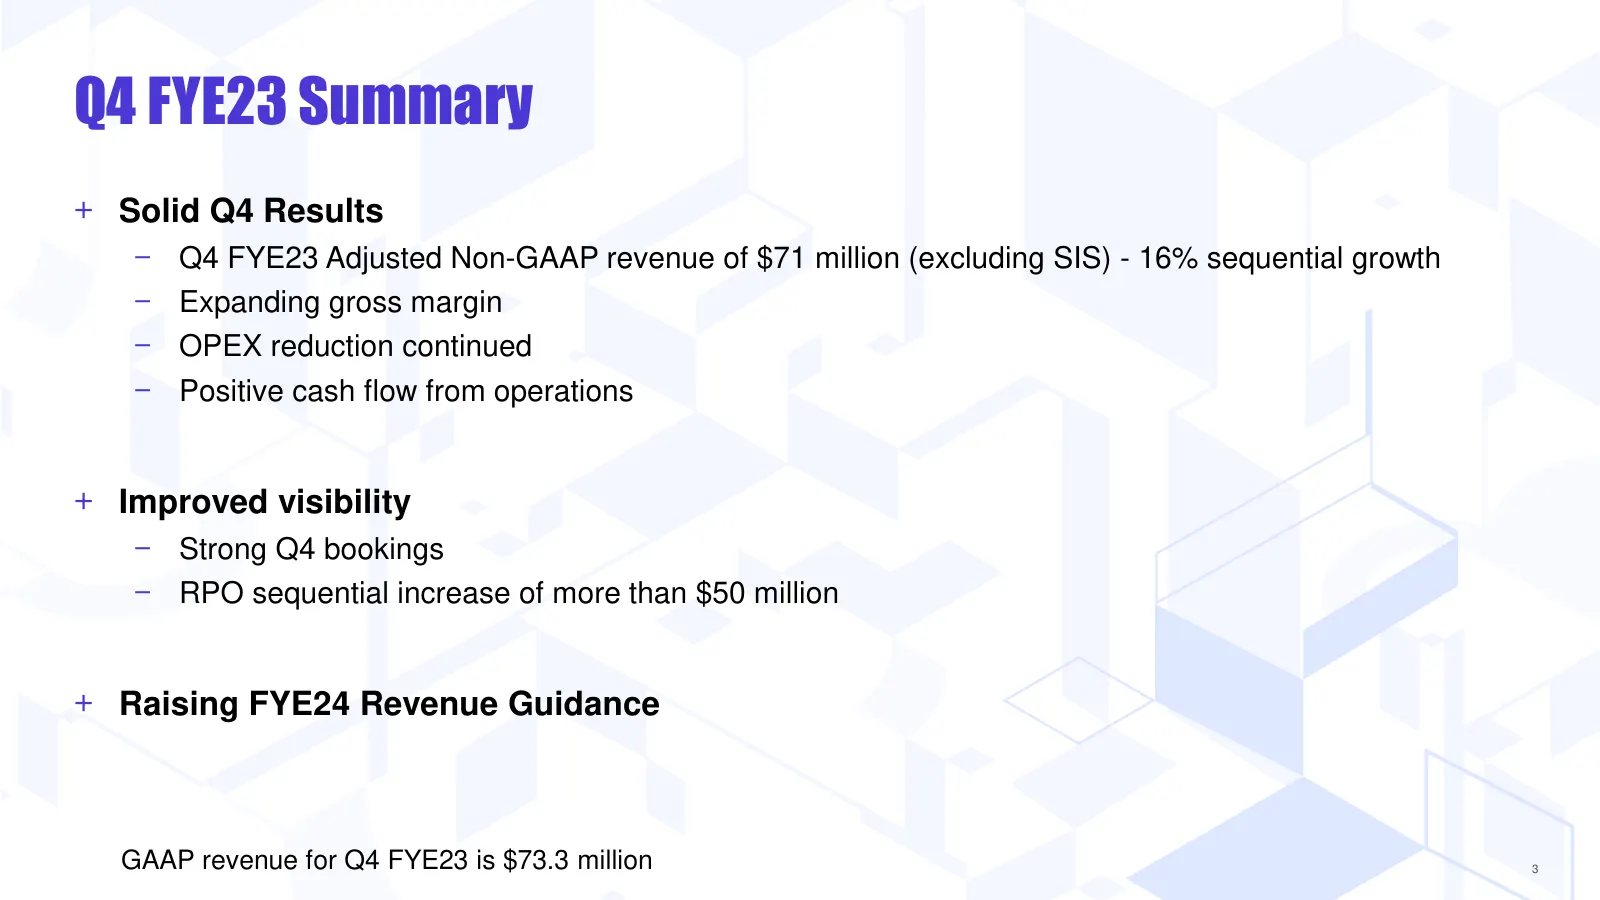
Q4 FYE23 Summary + Solid Q4 Results − Q4 FYE23 Adjusted Non-GAAP revenue of $71 million (excluding SIS) - 16% sequential growth − Expanding gross margin − OPEX reduction continued − Positive cash flow from operations + Improved visibility − Strong Q4 bookings − RPO sequential increase of more than $
Slide 4: Winning large deals – Q4 customer examples
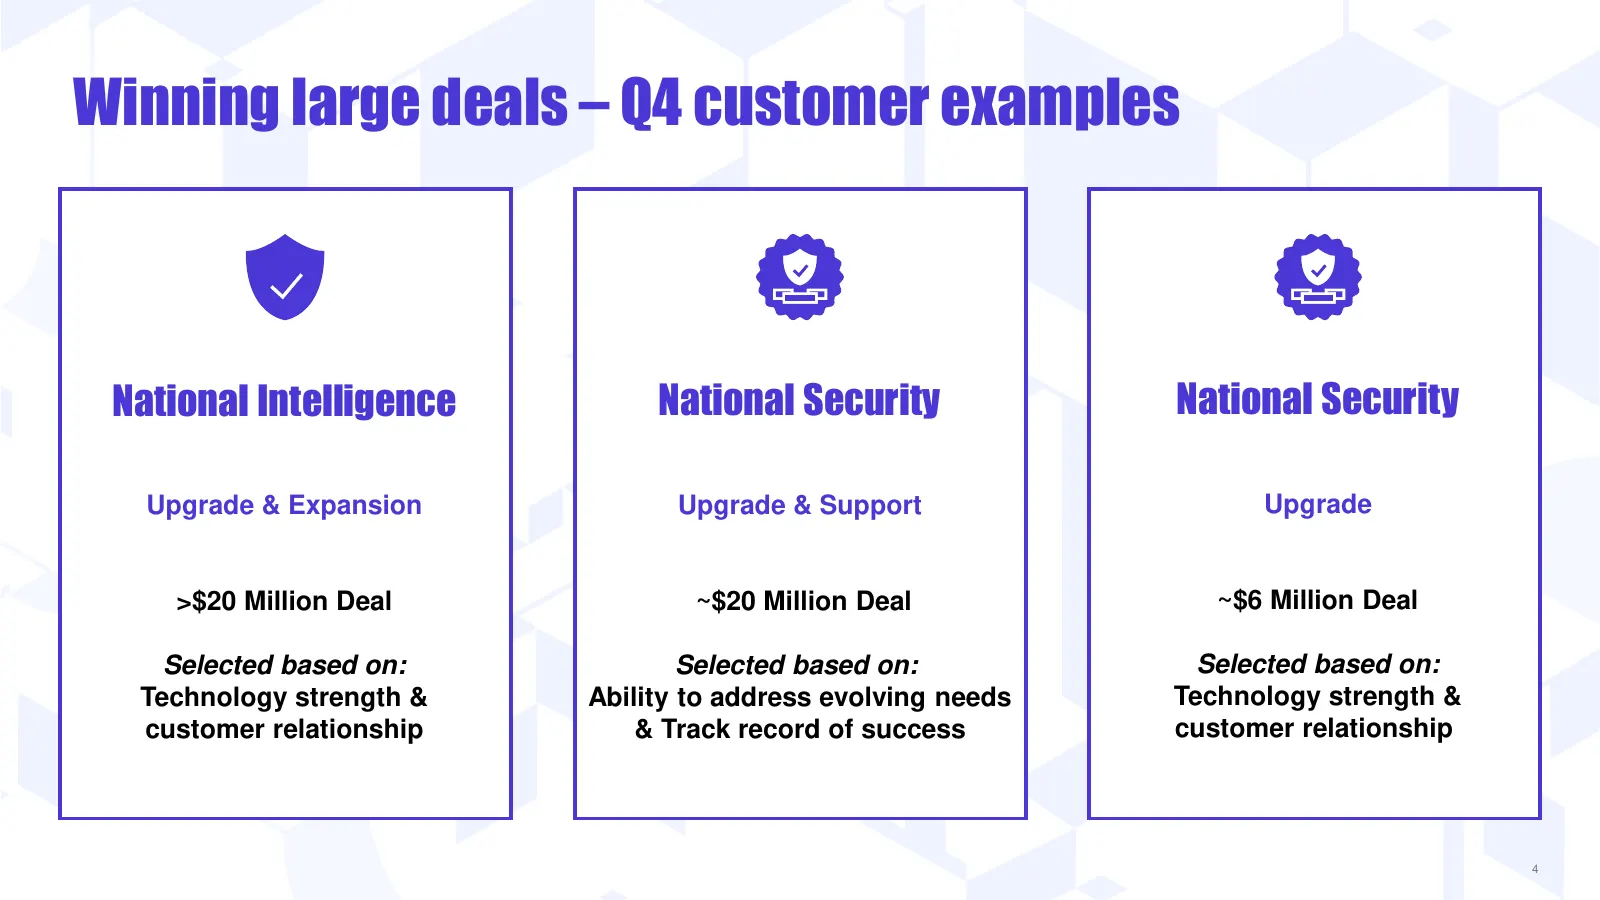
Winning large deals – Q4 customer examples National Intelligence National Security National Security Upgrade & Expansion Upgrade & Support Upgrade >$20 Million Deal ~$20 Million Deal ~$6 Million Deal Selected based on: Selected based on: Selected based on: Technology strength & Ability to address ev
Slide 5: FYE23 Summary
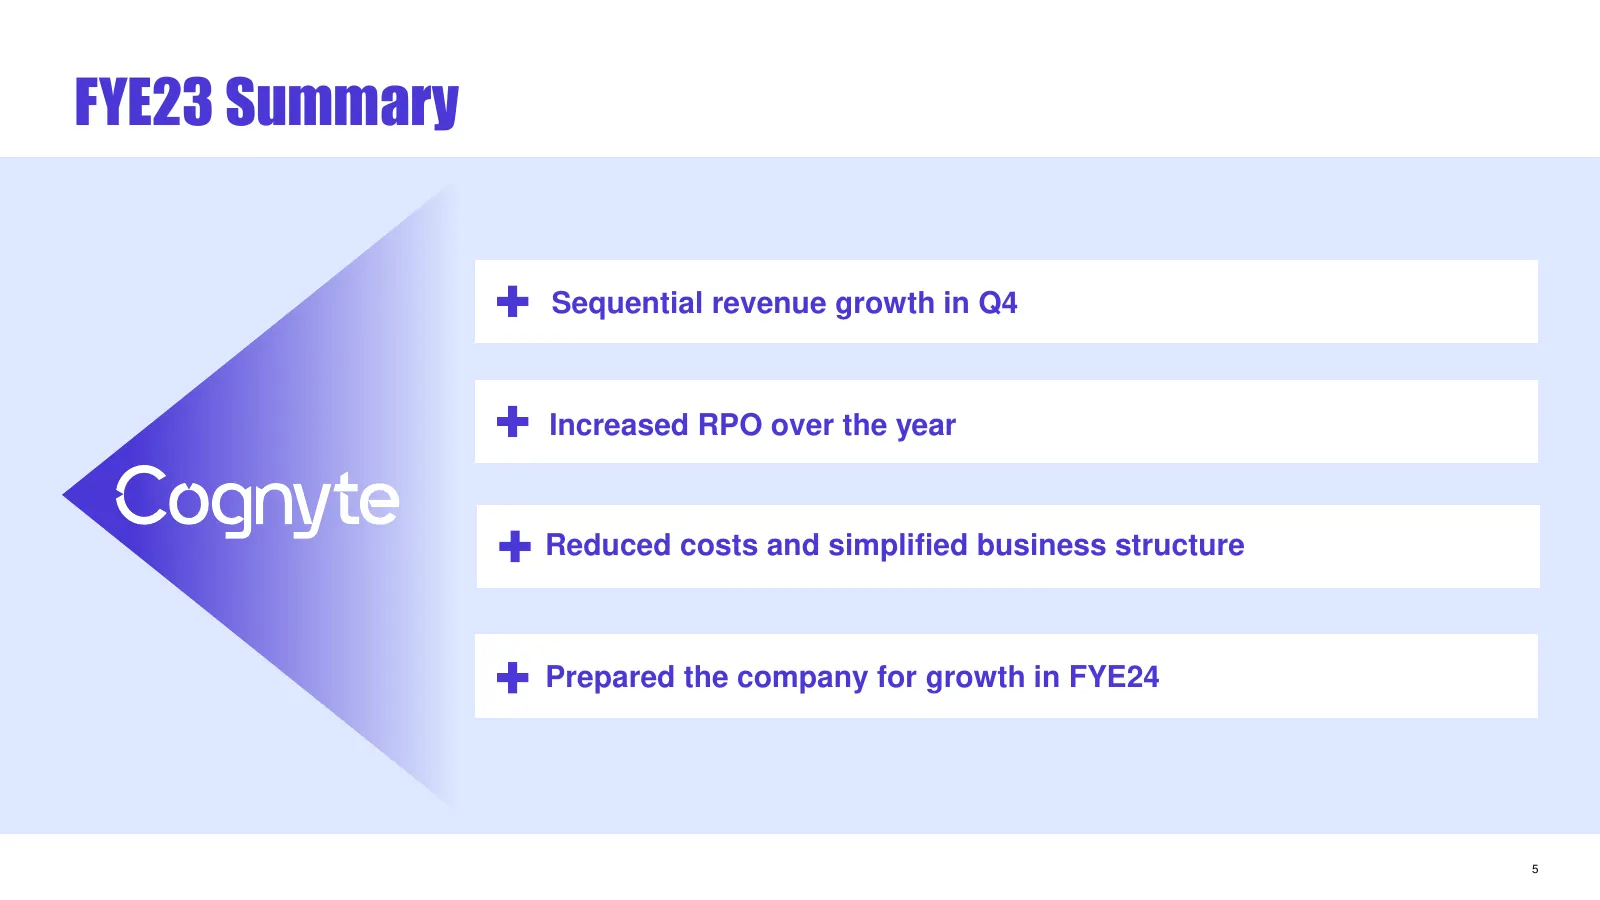
FYE23 Summary Sequential revenue growth in Q4 Increased RPO over the year Reduced costs and simplified business structure Prepared the company for growth in FYE24 5
Slide 6: Entering FYE24 with Improved Visibility and Strong Customer Base
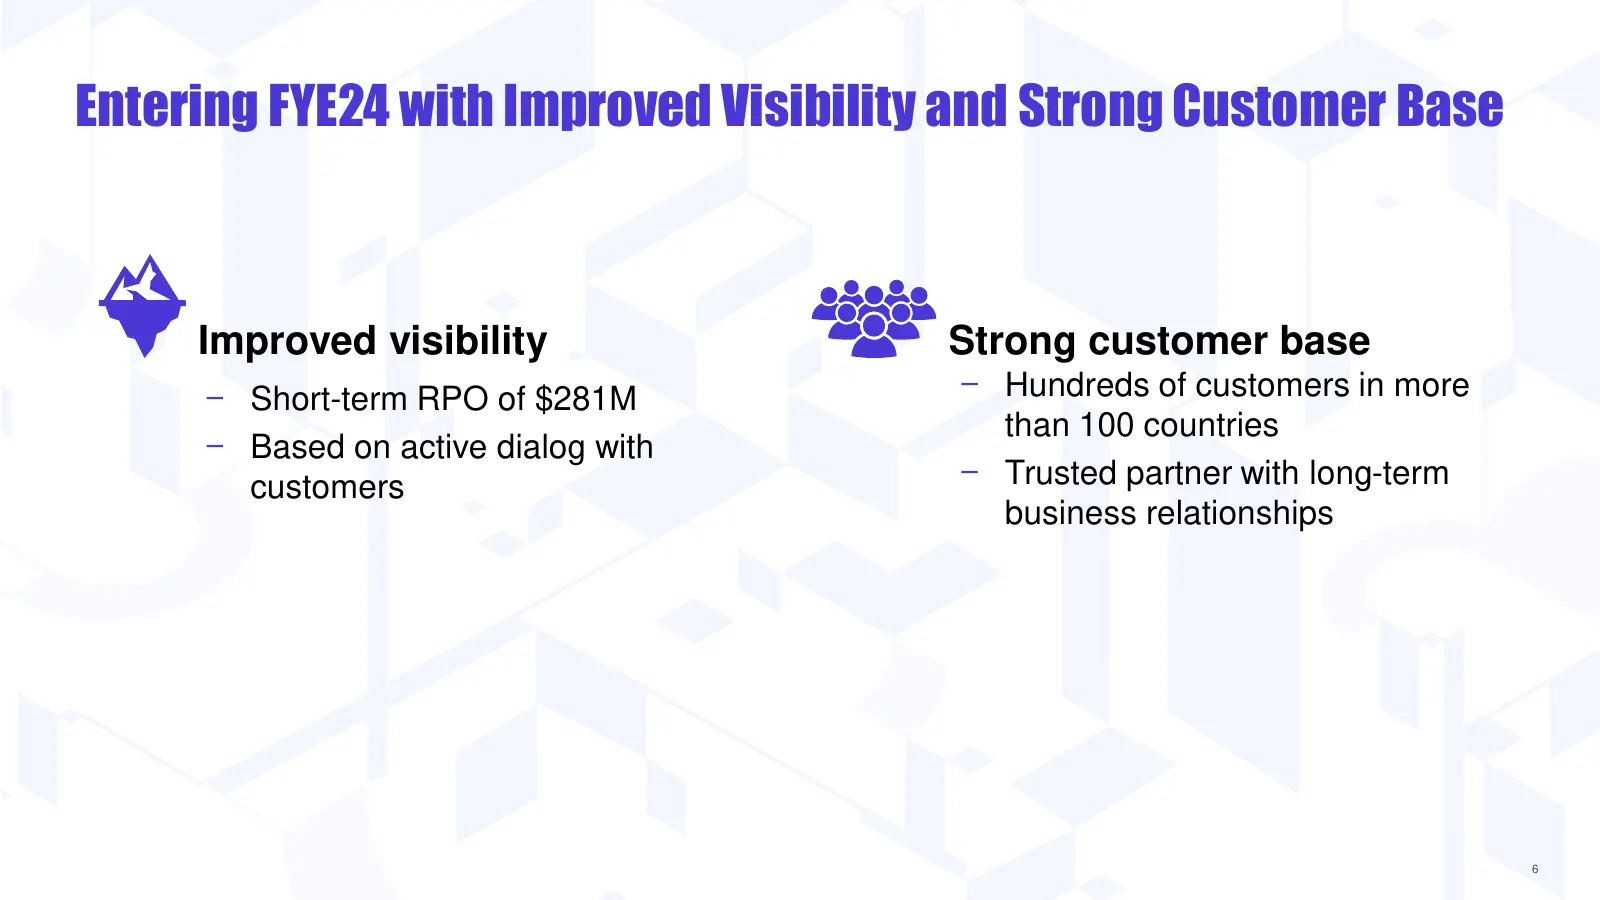
Entering FYE24 with Improved Visibility and Strong Customer Base Improved visibility Strong customer base − Short-term RPO of $281M − Hundreds of customers in more than 100 countries − Based on active dialog with customers − Trusted partner with long-term business relationships 6
Slide 7: Outlook
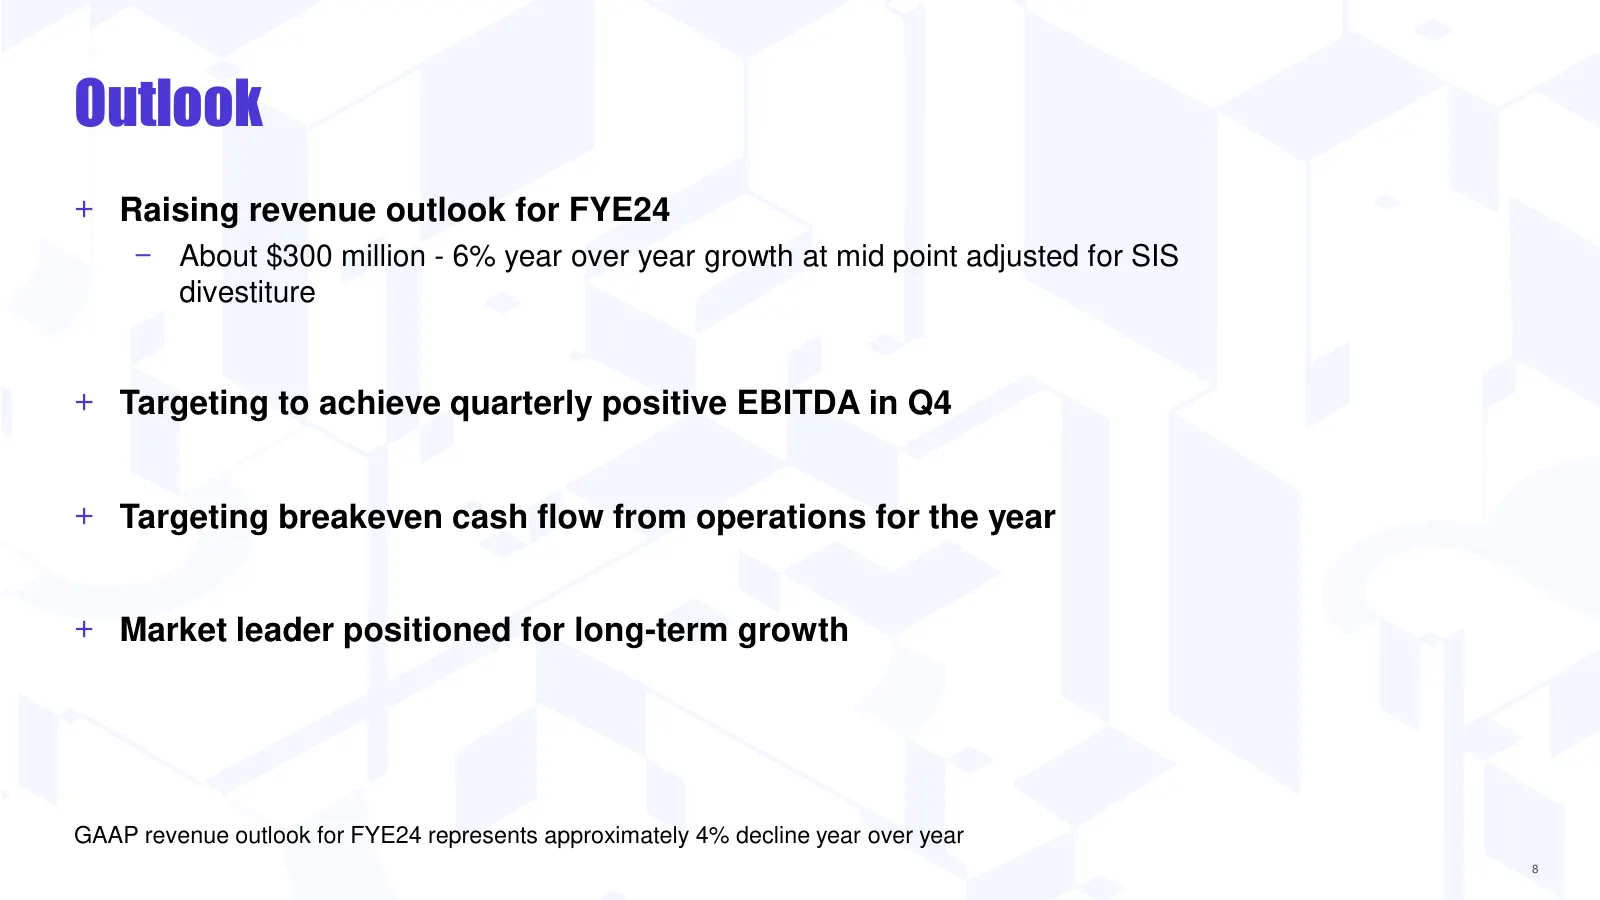
Outlook + Raising revenue outlook for FYE24 − About $300 million - 6% year over year growth at mid point adjusted for SIS divestiture + Targeting to achieve quarterly positive EBITDA in Q4 + Targeting breakeven cash flow from operations for the year + Market leader positioned for long-term growth GA
Slide 8: Long-term growth opportunity
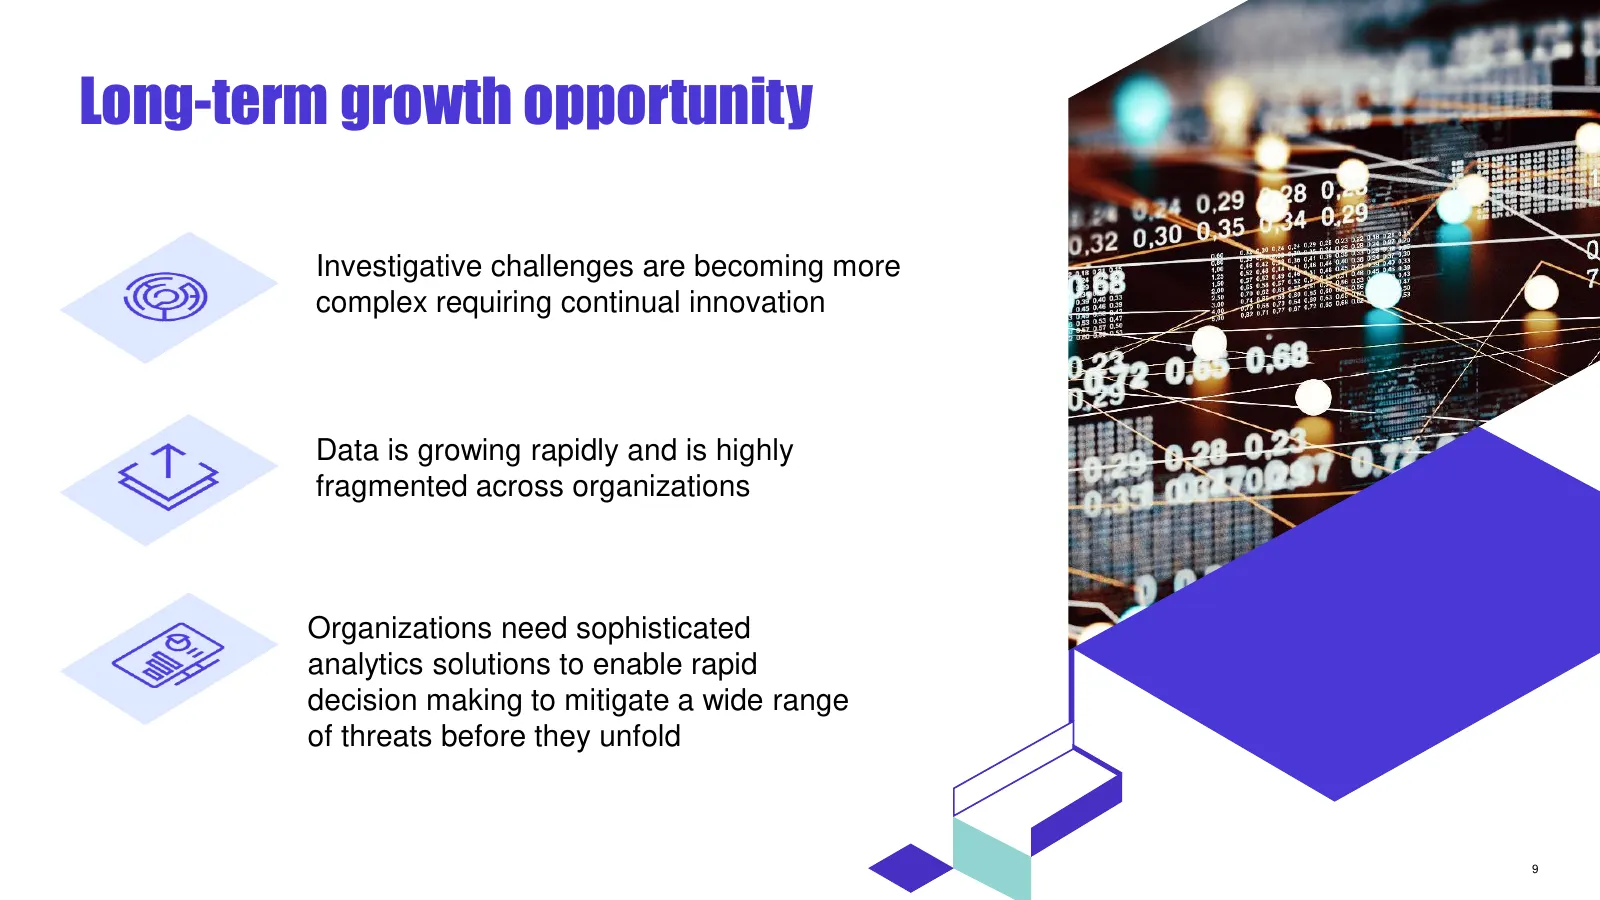
Long-term growth opportunity Investigative challenges are becoming more complex requiring continual innovation Data is growing rapidly and is highly fragmented across organizations Organizations need sophisticated analytics solutions to enable rapid decision making to mitigate a wide range of threat

Slide 9: Financial Summary
Financial Summary 10 10
Slide 10: Q4 FYE23 Financials (excluding SIS)
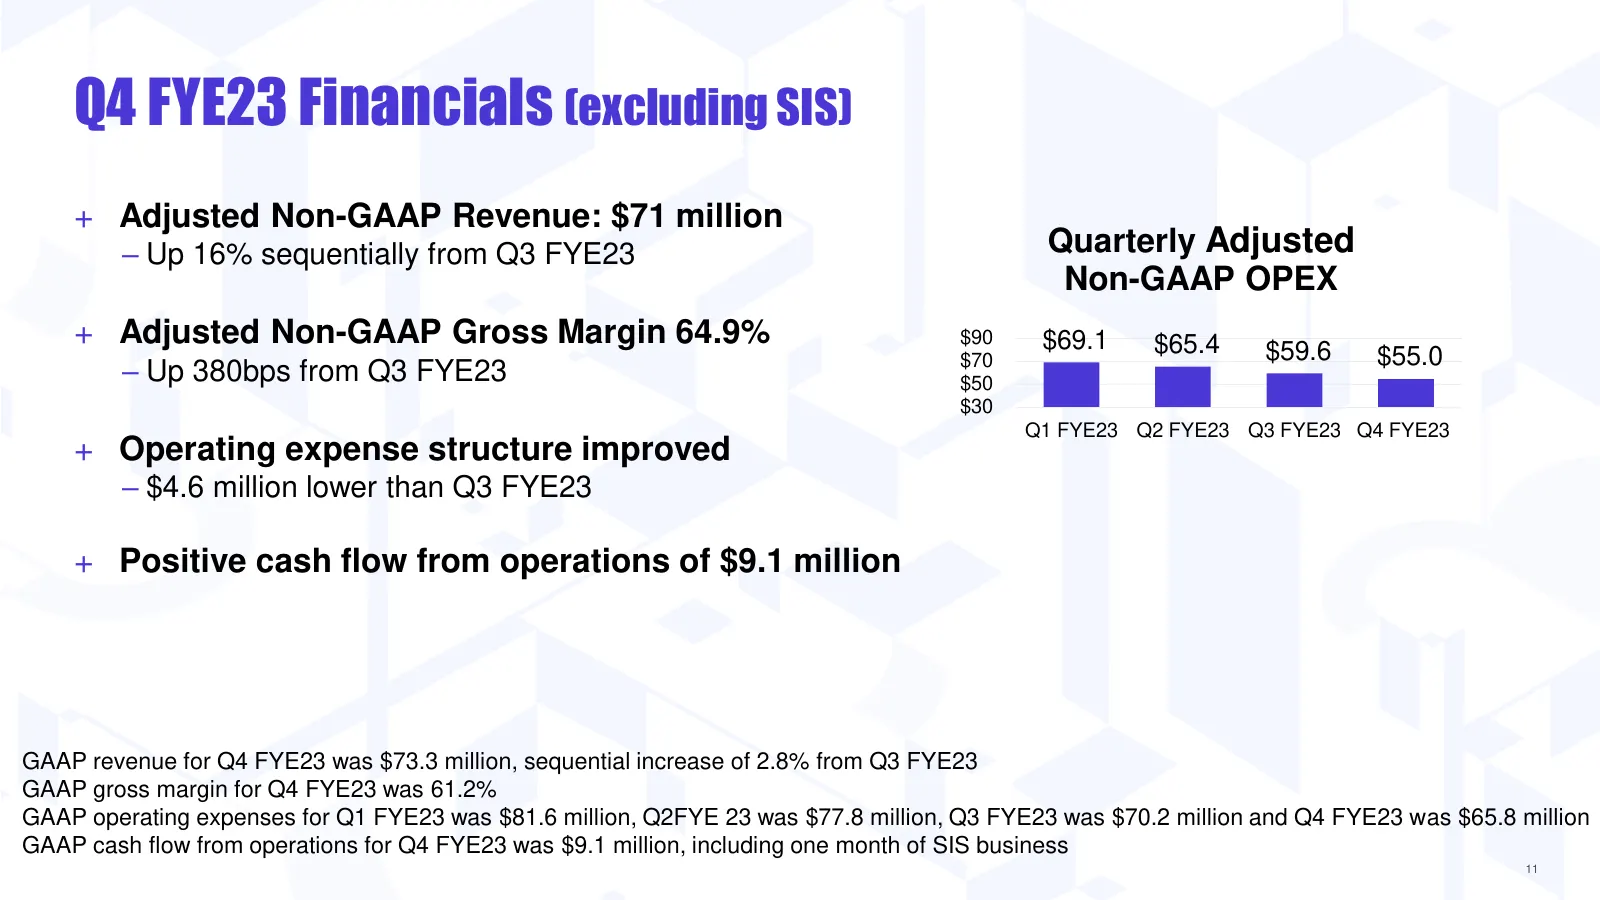
Q4 FYE23 Financials (excluding SIS) + Adjusted Non-GAAP Revenue: $71 million ‒ Up 16% sequentially from Q3 FYE23 Quarterly Adjusted Non-GAAP OPEX + Adjusted Non-GAAP Gross Margin 64.9% $90 $69.1 $65.4 $59.6 $55.0 ‒ Up 380bps from Q3 FYE23 $70 $50 $30 Q1 FYE23 Q2 FYE23 Q3 FYE23 Q4 FYE23 + Operating e
Slide 11: Increasing RPO
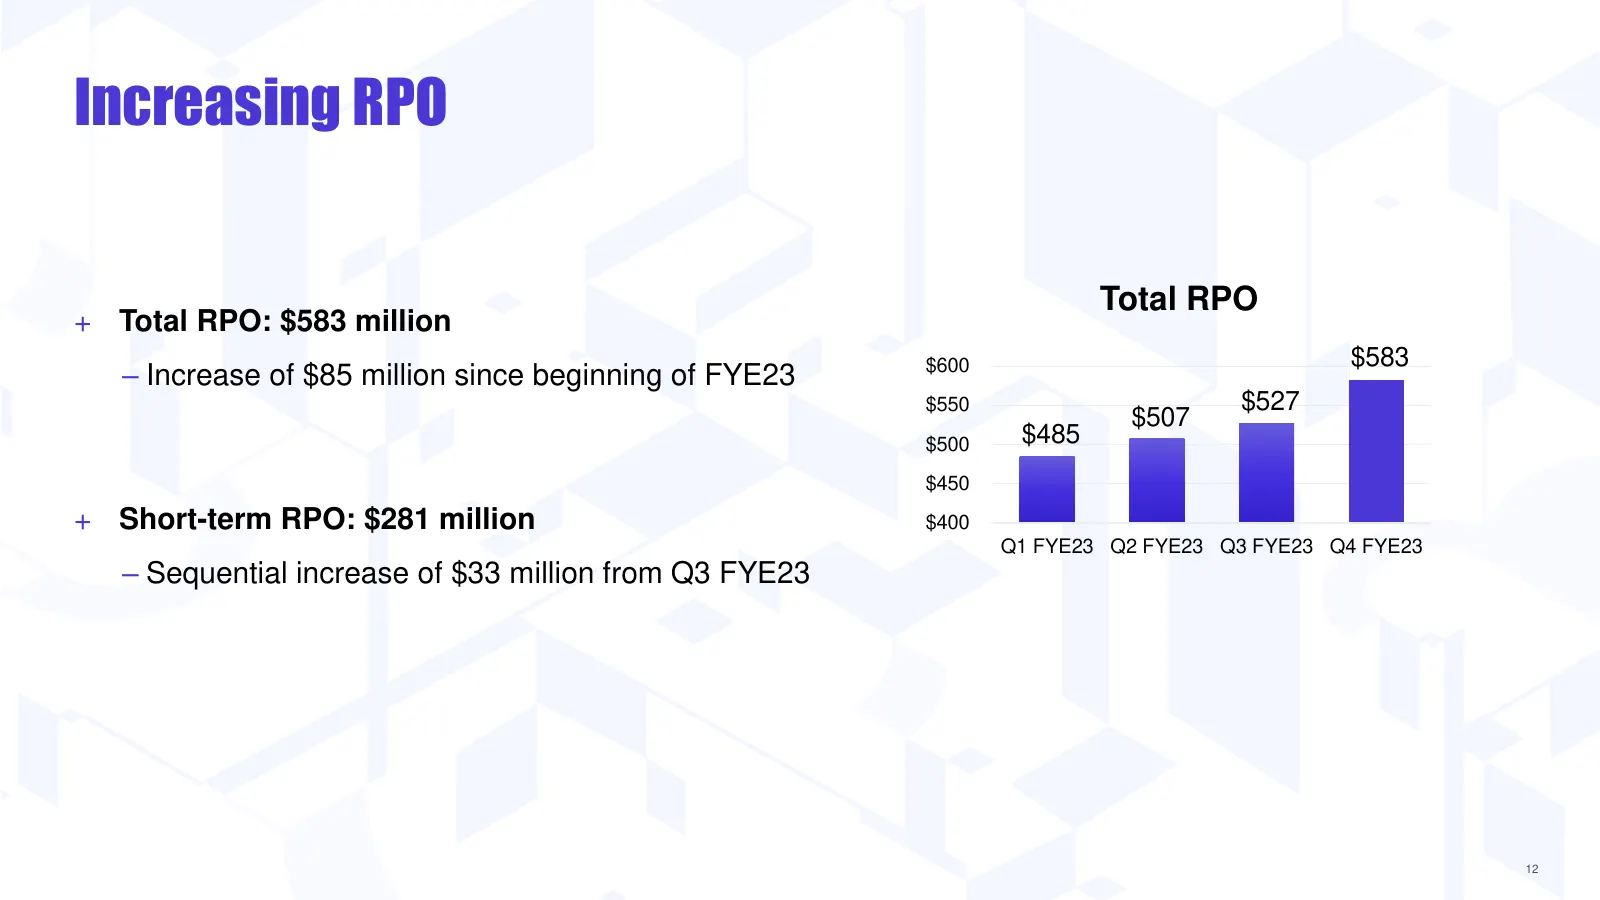
Increasing RPO Total RPO + Total RPO: $583 million $583 ‒ Increase of $85 million since beginning of FYE23 $600 $550 $527 $507 $500 $485 $450 + Short-term RPO: $281 million $400 Q1 FYE23 Q2 FYE23 Q3 FYE23 Q4 FYE23 ‒ Sequential increase of $33 million from Q3 FYE23 12
Slide 12: FYE24 Outlook
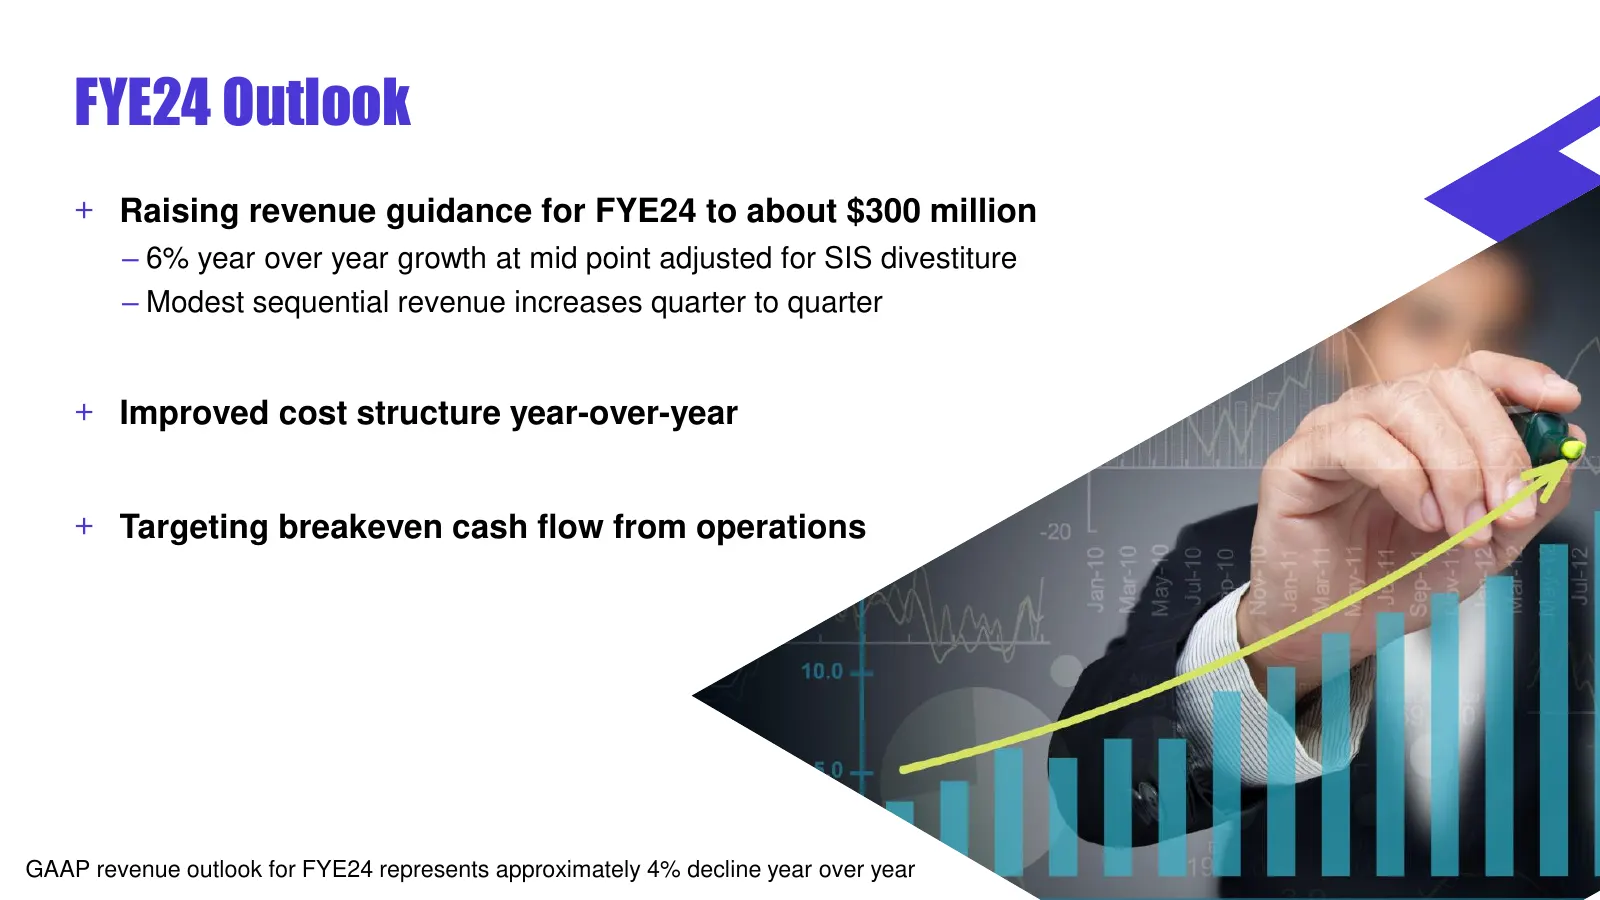
FYE24 Outlook + Raising revenue guidance for FYE24 to about $300 million ‒ 6% year over year growth at mid point adjusted for SIS divestiture ‒ Modest sequential revenue increases quarter to quarter + Improved cost structure year-over-year + Targeting breakeven cash flow from operations GAAP revenue
Slide 13: Summary
Summary Market leader well positioned for long-term profitable growth Improved visibility, raising revenue outlook for FYE24 Targeting breakeven cash flow from operations in FYE24 14
Slide 14: Thank you
Thank you cognyte.com 15

Slide 15: Appendix
Appendix 16 16
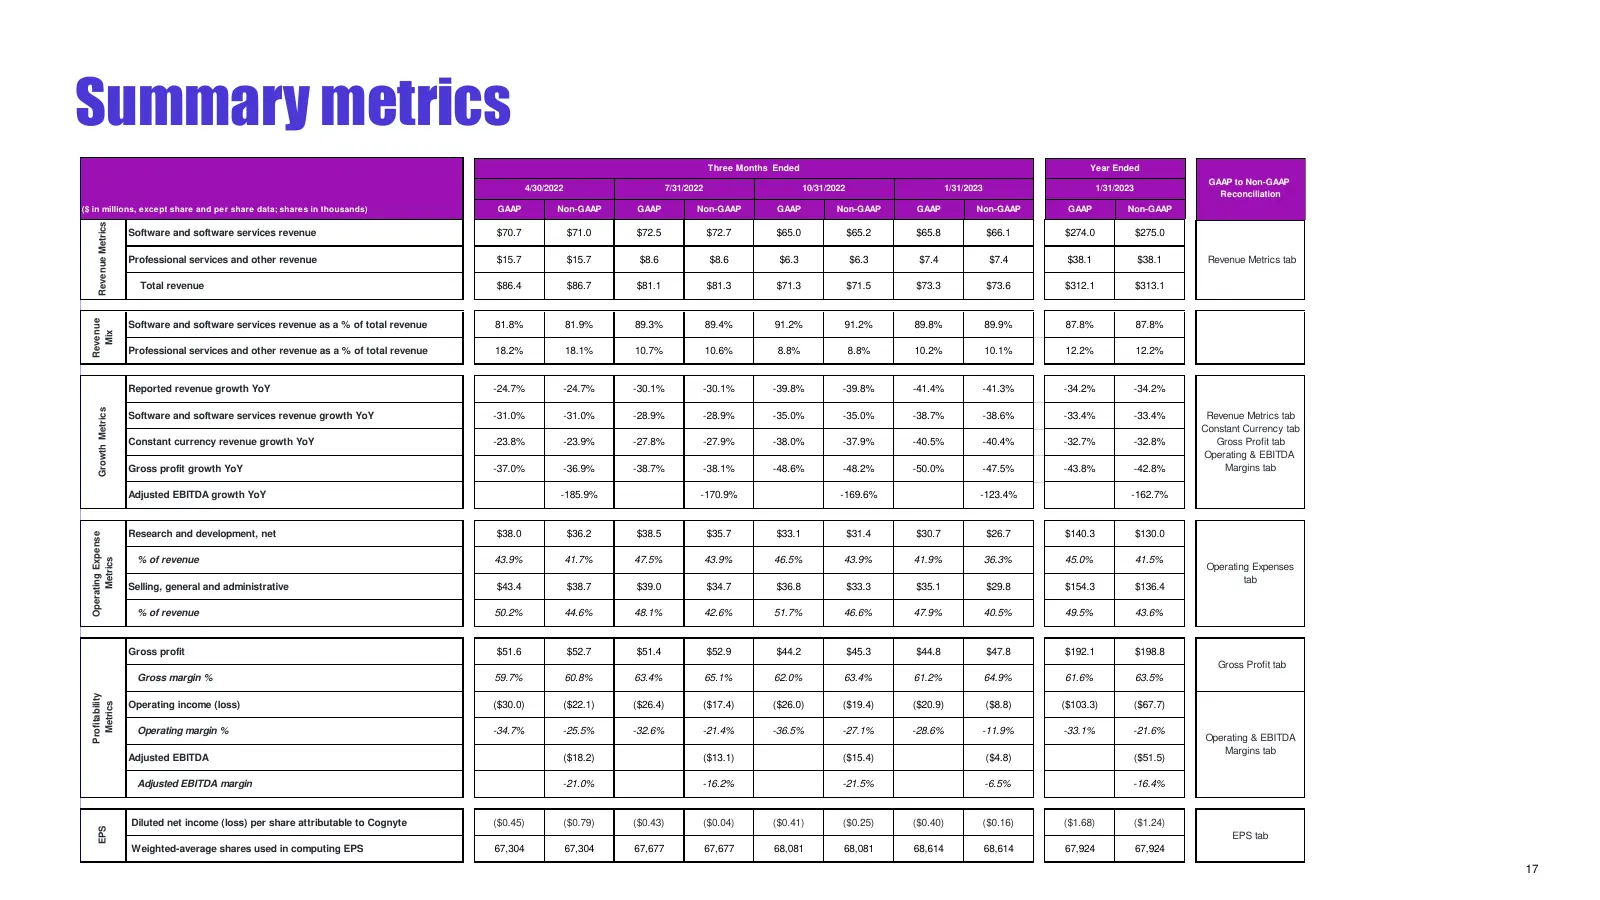
Slide 16: Summary metrics
Summary metrics Three Months Ended Year Ended GAAP to Non-GAAP 4/30/2022 7/31/2022 10/31/2022 1/31/2023 1/31/2023 Reconciliation ($ in millions, except share and per share data; shares in thousands) GAAP Non-GAAP GAAP Non-GAAP GAAP Non-GAAP GAAP Non-GAAP GAAP Non-GAAP Revenue Metrics Software and so
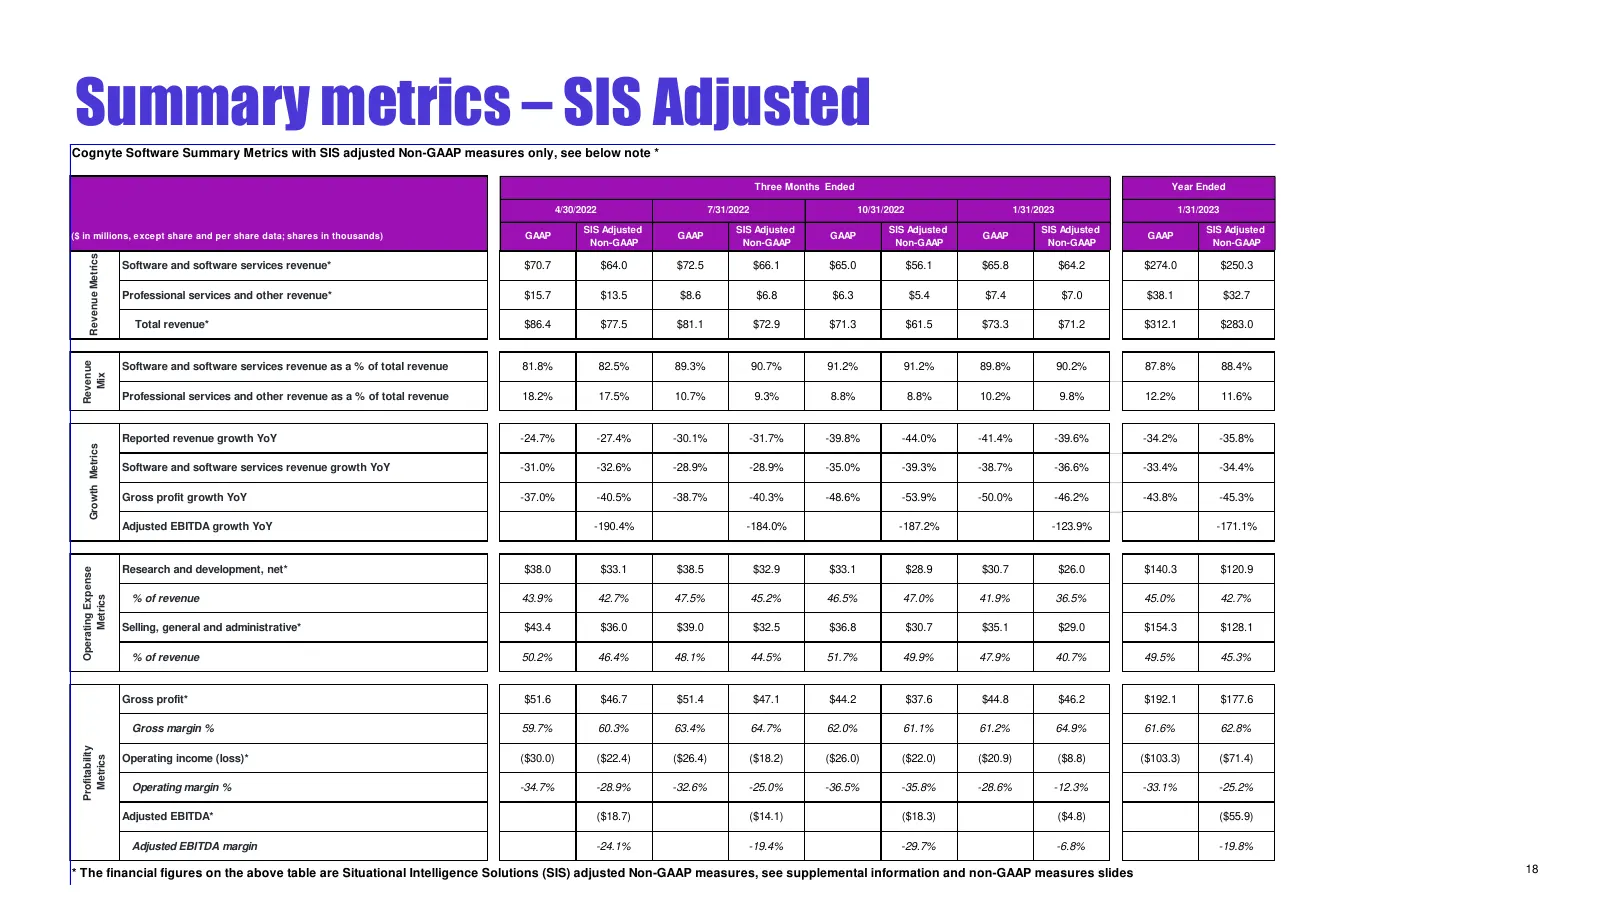
Slide 17: Summary metrics – SIS Adjusted
Summary metrics – SIS Adjusted Cognyte Software Summary Metrics with SIS adjusted Non-GAAP measures only, see below note * Three Months Ended Year Ended 4/30/2022 7/31/2022 10/31/2022 1/31/2023 1/31/2023 SIS Adjusted SIS Adjusted SIS Adjusted SIS Adjusted SIS Adjusted ($ in millions, except share an
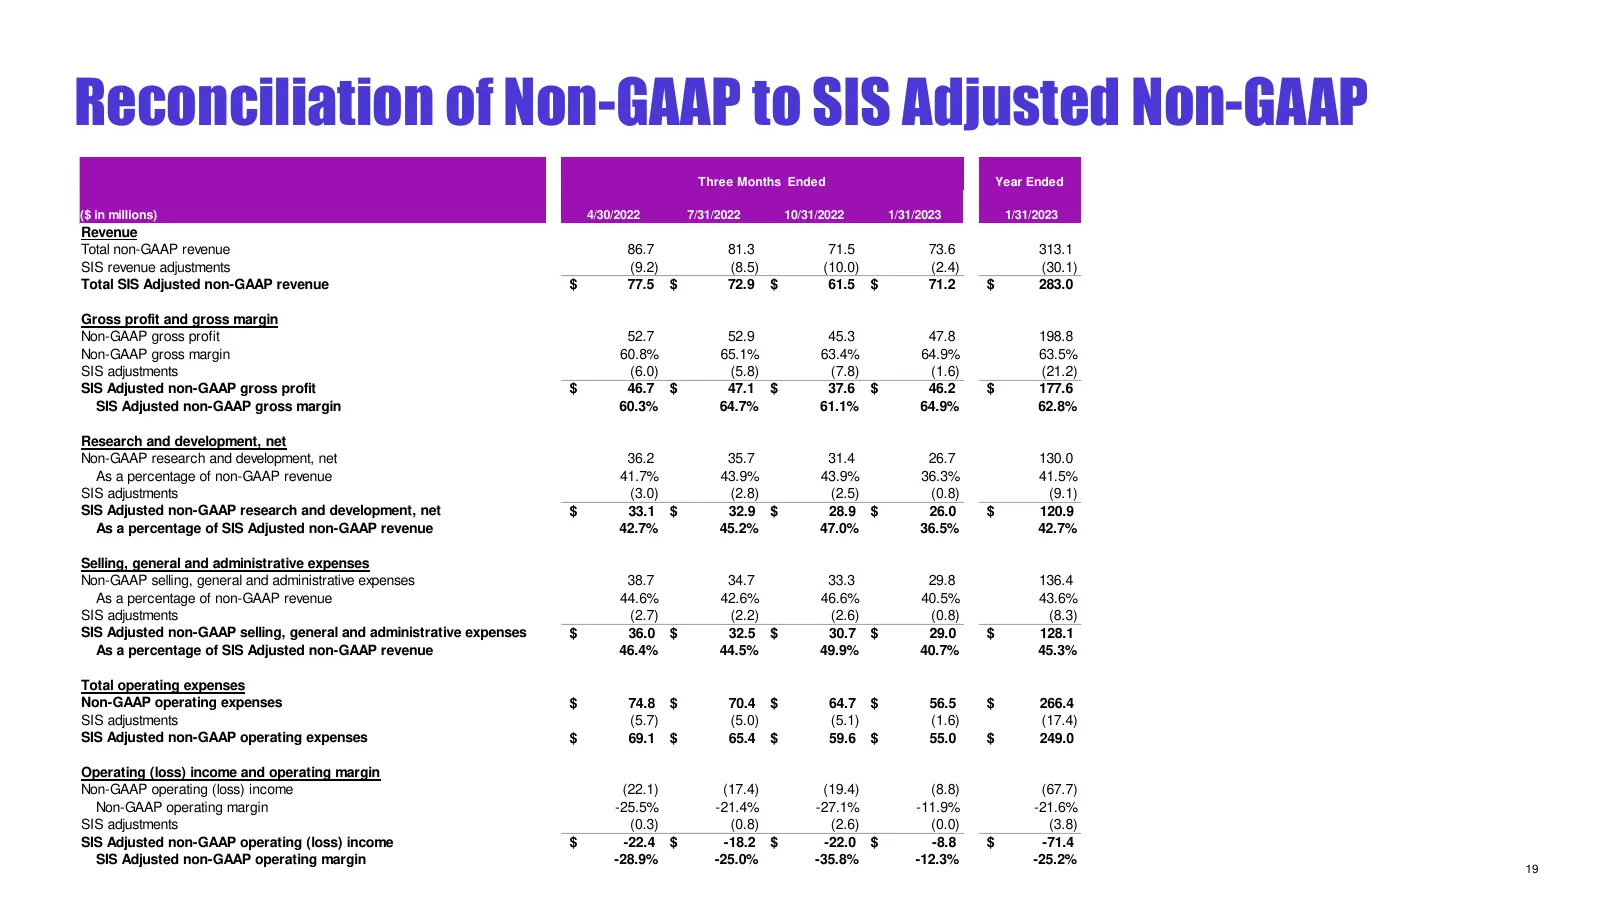
Slide 18: Reconciliation of Non-GAAP to SIS Adjusted Non-GAAP
Reconciliation of Non-GAAP to SIS Adjusted Non-GAAP Three Months Ended Year Ended ($ in millions) 4/30/2022 7/31/2022 10/31/2022 1/31/2023 1/31/2023 Revenue Total non-GAAP revenue 86.7 81.3 71.5 73.6 313.1 SIS revenue adjustments (9.2) (8.5) (10.0) (2.4) (30.1) Total SIS Adjusted non-GAAP revenue $
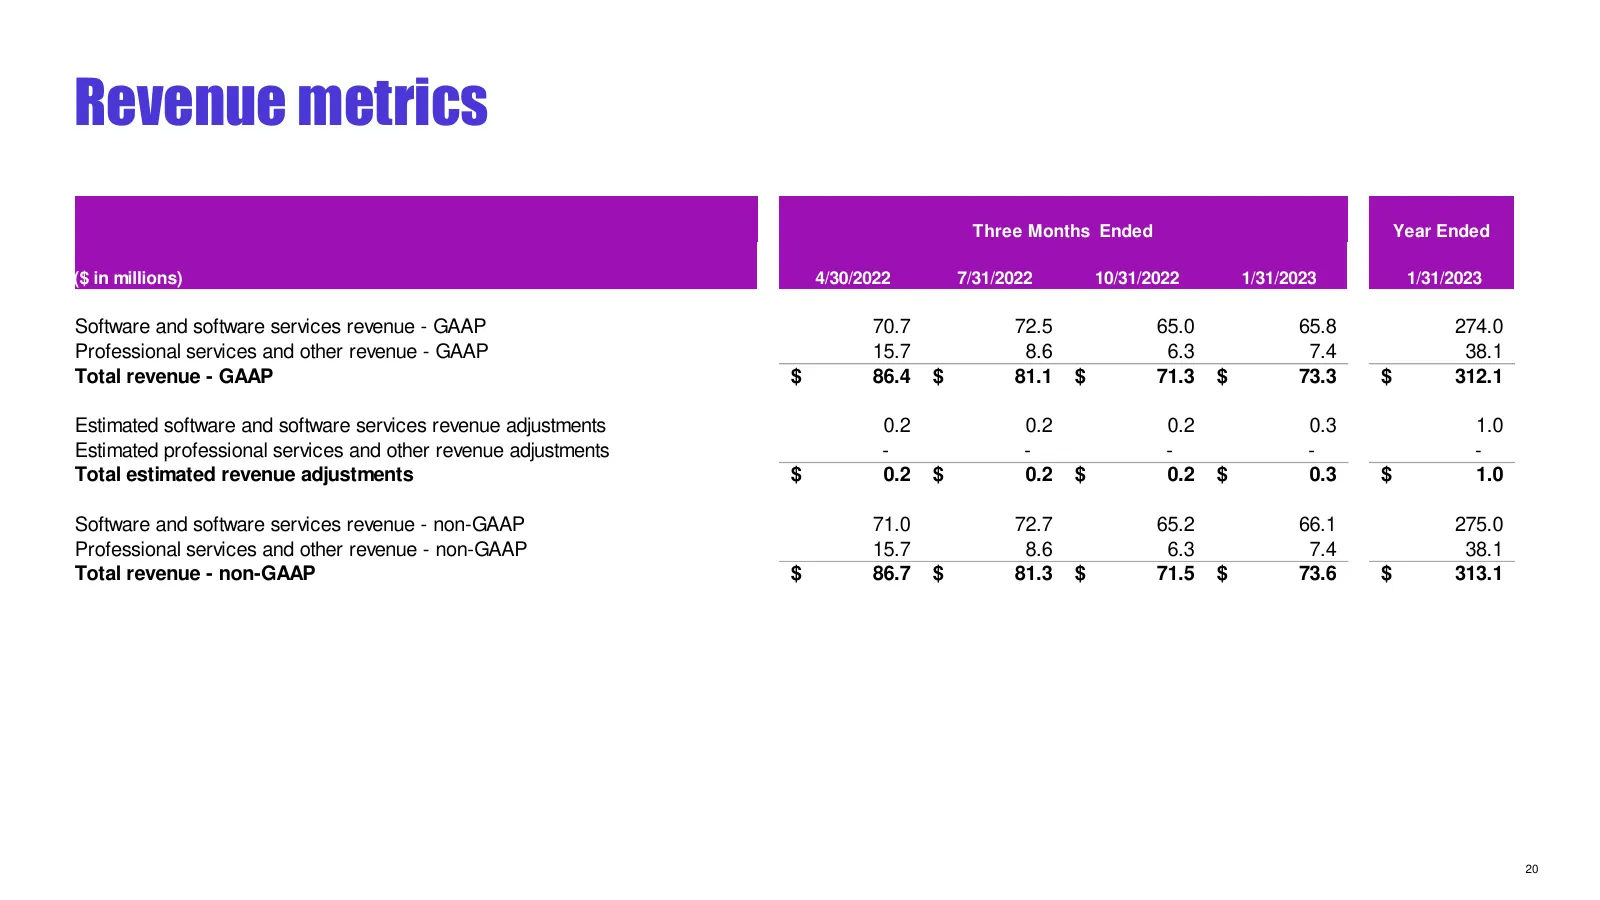
Slide 19: Revenue metrics
Revenue metrics Three Months Ended Year Ended ($ in millions) 4/30/2022 7/31/2022 10/31/2022 1/31/2023 1/31/2023 Software and software services revenue - GAAP 70.7 72.5 65.0 65.8 274.0 Professional services and other revenue - GAAP 15.7 8.6 6.3 7.4 38.1 Total revenue - GAAP $ 86.4 $ 81.1 $ 71.3 $ 73
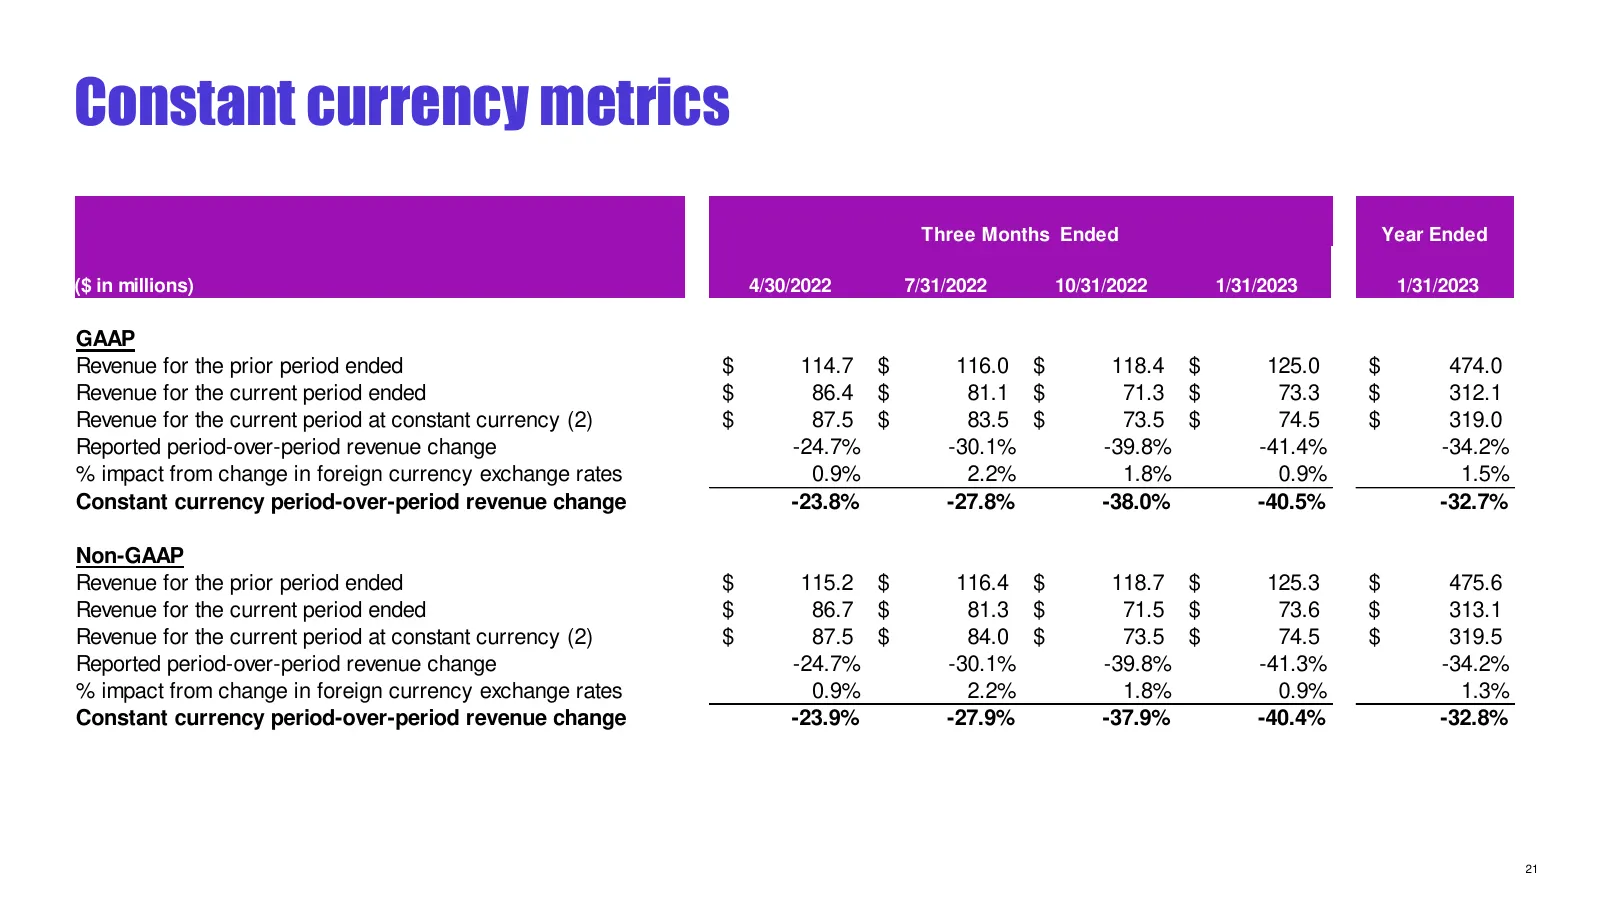
Slide 20: Constant currency metrics
Constant currency metrics Three Months Ended Year Ended ($ in millions) 4/30/2022 7/31/2022 10/31/2022 1/31/2023 1/31/2023 GAAP Revenue for the prior period ended $ 114.7 $ 116.0 $ 118.4 $ 125.0 $ 474.0 Revenue for the current period ended $ 86.4 $ 81.1 $ 71.3 $ 73.3 $ 312.1 Revenue for the current
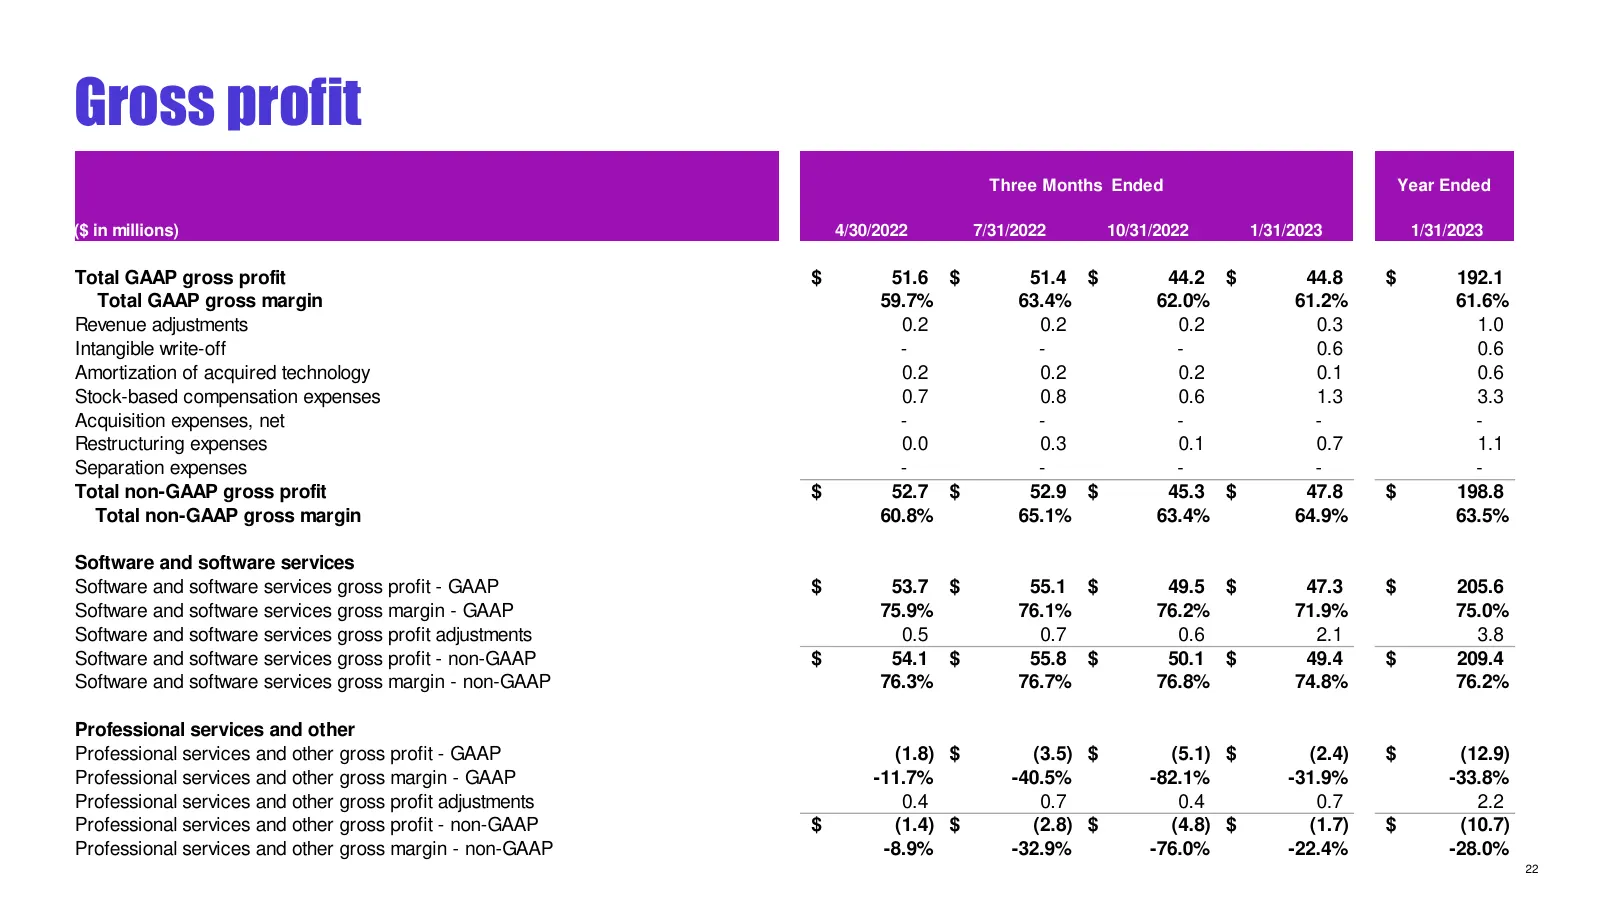
Slide 21: Gross profit
Gross profit Three Months Ended Year Ended ($ in millions) 4/30/2022 7/31/2022 10/31/2022 1/31/2023 1/31/2023 Total GAAP gross profit $ 51.6 $ 51.4 $ 44.2 $ 44.8 $ 192.1 Total GAAP gross margin 59.7% 63.4% 62.0% 61.2% 61.6% Revenue adjustments 0.2 0.2 0.2 0.3 1.0 Intangible write-off - - - 0.6 0.6 A
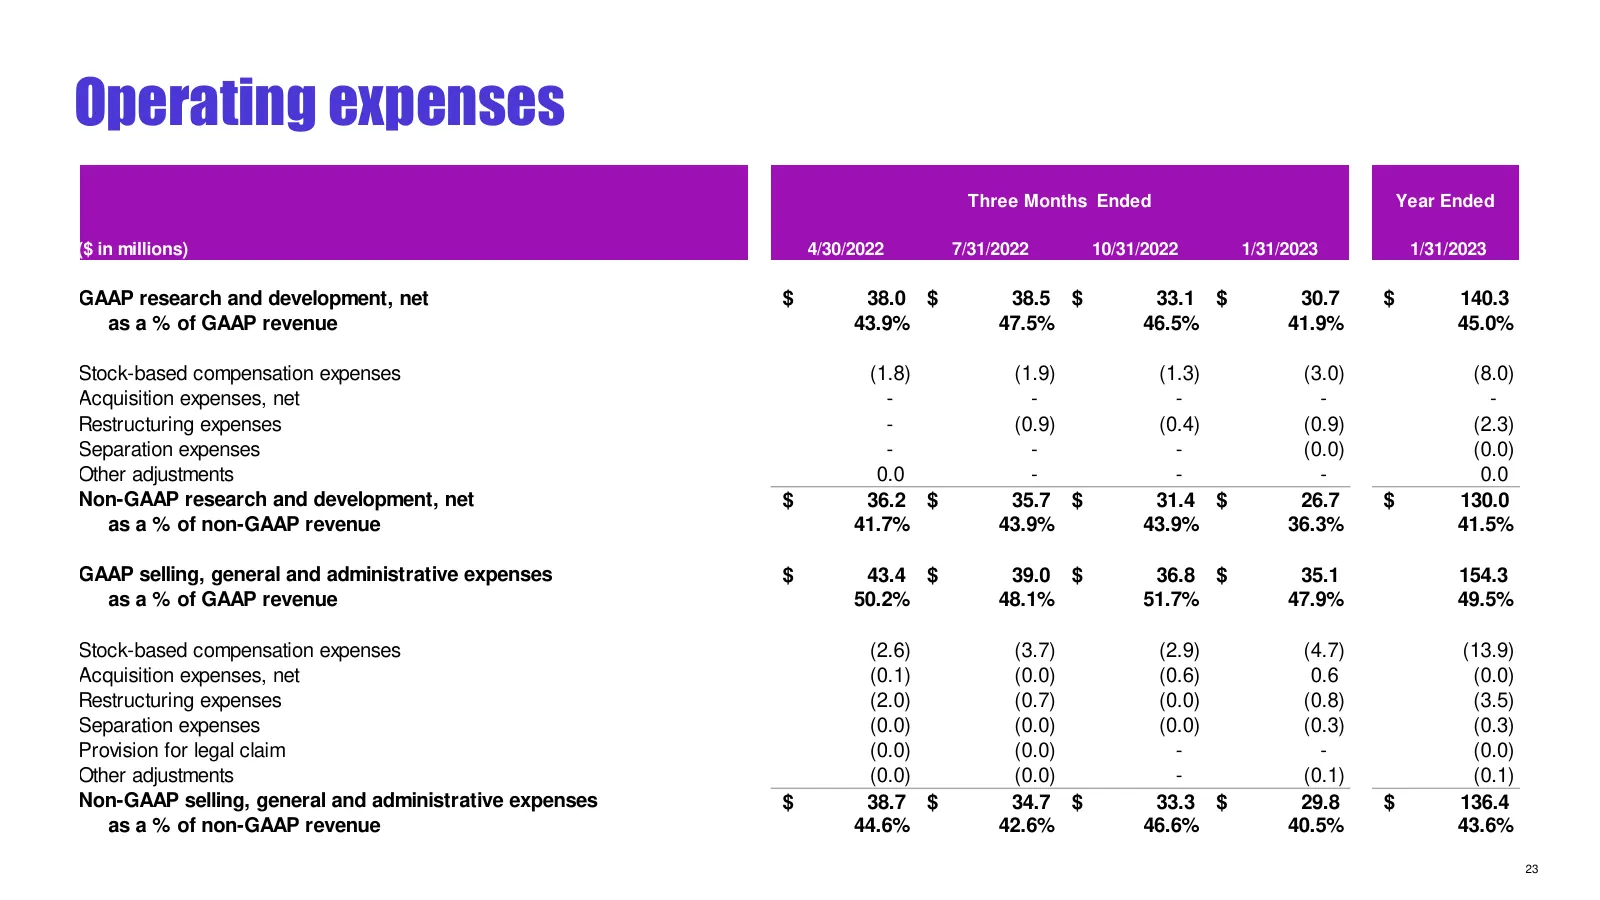
Slide 22: Operating expenses
Operating expenses Three Months Ended Year Ended ($ in millions) 4/30/2022 7/31/2022 10/31/2022 1/31/2023 1/31/2023 GAAP research and development, net $ 38.0 $ 38.5 $ 33.1 $ 30.7 $ 140.3 as a % of GAAP revenue 43.9% 47.5% 46.5% 41.9% 45.0% Stock-based compensation expenses (1.8) (1.9) (1.3) (3.0) (8
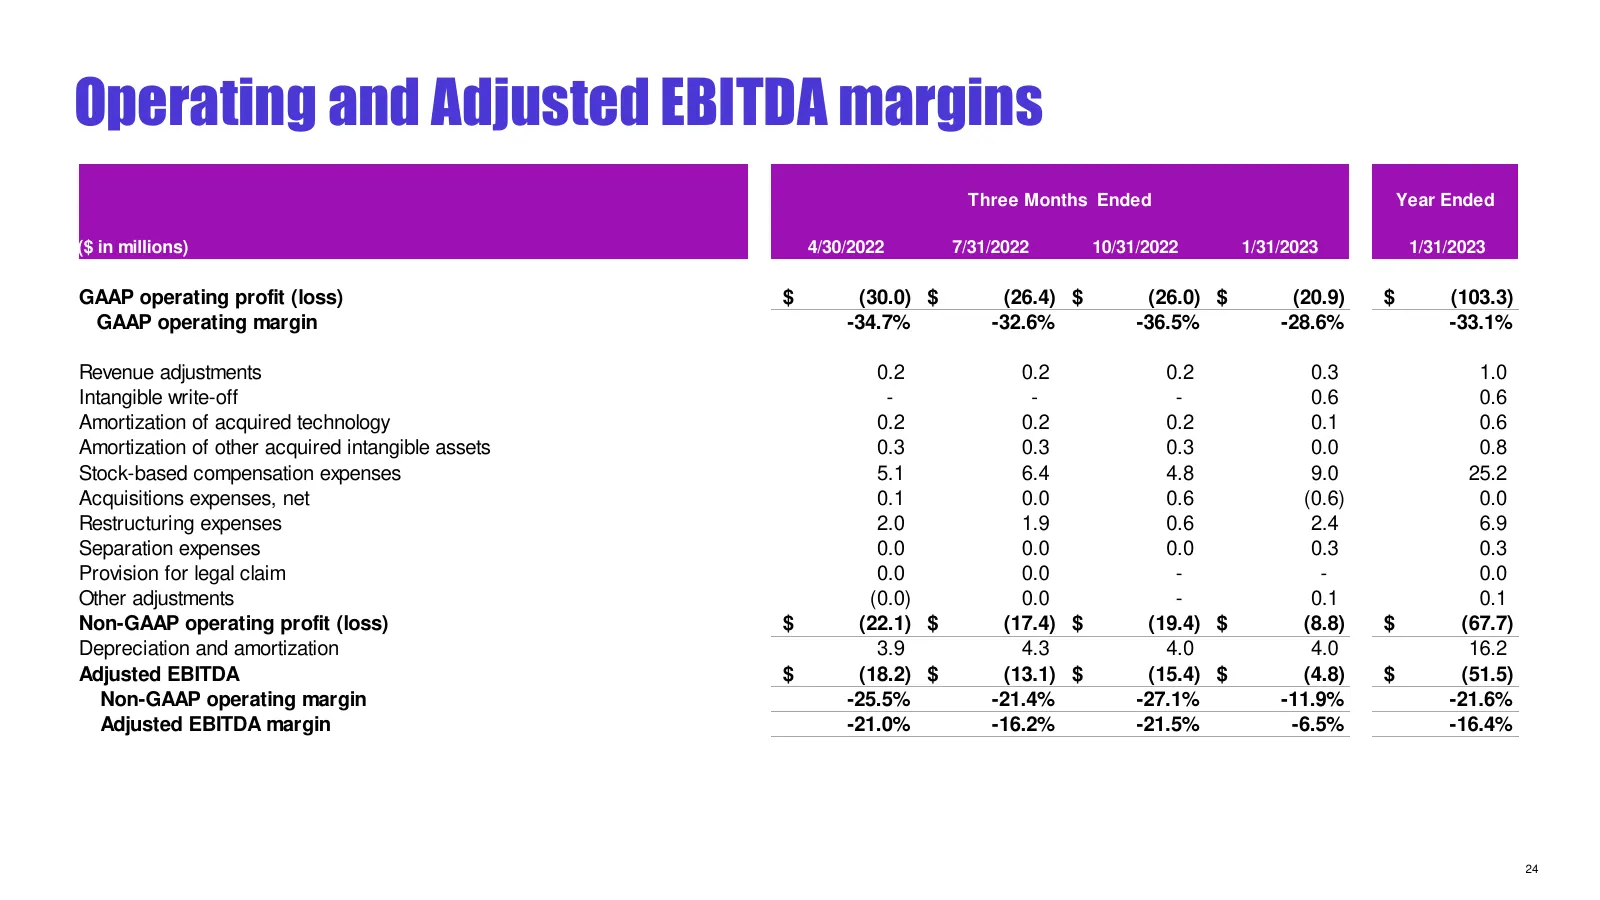
Slide 23: Operating and Adjusted EBITDA margins
Operating and Adjusted EBITDA margins Three Months Ended Year Ended ($ in millions) 4/30/2022 7/31/2022 10/31/2022 1/31/2023 1/31/2023 GAAP operating profit (loss) $ (30.0) $ (26.4) $ (26.0) $ (20.9) $ (103.3) GAAP operating margin -34.7% -32.6% -36.5% -28.6% -33.1% Revenue adjustments 0.2 0.2 0.2 0
Slide 24: Other Income, Tax and Net Income
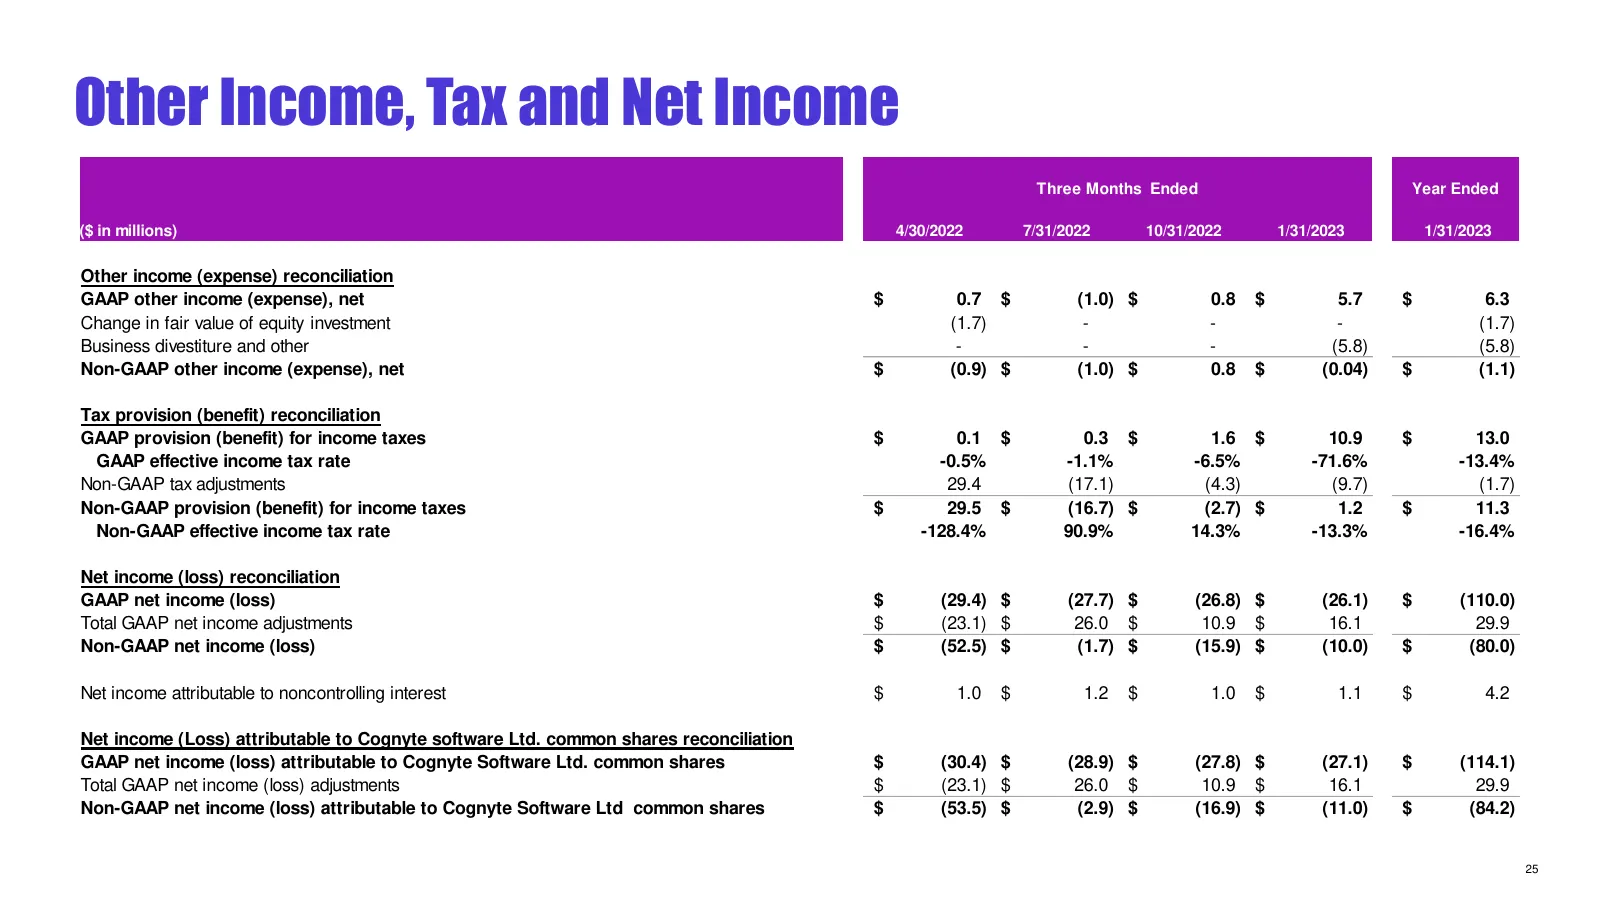
Other Income, Tax and Net Income Three Months Ended Year Ended ($ in millions) 4/30/2022 7/31/2022 10/31/2022 1/31/2023 1/31/2023 Other income (expense) reconciliation GAAP other income (expense), net $ 0.7 $ (1.0) $ 0.8 $ 5.7 $ 6.3 Change in fair value of equity investment (1.7) - - - (1.7) Busines
Slide 25: EPS
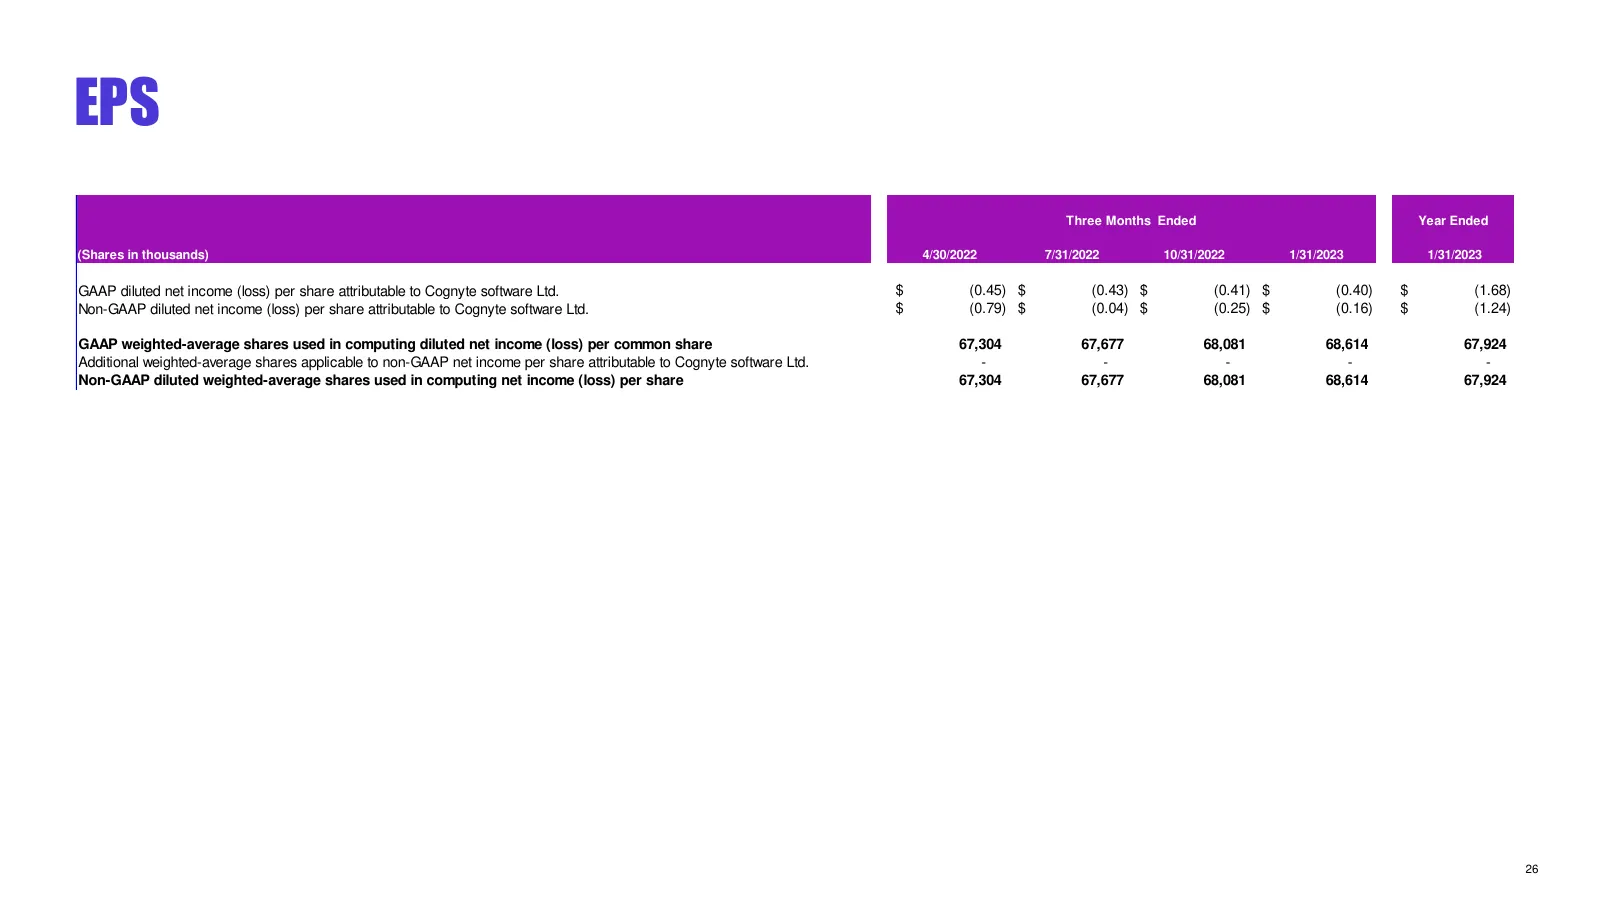
EPS Three Months Ended Year Ended (Shares in thousands) 4/30/2022 7/31/2022 10/31/2022 1/31/2023 1/31/2023 GAAP diluted net income (loss) per share attributable to Cognyte software Ltd. $ (0.45) $ (0.43) $ (0.41) $ (0.40) $ (1.68) Non-GAAP diluted net income (loss) per share attributable to Cognyte
Slide 26: Footnotes
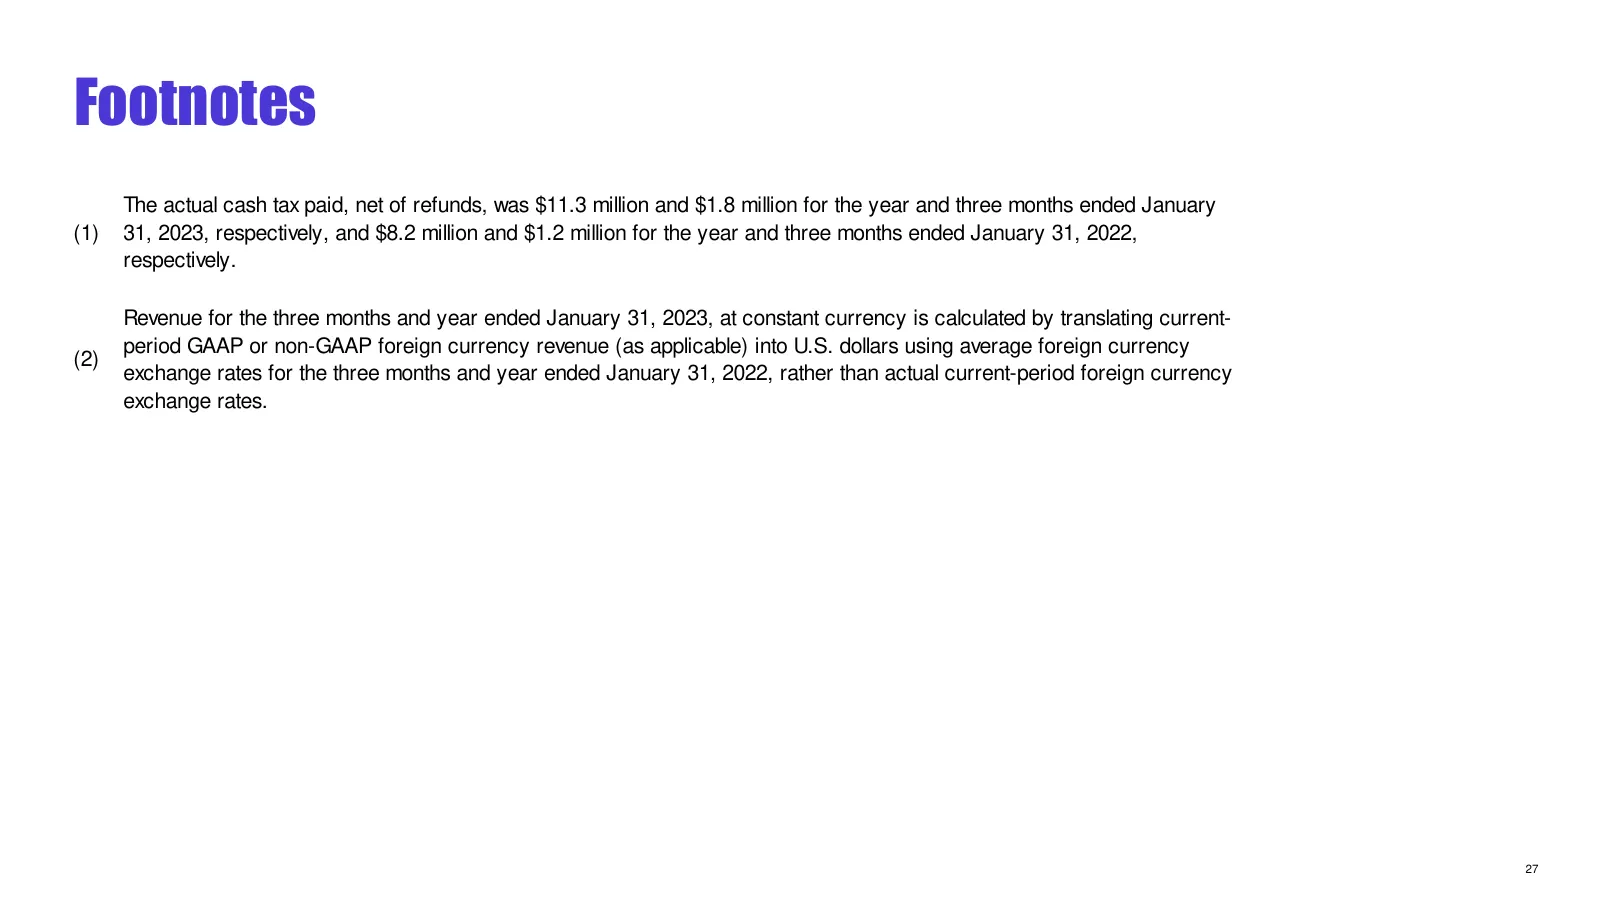
Footnotes The actual cash tax paid, net of refunds, was $11.3 million and $1.8 million for the year and three months ended January (1) 31, 2023, respectively, and $8.2 million and $1.2 million for the year and three months ended January 31, 2022, respectively. Revenue for the three months and year e
Slide 27: Supplemental information and non-GAAP measures
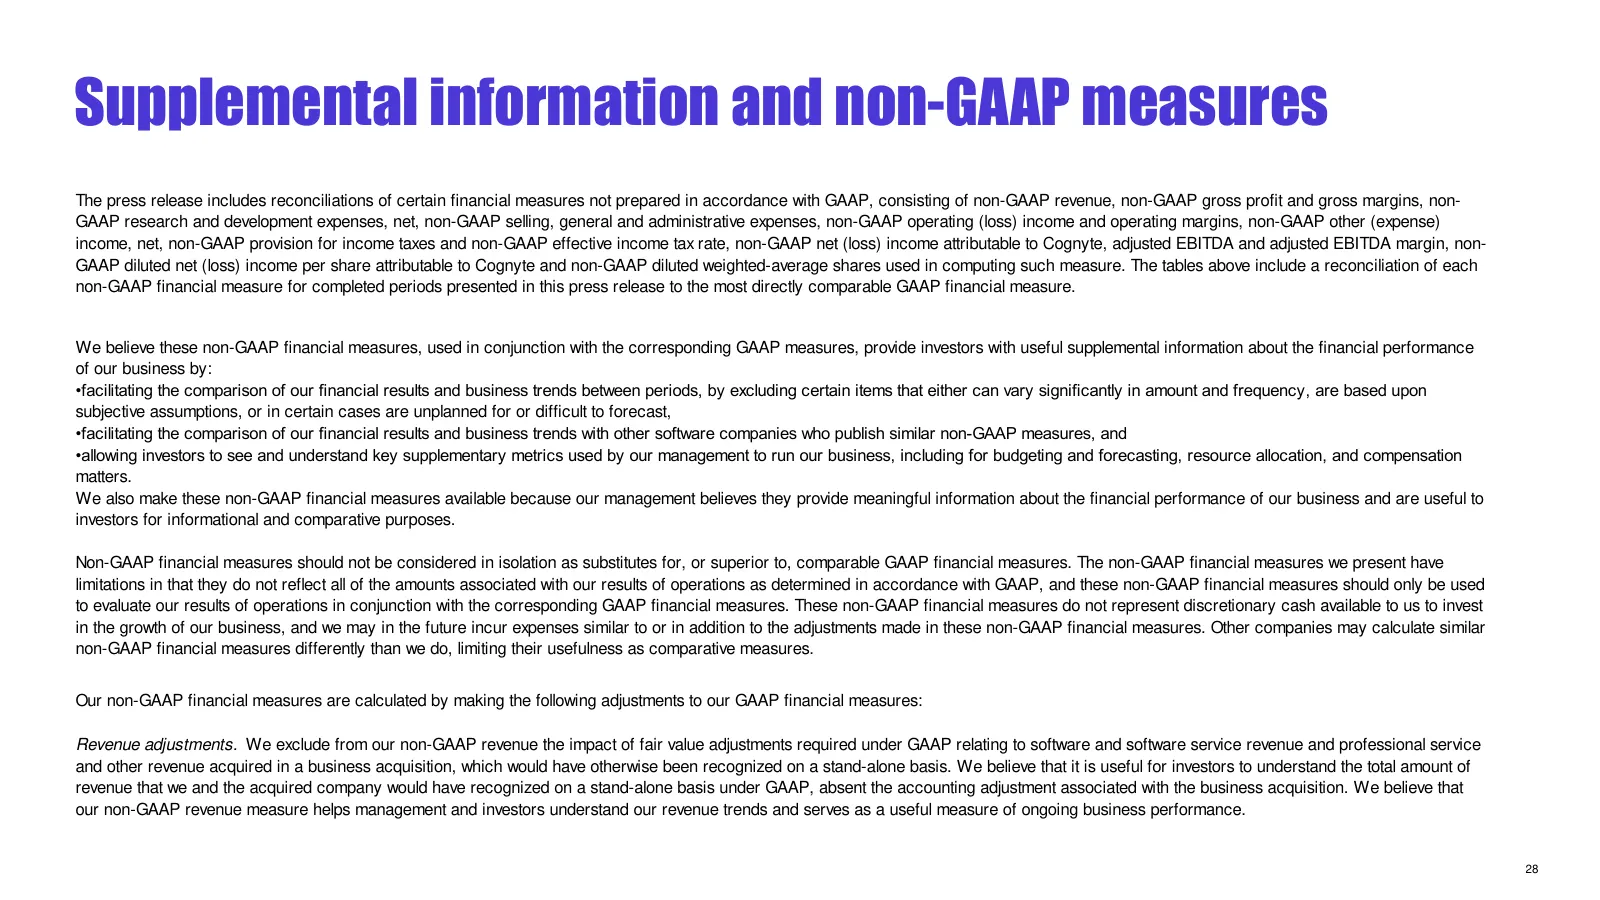
Supplemental information and non-GAAP measures The press release includes reconciliations of certain financial measures not prepared in accordance with GAAP, consisting of non-GAAP revenue, non-GAAP gross profit and gross margins, non- GAAP research and development expenses, net, non-GAAP selling, g
Slide 28: Supplemental information and non-GAAP measures
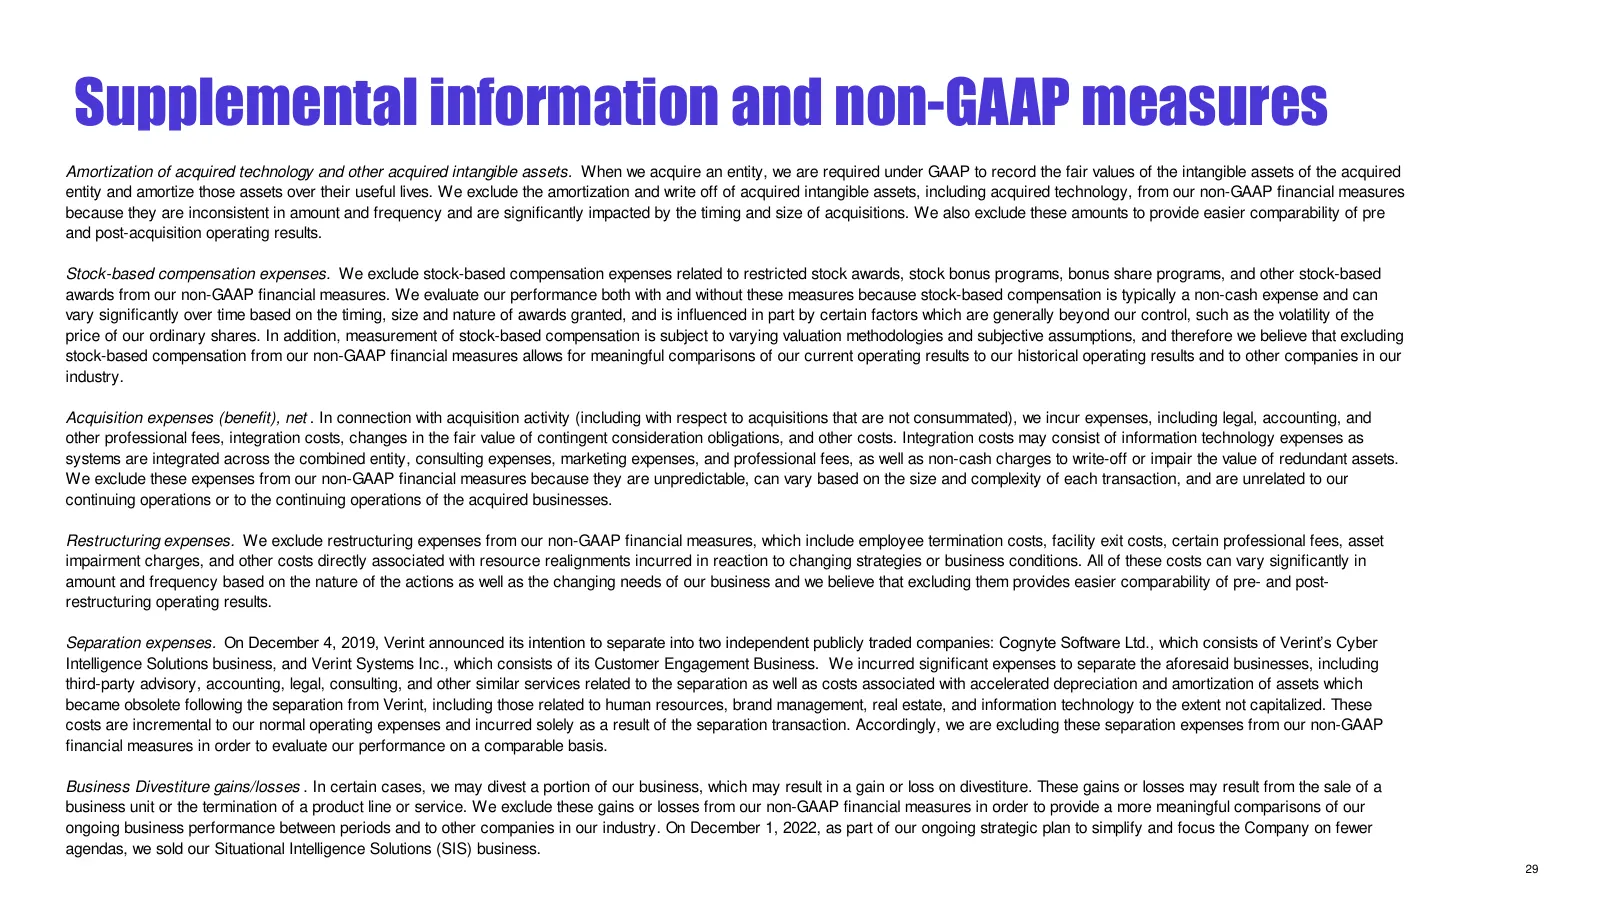
Supplemental information and non-GAAP measures Amortization of acquired technology and other acquired intangible assets. When we acquire an entity, we are required under GAAP to record the fair values of the intangible assets of the acquired entity and amortize those assets over their useful lives.
Slide 29: Supplemental information and non-GAAP measures
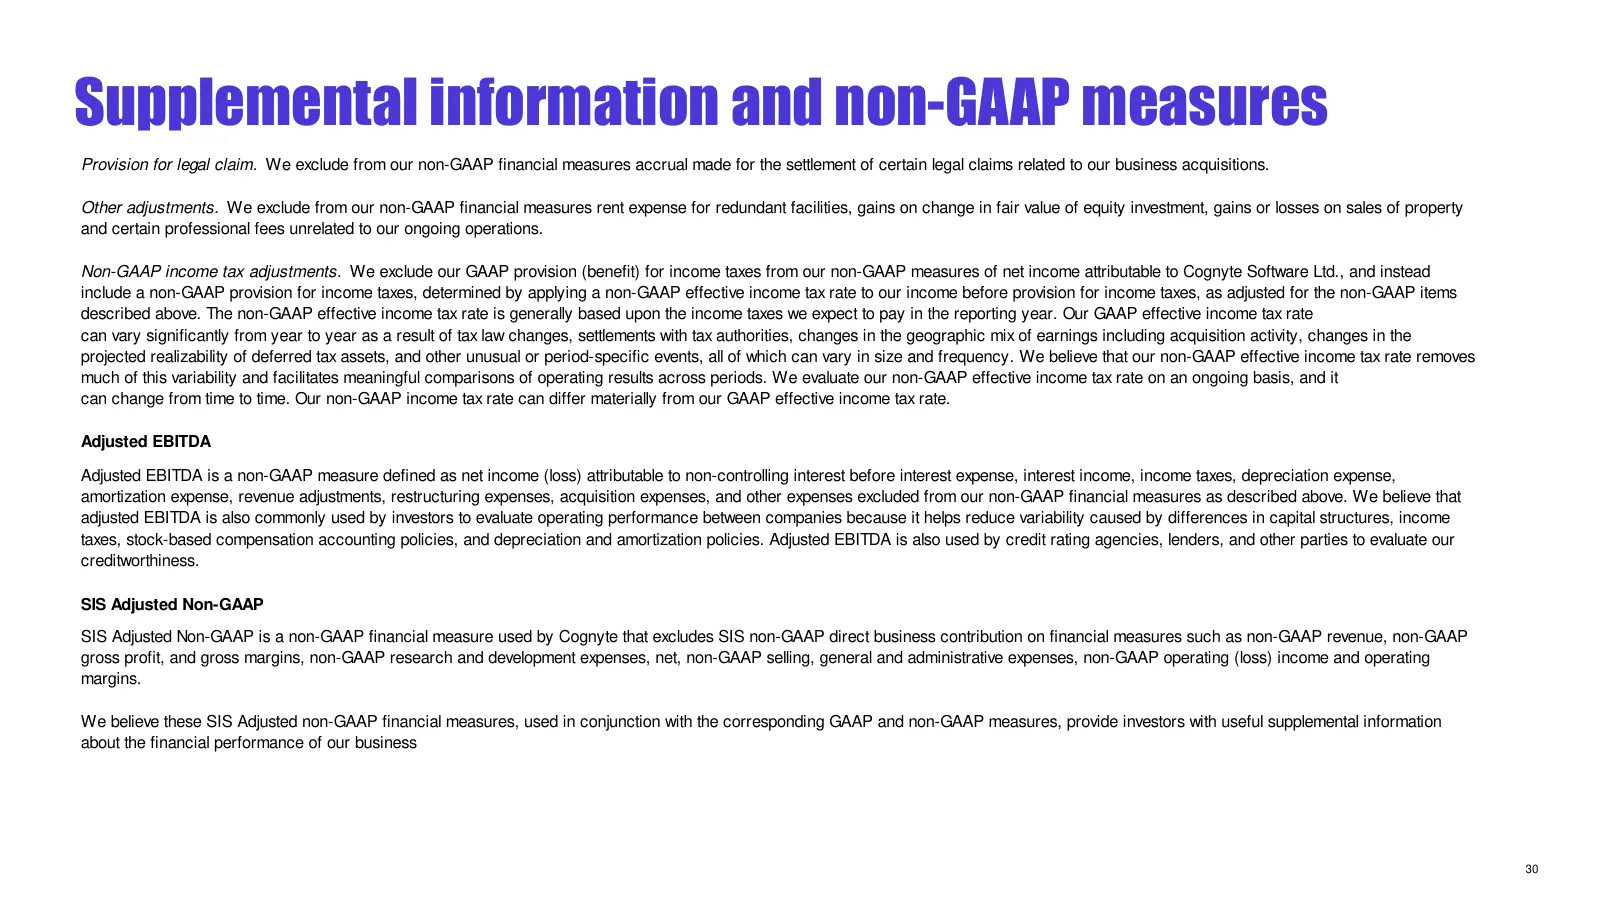
Supplemental information and non-GAAP measures Provision for legal claim. We exclude from our non-GAAP financial measures accrual made for the settlement of certain legal claims related to our business acquisitions. Other adjustments. We exclude from our non-GAAP financial measures rent expense for
Slide 30: Supplemental information and non-GAAP measures
Supplemental information and non-GAAP measures Supplemental Information About Constant Currency Because we operate on a global basis and transact business in many currencies, fluctuations in foreign currency exchange rates can affect our consolidated U.S. dollar operating results. To facilitate the
Source: Internet Archive copy of cognyte.com
More decks from Cognyte Software Ltd.
 Q2 FYE27 Earnings Presentation20 slides · Sep 9, 2026
 Investor Presentation (September 2026)22 slides · September 2026
 Q1 2027 Earnings Presentation17 slides · Jun 3, 2026
 Investor Presentation (June 2026)20 slides · June 2026
 Cognyte — Investor Presentation (April 2026)21 slides · April 2026
 Cognyte — Investor Presentation (April 2026)20 slides · April 2026