Enghouse Systems Limited · TSX:ENGH
Enghouse Systems — Q2 2021 Earnings Presentation
15 slides from Enghouse Systems's earnings presentation, Jun 11, 2021
Slide 1: Enghouse Overview - Corporate Presentation
Corporate Enghouse Overview - Corporate Presentation Q3 FY 18 Q2 FY21 1
Slide 2: Forward-Looking Statements Disclaimer
Forward-Looking Statements Disclaimer Certain statements made in this presentation and the related materials may contain forward-looking statements, which are not historical facts, but are based on certain assumptions and reflect Enghouse’s current expectations. These forward-looking statements are
Slide 3: Strategy
Strategy Two-pronged growth strategy focused on internal growth and acquisitions The Company is organized around two business segments delivering solutions for remote work, visual computing and communications for next generation software defined networks: ➢ Interactive Management Group (“IMG”) ▪ Cus
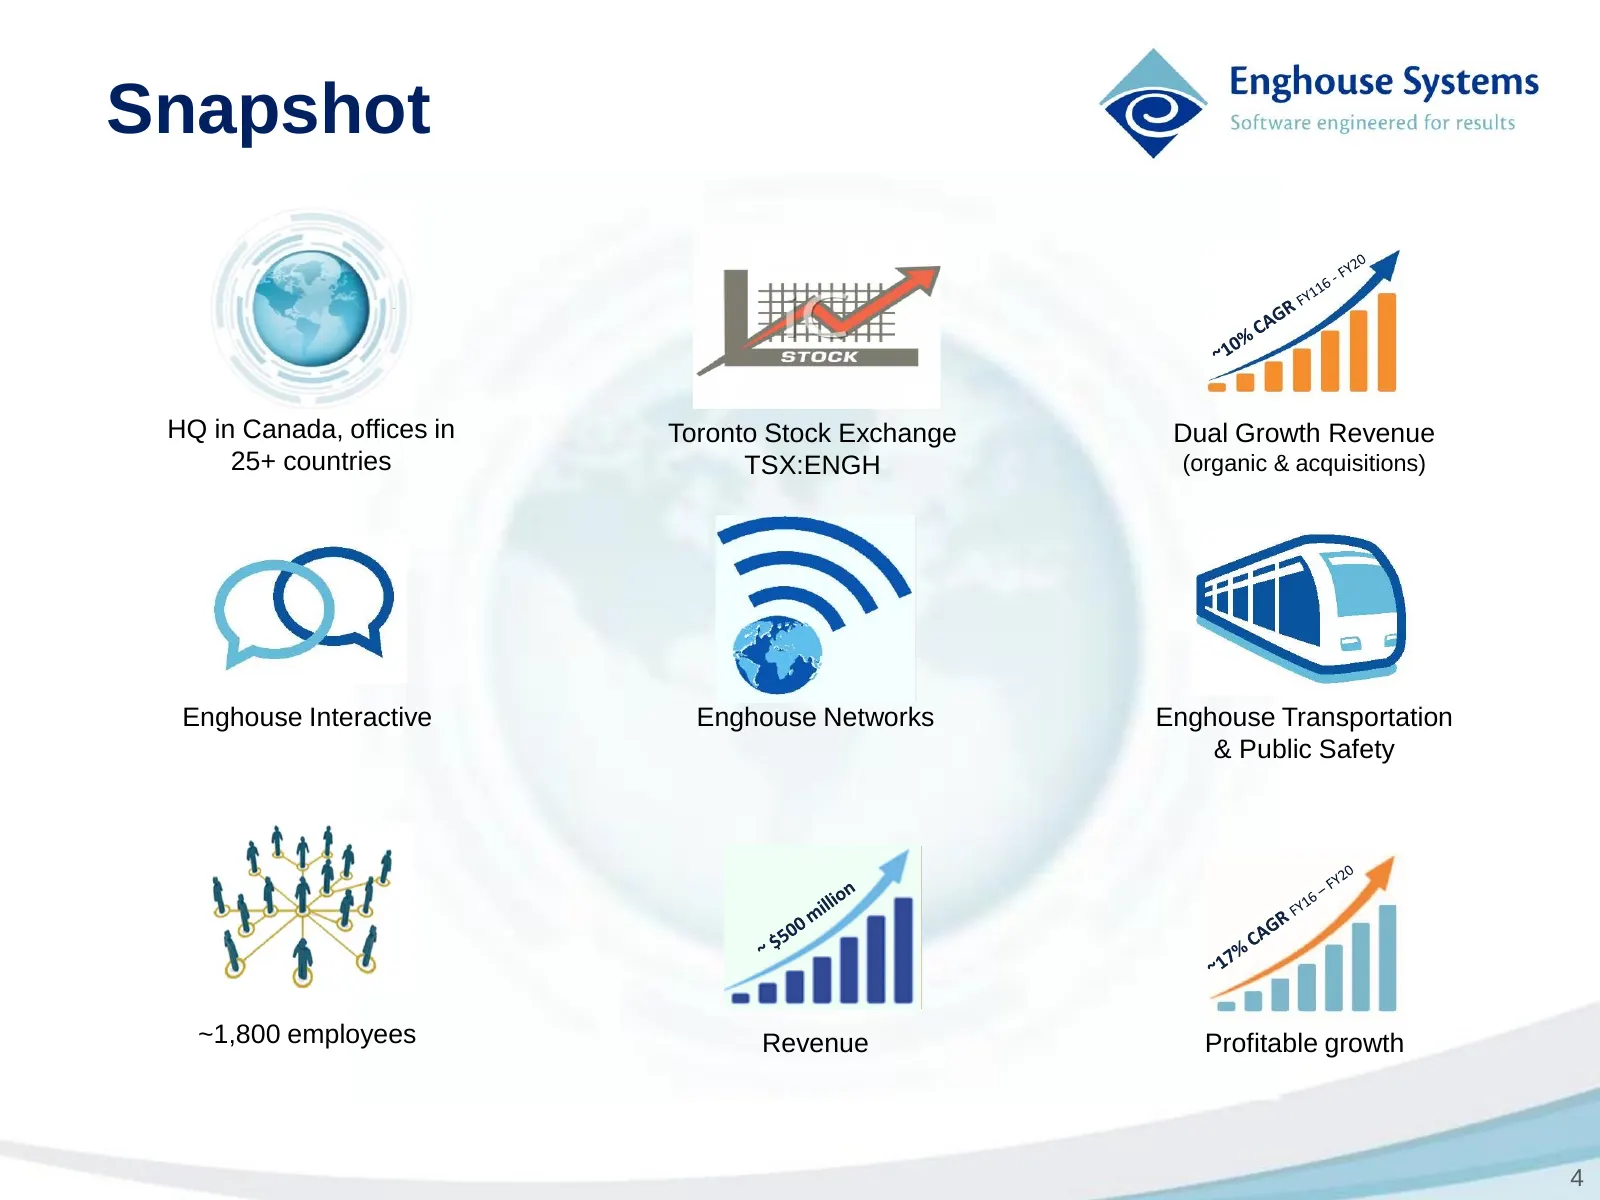
Slide 4: Snapshot
Snapshot HQ in Canada, offices in Toronto Stock Exchange Dual Growth Revenue 25+ countries TSX:ENGH (organic & acquisitions) Enghouse Interactive Enghouse Networks Enghouse Transportation & Public Safety ~1,800 employees Revenue Profitable growth 4
Slide 5: Interactive Portfolio
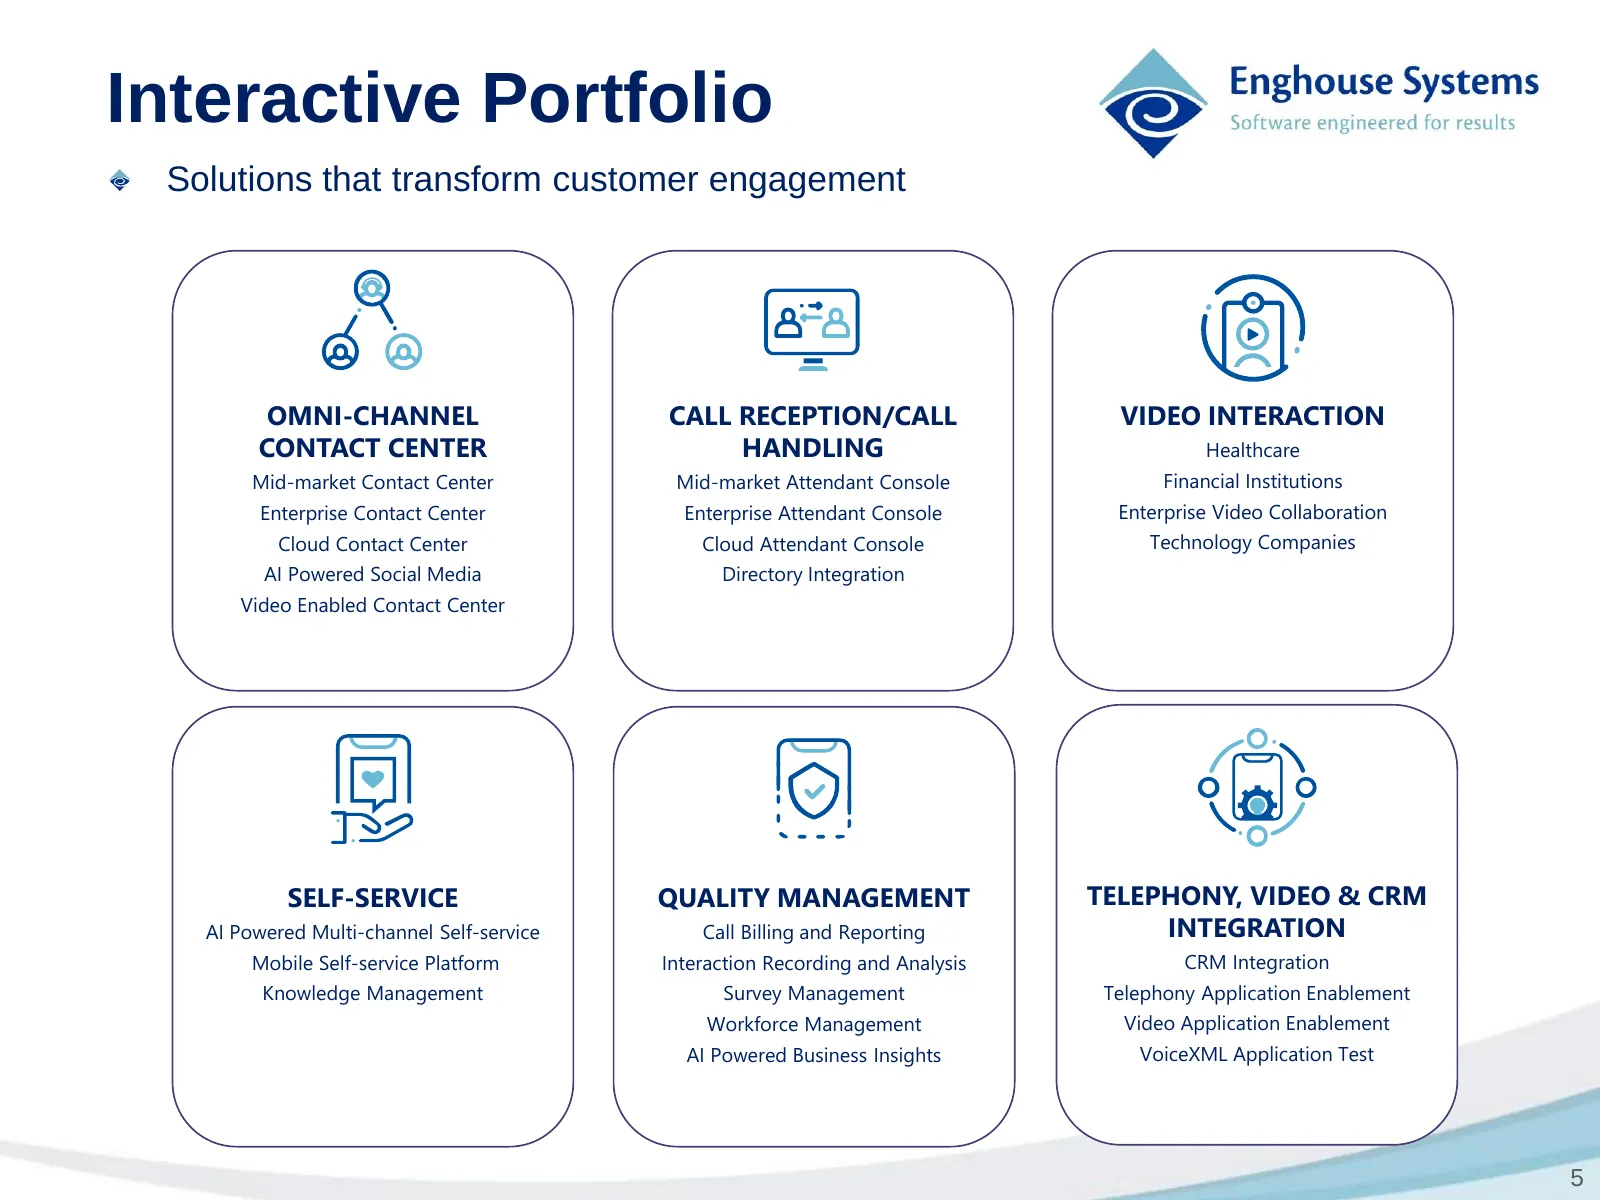
Interactive Portfolio Solutions that transform customer engagement OMNI-CHANNEL CALL RECEPTION/CALL VIDEO INTERACTION CONTACT CENTER HANDLING Healthcare Mid-market Contact Center Mid-market Attendant Console Financial Institutions Enterprise Contact Center Enterprise Attendant Console Enterprise Vid
Slide 6: Networks Portfolio
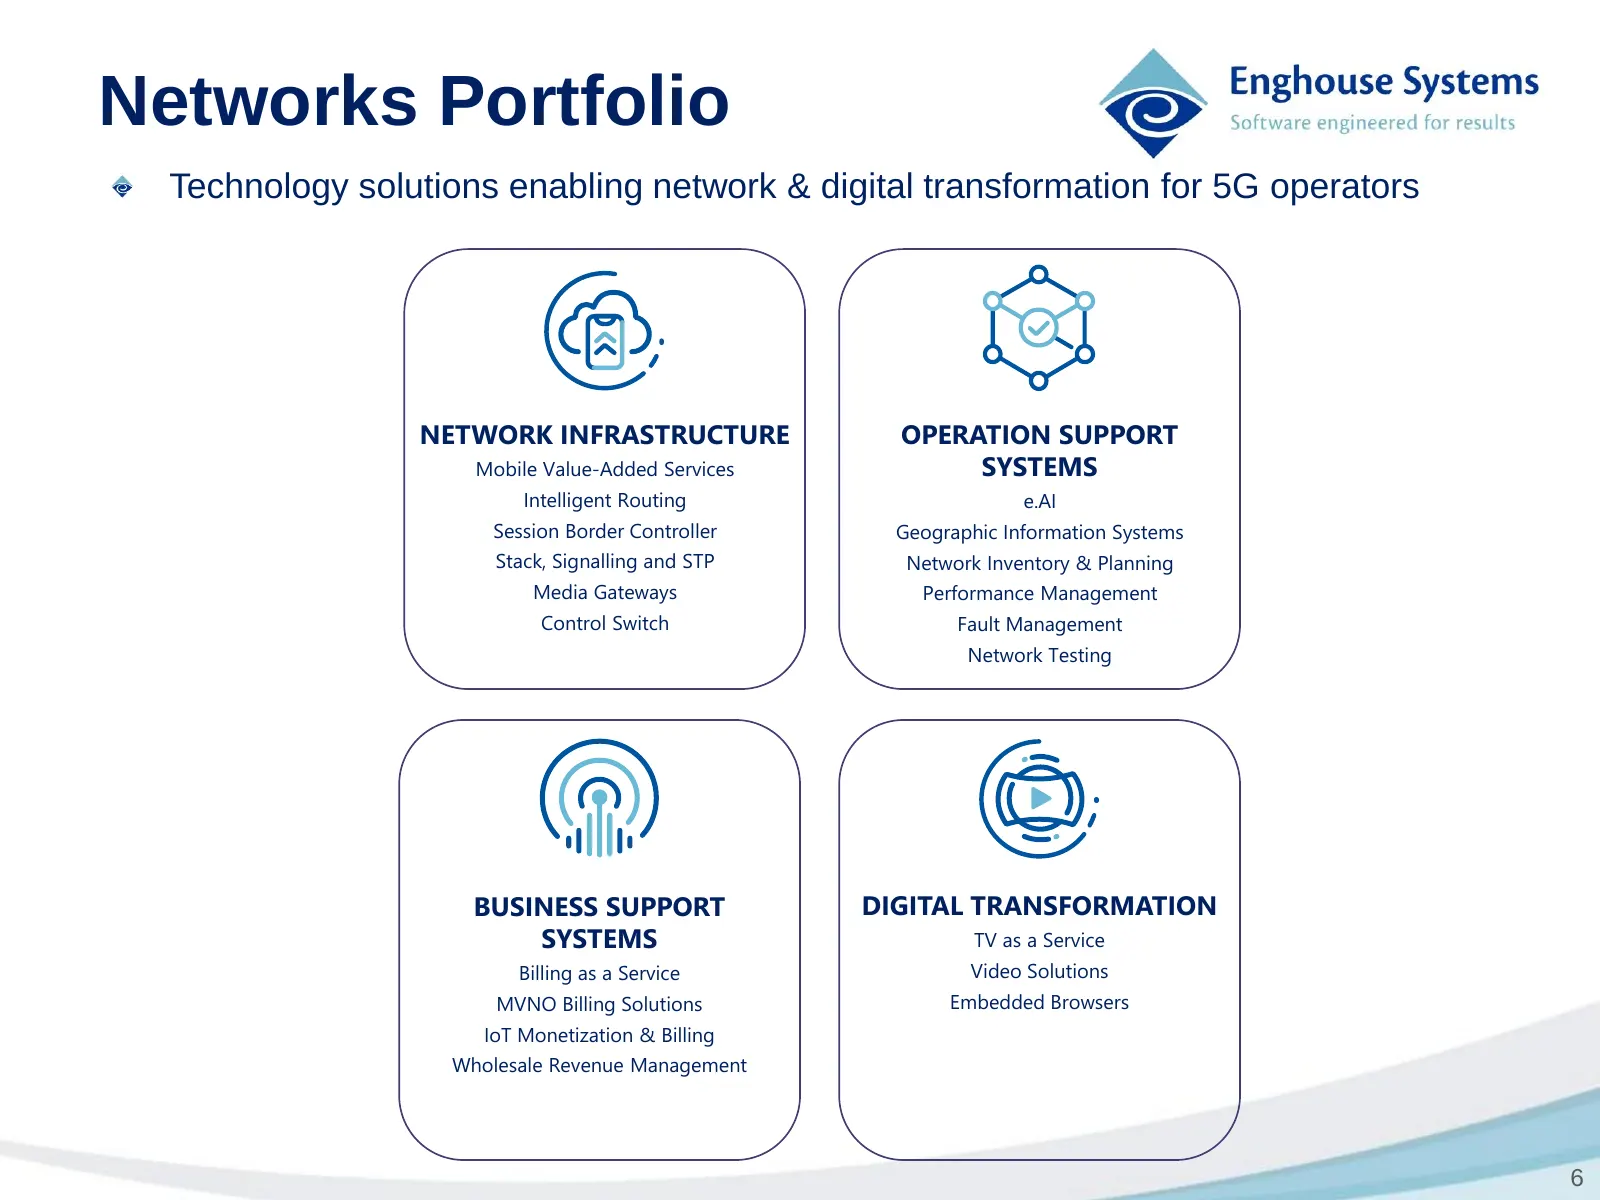
Networks Portfolio Technology solutions enabling network & digital transformation for 5G operators NETWORK INFRASTRUCTURE OPERATION SUPPORT Mobile Value-Added Services SYSTEMS Intelligent Routing e.AI Session Border Controller Geographic Information Systems Stack, Signalling and STP Network Inventor
Slide 7: Transportation & Public Safety Portfolio
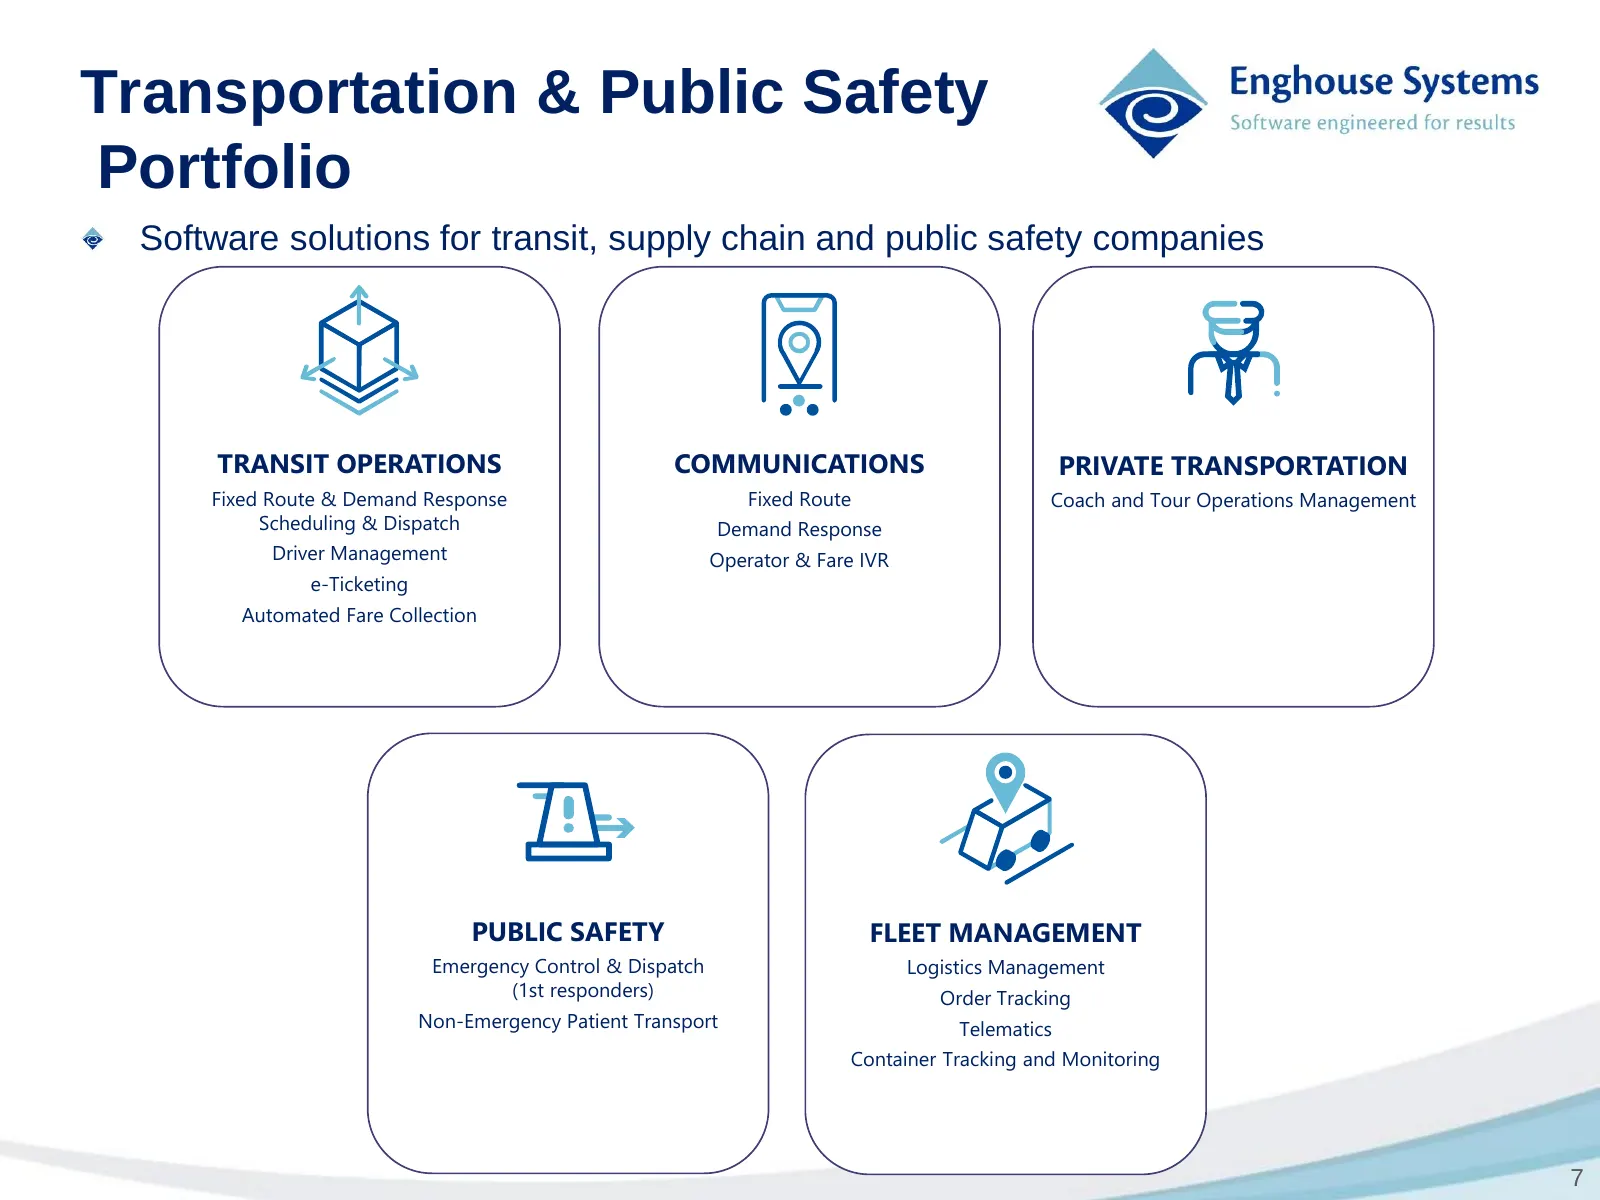
Transportation & Public Safety Portfolio Software solutions for transit, supply chain and public safety companies TRANSIT OPERATIONS COMMUNICATIONS PRIVATE TRANSPORTATION Fixed Route & Demand Response Fixed Route Coach and Tour Operations Management Scheduling & Dispatch Demand Response Driver Manag
Slide 8: Annual Results
Enghouse Systems engineered for results e ANNUAL RESULTS
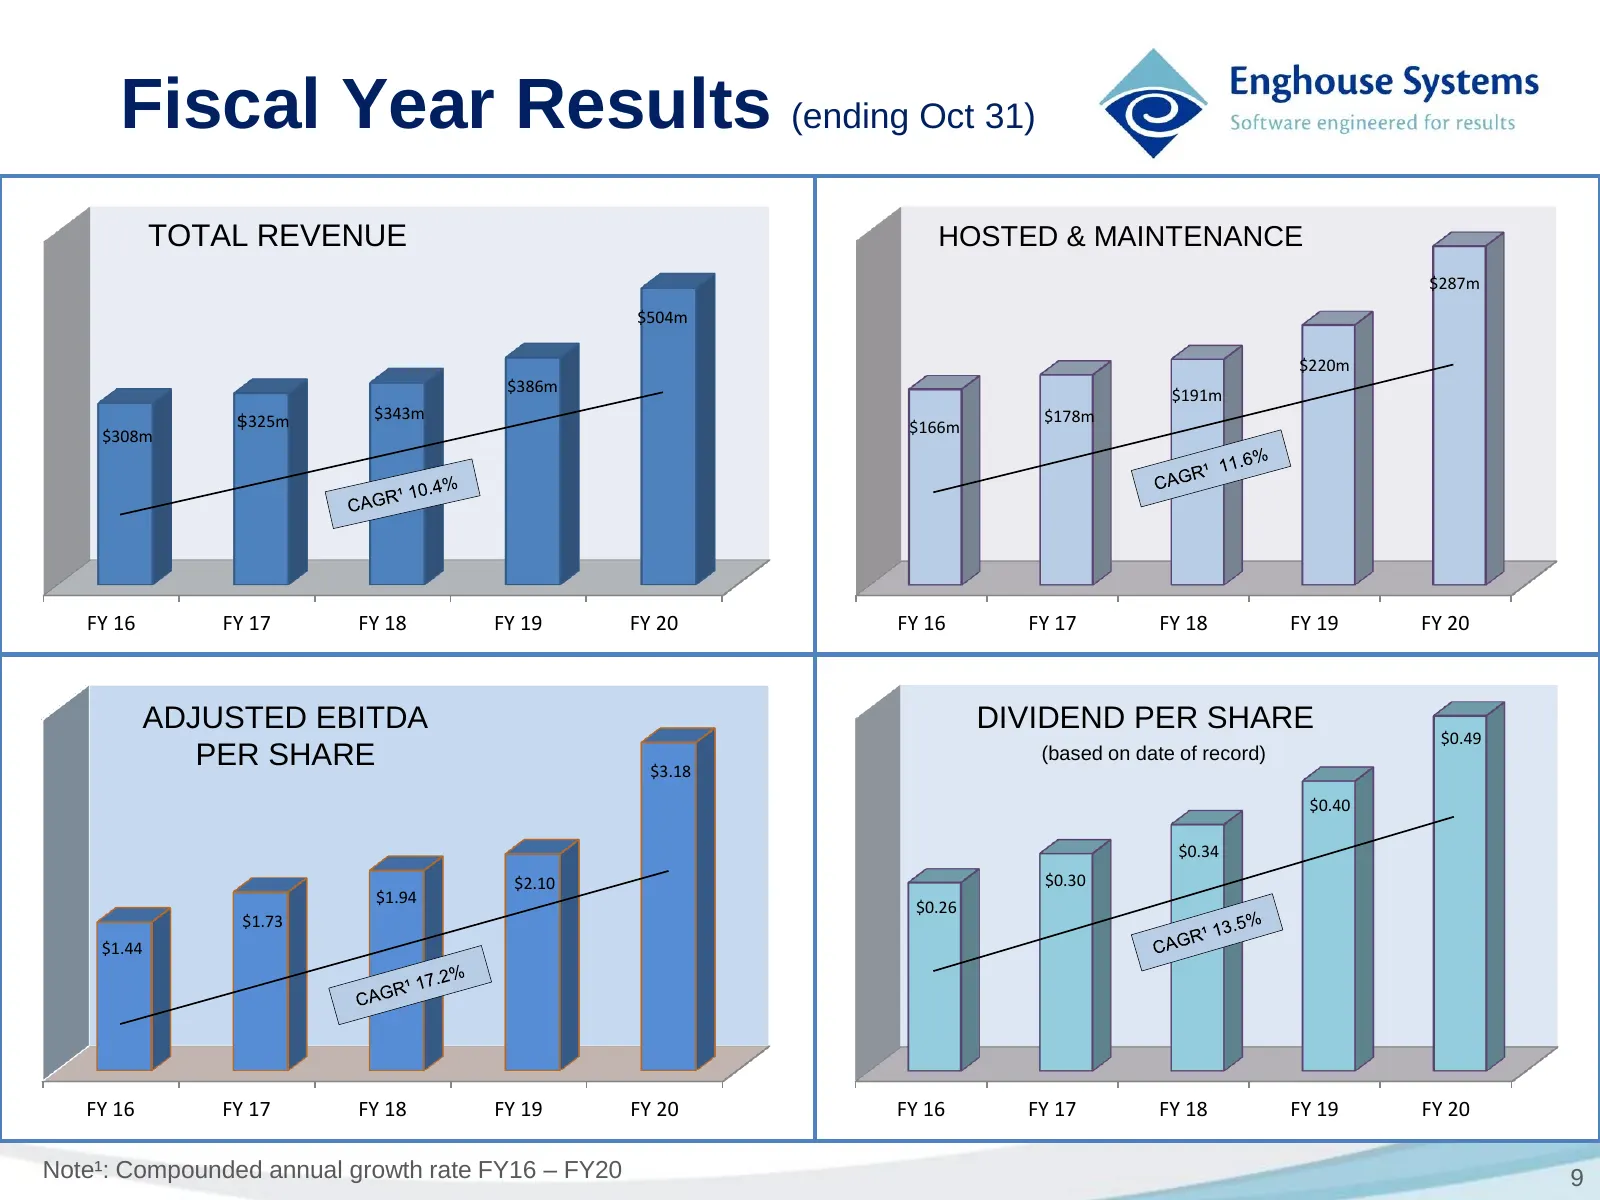
Slide 9: Fiscal Year Results (ending Oct 31)
Fiscal Year Results (ending Oct 31) TOTAL REVENUE HOSTED & MAINTENANCE $287m $504m $220m $386m $191m $325m $343m $178m $166m $308m FY 16 FY 17 FY 18 FY 19 FY 20 FY 16 FY 17 FY 18 FY 19 FY 20 ADJUSTED EBITDA DIVIDEND PER SHARE $0.49 PER SHARE $3.18 (based on date of record) $0.40 $0.34 $2.10 $0.30 $1
Slide 10: Q2 & YTD FY21
Q2 & YTD FY21 e Enghouse Systems Software engineered for results 10
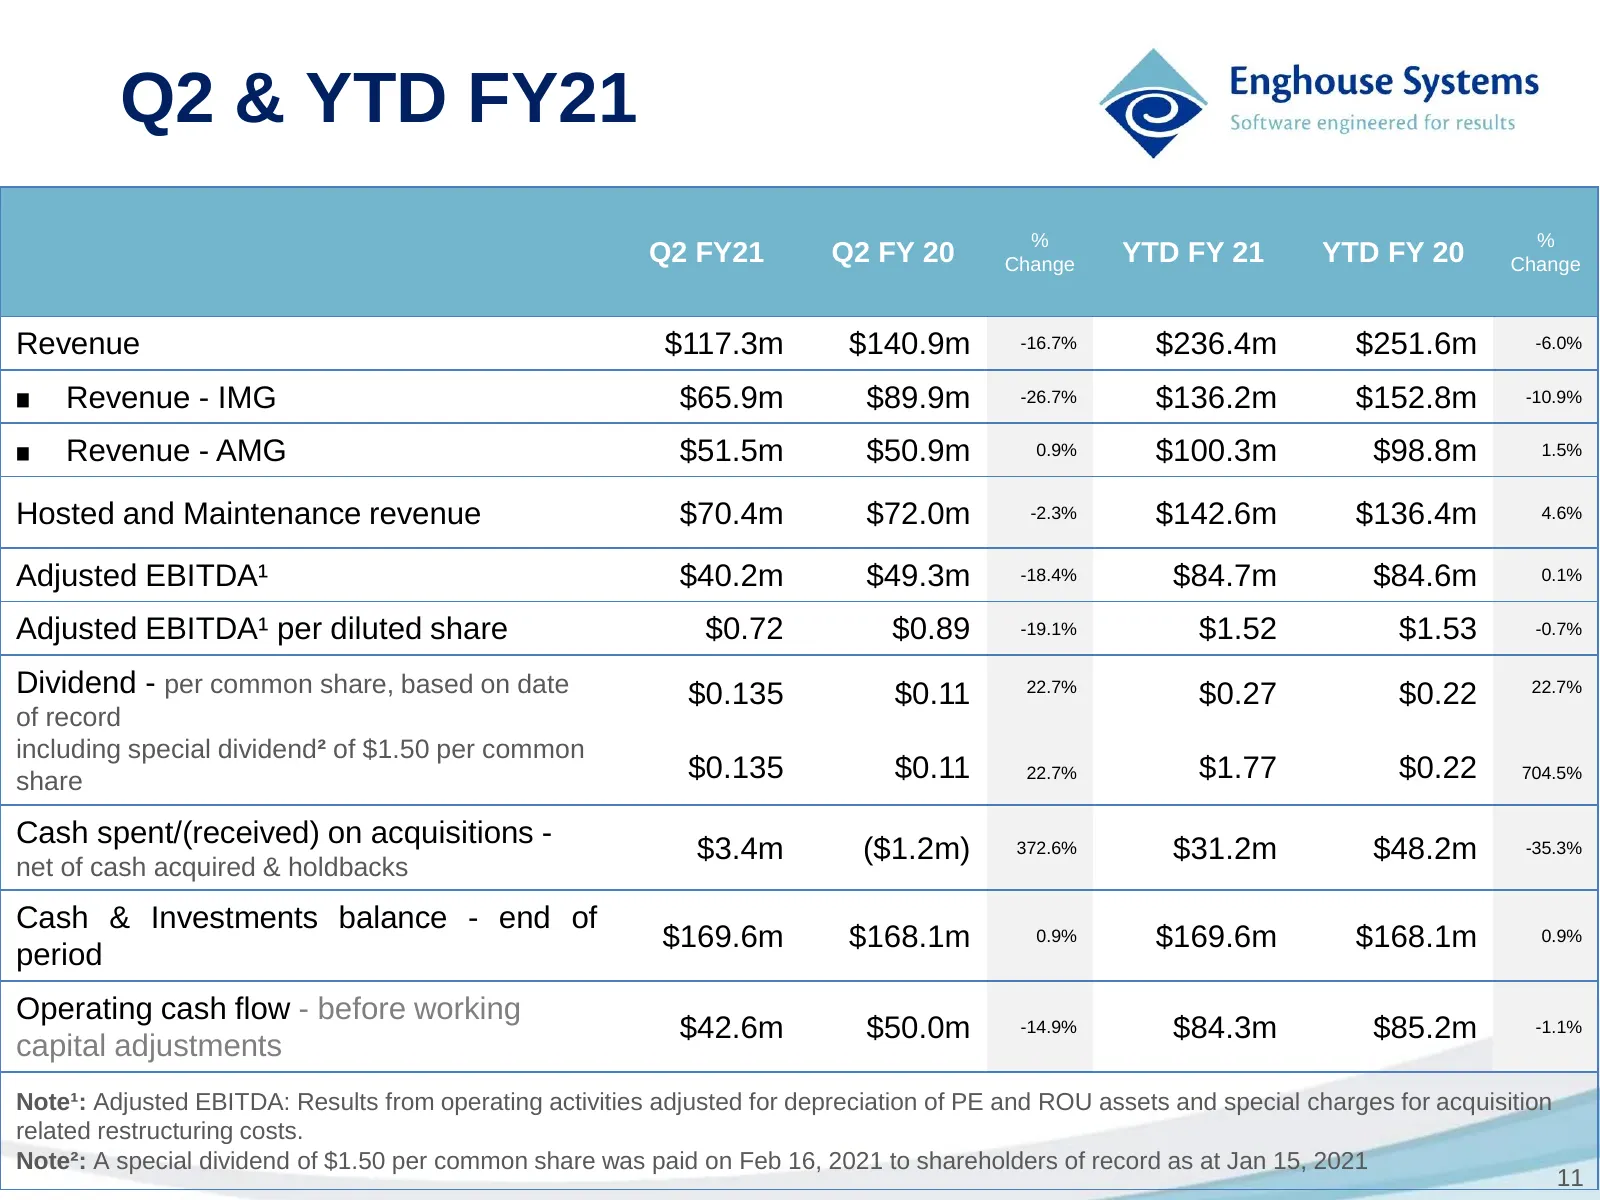
Slide 11: Q2 & YTD FY21
Q2 & YTD FY21 % % Q2 FY21 Q2 FY 20 Change YTD FY 21 YTD FY 20 Change Revenue $117.3m $140.9m -16.7% $236.4m $251.6m -6.0% Revenue - IMG $65.9m $89.9m -26.7% $136.2m $152.8m -10.9% Revenue - AMG $51.5m $50.9m 0.9% $100.3m $98.8m 1.5% Hosted and Maintenance revenue $70.4m $72.0m -2.3% $142.6m $136.4m
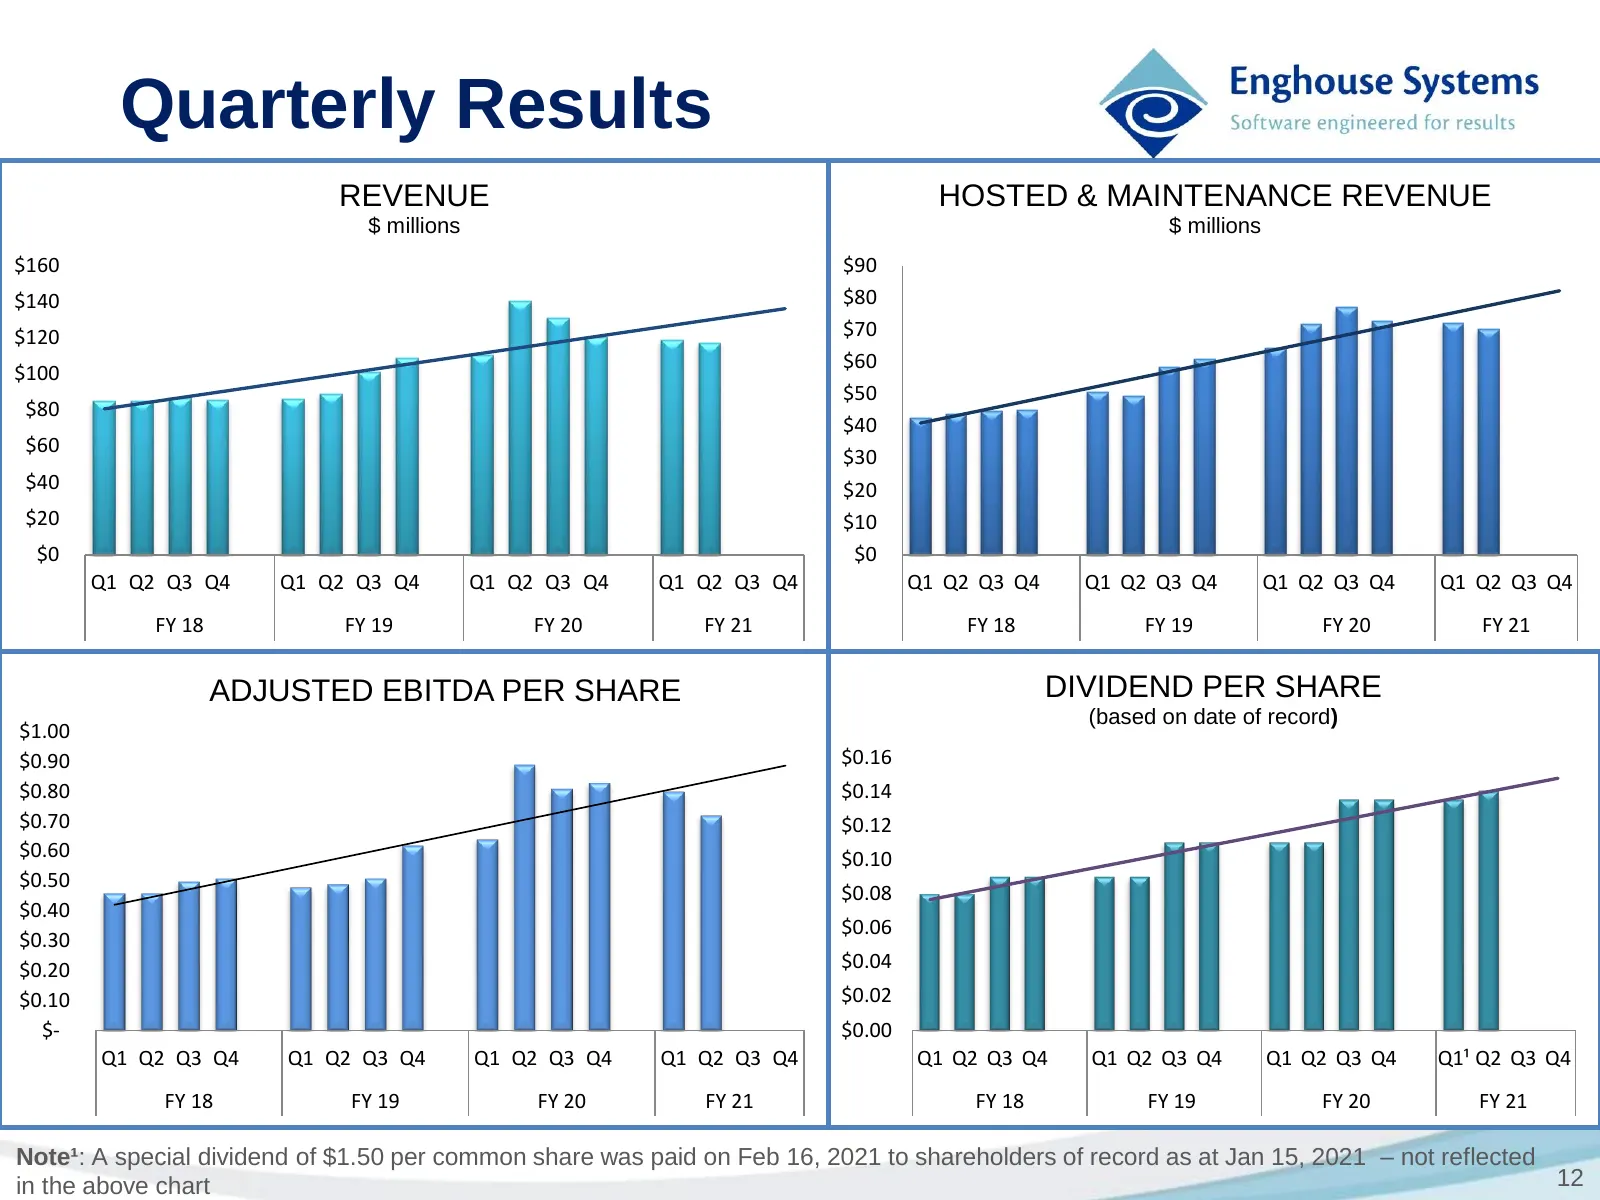
Slide 12: Quarterly Results
Quarterly Results REVENUE HOSTED & MAINTENANCE REVENUE $ millions $ millions $160 $90 $140 $80 $120 $70 $60 $100 $50 $80 $40 $60 $30 $40 $20 $20 $10 $0 $0 Q1 Q2 Q3 Q4 Q1 Q2 Q3 Q4 Q1 Q2 Q3 Q4 Q1 Q2 Q3 Q4 Q1 Q2 Q3 Q4 Q1 Q2 Q3 Q4 Q1 Q2 Q3 Q4 Q1 Q2 Q3 Q4 FY 18 FY 19 FY 20 FY 21 FY 18 FY 19 FY 20 FY 21 A
Slide 13: Acquisition Strategy
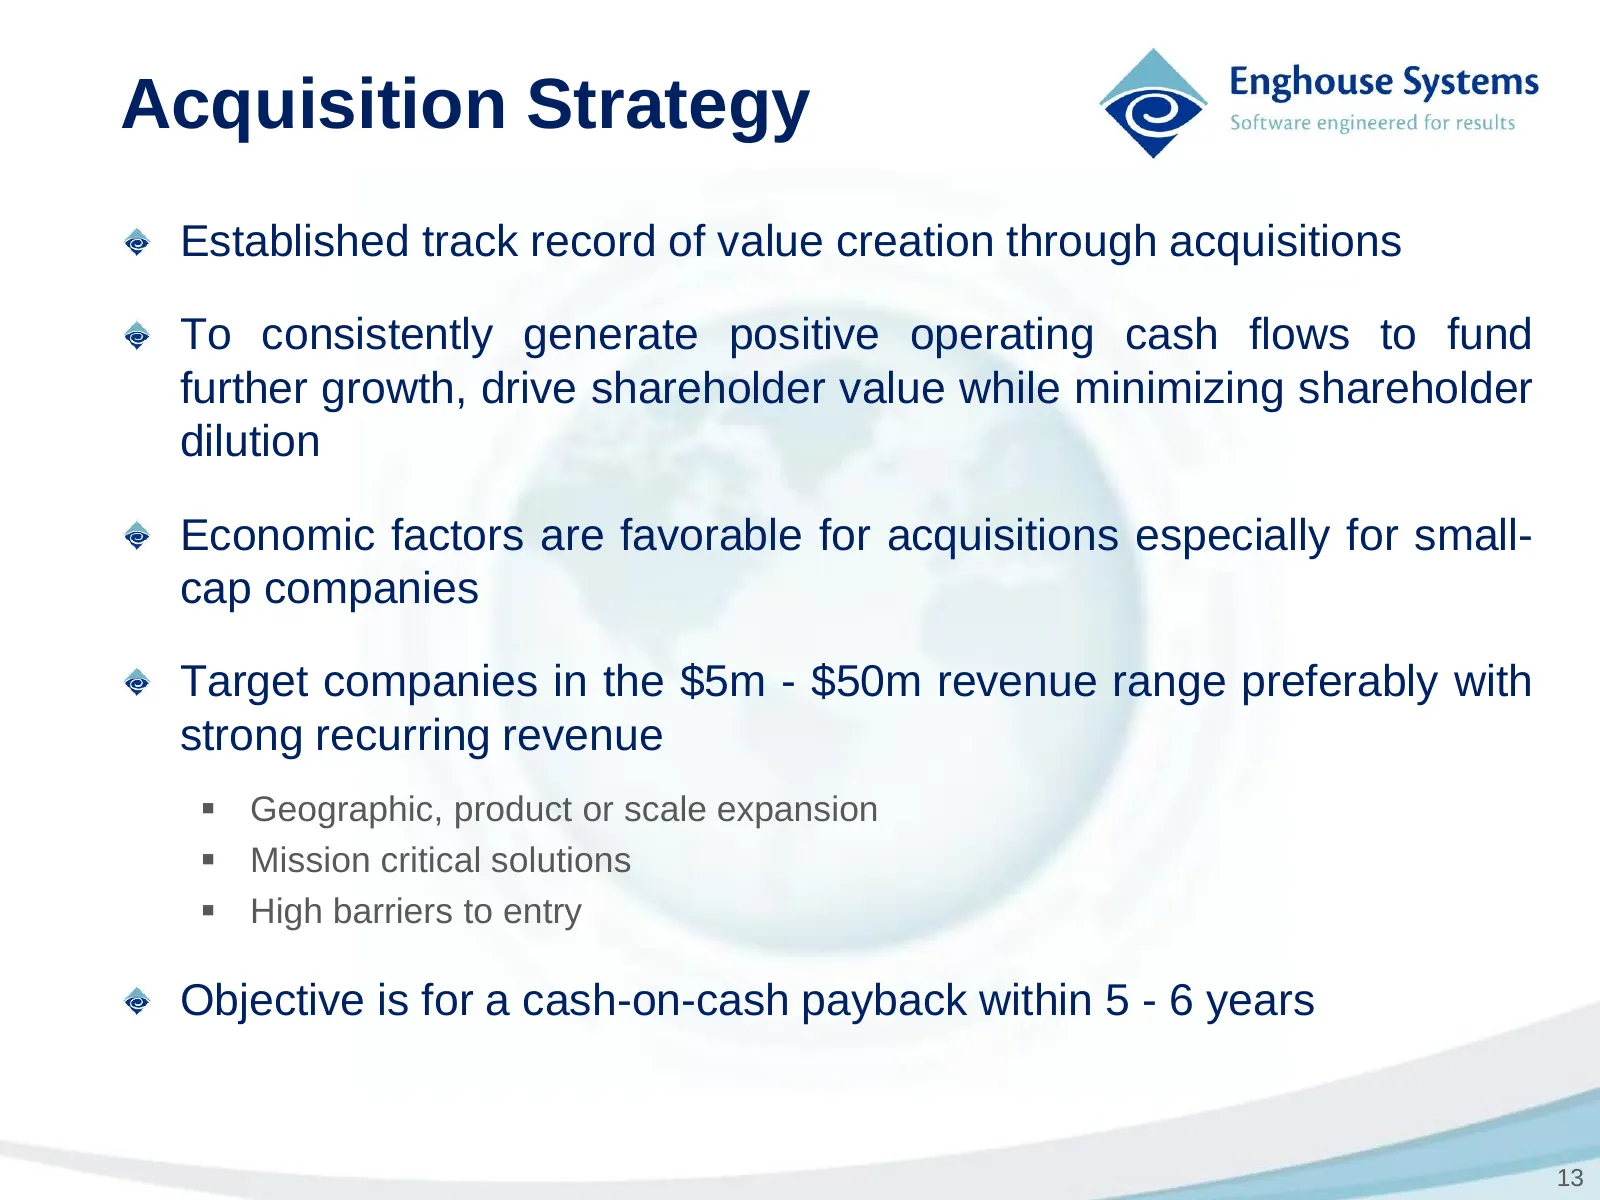
Acquisition Strategy Established track record of value creation through acquisitions To consistently generate positive operating cash flows to fund further growth, drive shareholder value while minimizing shareholder dilution Economic factors are favorable for acquisitions especially for small- cap
Slide 14: Recent Acquisitions
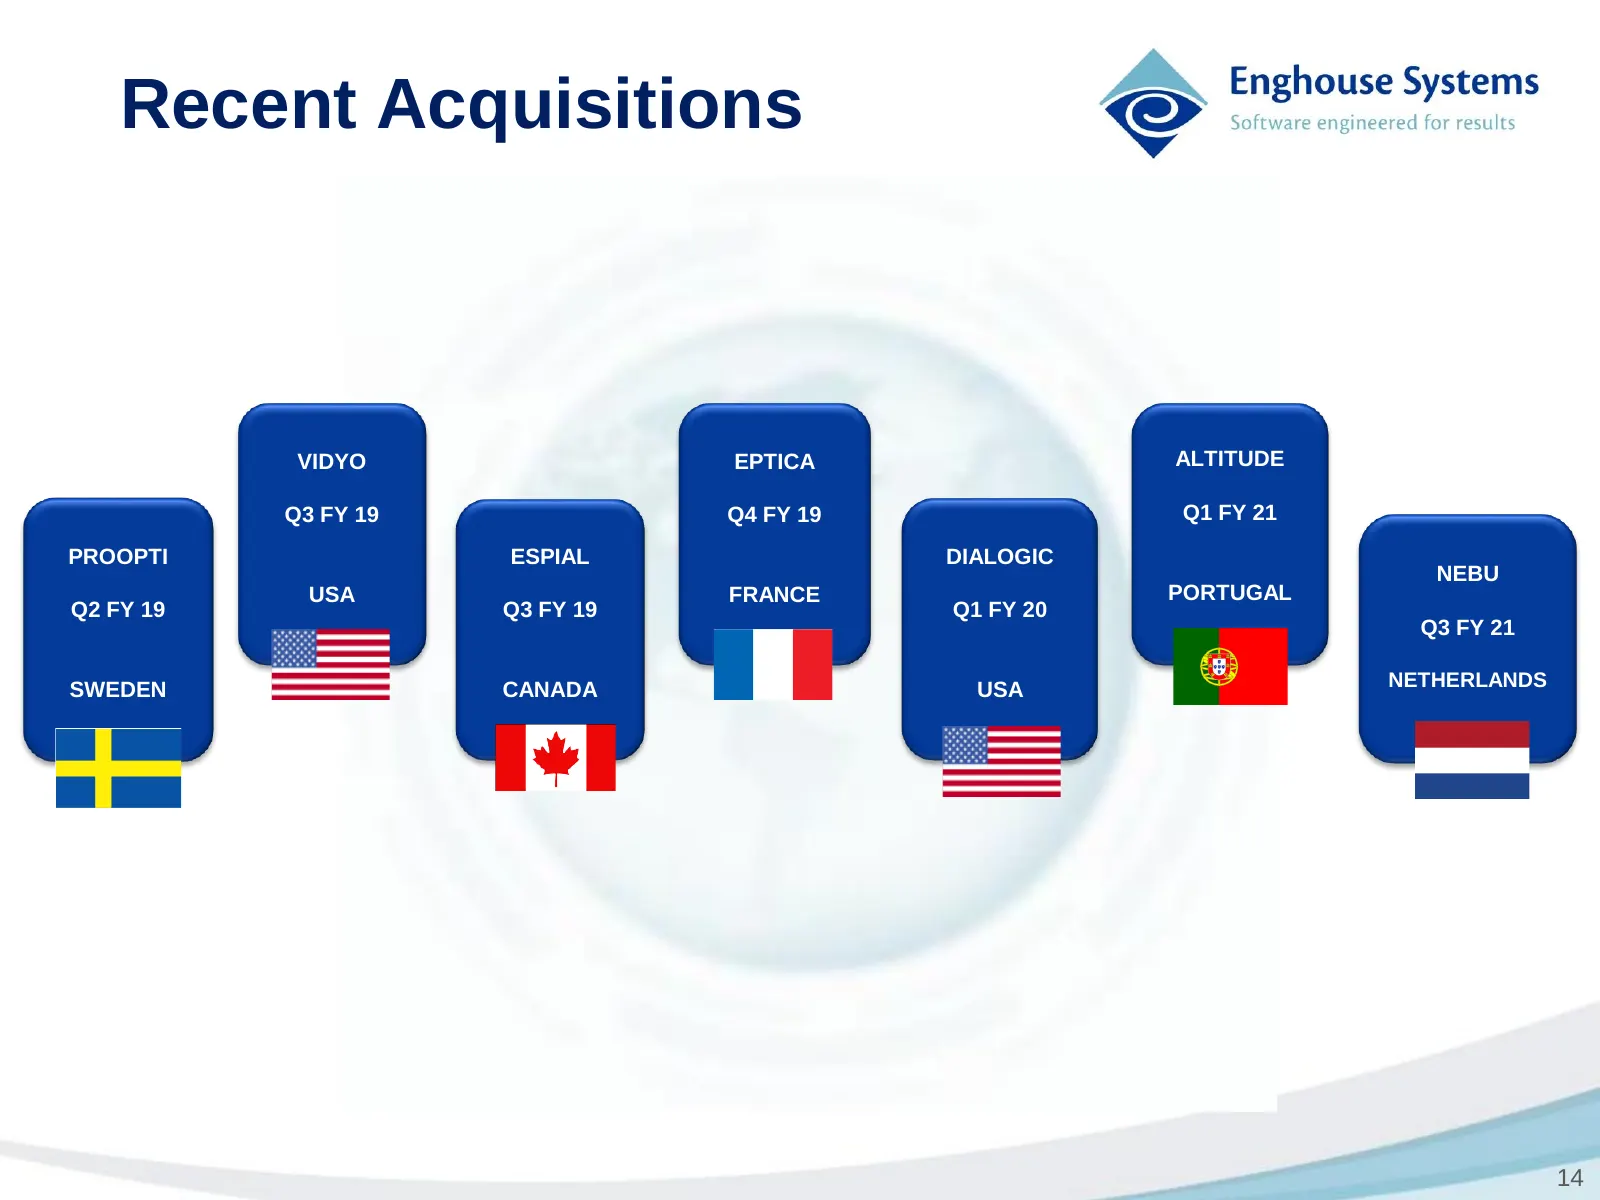
Recent Acquisitions VIDYO EPTICA ALTITUDE Q3 FY 19 Q4 FY 19 Q1 FY 21 PROOPTI ESPIAL DIALOGIC NEBU USA FRANCE PORTUGAL Q2 FY 19 Q3 FY 19 Q1 FY 20 Q3 FY 21 SWEDEN NETHERLANDS CANADA USA 14

Slide 15: Thank You!
Enghouse Systems © Software engineered for results THANK You!
Source: Internet Archive copy of enghouse.com
More decks from Enghouse Systems Limited
 Q3 FY2026 Earnings Presentation16 slides · Sep 11, 2026
 Q1 2026 Earnings Presentation16 slides · Mar 13, 2026
 Q1 2025 Earnings Presentation16 slides · Mar 11, 2025
 Q3 2024 Earnings Presentation16 slides · Sep 6, 2024
 Q1 2024 Earnings Presentation15 slides · Mar 14, 2024
 Q4 FY2023 Earnings Presentation15 slides · Dec 15, 2023