Emergent BioSolutions Inc. · NYSE:EBS
Emergent BioSolutions — J.P. Morgan Healthcare Conference 2016
25 slides from Emergent BioSolutions's conference presentation, Jan 11, 2016
Slide 1: Corporate Update & Strategic Plan
Corporate Update & Strategic Plan Daniel J. Abdun-NabiPresident and CEO J.P. Morgan Healthcare ConferenceJanuary 11, 2016
Slide 2: Forward-Looking Statements / Non-GAAP Financial Measures
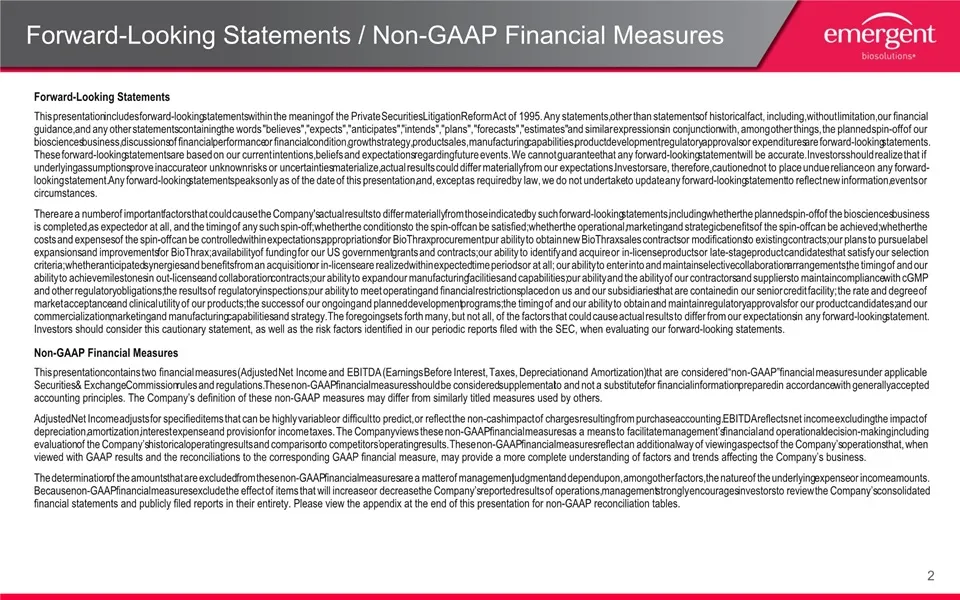
Forward-Looking Statements / Non-GAAP Financial Measures Forward-Looking Statements This presentation includes forward-looking statements within the meaning of the Private Securities Litigation Reform Act of 1995. Any statements, other than statements of historical fact, including, without limitatio
Slide 3: Agenda
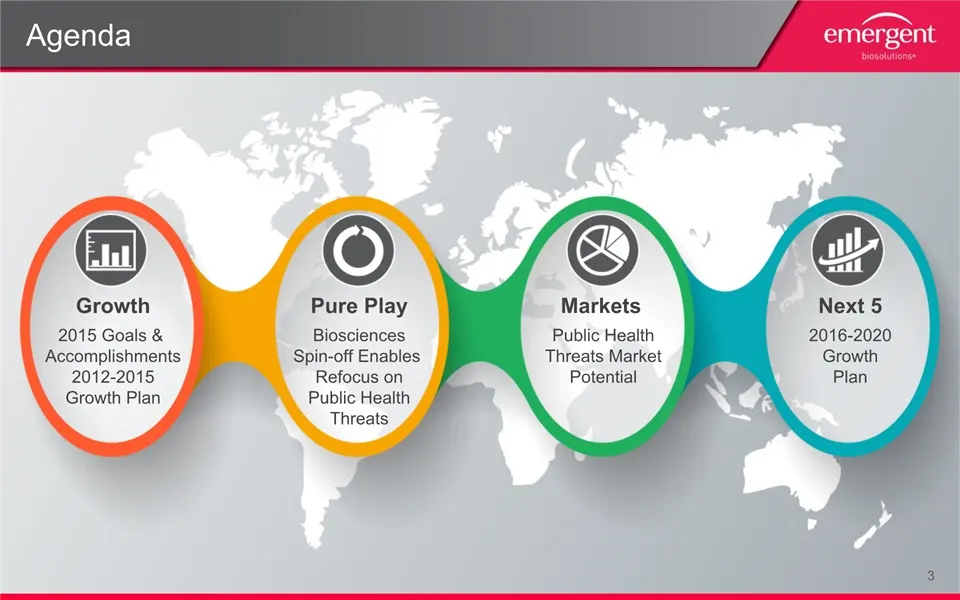
Agenda Growth 2015 Goals & Accomplishments2012-2015Growth Plan Pure Play BiosciencesSpin-off Enables Refocus onPublic HealthThreats Markets Public HealthThreats MarketPotential Next 5 2016-2020GrowthPlan

Slide 4: 2015 Year-in-Review & 2012-2015 Growth Plan Performance
Growth 2015 Year-in-Review & 2012-2015 Growth Plan PerformanceGoals and Accomplishments
Slide 5: 2015 Goal Recap
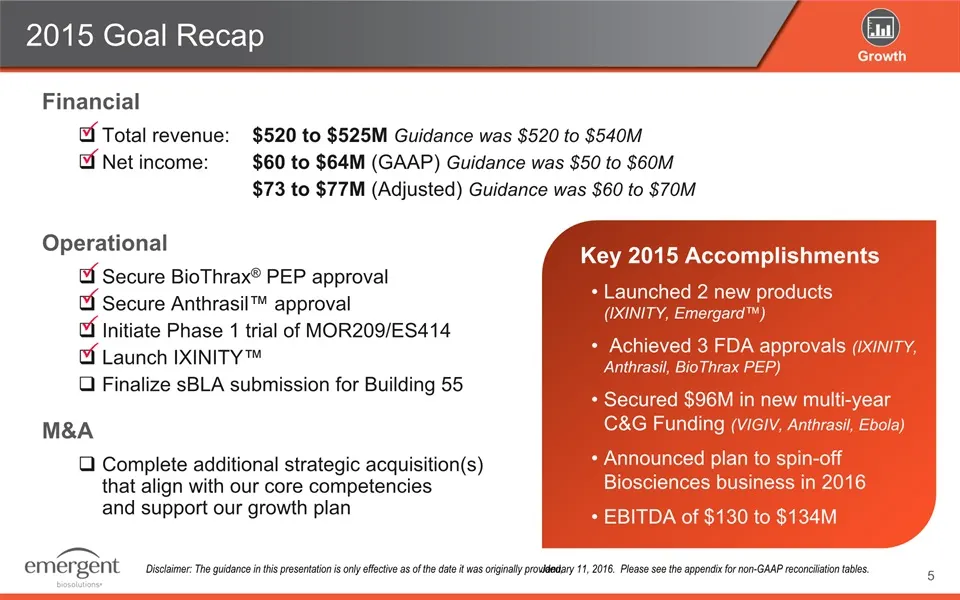
2015 Goal Recap FinancialTotal revenue: $520 to $525M Guidance was $520 to $540MNet income: $60 to $64M (GAAP) Guidance was $50 to $60M $73 to $77M (Adjusted) Guidance was $60 to $70MOperationalSecure BioThrax® PEP approvalSecure Anthrasil™ approvalInitiate Phase 1 trial of MOR209/ES414Launch IXINIT
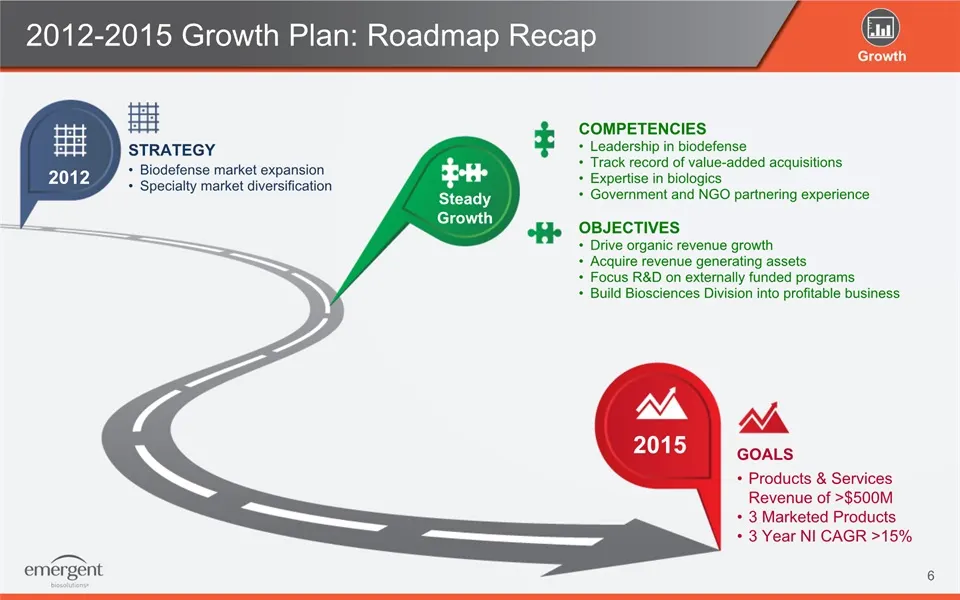
Slide 6: 2012-2015 Growth Plan: Roadmap Recap
2012-2015 Growth Plan: Roadmap Recap Growth Products & Services Revenue of >$500M3 Marketed Products3 Year NI CAGR >15% 2012 2015 STRATEGY GOALS Biodefense market expansionSpecialty market diversification COMPETENCIES Leadership in biodefenseTrack record of value-added acquisitionsExpertise in biolo
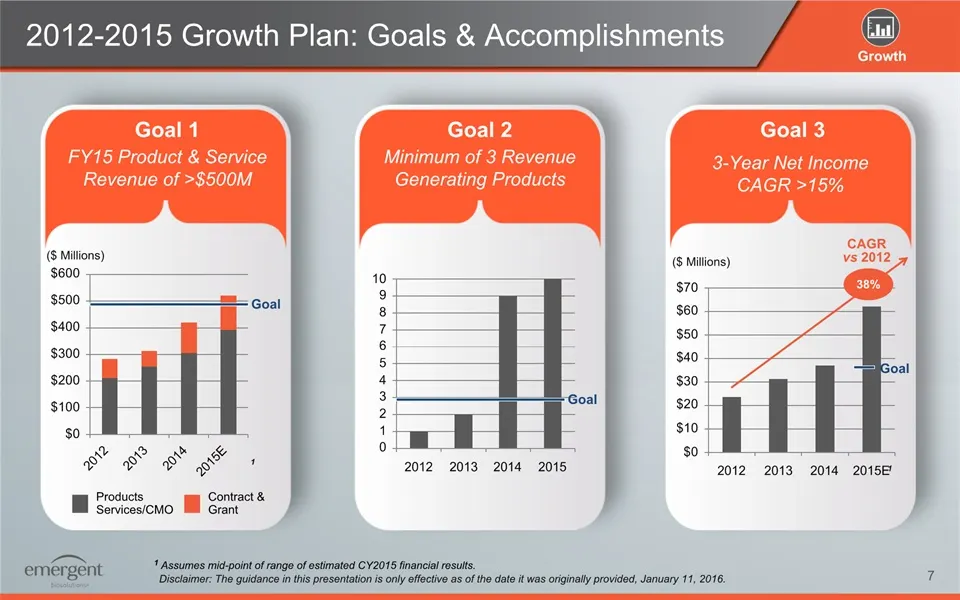
Slide 7: 2012-2015 Growth Plan: Goals & Accomplishments
2012-2015 Growth Plan: Goals & Accomplishments Goal 1 FY15 Product & ServiceRevenue of >$500M Goal 2 Minimum of 3 RevenueGenerating Products Goal 3 ($ Millions) ProductsServices/CMO Contract &Grant ($ Millions) CAGRvs 2012 38% Goal Goal Goal 1 Assumes mid-point of range of estimated CY2015 financial
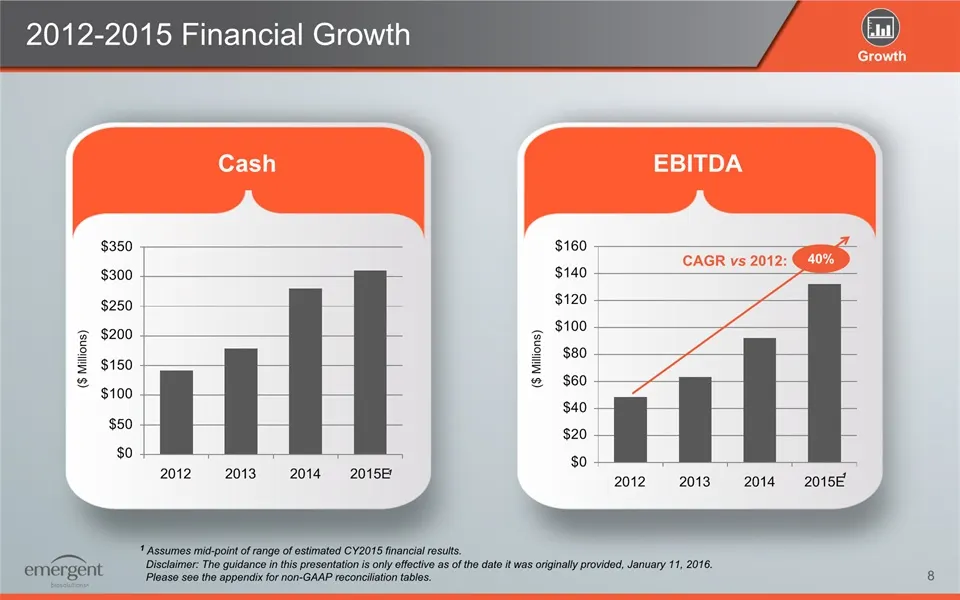
Slide 8: 2012-2015 Financial Growth
Growth 2012-2015 Financial Growth EBITDA ($ Millions) 1 Assumes mid-point of range of estimated CY2015 financial results. 1 ($ Millions) 1 Cash CAGR vs 2012: 40% Disclaimer: The guidance in this presentation is only effective as of the date it was originally provided, January 11, 2016. Please see th
Slide 9: Biosciences Business Spin-off: Renewed Focus on Public Health Threats
Biosciences Business Spin-offEmergent’s Renewed Focus on Public Health Threats Pure Play
Slide 10: Biosciences Business Spin-off Announced in August 2015
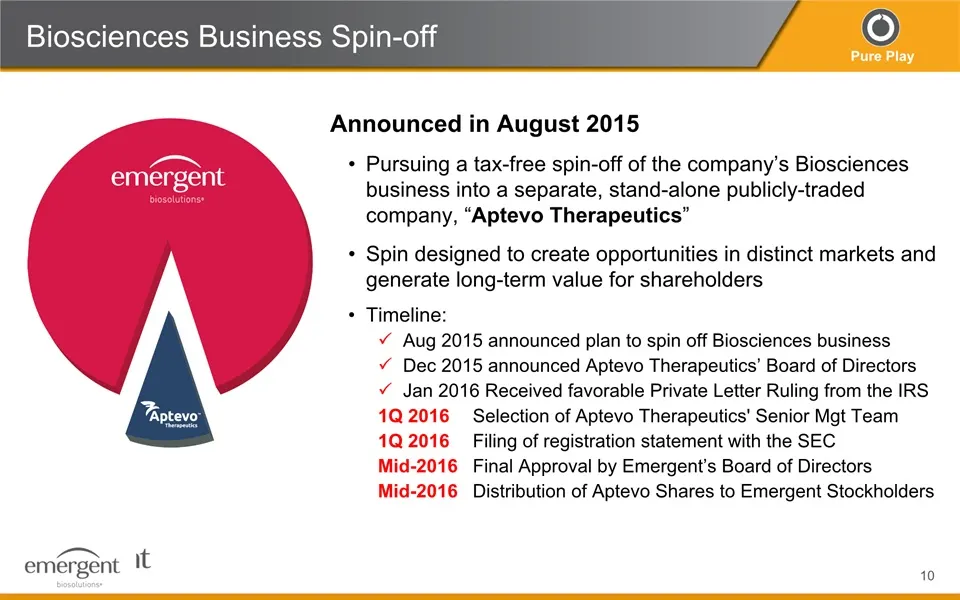
Biosciences Business Spin-off Announced in August 2015Pursuing a tax-free spin-off of the company’s Biosciences business into a separate, stand-alone publicly-traded company, “Aptevo Therapeutics” Spin designed to create opportunities in distinct markets and generate long-term value for shareholders
Slide 11: Renewed Focus on our Core Business
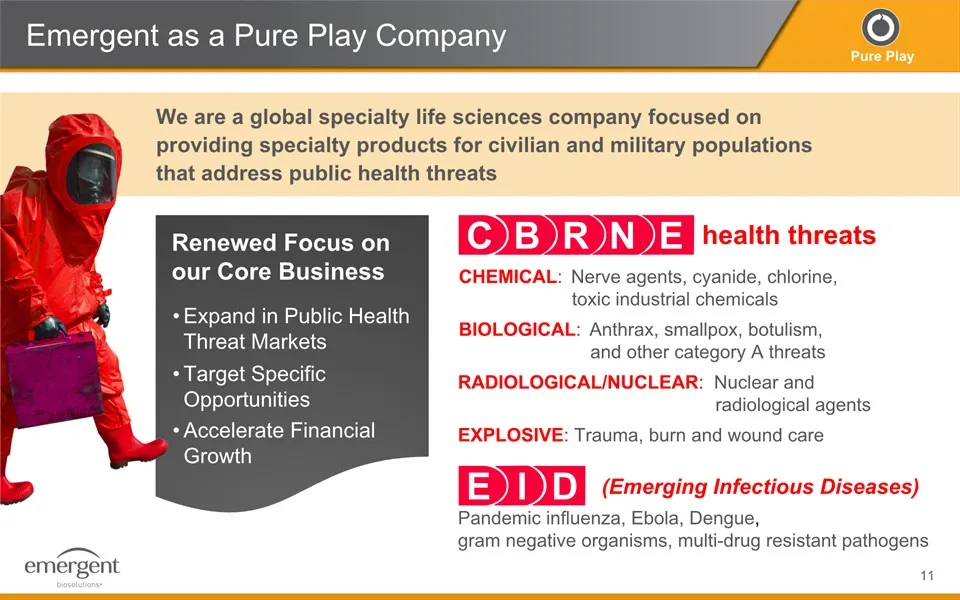
Renewed Focus onour Core Business Expand in Public Health Threat MarketsTarget Specific OpportunitiesAccelerate Financial Growth Emergent as a Pure Play Company We are a global specialty life sciences company focused on providing specialty products for civilian and military populations that address
Slide 12: Company Profiles Post Spin-off
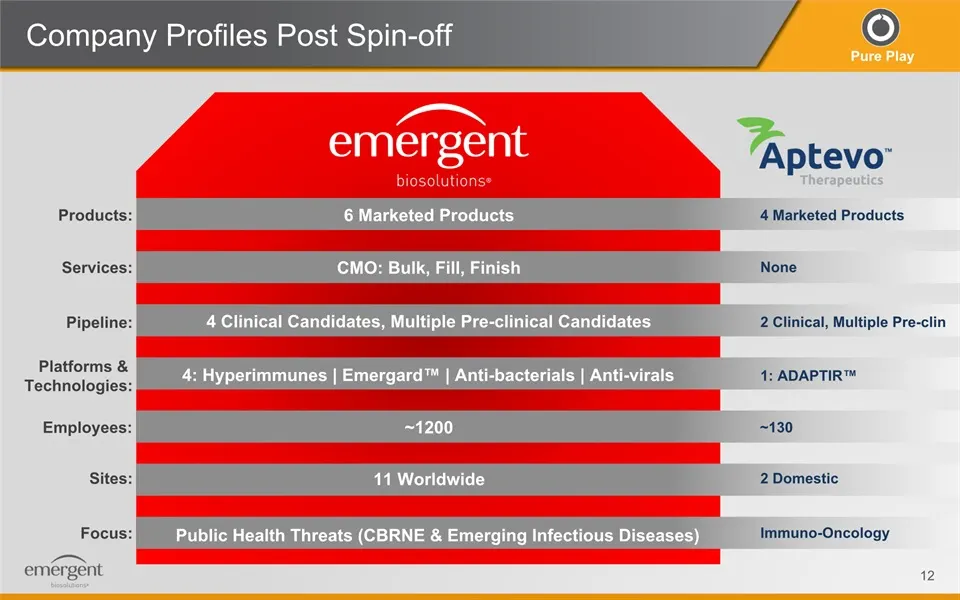
Company Profiles Post Spin-off Products: 4 Marketed Products Services: None Pipeline: 2 Clinical, Multiple Pre-clin Platforms & Technologies: 1: ADAPTIR™ Employees: ~130 Sites: 2 Domestic Focus: Immuno-Oncology 6 Marketed Products CMO: Bulk, Fill, Finish 4 Clinical Candidates, Multiple Pre-clinical
Slide 13: Product Portfolio and Manufacturing Capabilities
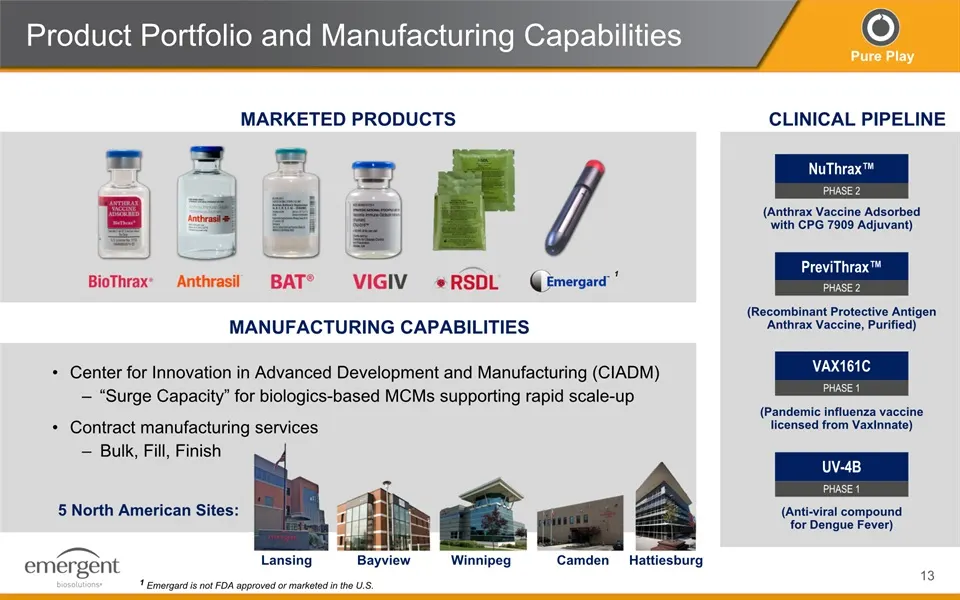
Product Portfolio and Manufacturing Capabilities MARKETED PRODUCTS Manufacturing Capabilities Center for Innovation in Advanced Development and Manufacturing (CIADM)“Surge Capacity” for biologics-based MCMs supporting rapid scale-upContract manufacturing servicesBulk, Fill, Finish Clinical Pipeline

Slide 14: Assessing the Public Health Threats Market
Assessing the Public Health Threats MarketNatural, Accidental & Intentional Market
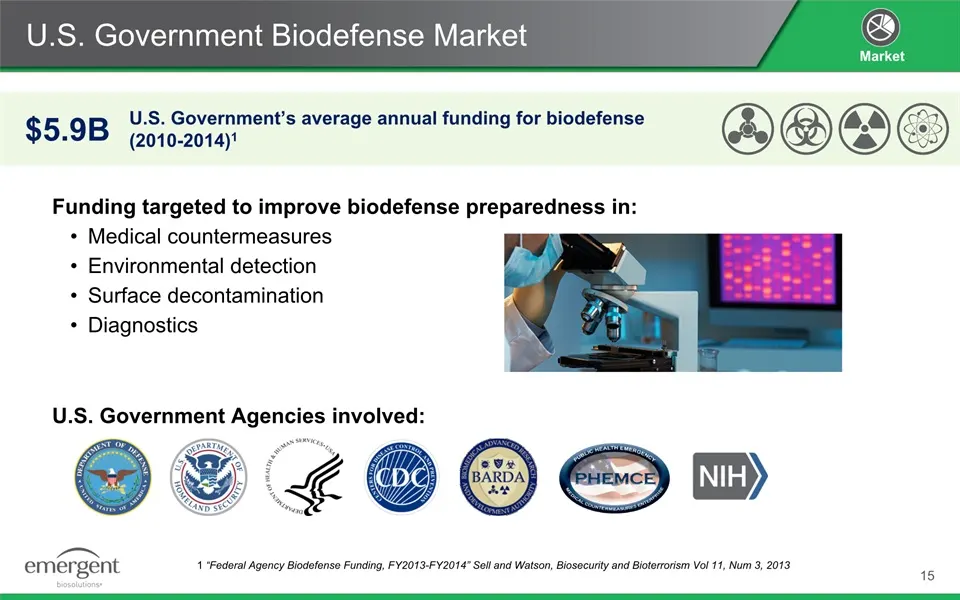
Slide 15: U.S. Government Biodefense Market
U.S. Government Biodefense Market U.S. Government’s average annual funding for biodefense (2010-2014)1 Market $5.9B Funding targeted to improve biodefense preparedness in:Medical countermeasuresEnvironmental detectionSurface decontaminationDiagnostics 1 “Federal Agency Biodefense Funding, FY2013-FY2
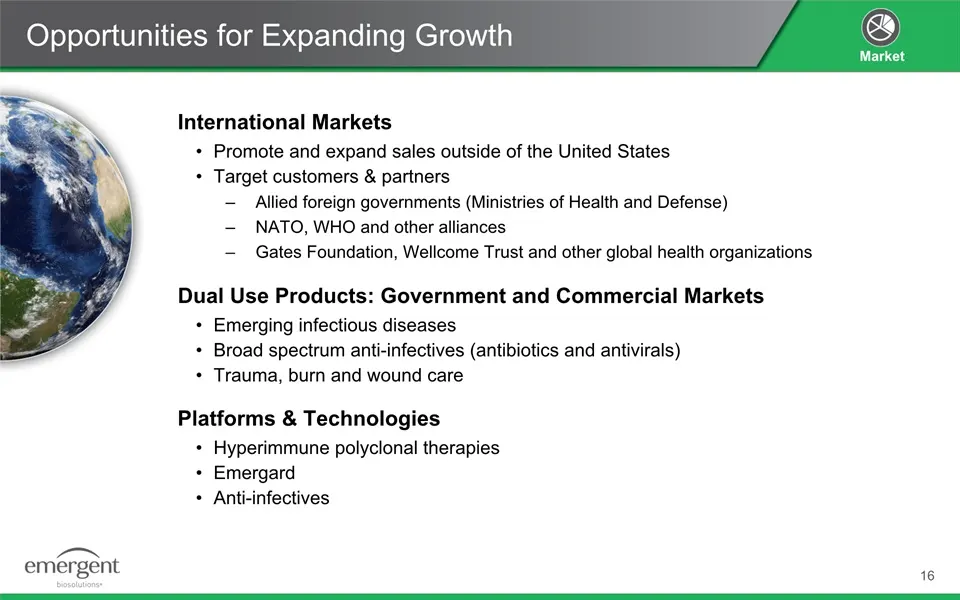
Slide 16: Opportunities for Expanding Growth
Opportunities for Expanding Growth International MarketsPromote and expand sales outside of the United StatesTarget customers & partnersAllied foreign governments (Ministries of Health and Defense)NATO, WHO and other alliancesGates Foundation, Wellcome Trust and other global health organizationsDual
Slide 17: 2016-2020 Corporate Growth Plan
2016-2020 Corporate Growth PlanRoadmap & Goals Next 5
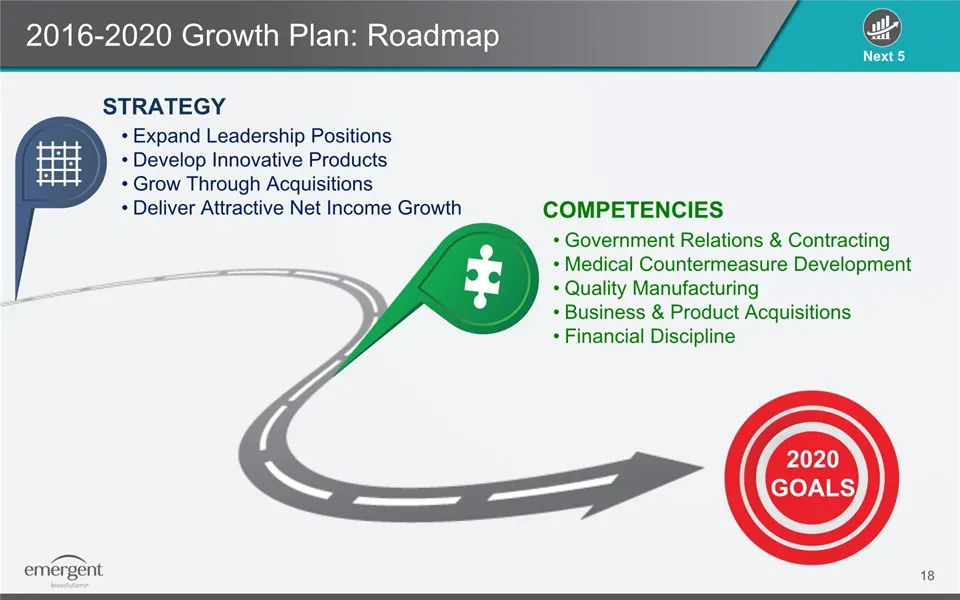
Slide 18: 2016-2020 Growth Plan: Roadmap
2016-2020 Growth Plan: Roadmap Next 5 STRATEGY Expand Leadership PositionsDevelop Innovative ProductsGrow Through AcquisitionsDeliver Attractive Net Income Growth COMPETENCIES Government Relations & ContractingMedical Countermeasure DevelopmentQuality ManufacturingBusiness & Product AcquisitionsFina
Slide 19: 2020 Strategic Goals
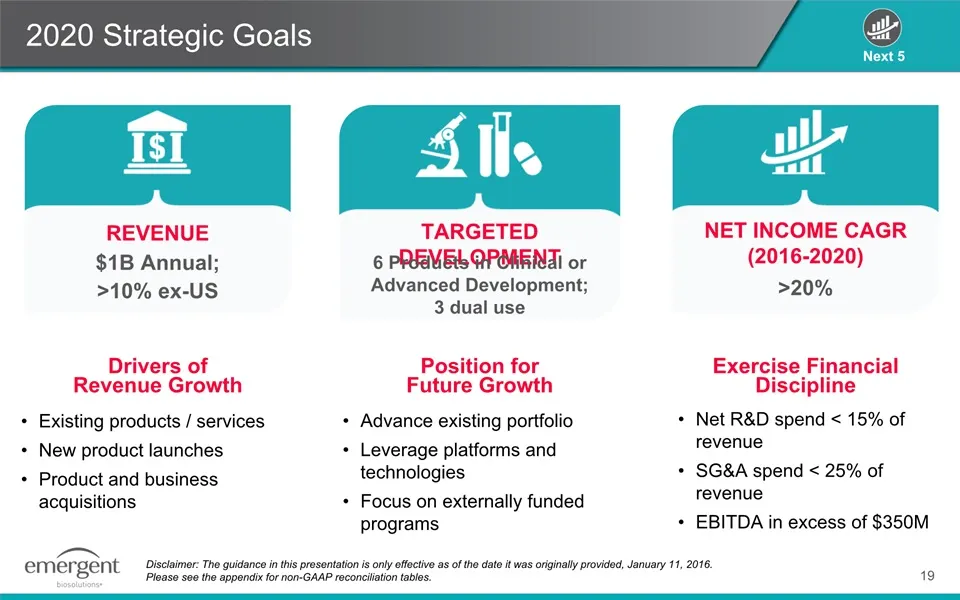
2020 Strategic Goals Next 5 REVENUE $1B Annual; >10% ex-US Drivers of Revenue Growth Existing products / servicesNew product launchesProduct and business acquisitions Position for Future Growth Advance existing portfolioLeverage platforms and technologiesFocus on externally funded programs Exercise
Slide 20: 2016 Goals
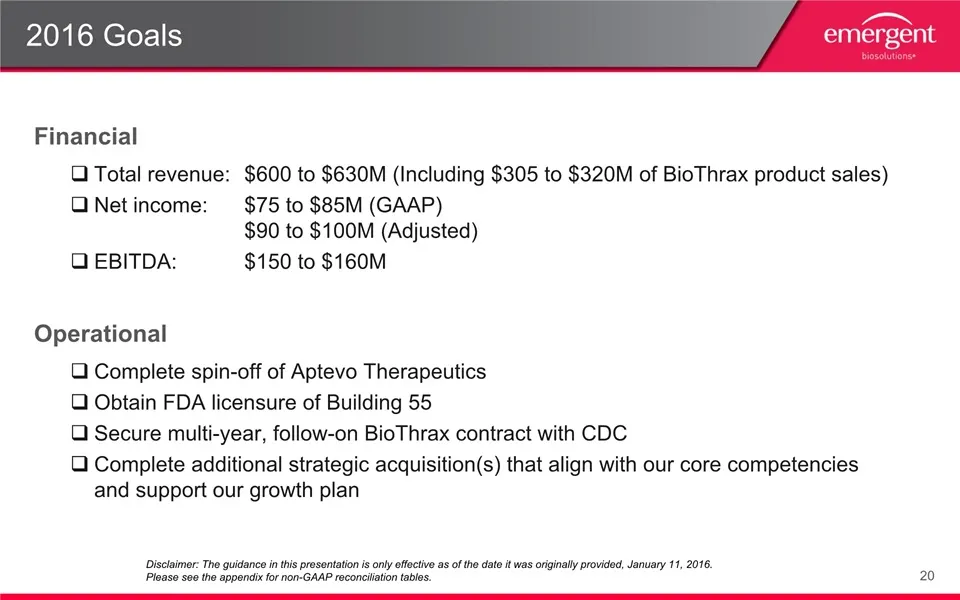
2016 Goals FinancialTotal revenue: $600 to $630M (Including $305 to $320M of BioThrax product sales)Net income: $75 to $85M (GAAP) $90 to $100M (Adjusted)EBITDA: $150 to $160MOperationalComplete spin-off of Aptevo TherapeuticsObtain FDA licensure of Building 55Secure multi-year, follow-on BioThrax c
Slide 21: ouvece UL <
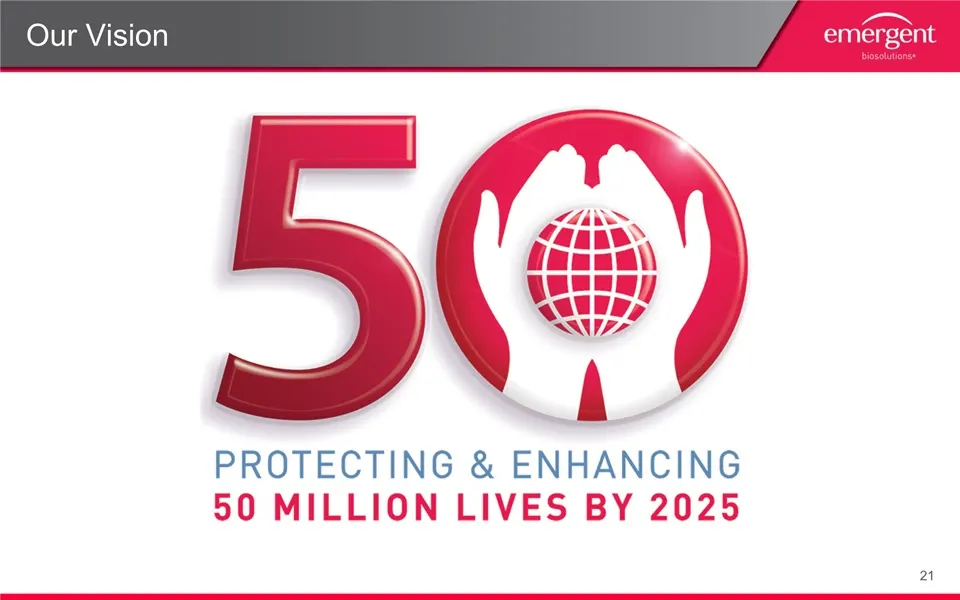
ouvece UL < PROTECTING & ENHANCING 2
Slide 22: Appendix: Non-GAAP Reconciliations
APPENDIX Non-GAAP Reconciliations
Slide 23: Non-GAAP Reconciliation
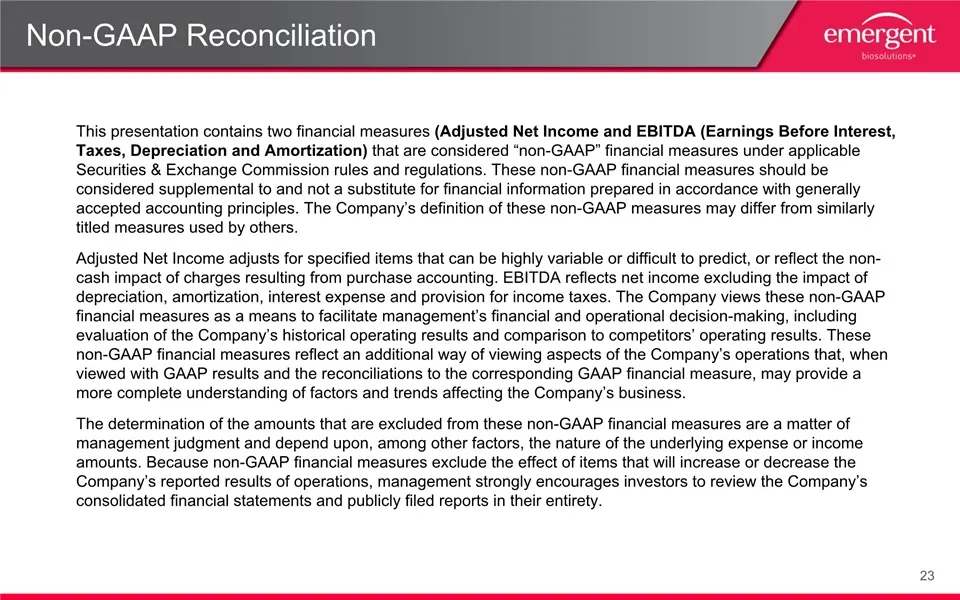
Non-GAAP Reconciliation This presentation contains two financial measures (Adjusted Net Income and EBITDA (Earnings Before Interest, Taxes, Depreciation and Amortization) that are considered “non-GAAP” financial measures under applicable Securities & Exchange Commission rules and regulations. These
Slide 24: Reconciliation of GAAP Net Income to Adjusted Net Income
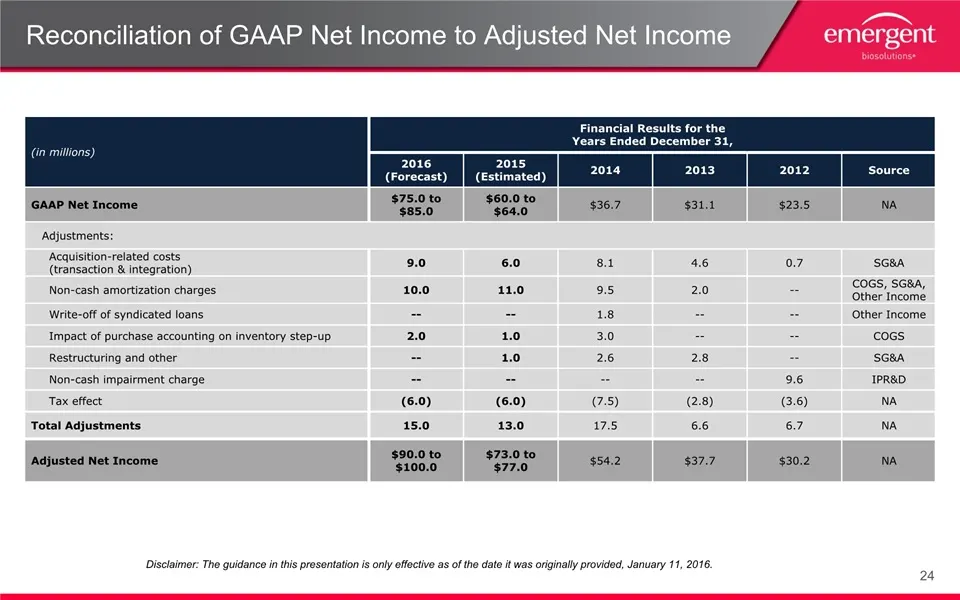
Reconciliation of GAAP Net Income to Adjusted Net Income Disclaimer: The guidance in this presentation is only effective as of the date it was originally provided, January 11, 2016. (in millions) Financial Results for the Years Ended December 31, 2016 (Forecast) 2015(Estimated) 2014 2013 2012 Source
Slide 25: Reconciliation of GAAP Net Income to EBITDA
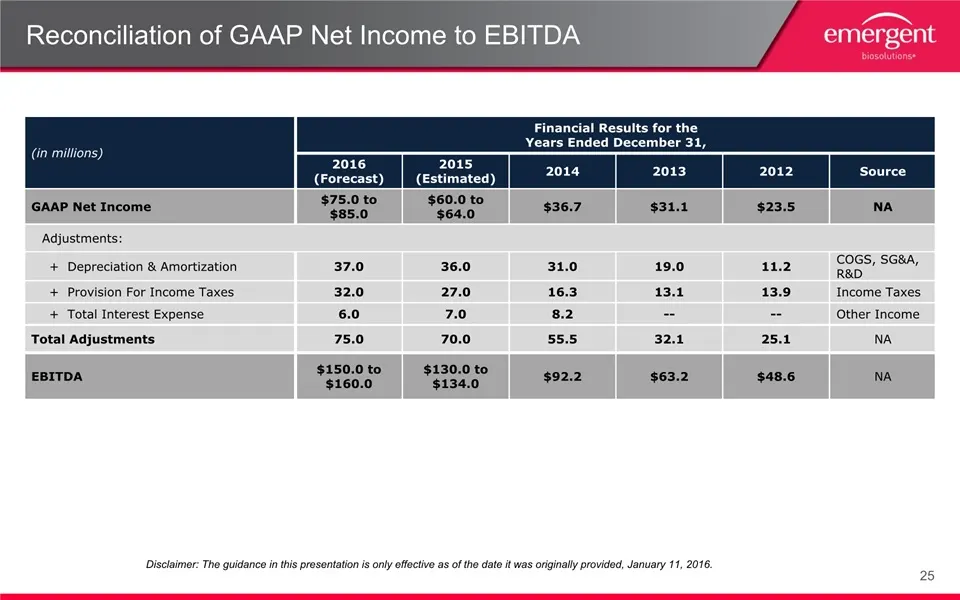
Reconciliation of GAAP Net Income to EBITDA Disclaimer: The guidance in this presentation is only effective as of the date it was originally provided, January 11, 2016. (in millions) Financial Results for the Years Ended December 31, 2016 (Forecast) 2015(Estimated) 2014 2013 2012 Source GAAP Net Inc
Source: SEC EDGAR · 8-K filed Jan 11, 2016
More decks from Emergent BioSolutions Inc.
 Q3 2026 Earnings Presentation35 slides · Nov 2, 2026
 H.C. Wainwright 28th Annual Global Investment Conference (September 2026)31 slides · Sep 14, 2026
 Q2 2026 Earnings Presentation34 slides · Aug 5, 2026
 Q1 2026 Earnings Presentation36 slides · Apr 30, 2026
 Q4 2025 Earnings Presentation40 slides · Feb 26, 2026
 44th Annual J.P. Morgan Healthcare Conference (January 2026)21 slides · Jan 14, 2026