Emergent BioSolutions Inc. · NYSE:EBS
Emergent BioSolutions — Q3 2026 Earnings Presentation
35 slides from Emergent BioSolutions's earnings presentation, Nov 2, 2026

Slide 1: 2026 Third Quarter Financial Results
® 2026 Third Quarter Financial Results Our Mission: Protect and Save Lives November 2, 2026 1
Slide 2: Safe Harbor Statement and Trademarks
Safe Harbor Statement and Trademarks This presentation includes forward-looking statements within the meaning of the Private Securities Litigation Reform Act of 1995. All statements, other than statements of historical fact, including statements regarding the future performance of the Company or any
Slide 3: Today's Agenda
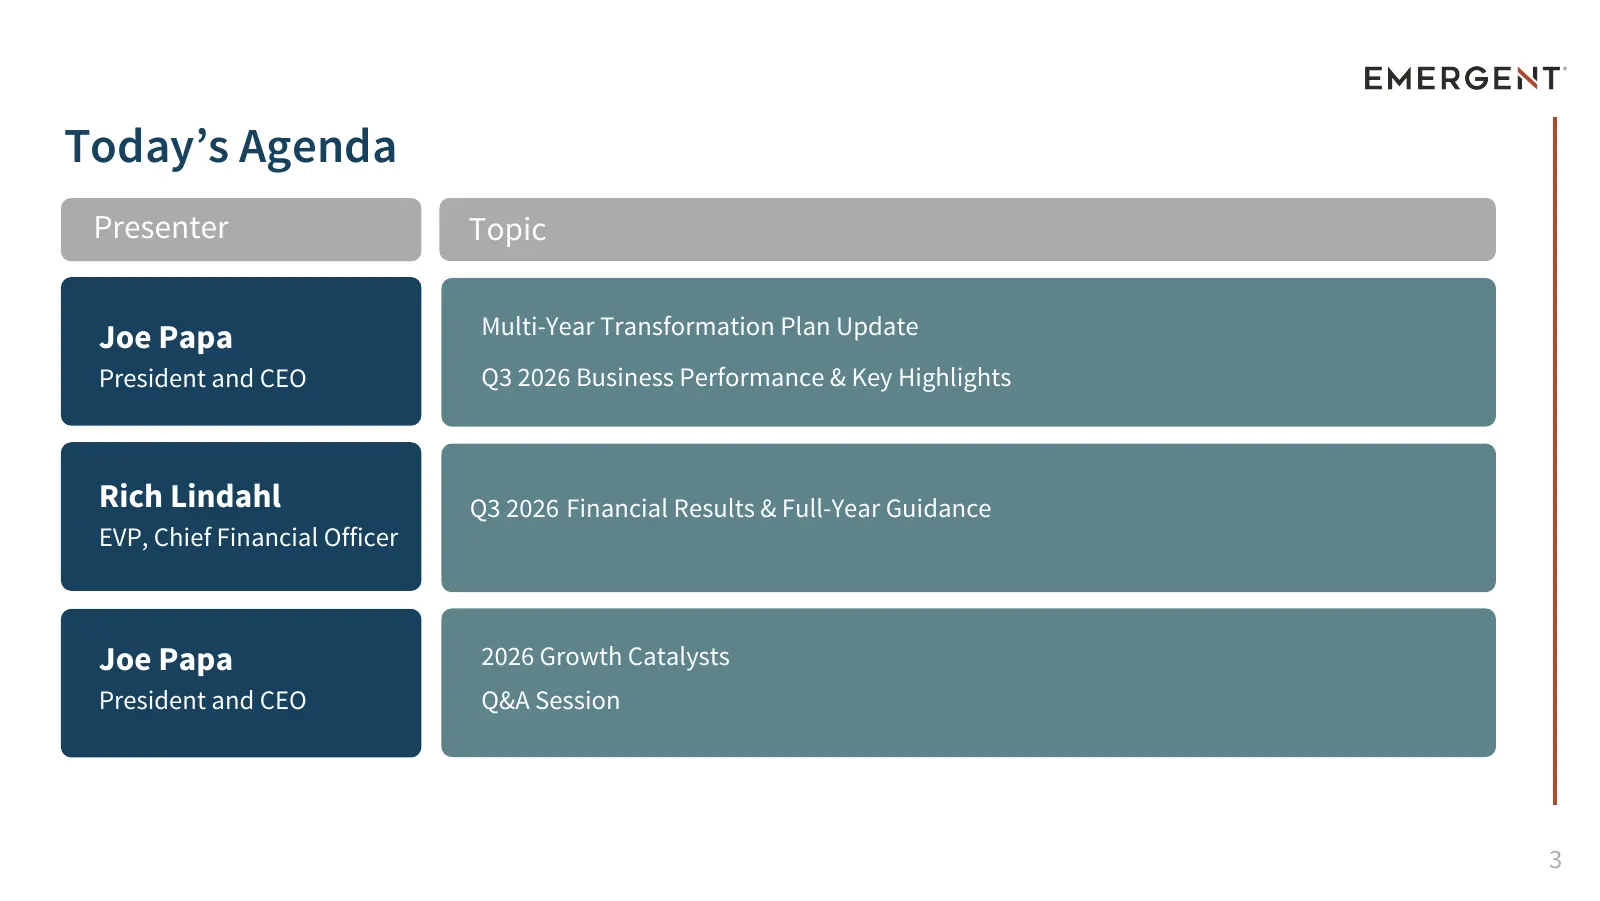
Today’s Agenda Presenter Topic Joe Papa Multi-Year Transformation Plan Update President and CEO Q3 2026 Business Performance & Key Highlights Rich Lindahl Q3 2026 Financial Results & Full-Year Guidance EVP, Chief Financial Officer Joe Papa 2026 Growth Catalysts President and CEO Q&A Session 3
Slide 4: EBS: The Most Diverse Biodefense/MCM and Naloxone Products Globally
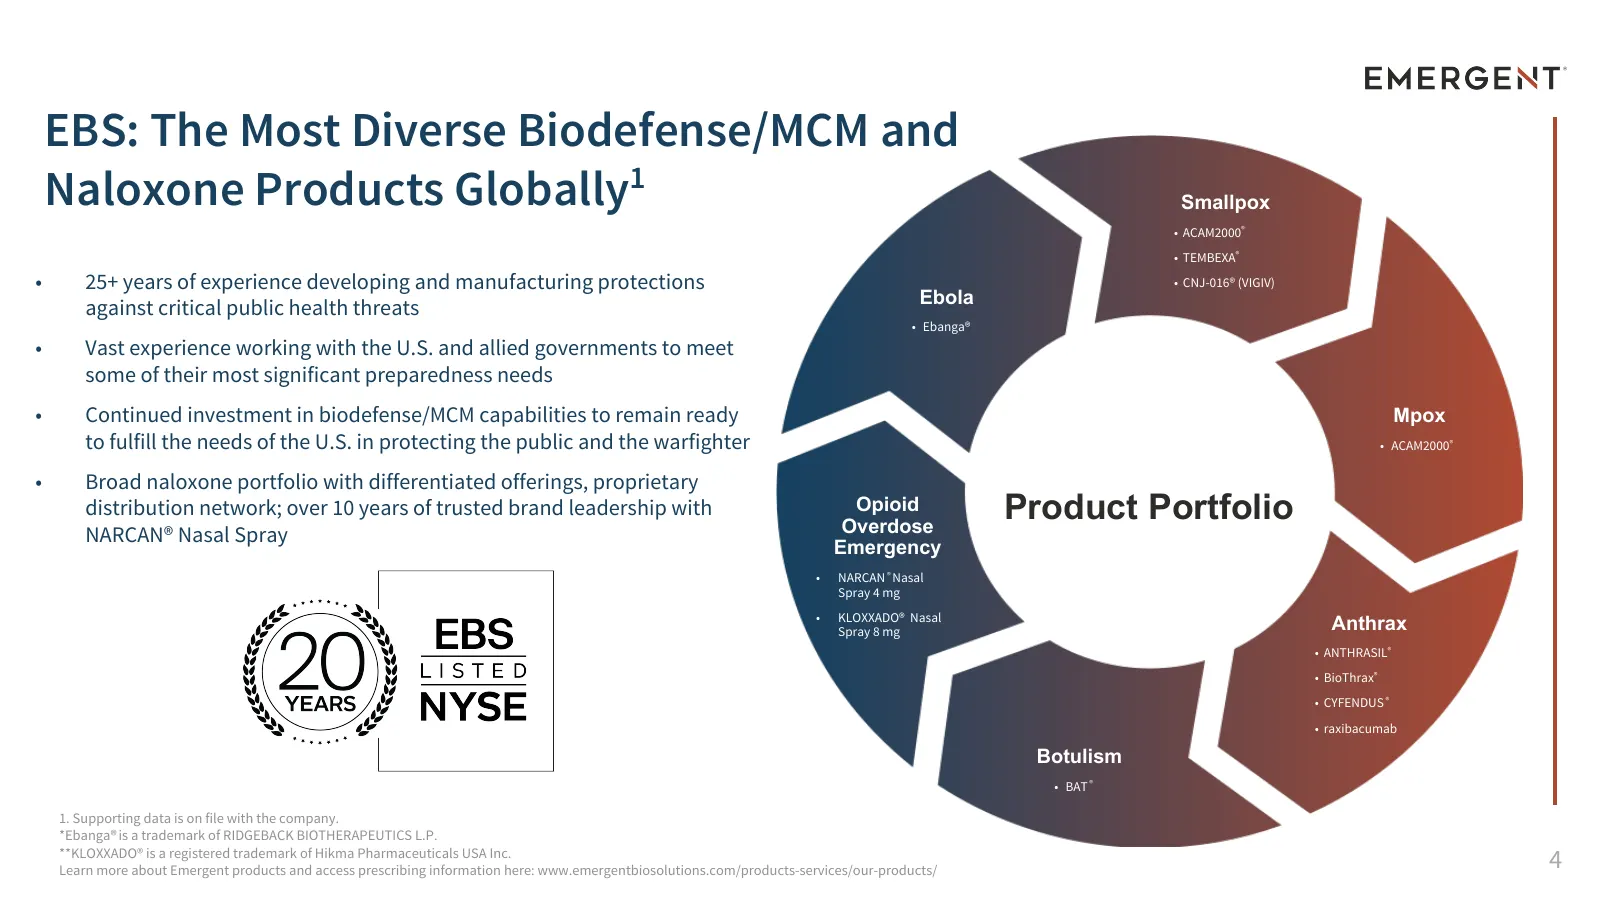
EBS: The Most Diverse Biodefense/MCM and Naloxone Products Globally1 Smallpox • ACAM2000® • TEMBEXA® • 25+ years of experience developing and manufacturing protections • CNJ-016® (VIGIV) Ebola against critical public health threats • Ebanga® • Vast experience working with the U.S. and allied governm

Slide 5: Multi-Year Transformation Plan Update
Multi-Year Transformation Plan Update Joe Papa President and Chief Executive Officer 5
Slide 6: Our Multi-Year Transformation Plan
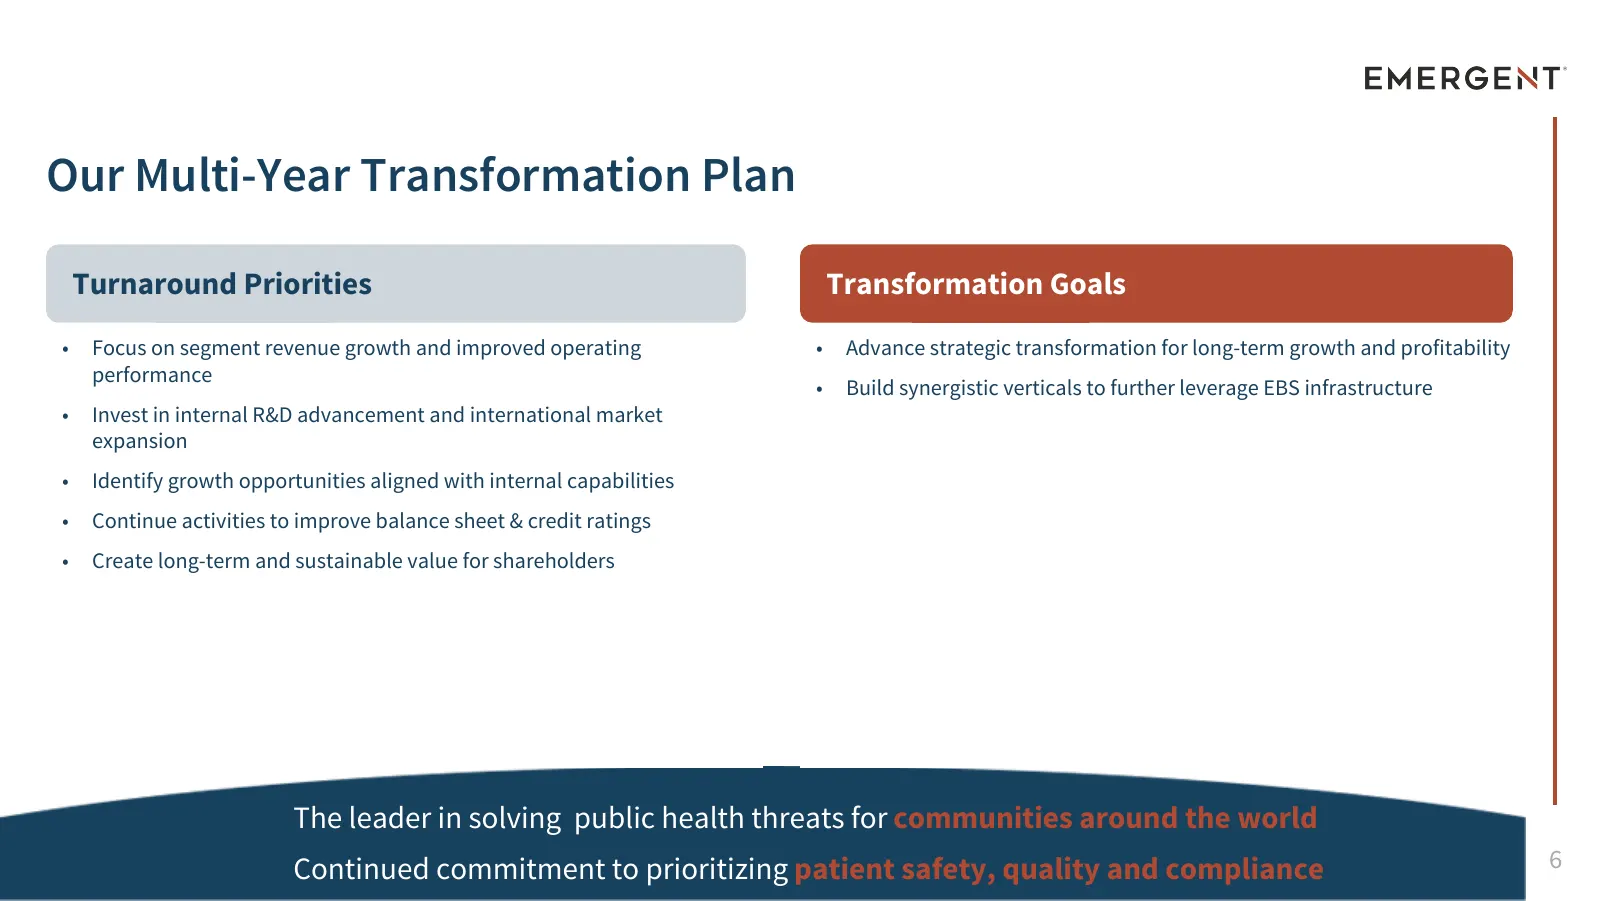
Our Multi-Year Transformation Plan Turnaround Priorities Transformation Goals • Focus on segment revenue growth and improved operating • Advance strategic transformation for long-term growth and profitability performance • Build synergistic verticals to further leverage EBS infrastructure • Invest i

Slide 7: 2026 Business Performance & Key Highlights
2026 Business Performance & Key Highlights Joe Papa President and Chief Executive Officer 7 7
Slide 8: Continued Execution on Turnaround Plan
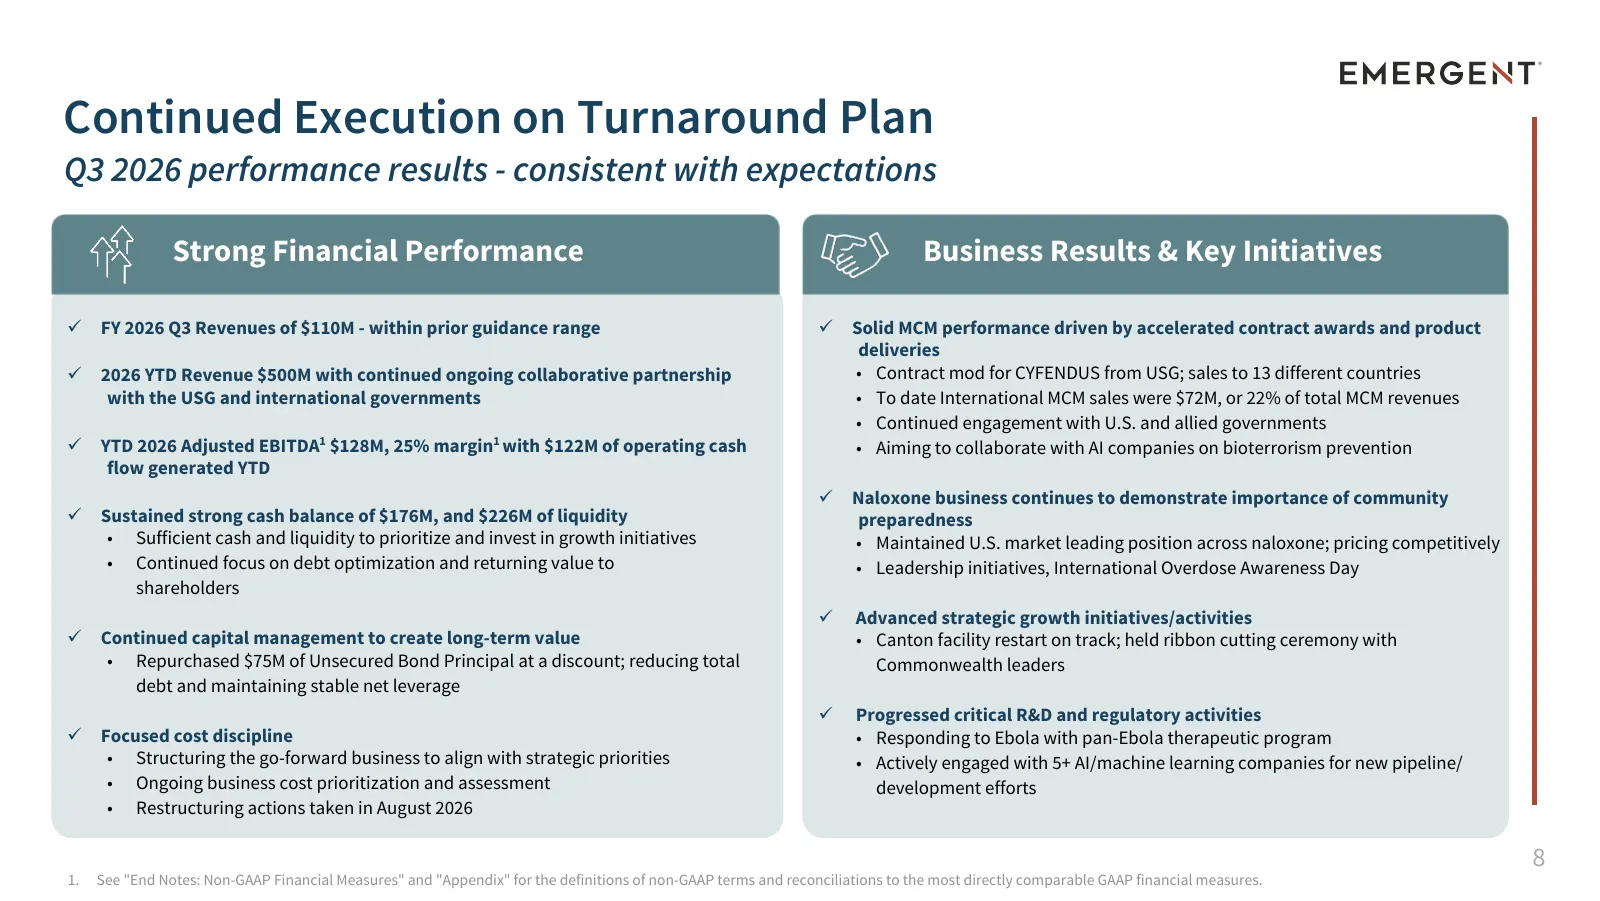
Continued Execution on Turnaround Plan Q3 2026 performance results - consistent with expectations Strong Financial Performance Business Results & Key Initiatives ü FY 2026 Q3 Revenues of $110M - within prior guidance range ü Solid MCM performance driven by accelerated contract awards and product del

Slide 9: AI Revives New Biologic Threat Risks, Demanding Stronger Biosecurity
AI Revives New Biologic Threat Risks, Demanding Stronger Biosecurity A Call for Partnership Emergent aims to collaborate with AI companies on bioterrorism preparedness Potential Initiatives • AI for health preparedness council: cross-sector partnership involving Emergent, technology companies, feder
Slide 10: Strong Engagement with U.S. and International Governments on Biodefense Preparedness
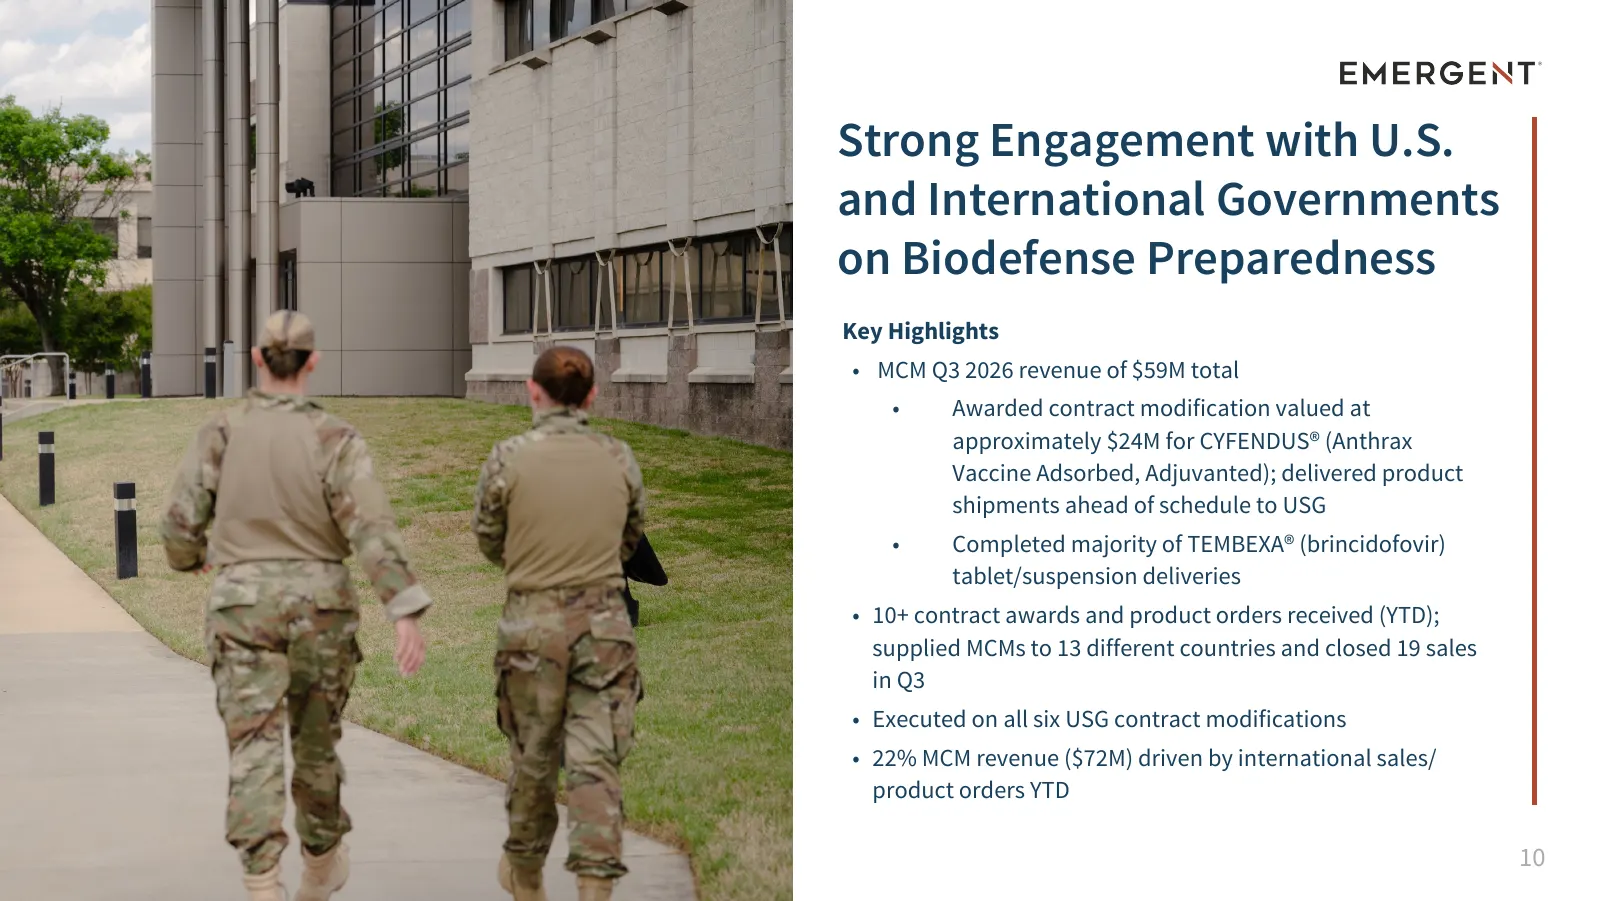
Strong Engagement with U.S. and International Governments on Biodefense Preparedness Key Highlights • MCM Q3 2026 revenue of $59M total • Awarded contract modification valued at approximately $24M for CYFENDUS® (Anthrax Vaccine Adsorbed, Adjuvanted); delivered product shipments ahead of schedule to
Slide 11: Leading Critical Efforts in the U.S. and Canada to Help Reduce Opioid Overdose Deaths
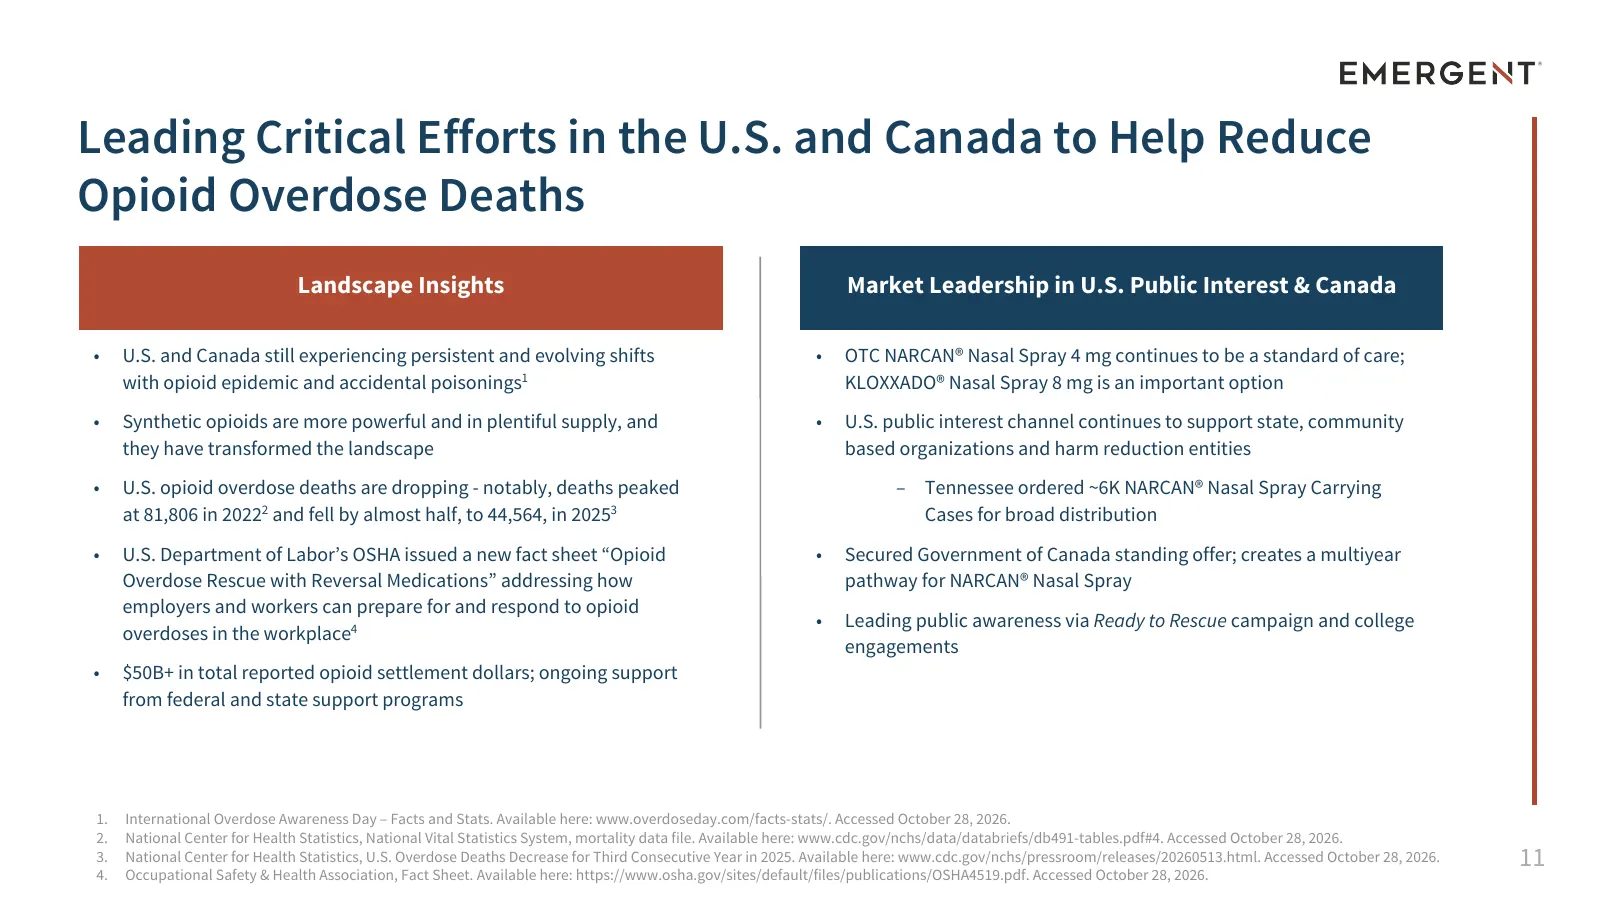
Leading Critical Efforts in the U.S. and Canada to Help Reduce Opioid Overdose Deaths Landscape Insights Market Leadership in U.S. Public Interest & Canada • U.S. and Canada still experiencing persistent and evolving shifts • OTC NARCAN® Nasal Spray 4 mg continues to be a standard of care; with opio

Slide 12: Q3 2026 Financial Results & Full-Year Guidance
Q3 2026 Financial Results & Full-Year Guidance Rich Lindahl EVP, Chief Financial Officer 12
Slide 13: Key Financial Performance Metrics Q3 2026 vs. Q3 2025
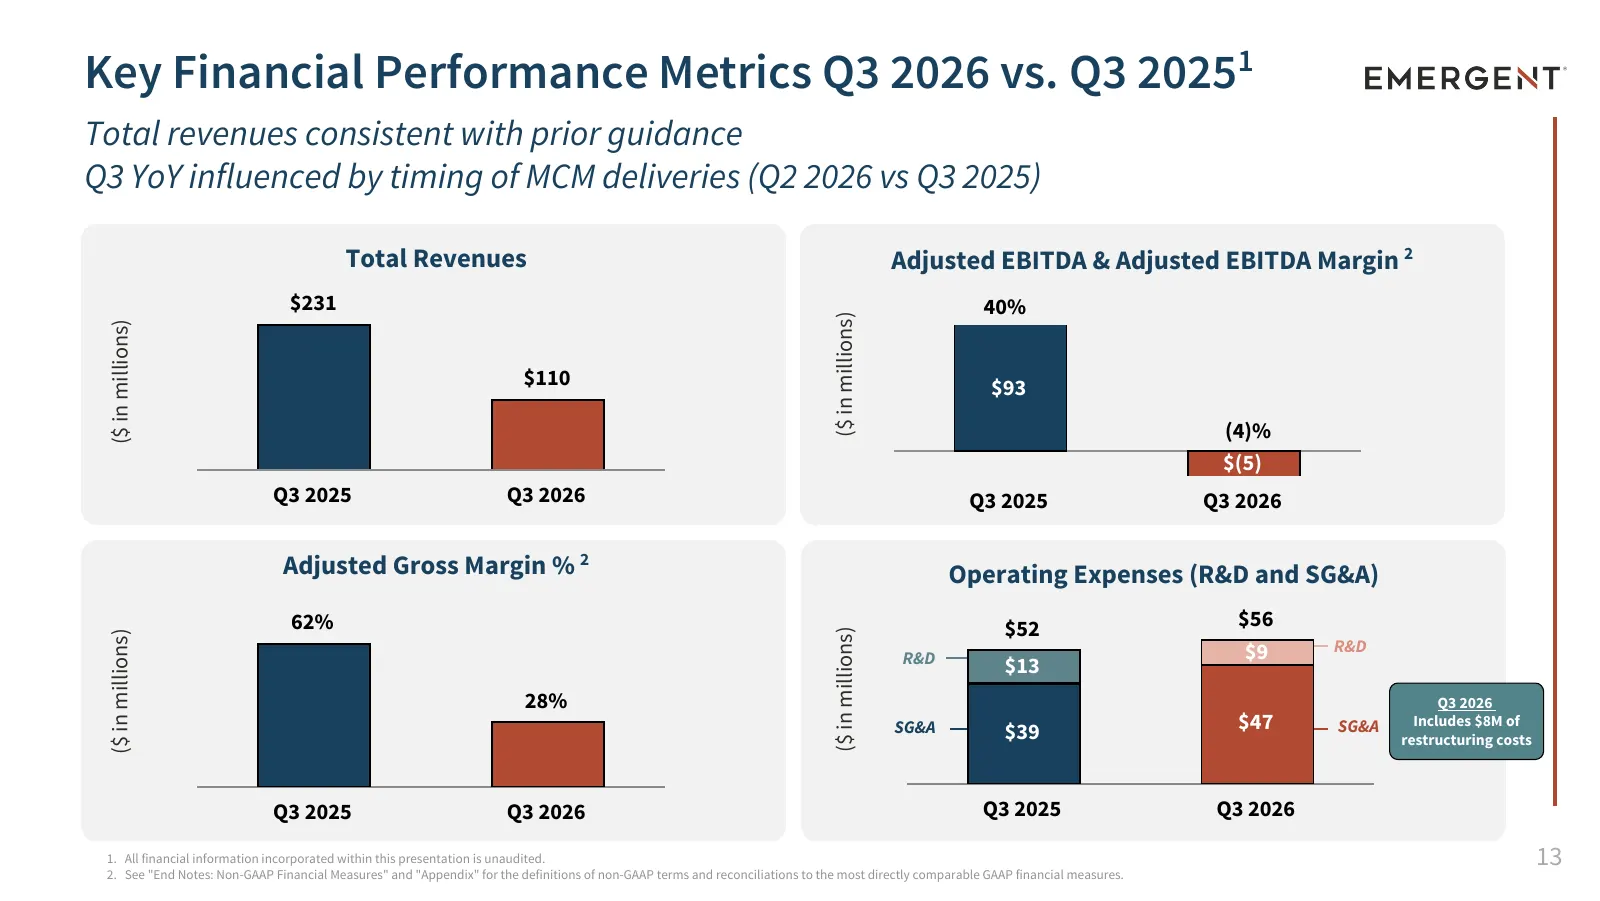
Key Financial Performance Metrics Q3 2026 vs. Q3 20251 Total revenues consistent with prior guidance Q3 YoY influenced by timing of MCM deliveries (Q2 2026 vs Q3 2025) Total Revenues Adjusted EBITDA & Adjusted EBITDA Margin 2 $231 40% ($ in millions) ($ in millions) $110 $93 (4)% $(5) Q3 2025 Q3 202
Slide 14: Notable Revenue Elements Q3 2026 vs. Q3 2025
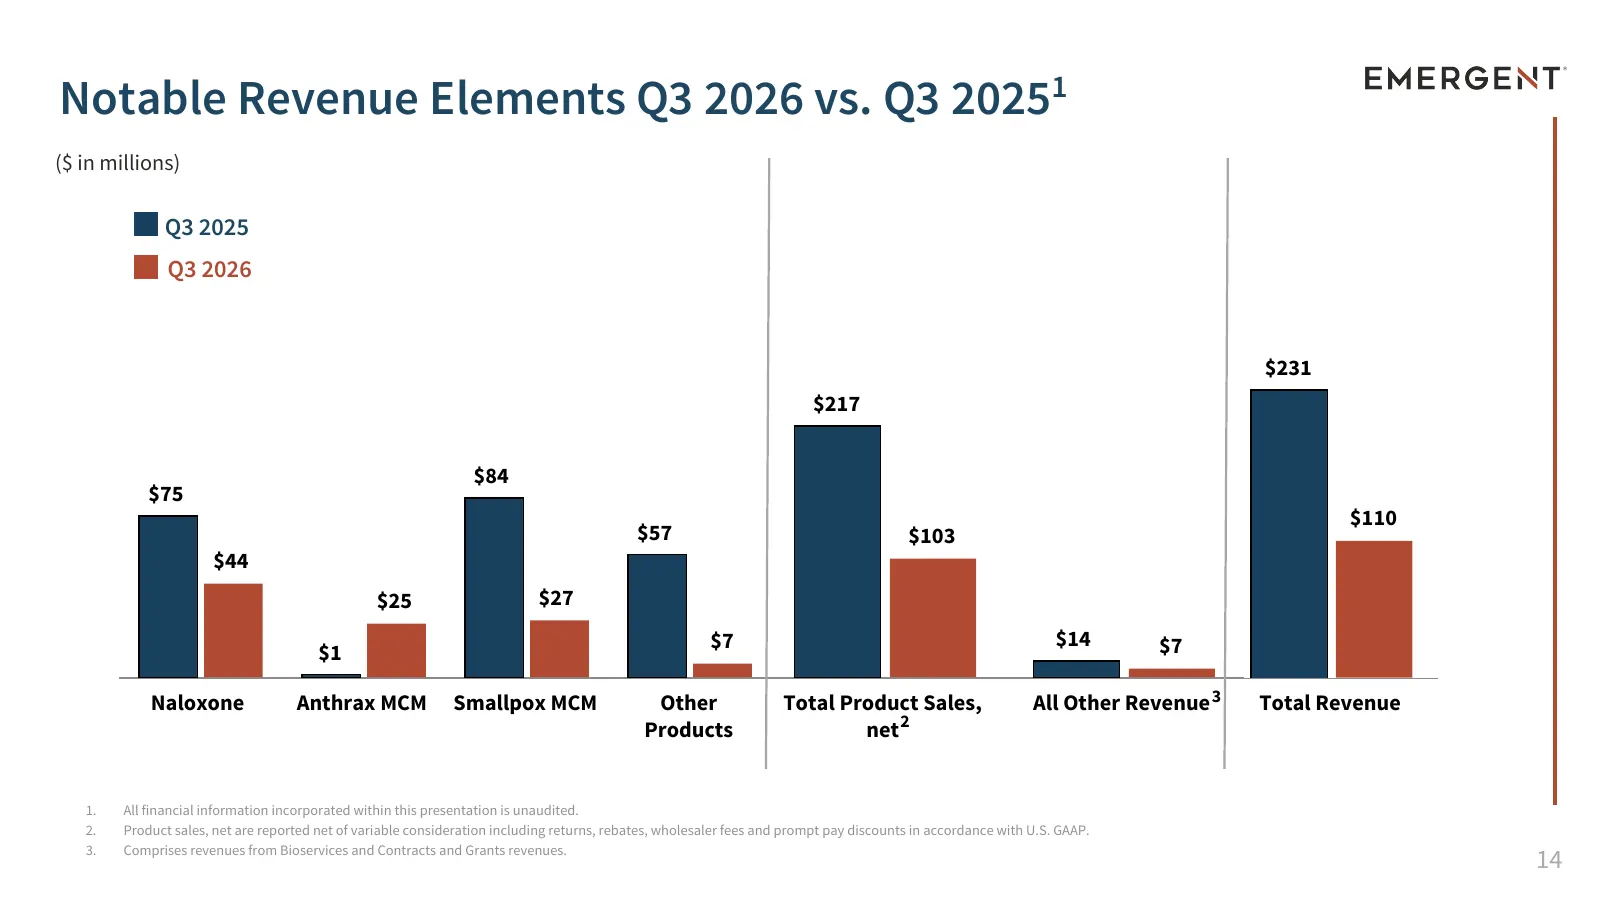
Notable Revenue Elements Q3 2026 vs. Q3 20251 ($ in millions) Q3 2025 Q3 2026 $231 $217 $84 $75 $110 $57 $103 $44 $25 $27 $7 $14 $7 $1 Naloxone Anthrax MCM Smallpox MCM Other Total Product Sales, All Other Revenue 3 Total Revenue Products net 2 1. All financial information incorporated within this p
Slide 15: Key Financial Performance Metrics YTD 2026 vs. YTD 2025
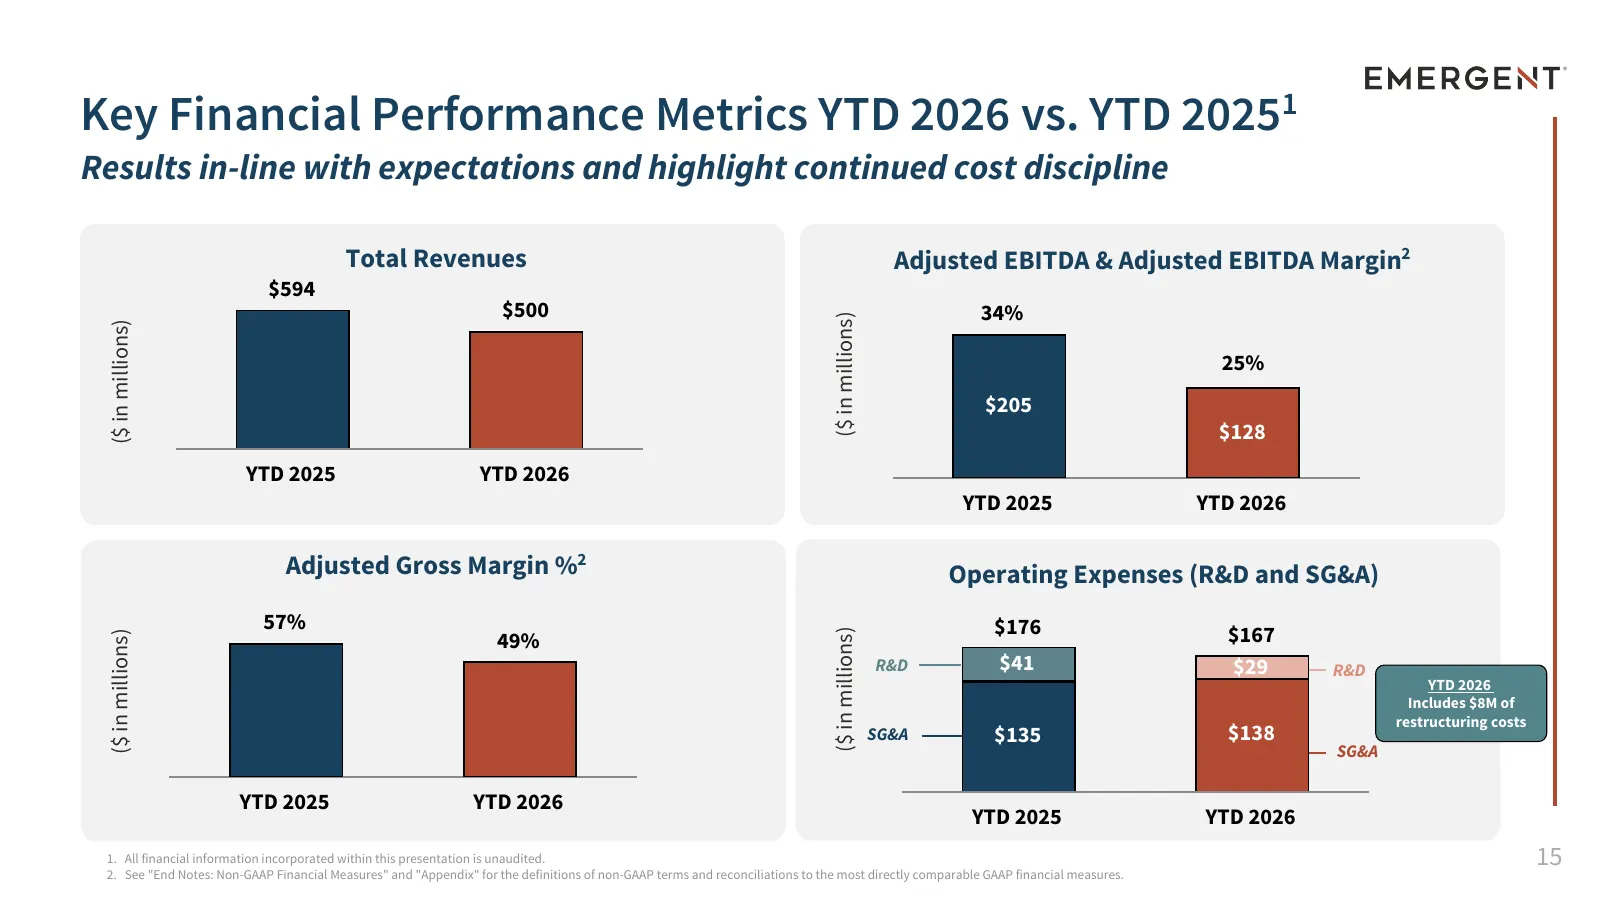
Key Financial Performance Metrics YTD 2026 vs. YTD 20251 Results in-line with expectations and highlight continued cost discipline Total Revenues Adjusted EBITDA & Adjusted EBITDA Margin2 $594 $500 34% ($ in millions) ($ in millions) 25% $205 $128 YTD 2025 YTD 2026 YTD 2025 YTD 2026 Adjusted Gross M
Slide 16: Notable Revenue Elements YTD 2026 vs. YTD 2025
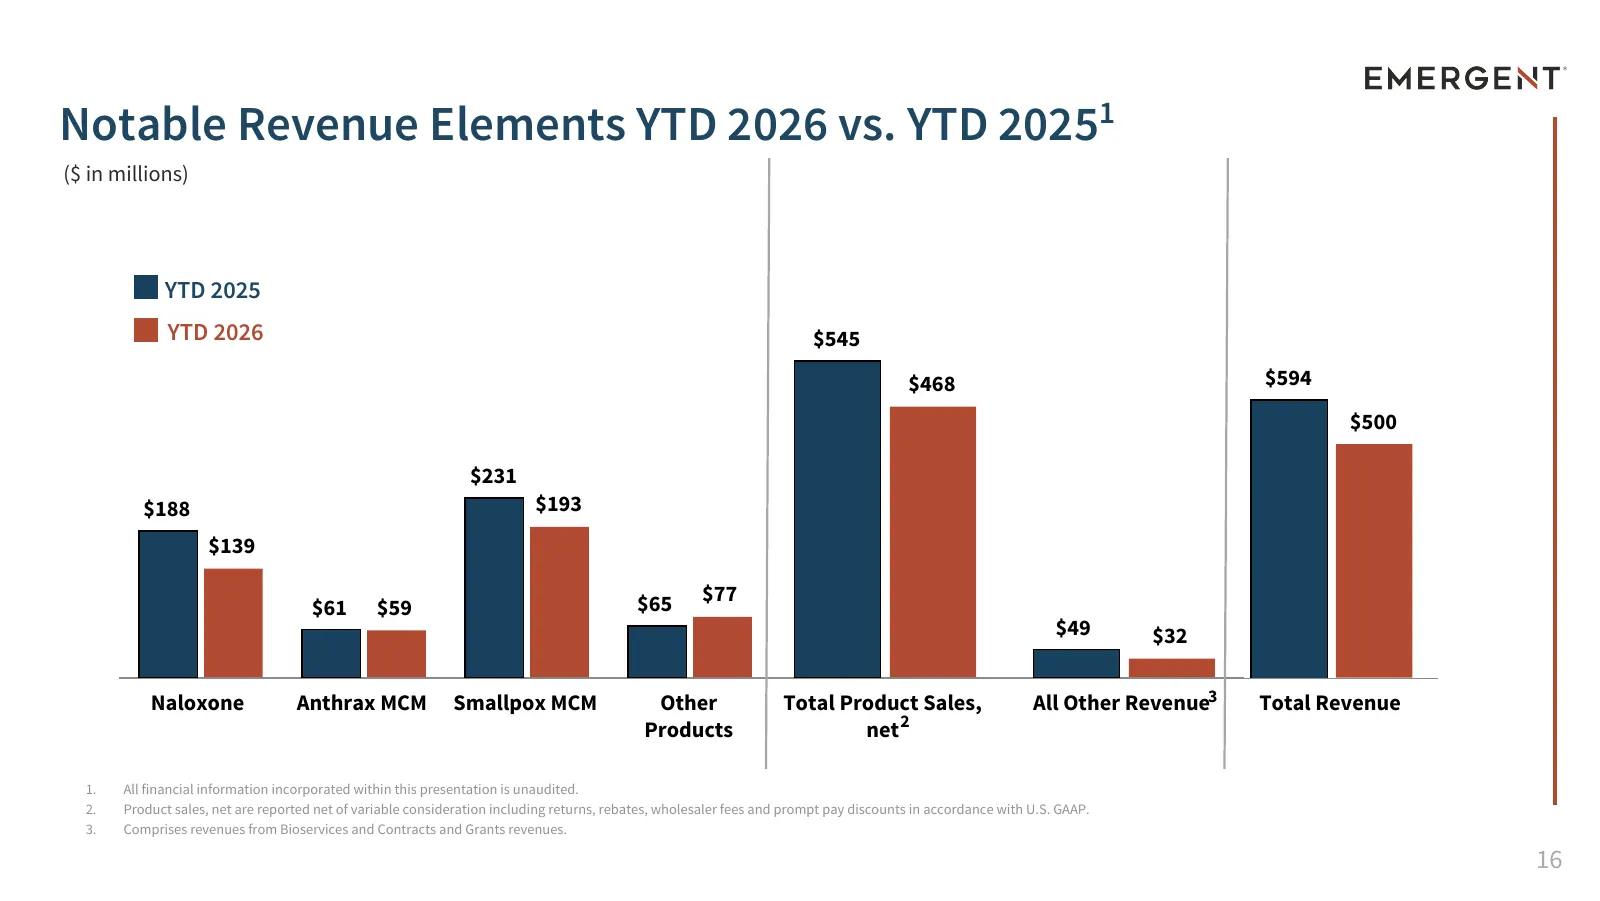
Notable Revenue Elements YTD 2026 vs. YTD 20251 ($ in millions) YTD 2025 YTD 2026 $545 $468 $594 $500 $231 $188 $193 $139 $65 $77 $61 $59 $49 $32 Naloxone Anthrax MCM Smallpox MCM Other Total Product Sales, All Other Revenue3 Total Revenue Products net 2 1. All financial information incorporated wit
Slide 17: Disciplined Balance Sheet Management During Turnaround in 2026
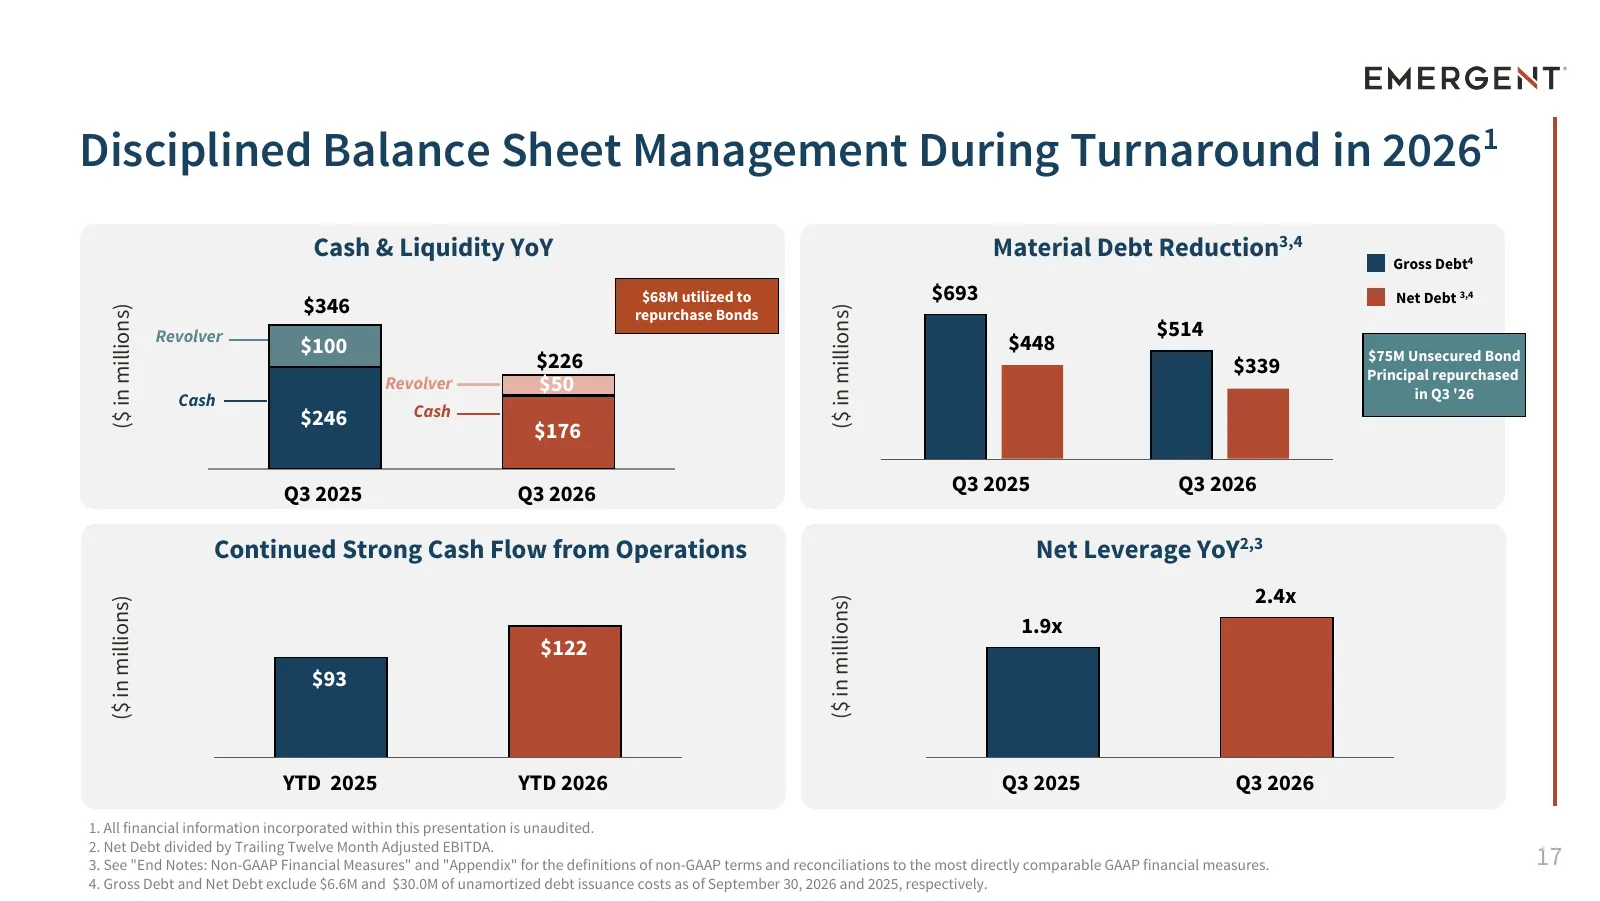
Disciplined Balance Sheet Management During Turnaround in 20261 Cash & Liquidity YoY Material Debt Reduction3,4 Gross Debt4 $68M utilized to $693 Net Debt 3,4 $346 ($ in millions) ($ in millions) repurchase Bonds Revolver $514 $100 $448 $226 $339 $75M Unsecured Bond Principal repurchased Revolver $5
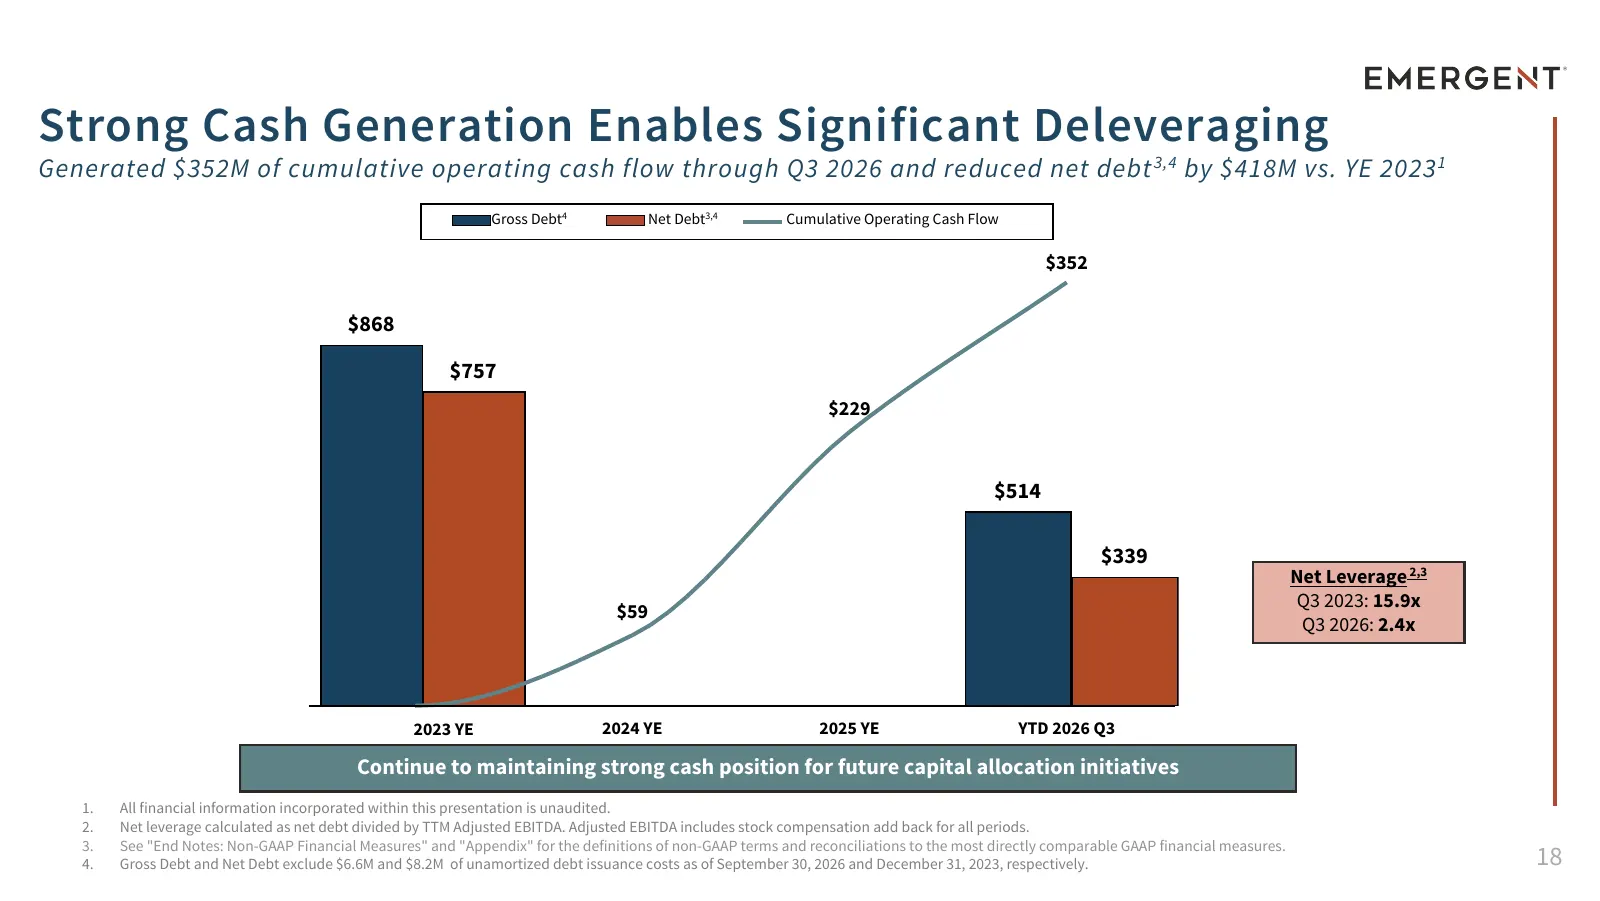
Slide 18: Strong Cash Generation Enables Significant Deleveraging
Strong Cash Generation Enables Significant Deleveraging Generated $352M of cumulative operating cash flow through Q3 2026 and reduced net debt 3,4 by $418M vs. YE 2023 1 Gross Debt4 Net Debt3,4 Cumulative Operating Cash Flow $352 $868 $757 $229 $514 $339 Net Leverage 2,3 Q3 2023: 15.9x $59 Q3 2026:
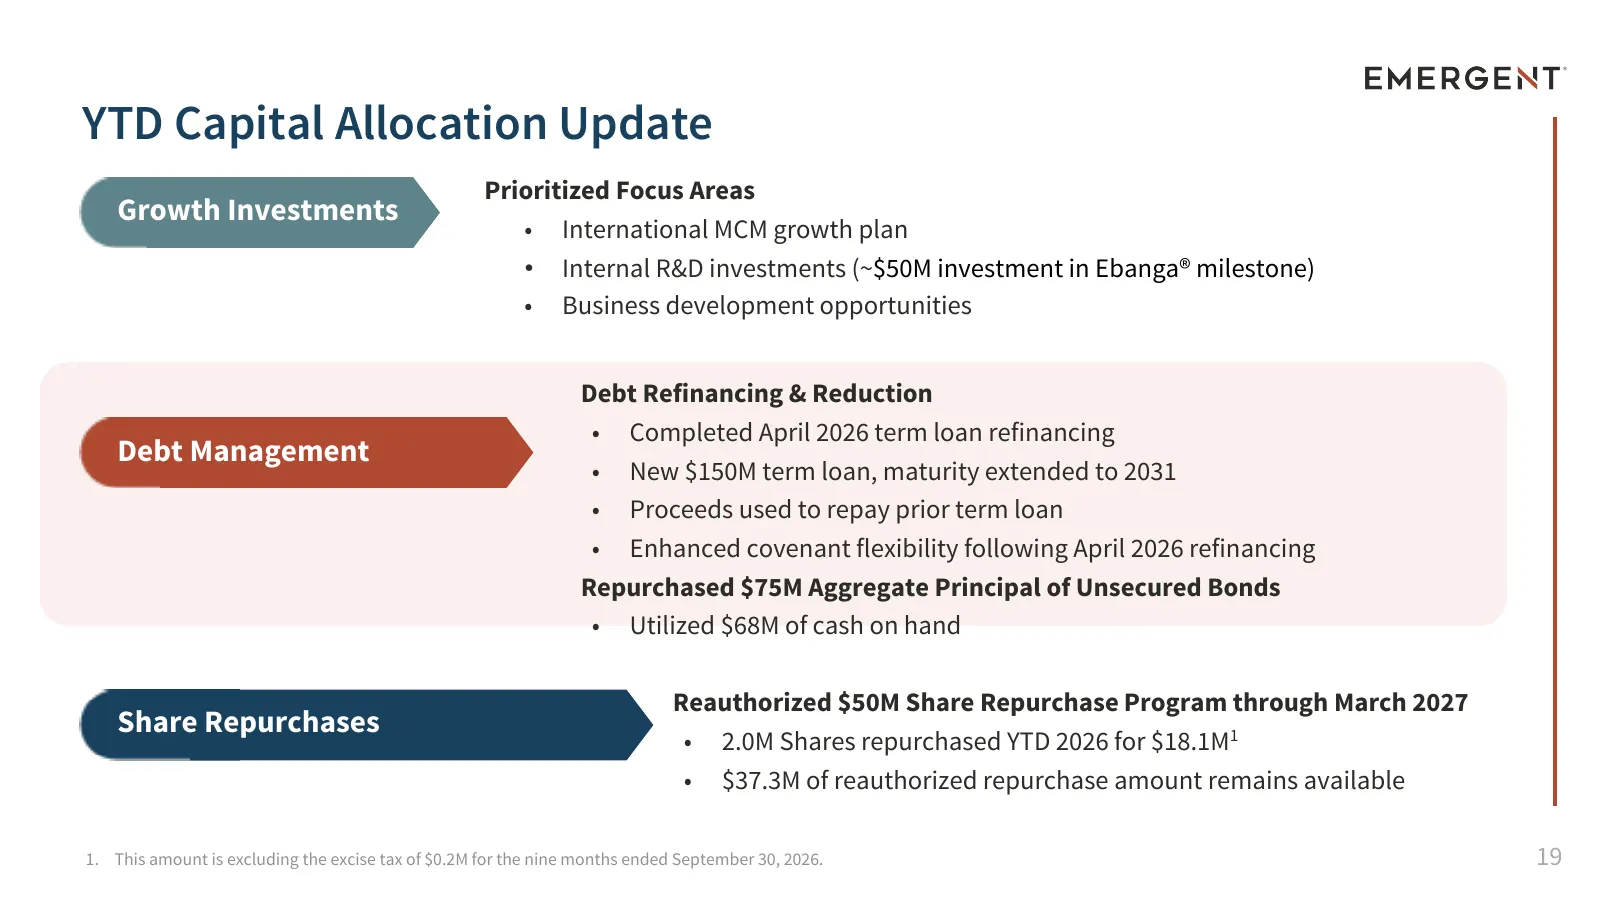
Slide 19: YTD Capital Allocation Update
YTD Capital Allocation Update Prioritized Focus Areas Growth Investments • International MCM growth plan • Internal R&D investments (~$50M investment in Ebanga® milestone) • Business development opportunities Debt Refinancing & Reduction • Completed April 2026 term loan refinancing Debt Management •
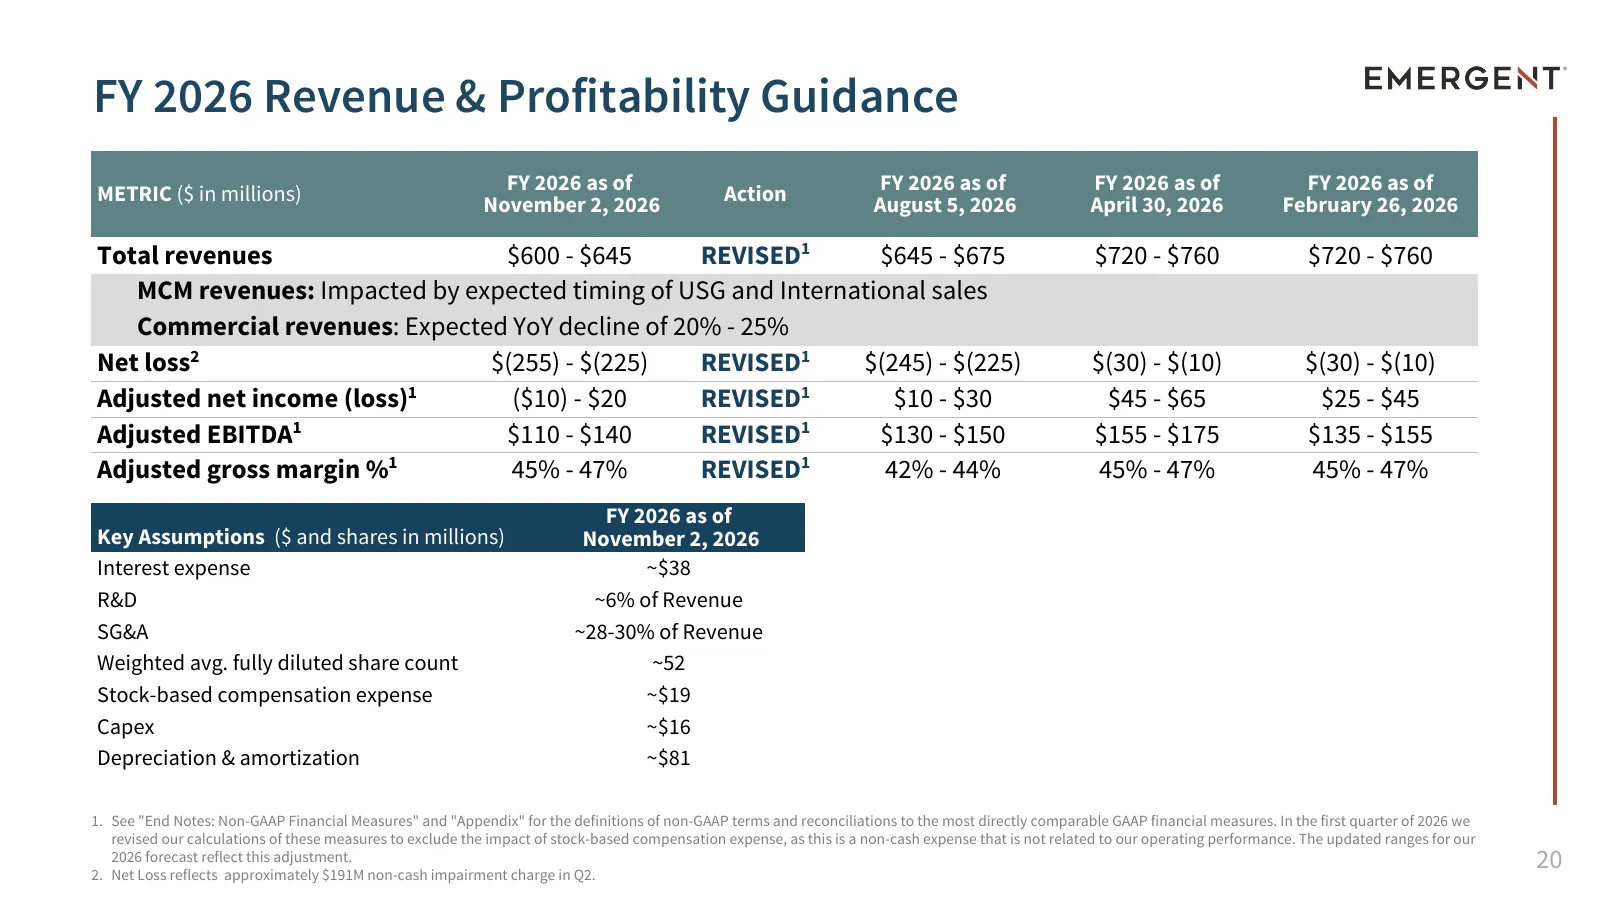
Slide 20: FY 2026 Revenue & Profitability Guidance
FY 2026 Revenue & Profitability Guidance FY 2026 as of FY 2026 as of FY 2026 as of FY 2026 as of METRIC ($ in millions) Action November 2, 2026 August 5, 2026 April 30, 2026 February 26, 2026 Total revenues $600 - $645 REVISED1 $645 - $675 $720 - $760 $720 - $760 MCM revenues: Impacted by expected t
Slide 21: 2026 Business Outlook & Catalysts to Enable Growth
2026 Business Outlook & Catalysts to Enable Growth Joe Papa President and Chief Executive Officer 21
Slide 22: Key Growth Catalysts
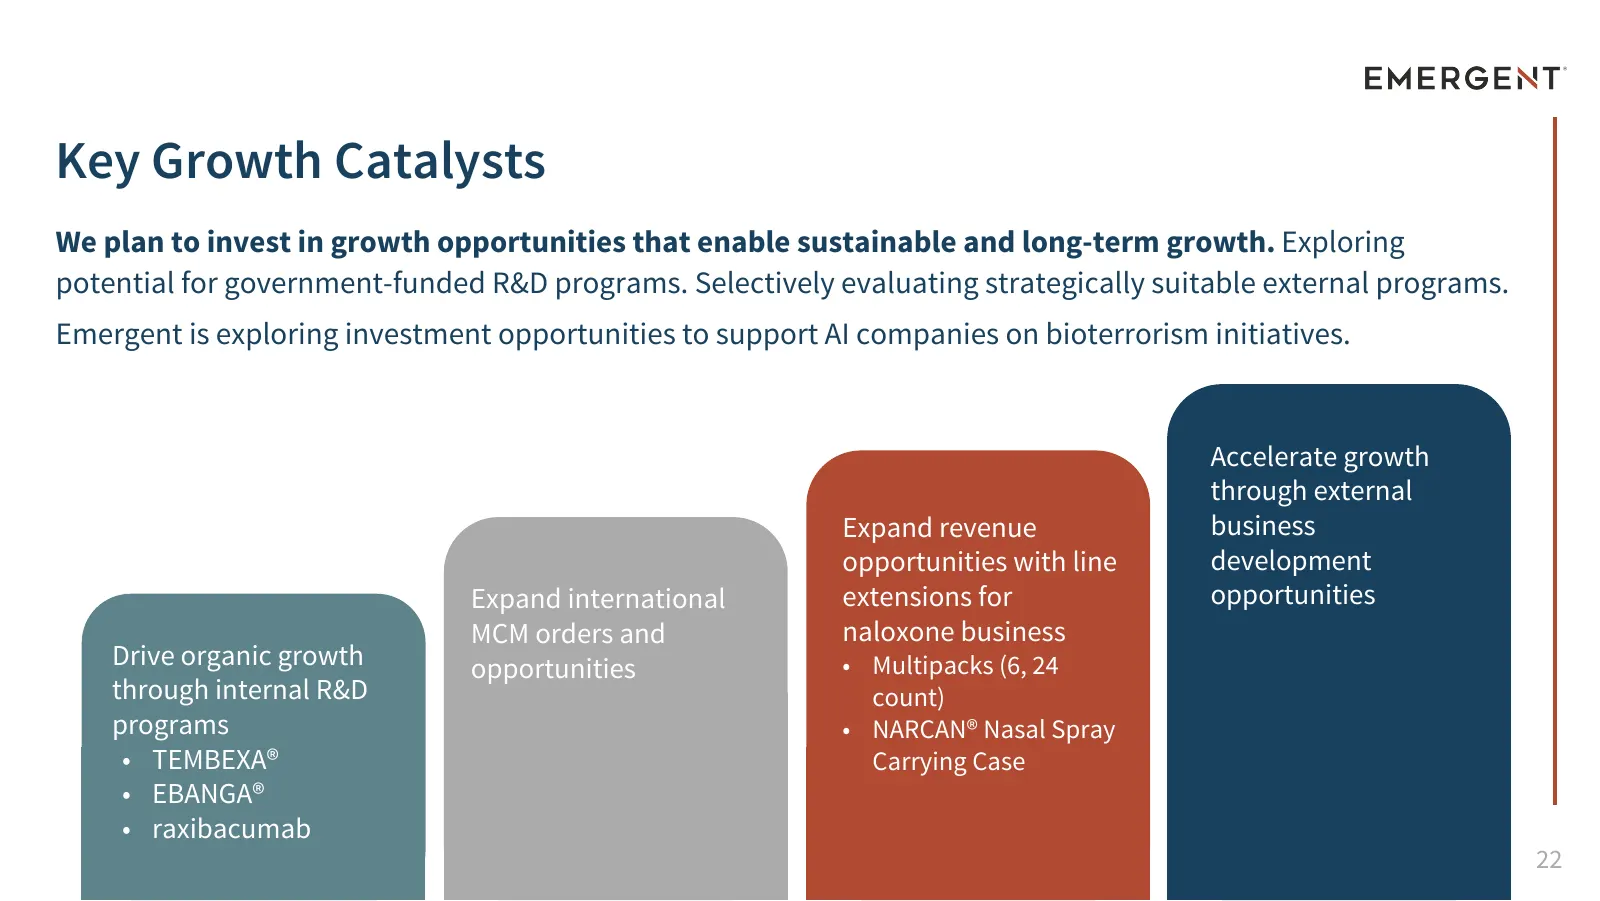
Key Growth Catalysts We plan to invest in growth opportunities that enable sustainable and long-term growth. Exploring potential for government-funded R&D programs. Selectively evaluating strategically suitable external programs. Emergent is exploring investment opportunities to support AI companies
Slide 23: Near-Term Focus Maximizes Value of Current Assets and Pipeline/R&D Opportunities
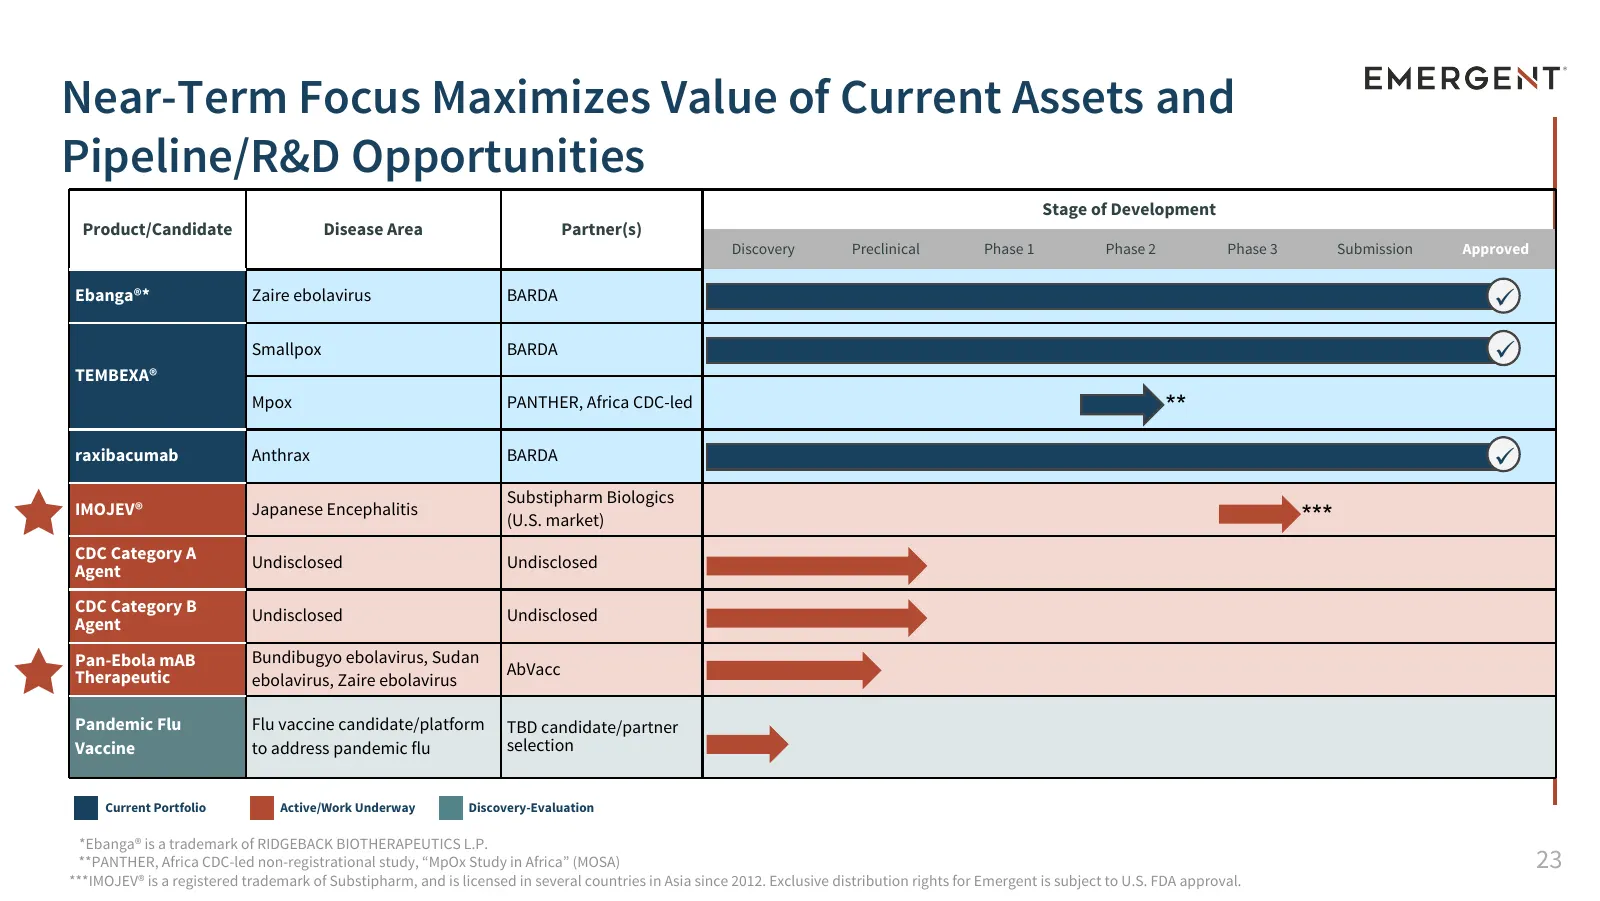
Near-Term Focus Maximizes Value of Current Assets and Pipeline/R&D Opportunities Stage of Development Product/Candidate Disease Area Partner(s) Discovery Preclinical Phase 1 Phase 2 Phase 3 Submission Approved Ebanga®* Zaire ebolavirus BARDA ü Smallpox BARDA ü TEMBEXA® Mpox PANTHER, Africa CDC-led *
Slide 24: Closing Remarks
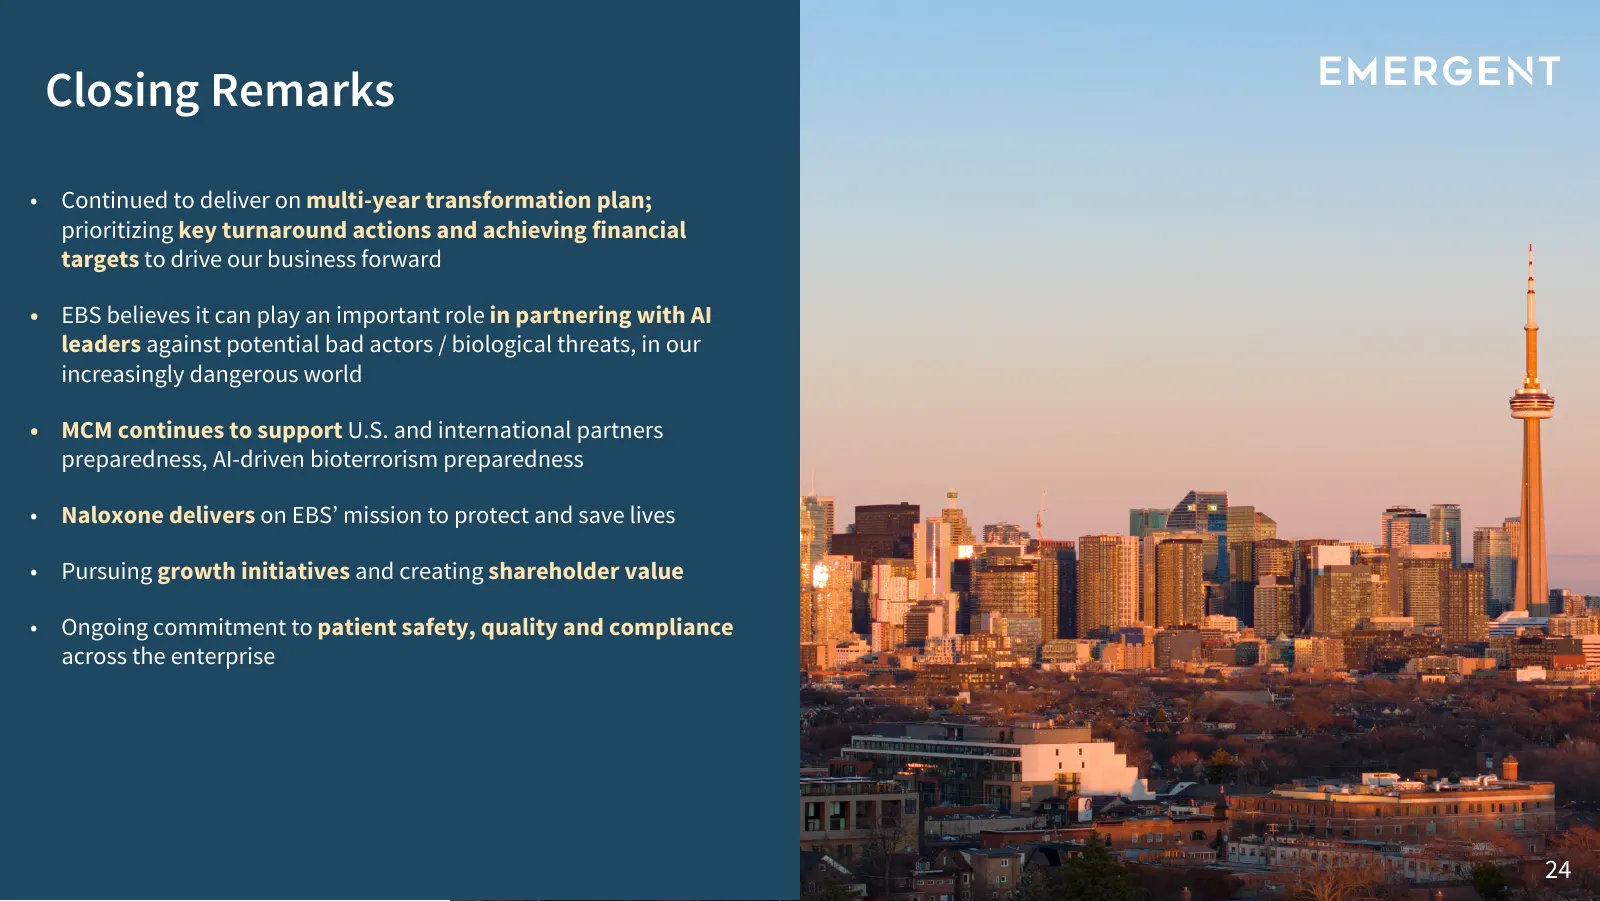
Closing Remarks • Continued to deliver on multi-year transformation plan; prioritizing key turnaround actions and achieving financial targets to drive our business forward • EBS believes it can play an important role in partnering with AI leaders against potential bad actors / biological threats, in

Slide 25: Q&A Session
Q&A Session Questions? Answers. 25
Slide 26: End Notes: Non-GAAP Financial Measures
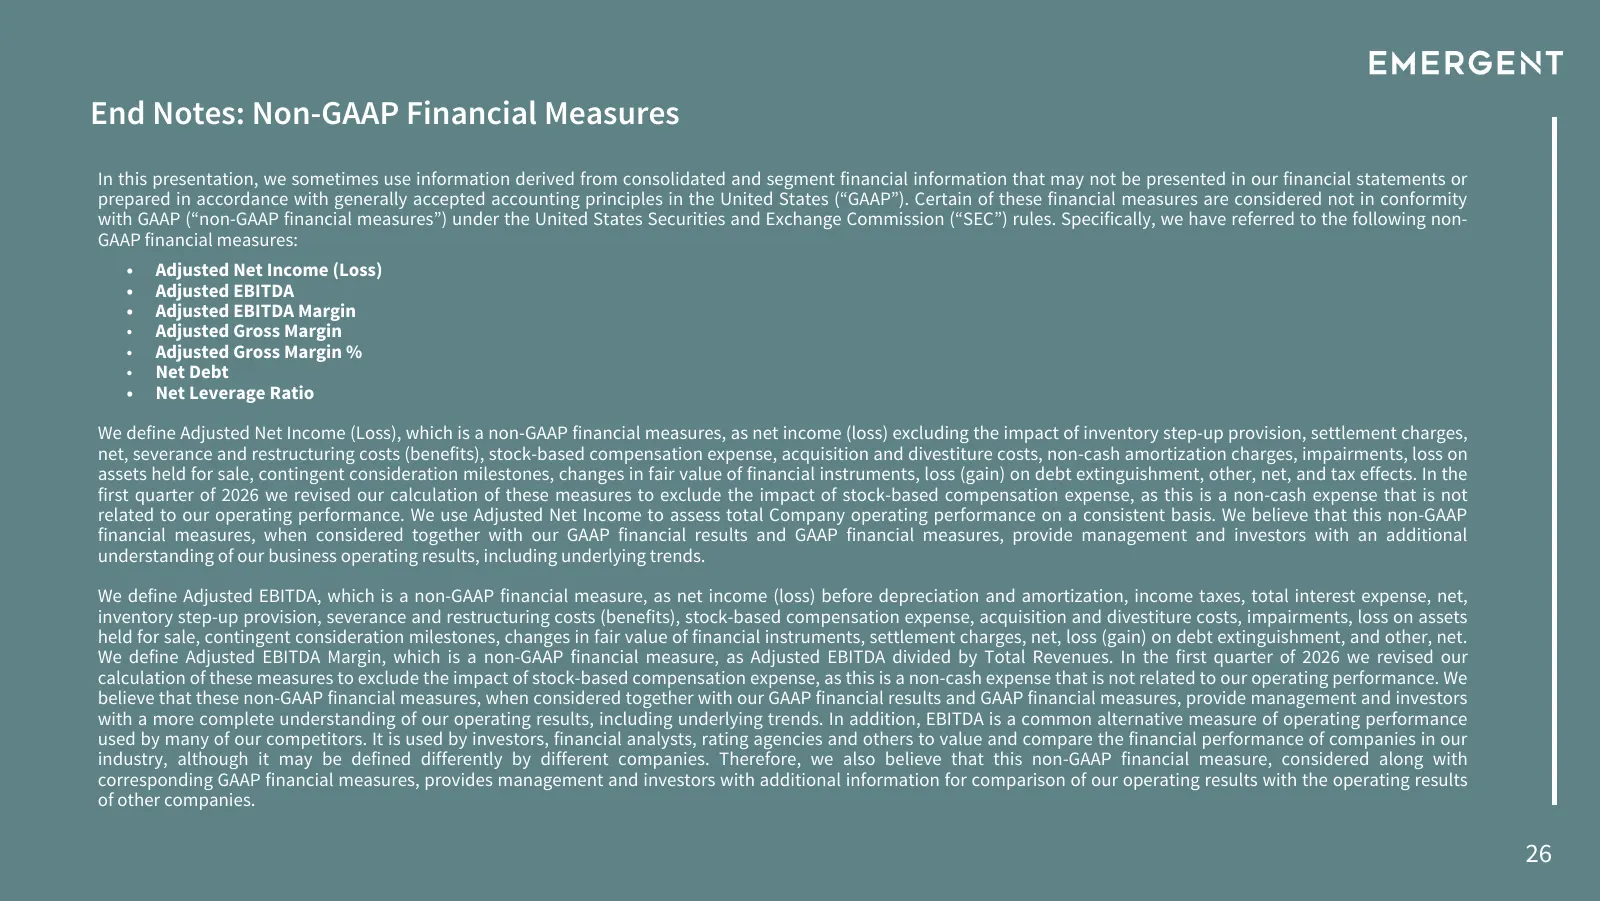
End Notes: Non-GAAP Financial Measures In this presentation, we sometimes use information derived from consolidated and segment financial information that may not be presented in our financial statements or prepared in accordance with generally accepted accounting principles in the United States (“G
Slide 27: End Notes: Non-GAAP Financial Measures (Continued)
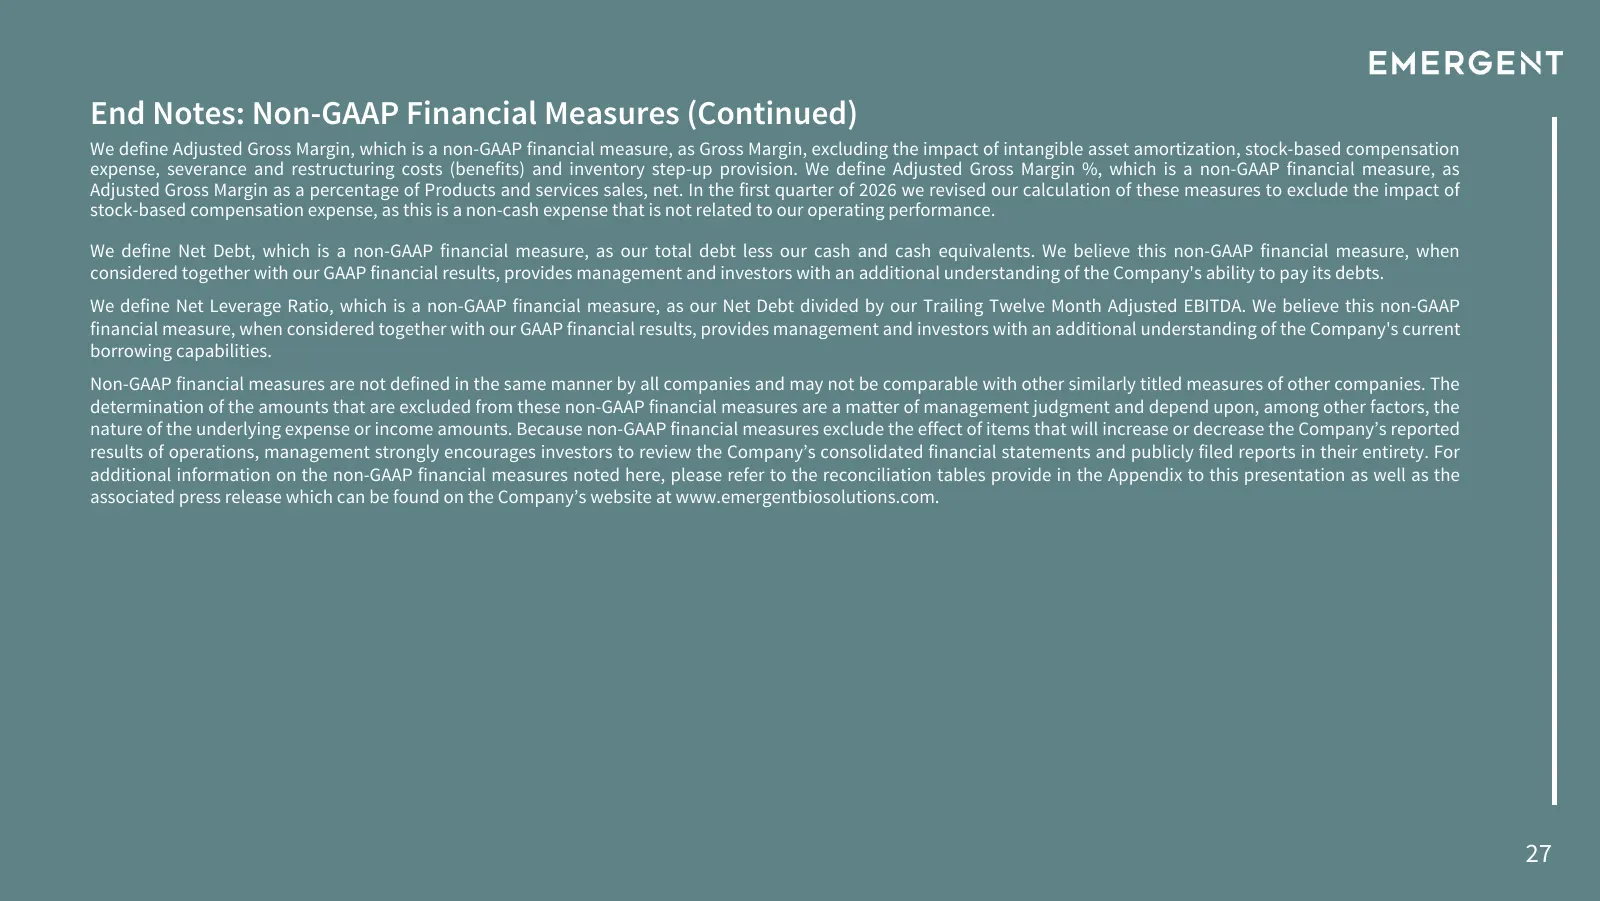
End Notes: Non-GAAP Financial Measures (Continued) We define Adjusted Gross Margin, which is a non-GAAP financial measure, as Gross Margin, excluding the impact of intangible asset amortization, stock-based compensation expense, severance and restructuring costs (benefits) and inventory step-up prov
Slide 28: Reconciliation of Net Income (Loss) to Adjusted Net Income (Loss)
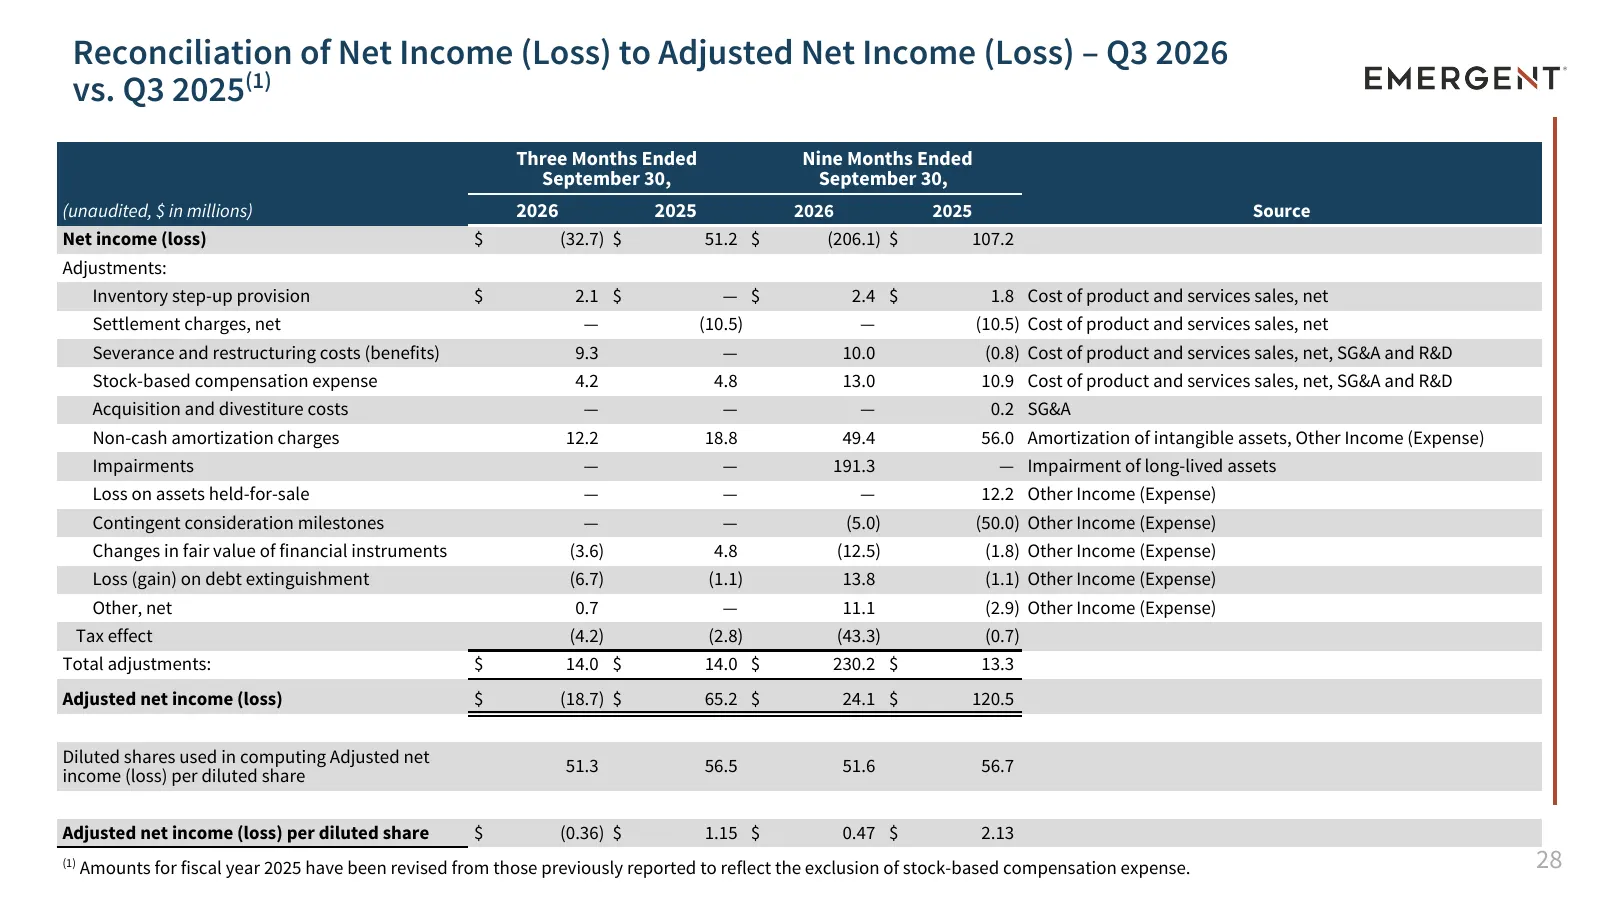
Reconciliation of Net Income (Loss) to Adjusted Net Income (Loss) – Q3 2026 vs. Q3 2025(1) Three Months Ended Nine Months Ended September 30, September 30, (unaudited, $ in millions) 2026 2025 2026 2025 Source Net income (loss) $ (32.7) $ 51.2 $ (206.1) $ 107.2 Adjustments: Inventory step-up provisi
Slide 29: Reconciliation of Net Income (Loss) to Adjusted EBITDA
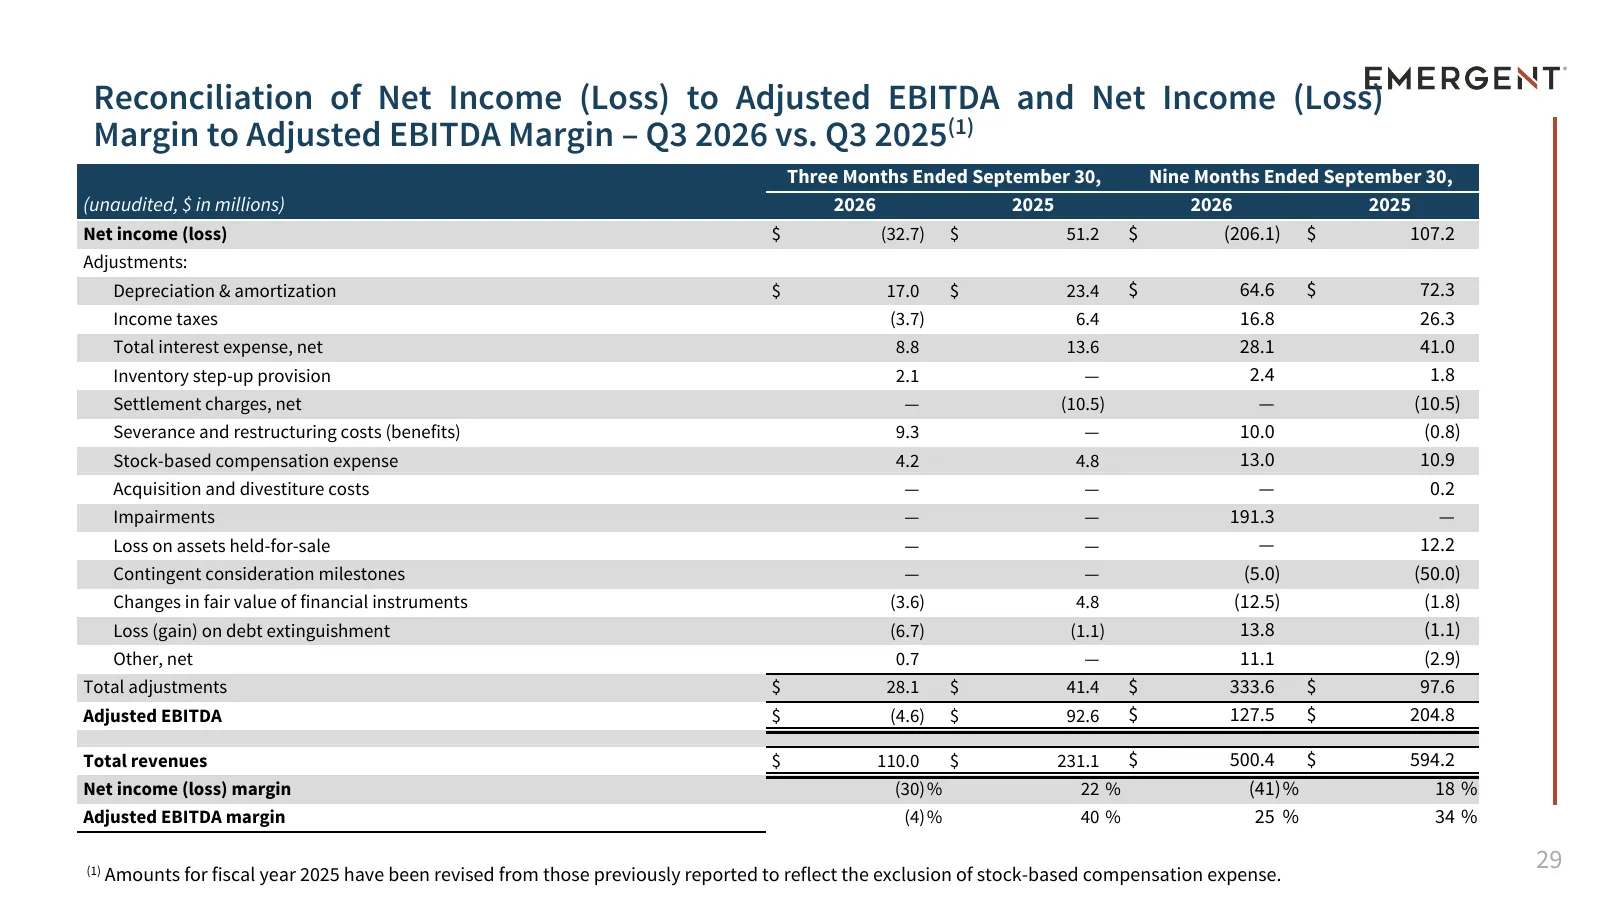
Reconciliation of Net Income (Loss) to Adjusted EBITDA and Net Income (Loss) Margin to Adjusted EBITDA Margin – Q3 2026 vs. Q3 2025(1) Three Months Ended September 30, Nine Months Ended September 30, (unaudited, $ in millions) 2026 2025 2026 2025 Net income (loss) $ (32.7) $ 51.2 $ (206.1) $ 107.2 A
Slide 30: Reconciliations of Total Revenues to Product and Services Sales and Gross Margin
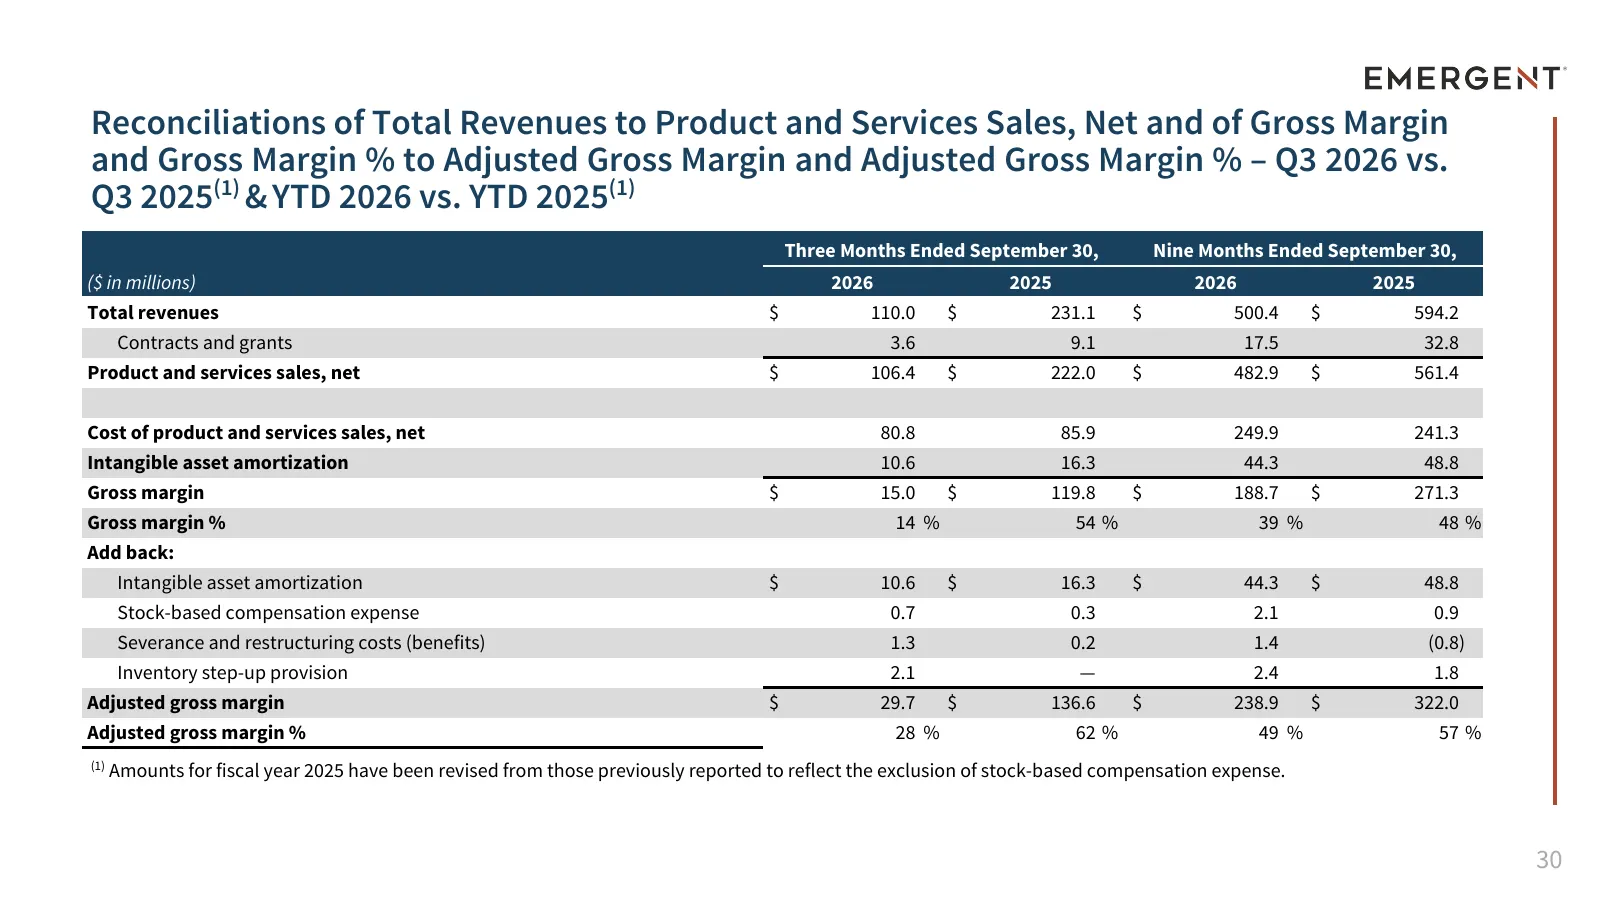
APPENDIX Reconciliations of Total Revenues to Product and Services Sales, Net and of Gross Margin and Gross Margin % to Adjusted Gross Margin and Adjusted Gross Margin % – Q3 2026 vs. Q3 2025(1) & YTD 2026 vs. YTD 2025(1) Three Months Ended September 30, Nine Months Ended September 30, ($ in million
Slide 31: Reconciliations of Total Debt to Net Debt and Net Leverage Ratio
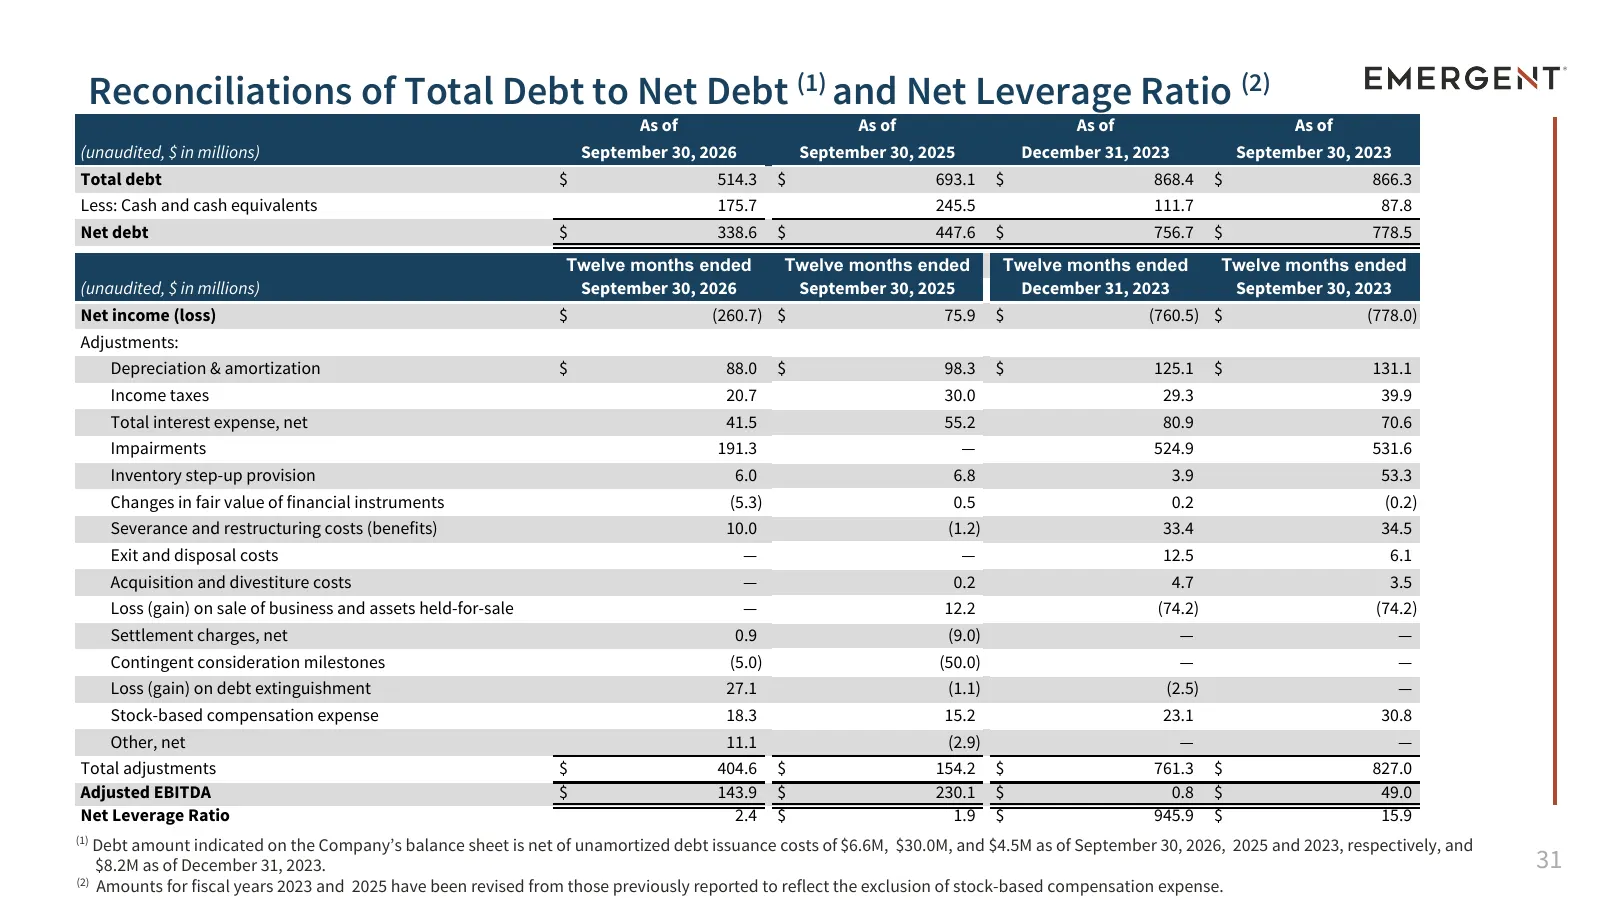
Reconciliations of Total Debt to Net Debt (1) and Net Leverage Ratio (2) As of As of As of As of (unaudited, $ in millions) September 30, 2026 September 30, 2025 December 31, 2023 September 30, 2023 Total debt $ 514.3 $ 693.1 $ 868.4 $ 866.3 Less: Cash and cash equivalents 175.7 245.5 111.7 87.8 Net
Slide 32: Reconciliation of Net Loss to Adjusted Net Income (Loss) – FY 2026 Forecast
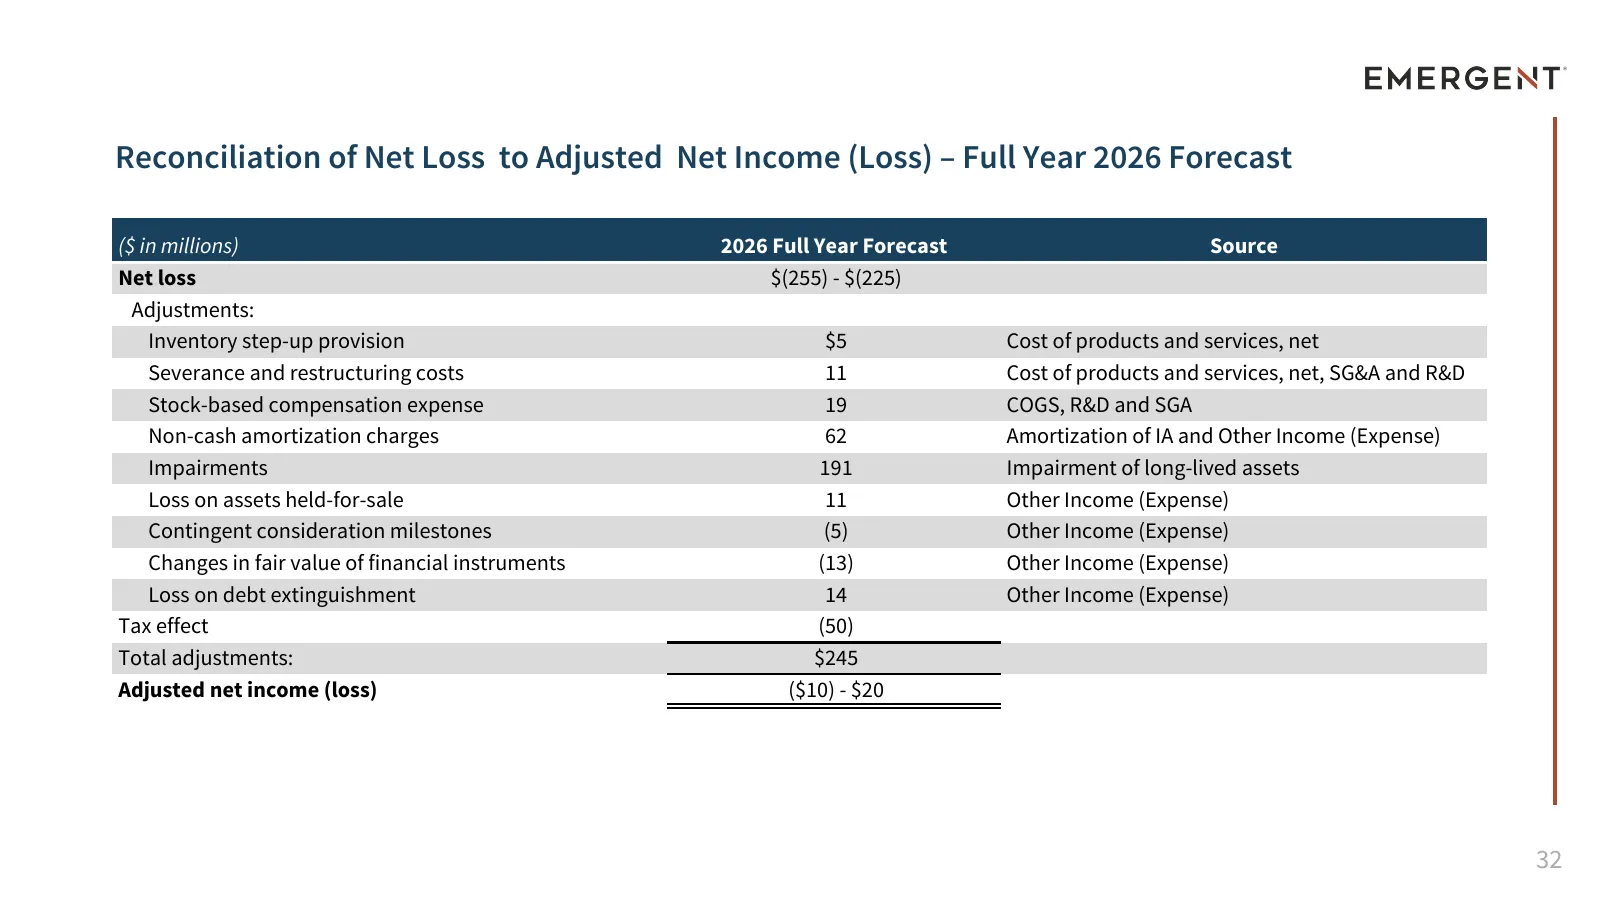
Reconciliation of Net Loss to Adjusted Net Income (Loss) – Full Year 2026 Forecast ($ in millions) 2026 Full Year Forecast Source Net loss $(255) - $(225) Adjustments: Inventory step-up provision $5 Cost of products and services, net Severance and restructuring costs 11 Cost of products and services
Slide 33: Reconciliation of Net Loss to Adjusted EBITDA – FY 2026 Forecast
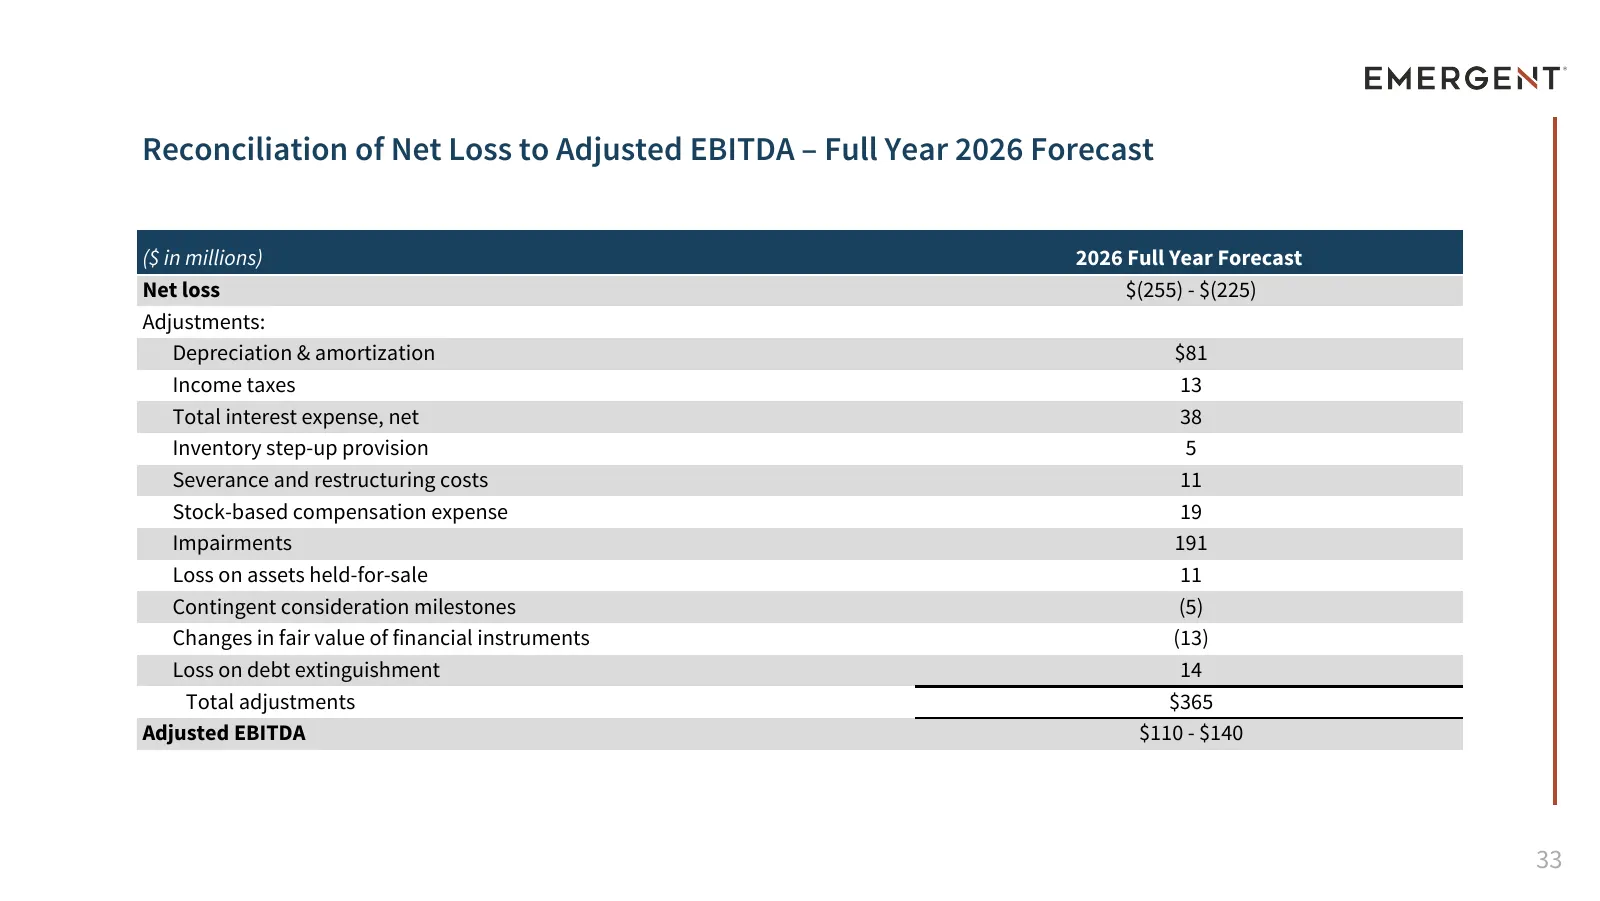
Reconciliation of Net Loss to Adjusted EBITDA – Full Year 2026 Forecast ($ in millions) 2026 Full Year Forecast Net loss $(255) - $(225) Adjustments: Depreciation & amortization $81 Income taxes 13 Total interest expense, net 38 Inventory step-up provision 5 Severance and restructuring costs 11 Stoc
Slide 34: Reconciliations of Forecasted Revenues and Gross Margin – FY 2026 Forecast
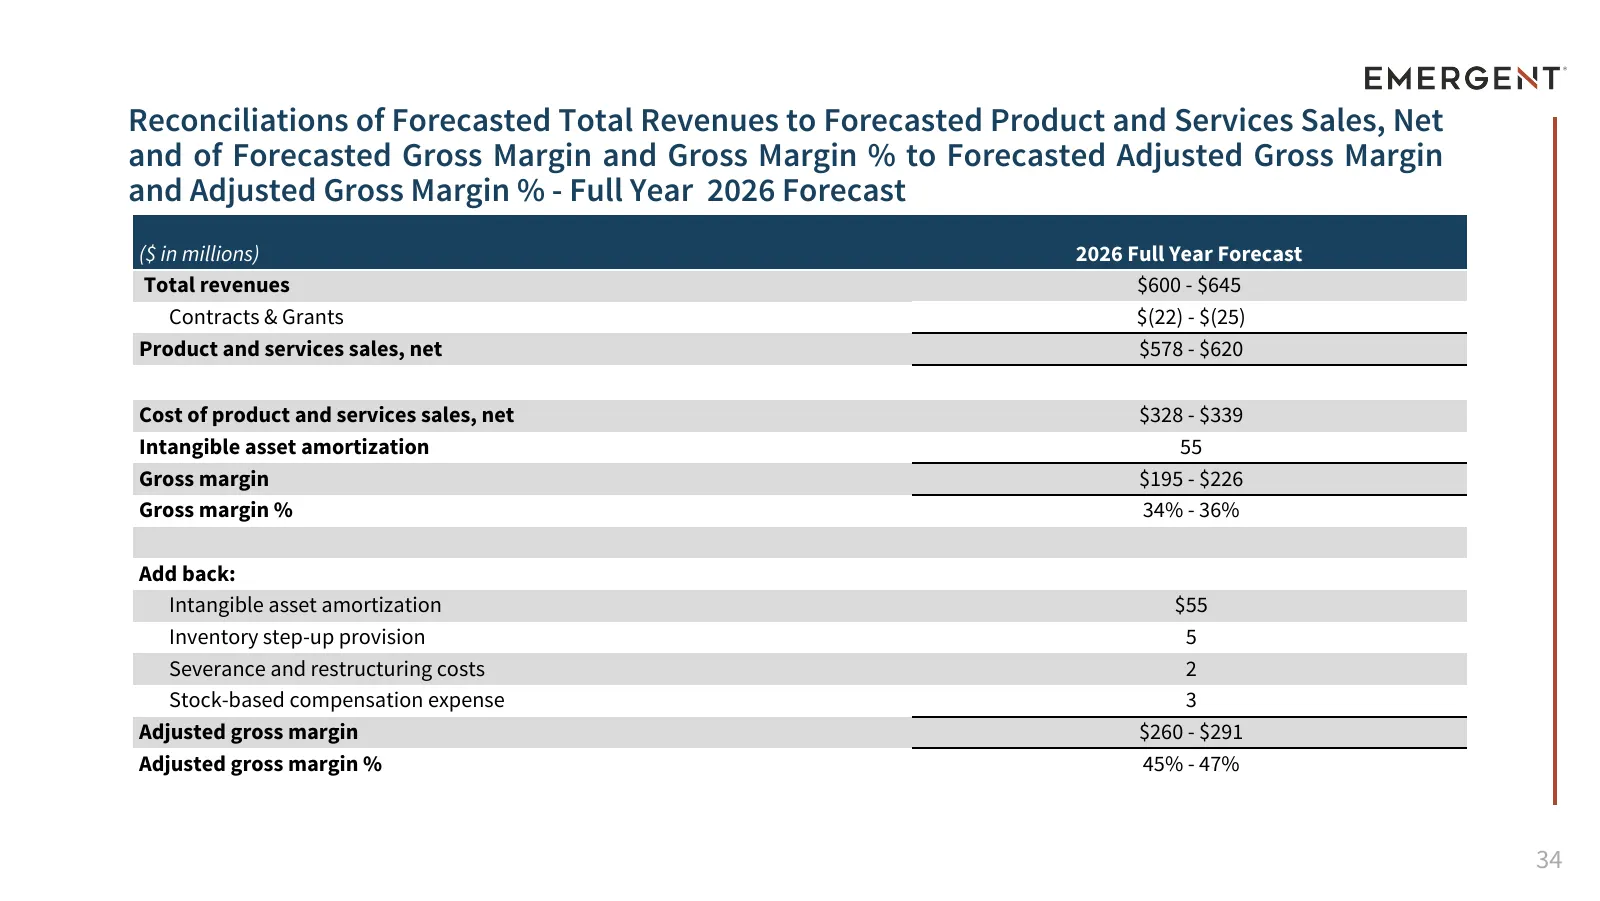
Reconciliations of Forecasted Total Revenues to Forecasted Product and Services Sales, Net and of Forecasted Gross Margin and Gross Margin % to Forecasted Adjusted Gross Margin and Adjusted Gross Margin % - Full Year 2026 Forecast ($ in millions) 2026 Full Year Forecast Total revenues $600 - $645 Co

Slide 35
Source: 6ix earnings call
More decks from Emergent BioSolutions Inc.
 H.C. Wainwright 28th Annual Global Investment Conference (September 2026)31 slides · Sep 14, 2026
 Q2 2026 Earnings Presentation34 slides · Aug 5, 2026
 Q1 2026 Earnings Presentation36 slides · Apr 30, 2026
 Q4 2025 Earnings Presentation40 slides · Feb 26, 2026
 44th Annual J.P. Morgan Healthcare Conference (January 2026)21 slides · Jan 14, 2026
 Q3 2025 Earnings Presentation36 slides · Oct 29, 2025