Furmanite — Q1 2010 Earnings Presentation
16 slides from Furmanite's earnings presentation, May 7, 2010
Slide 1: Furmanite Corporation Quarter Ended March 31, 2010
Furmanite Corporation QUARTER ENDED MARCH 31, 2010 Charles R. Cox, Chairman & CEO Joseph E. Milliron, President & COO Robert S. Muff, Principal Financial Officer
Slide 2: Safe Harbor Statement
safe harbor statement Certain of the Company's statements in this presentation are not purely historical, and as such are "forward-looking statements" within the meaning of the Private Securities Litigation Reform Act of 1995. These include statements regarding management's plans, beliefs, expectati
Slide 3: Review of Q1 2010
5 Furmanite Corporation Review of Q1 2010 Charles R. Cox, Chairman & CEO 5/7/2010
Slide 4: Q1 2010 Financial Review
7 Furmanite Corporation Q1 2010 Financial Review Robert S. Muff, Principal Financial Officer 5/7/2010
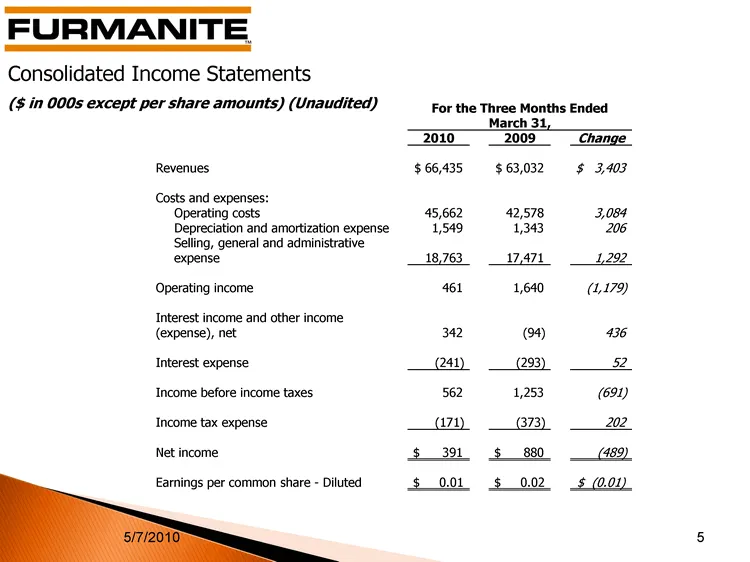
Slide 5: Consolidated Income Statements
Consolidated Income Statements ($ in 000s except per share amounts) (Unaudited) 5/7/2010 9 For the Three Months Ended For the Three Months Ended For the Three Months Ended For the Three Months Ended For the Three Months Ended March 31, March 31, March 31, March 31, March 31, 2010 2009 Change Revenue
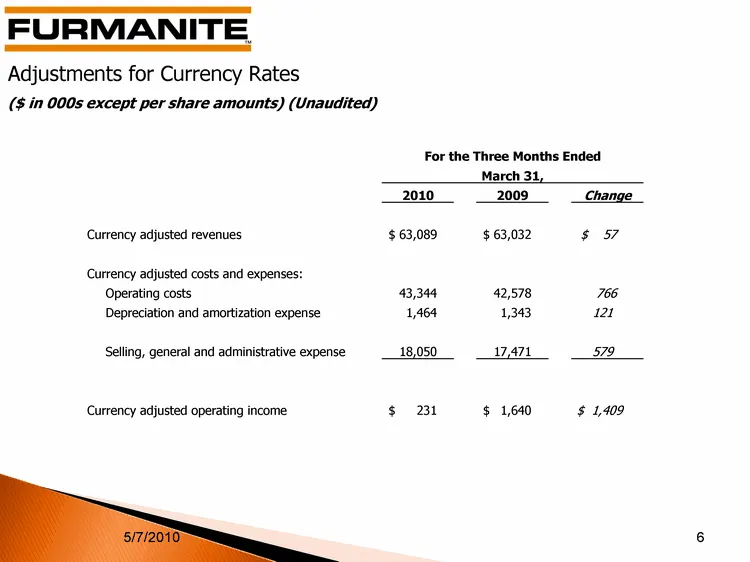
Slide 6: Adjustments for Currency Rates
Adjustments for Currency Rates ($ in 000s except per share amounts) (Unaudited) 5/7/2010 11 For the Three Months Ended For the Three Months Ended For the Three Months Ended For the Three Months Ended For the Three Months Ended March 31, March 31, March 31, March 31, March 31, 2010 2009 Change Revenu
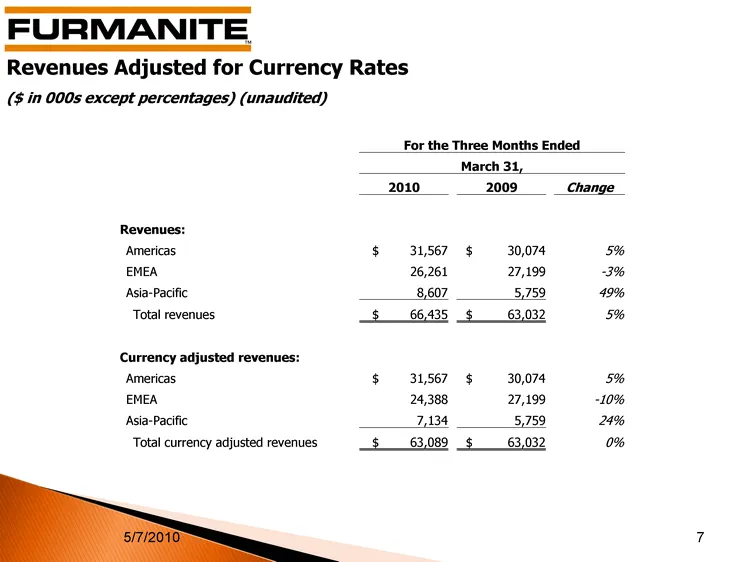
Slide 7: Revenues Adjusted for Currency Rates
Revenues Adjusted for Currency Rates ($ in 000s except percentages) (unaudited) 5/7/2010 13 For the Three Months Ended For the Three Months Ended For the Three Months Ended For the Three Months Ended For the Three Months Ended March 31, March 31, March 31, March 31, March 31, 2010 2009 Change Revenu
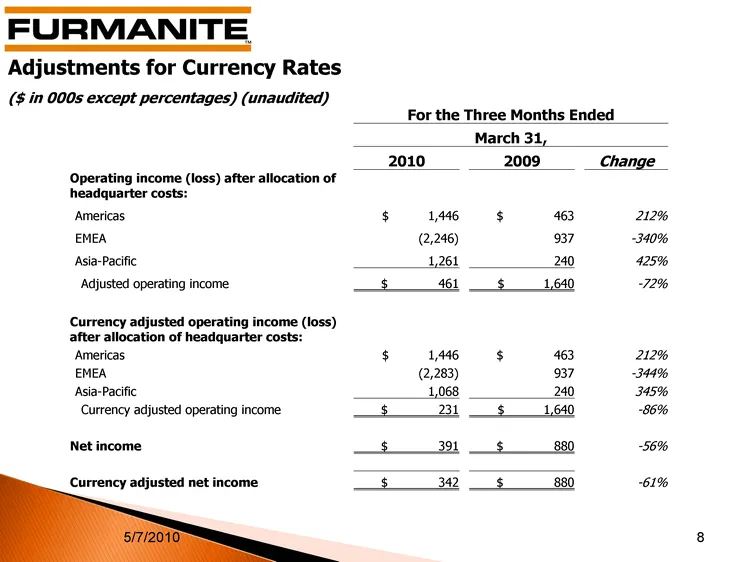
Slide 8: Adjustments for Currency Rates
Adjustments for Currency Rates ($ in 000s except percentages) (unaudited) 5/7/2010 15 For the Three Months Ended For the Three Months Ended For the Three Months Ended For the Three Months Ended For the Three Months Ended March 31, March 31, March 31, March 31, March 31, 2010 2009 Change Operating in
Slide 9: Condensed Consolidated Balance Sheets
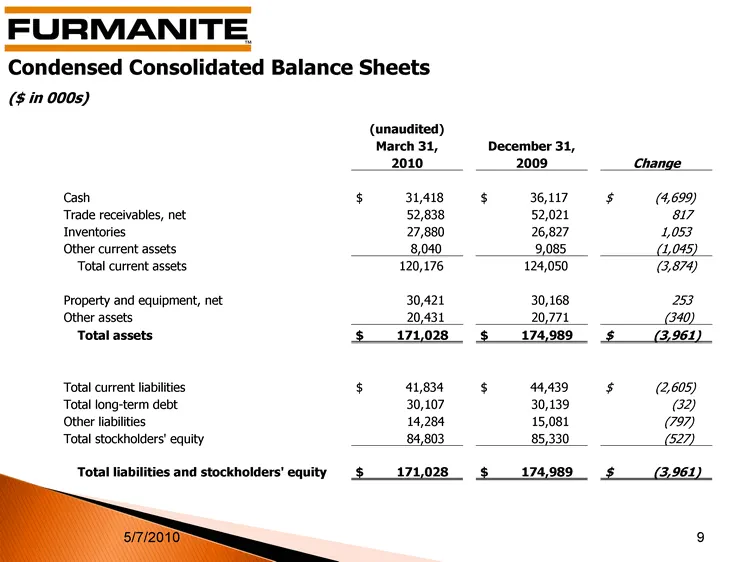
Condensed Consolidated Balance Sheets ($ in 000s) 5/7/2010 17 (unaudited) March 31, December 31, 2010 2009 Change Cash $ 31,418 $ 36,117 $ (4,699) Trade receivables, net 52,838 52,021 817 Inventories 27,880 26,827 1,053 Other current assets 8,040 9,085 (1,045) Total current assets 120,176 124,050 (3
Slide 10: Condensed Consolidated Cash Flows
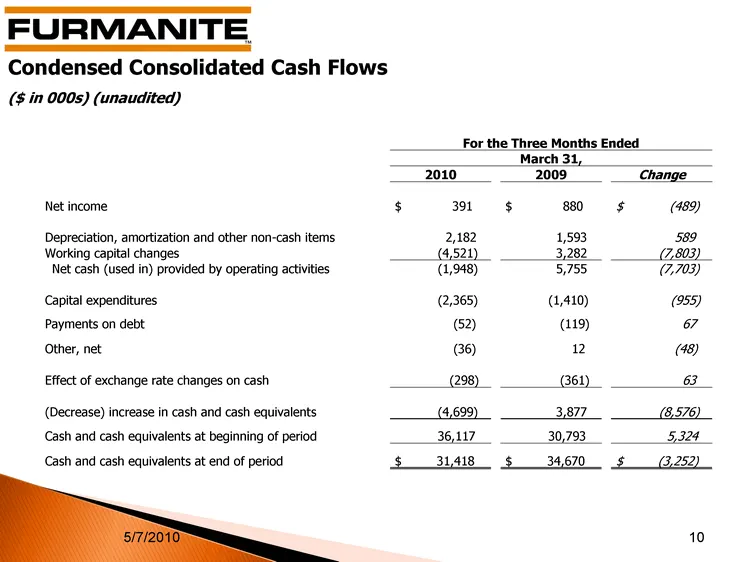
Condensed Consolidated Cash Flows ($ in 000s) (unaudited) 5/7/2010 19 For the Three Months Ended For the Three Months Ended For the Three Months Ended For the Three Months Ended For the Three Months Ended March 31, March 31, March 31, March 31, March 31, 2010 2009 Change Net income $ 391 $ 880 $ (48
Slide 11: Q1 2010 Operations Review
Furmanite Corporation Q1 2010 Operations Review Joseph E. Milliron, President and Chief Operating Officer 5/7/2010 21
Slide 12: Business and Geographic Data - Revenues
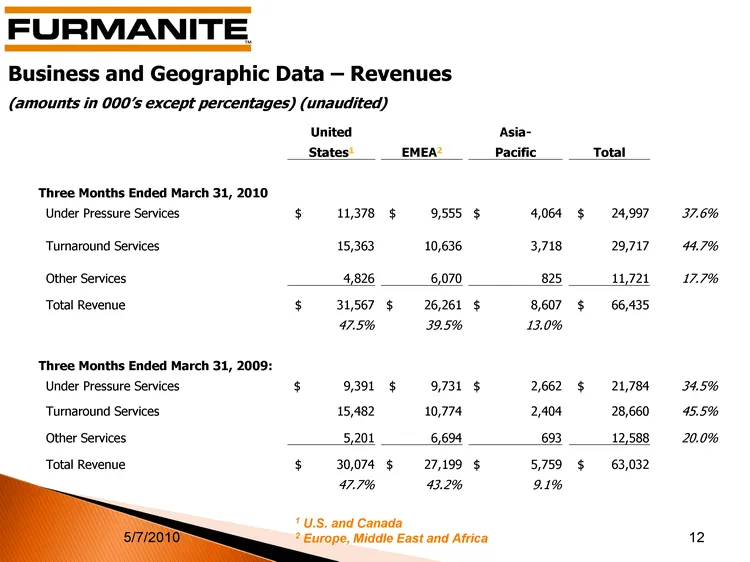
Business and Geographic Data - Revenues (amounts in 000's except percentages) (unaudited) 5/7/2010 23 United Asia- States1 EMEA2 Pacific Total Three Months Ended March 31, 2010 Under Pressure Services $ 11,378 $ 9,555 $ 4,064 $ 24,997 37.6% Turnaround Services 15,363 10,636 3,718 29,717 44.7% Other
Slide 13: EMEA made up of three regions
25 5/7/2010 EMEA made up of three regions: Central Europe Scandinavia United Kingdom Rename Europe Operations; now EMEA (Europe, Middle East, Africa)
Slide 14: Central Europe Region
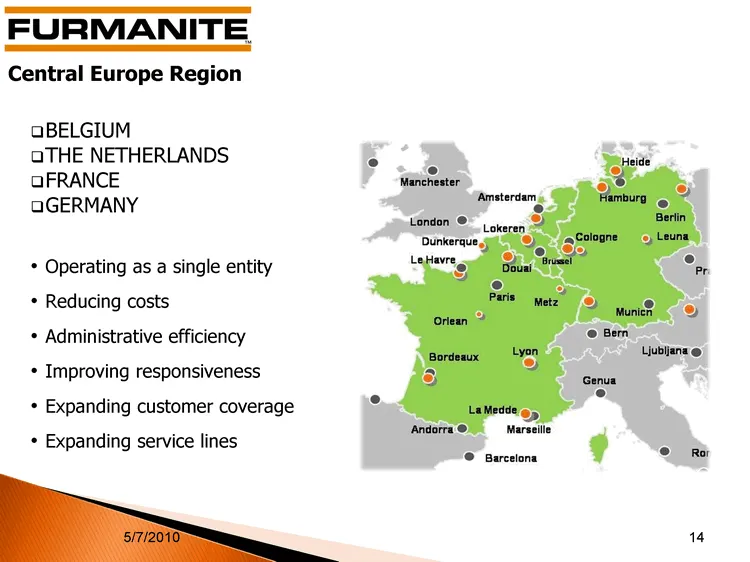
Central Europe Region 27 5/7/2010 BELGIUM THE NETHERLANDS FRANCE GERMANY Operating as a single entity Reducing costs Administrative efficiency Improving responsiveness Expanding customer coverage Expanding service lines
Slide 15: Scandinavia Region
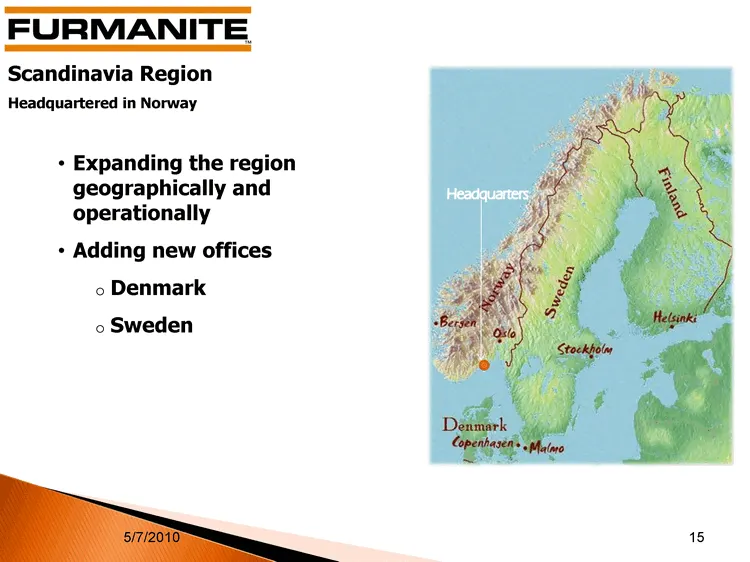
Scandinavia Region Headquartered in Norway Expanding the region geographically and operationally Adding new offices Denmark Sweden 5/7/2010 29
Slide 16: United Kingdom Region
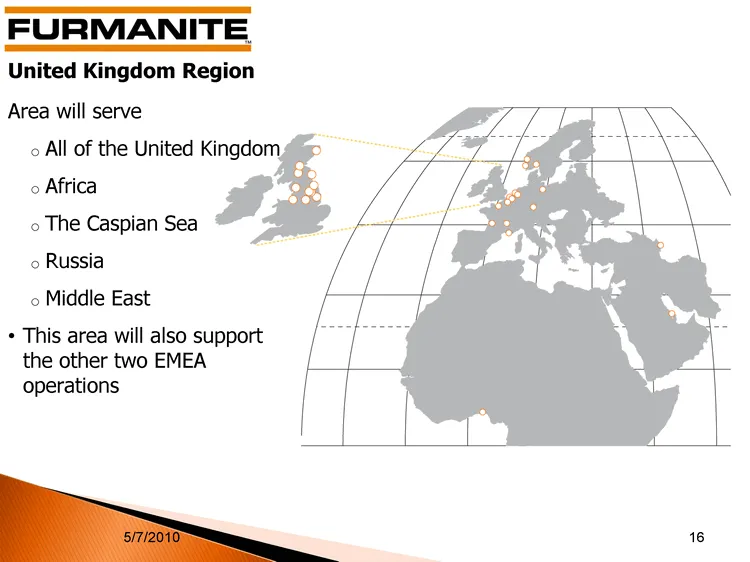
United Kingdom Region 31 5/7/2010 Area will serve All of the United Kingdom Africa The Caspian Sea Russia Middle East This area will also support the other two EMEA operations
Source: SEC EDGAR · 8-K filed May 7, 2010
More decks from Furmanite Corp
 Merger or Acquisition (November 2015)13 slides · Nov 2, 2015
 Q2 2015 Earnings Presentation19 slides · Aug 4, 2015
 Q1 2015 Earnings Presentation16 slides · May 11, 2015
 Proxy Contest (April 2015)40 slides · Apr 2, 2015
 Proxy Contest (April 2015)29 slides · Apr 2, 2015
 Proxy Contest (March 2015)39 slides · Mar 30, 2015