Furmanite — Q2 2009 Earnings Presentation
8 slides from Furmanite's earnings presentation, Aug 7, 2009
Slide 1: Furmanite Corporation Review of 2Q 2009
Furmanite Corporation Review of 2Q 2009 Michael Rose, Chairman & CEO Joseph Milliron, President & COO Miguel Desdin, Senior Vice President & CFO EURMANITE
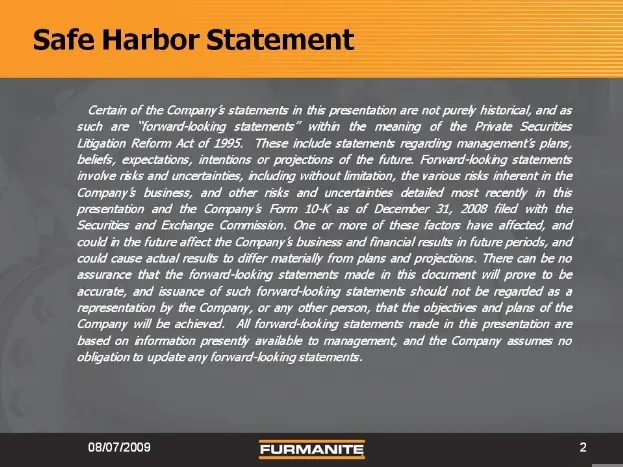
Slide 2: Forward-looking statements
Certain of the Company’ statements in this presentation are not purely historical, and as such are “Yorward-looking statements” within the meening of the Private Securities Litigation Reform Act of 1995. These include statements regarding management’ plans, beliefs, expectations, intentions or proje
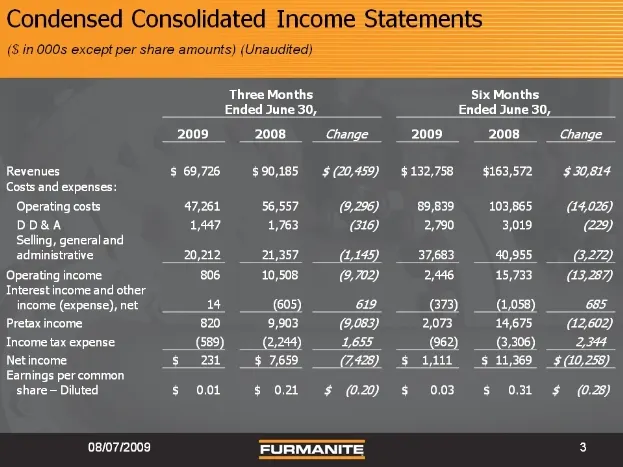
Slide 3: Condensed Consolidated Income Statement
Condensed Consolidated Income Statemet (Sin 000s except per share amounts) (Unaudited) Three Months Six Months Ended June 30, Ended June 30, 2009 2008 Change _2009 2008 _ Change Revenues S$ 69,726 $90,185 — $ (20,459) $132,758 $163,572 $ 30,814 Costs and expenses: Operating costs 47,261 56,557 (9,29
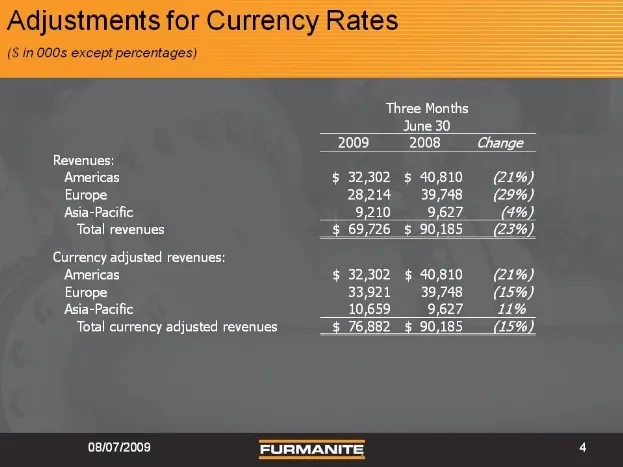
Slide 4: Three Months Revenues by Region
Three Months June 30 2009-2008 Change Revenues: Americas $ 32,302 $ 40810 (21%) 28,214 39,748 (29%) 9,210 9,627 (4%) Total revenues 69,726 § 90,185 (23%) Currency adjusted revenues: Americas $ 32,302 $ 40,810 (21%) Europe 33,921 39,748 © (15%) Asia-Pacific 10,659 9,627_—11% Total currency adjusted r
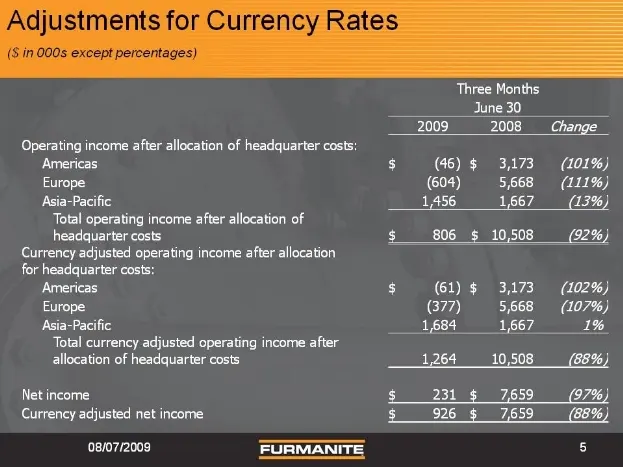
Slide 5: Adjustments for Currency Rates
Adjustments for Currency Rates (5 in 000s except percentages) Operating income after allocation of headquarter costs: Americas Europe Asia-Pacific Total operating income after allocation of headquarter costs Currency adjusted operating income after allocation for headquarter costs: Americas Europe A
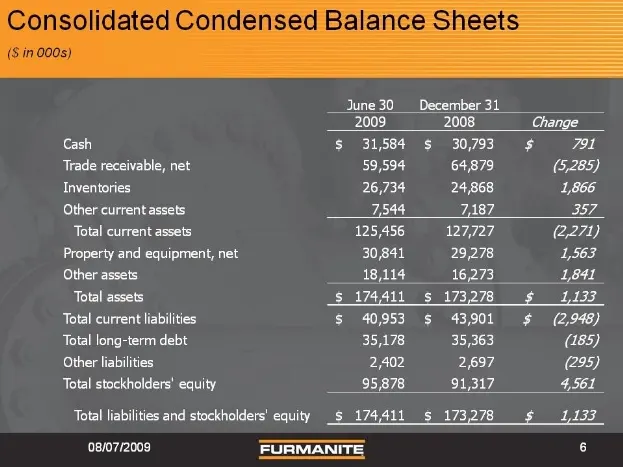
Slide 6: Consolidated Condensed Balance Sheets
Consolidated Condensed Balance Sheets ($in 000s) June 30__ December 31 2009 2008 Change Cash $ 31584 $ 30,793 $ 71 Trade receivable, net 59,594 64,879 (5,285) Inventories 26,734 24,868 1,866 Other currentassets 7544 PACHA 357 Total current assets 125,456 127,727 (2271) Property and equipment, net 30
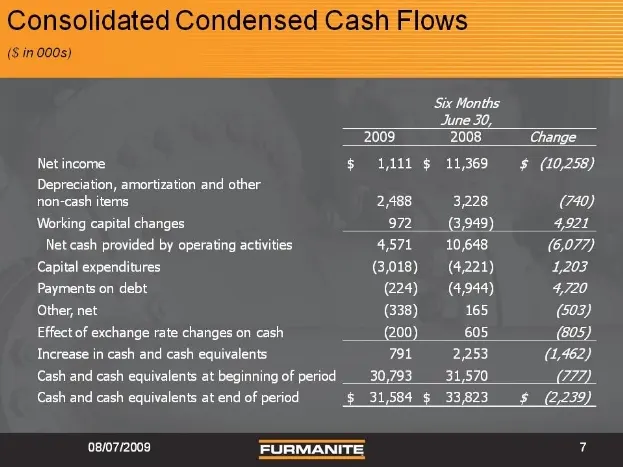
Slide 7: Consolidated Condensed Cash Flows
Consolidated Condensed Cash Flows ($in 000s) Six Months June 30, 2009 2008 Change Net income. $ 1111 $ 11,369 § (10,258) Depreciation, amortization and other non-cash items 2488 3,228 (740) Working capital changes 972 3,949} 4921 Net cash provided by operating activities 4571 10,648 (6,077) Capital
Slide 8: Furmanite Corporation Review of Q2 2009
Furmanite Corporation Review of Q2 2009
Source: SEC EDGAR · 8-K filed Aug 7, 2009
More decks from Furmanite Corp
 Merger or Acquisition (November 2015)13 slides · Nov 2, 2015
 Q2 2015 Earnings Presentation19 slides · Aug 4, 2015
 Q1 2015 Earnings Presentation16 slides · May 11, 2015
 Proxy Contest (April 2015)40 slides · Apr 2, 2015
 Proxy Contest (April 2015)29 slides · Apr 2, 2015
 Proxy Contest (March 2015)39 slides · Mar 30, 2015