Korn Ferry · NYSE:KFY
Korn Ferry — Korn Ferry Hay Group global reward webinar series (2017)
42 slides from Korn Ferry's conference presentation, 2017

Slide 1: The future of reward in the UK
The future of reward in the UK Part of the Korn Ferry Hay Group global reward webinar series 2017
Slide 2: Meet your presenters
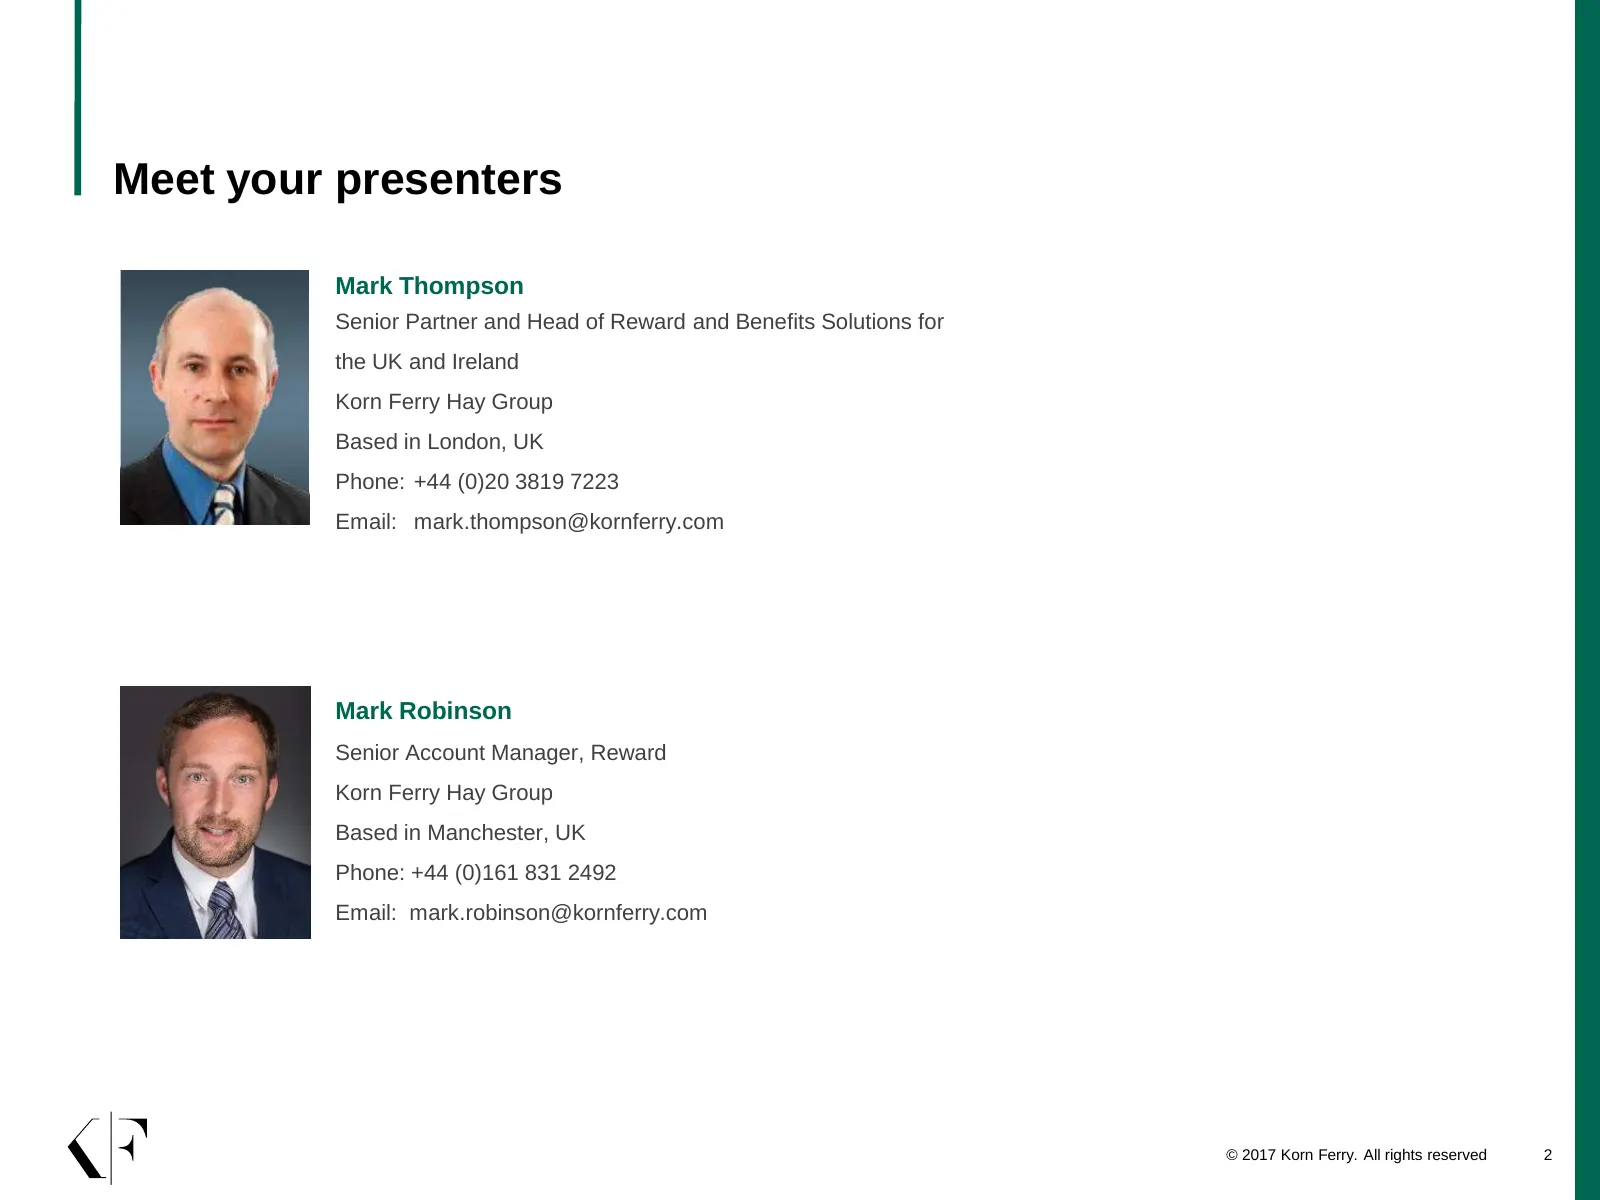
Meet your presenters Mark Thompson Senior Partner and Head of Reward and Benefits Solutions for the UK and Ireland Korn Ferry Hay Group Based in London, UK Phone: +44 (0)20 3819 7223 Email: mark.thompson@kornferry.com Mark Robinson Senior Account Manager, Reward Korn Ferry Hay Group Based in Manches
Slide 3: Agenda
Agenda 1 ABOUT KORN FERRY HAY GROUP 4 2 REWARD IN CONTEXT 7 3 GLOBAL PAY OUTLOOK 14 4 EUROPEAN DATA HEADLINES 21 5 UK DATA IN DETAIL 24 6 UK KEY BUSINESS ISSUES 31 © 2017 Korn Ferry. All rights reserved 3
Slide 4: About Korn Ferry Hay Group
1 About Korn Ferry Hay Group Who we are and what we do
Slide 5: Korn Ferry is the preeminent global people and organizational advisory firm
Korn Ferry is the preeminent global people and organizational advisory firm. We help leaders, organizations and societies succeed by releasing the full power and potential of people. Our nearly 7,000 colleagues deliver services through our Executive Search, Korn Ferry Hay Group and Futurestep divisi
Slide 6: Korn Ferry – a total approach to talent
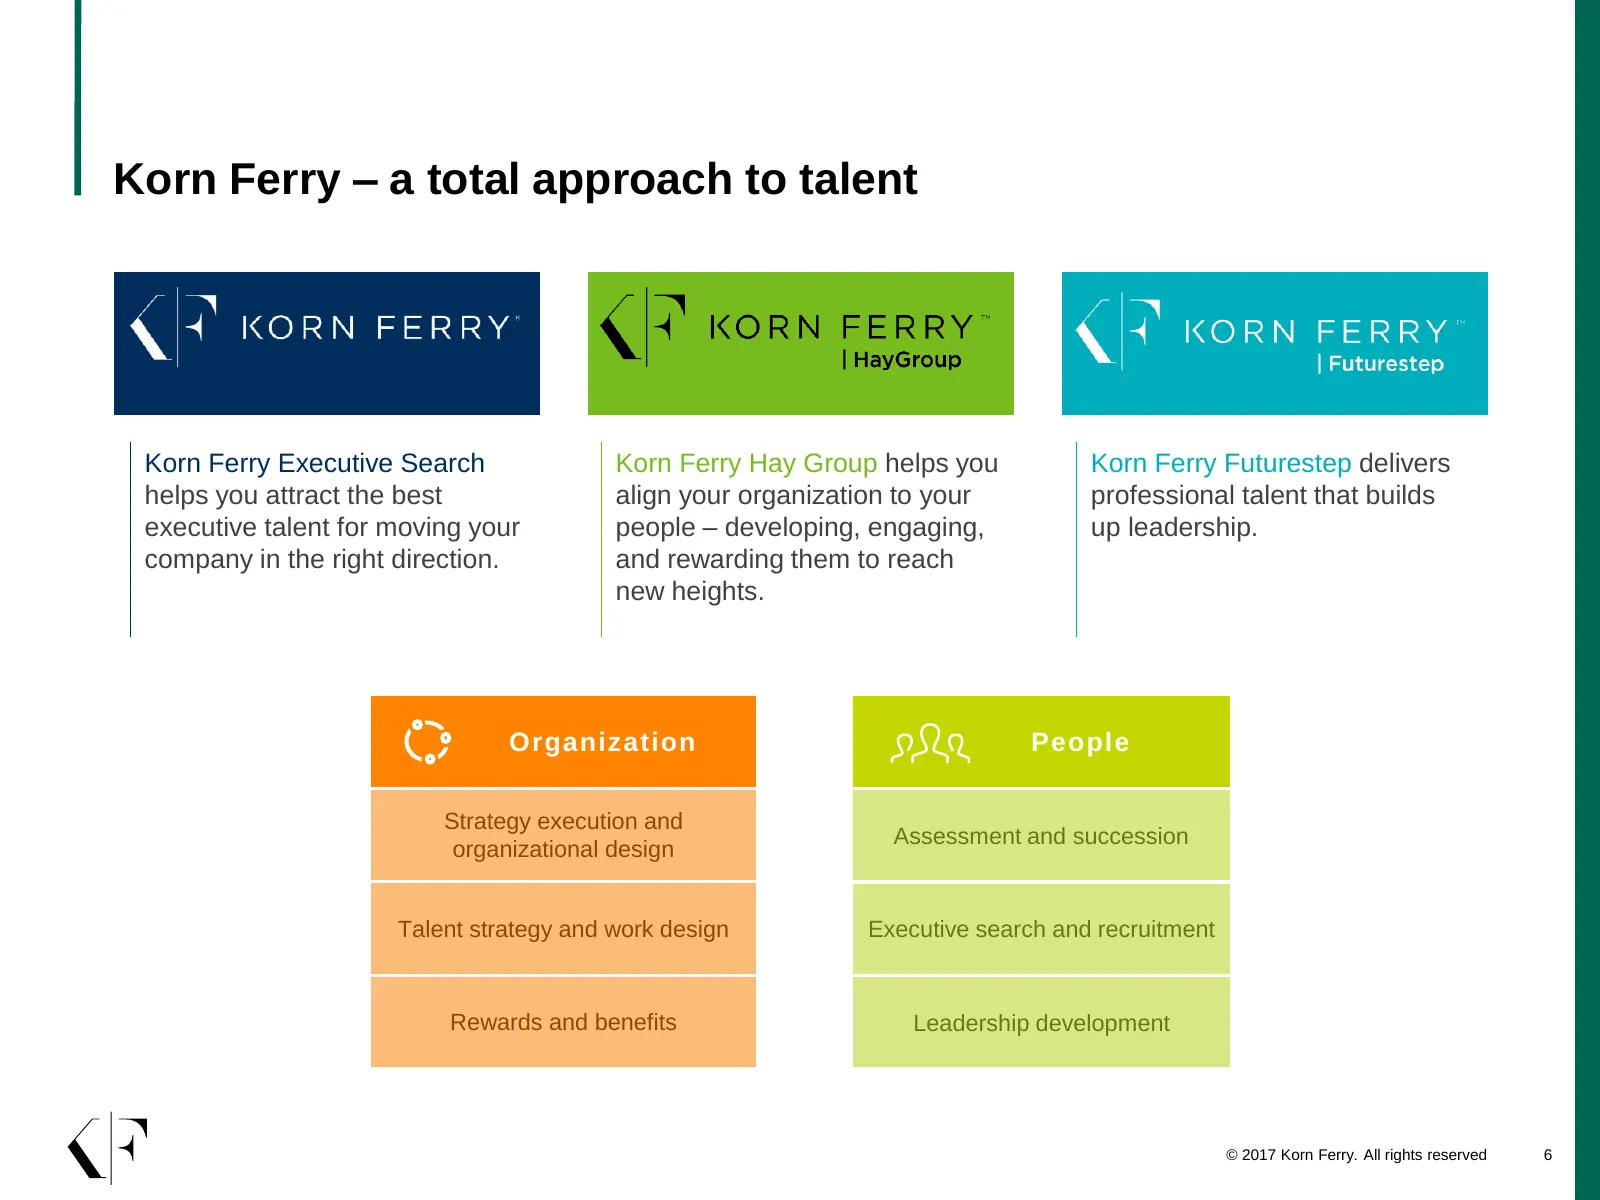
Korn Ferry – a total approach to talent Korn Ferry Executive Search Korn Ferry Hay Group helps you Korn Ferry Futurestep delivers helps you attract the best align your organization to your professional talent that builds executive talent for moving your people – developing, engaging, up leadership.
Slide 7: Reward in context
2 Reward in context
Slide 8: 2030 Megatrends (from Hay Group Leadership 2030)
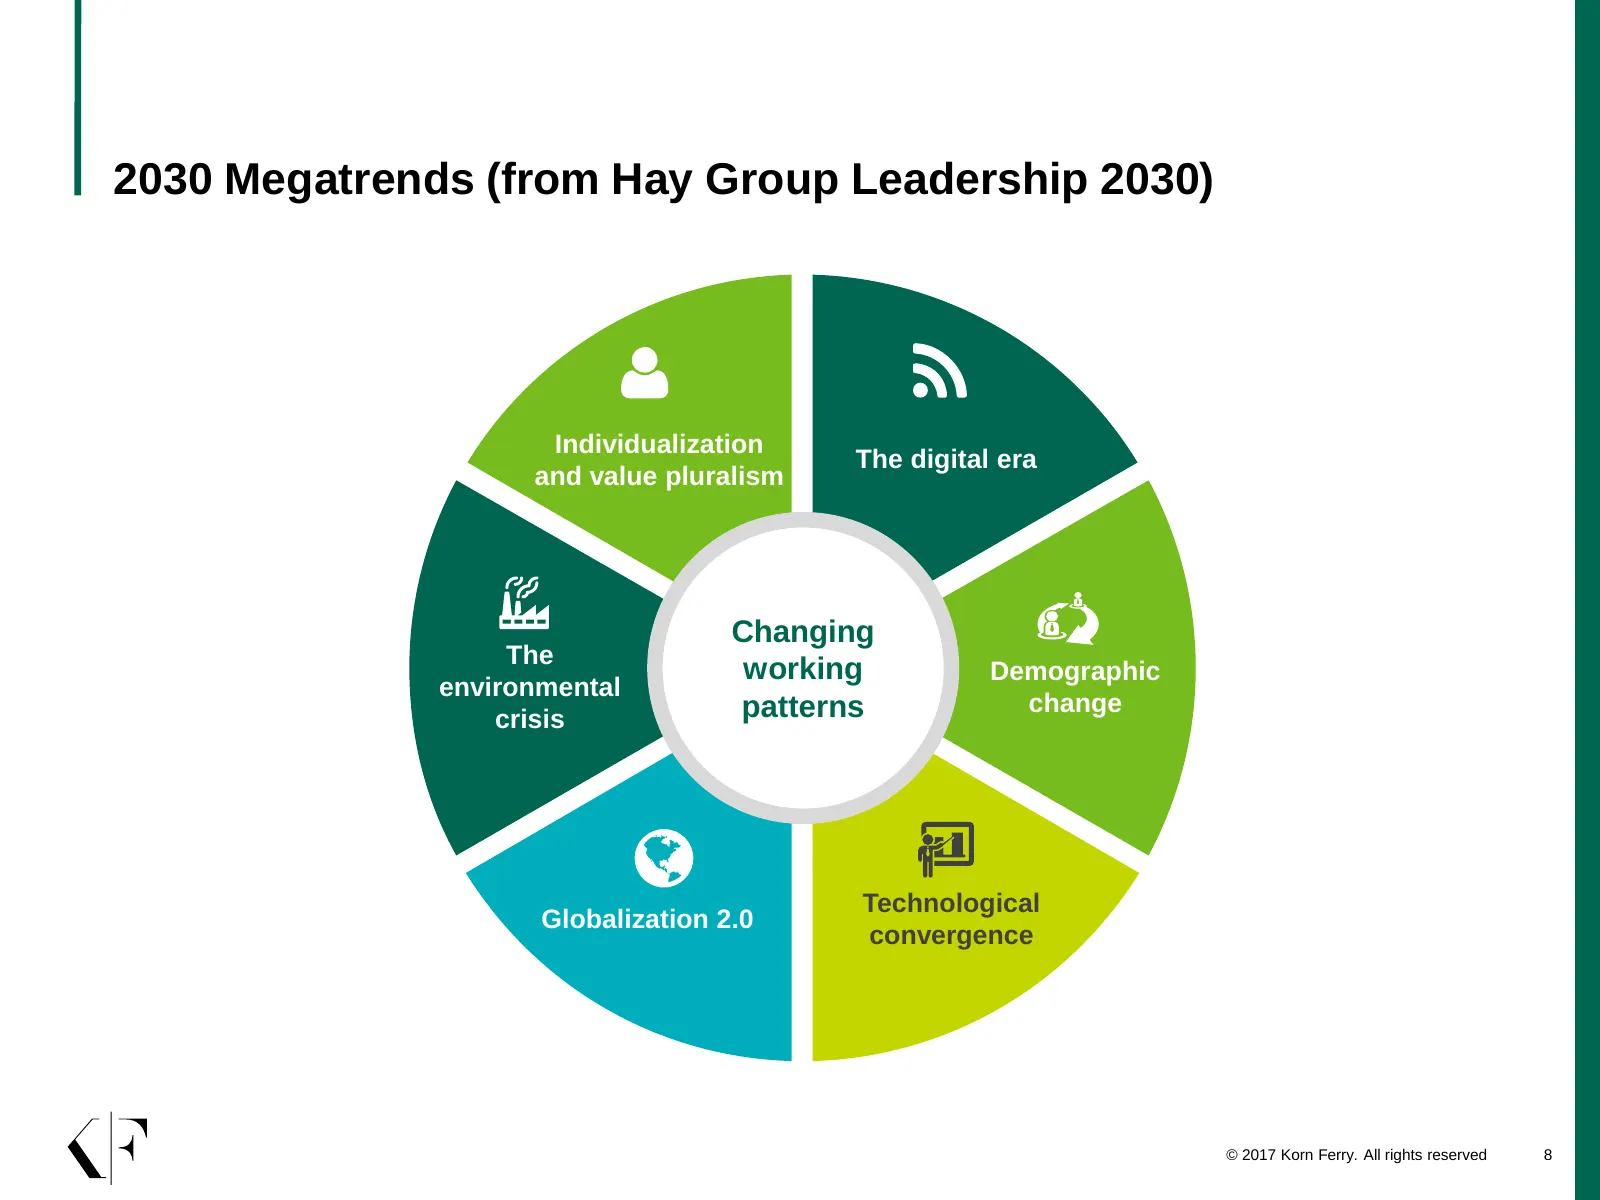
2030 Megatrends (from Hay Group Leadership 2030) Individualization The digital era and value pluralism Changing The working Demographic environmental patterns change crisis Technological Globalization 2.0 convergence © 2017 Korn Ferry. All rights reserved 8
Slide 9: What CEOs are concerned about – 'hot button' issues
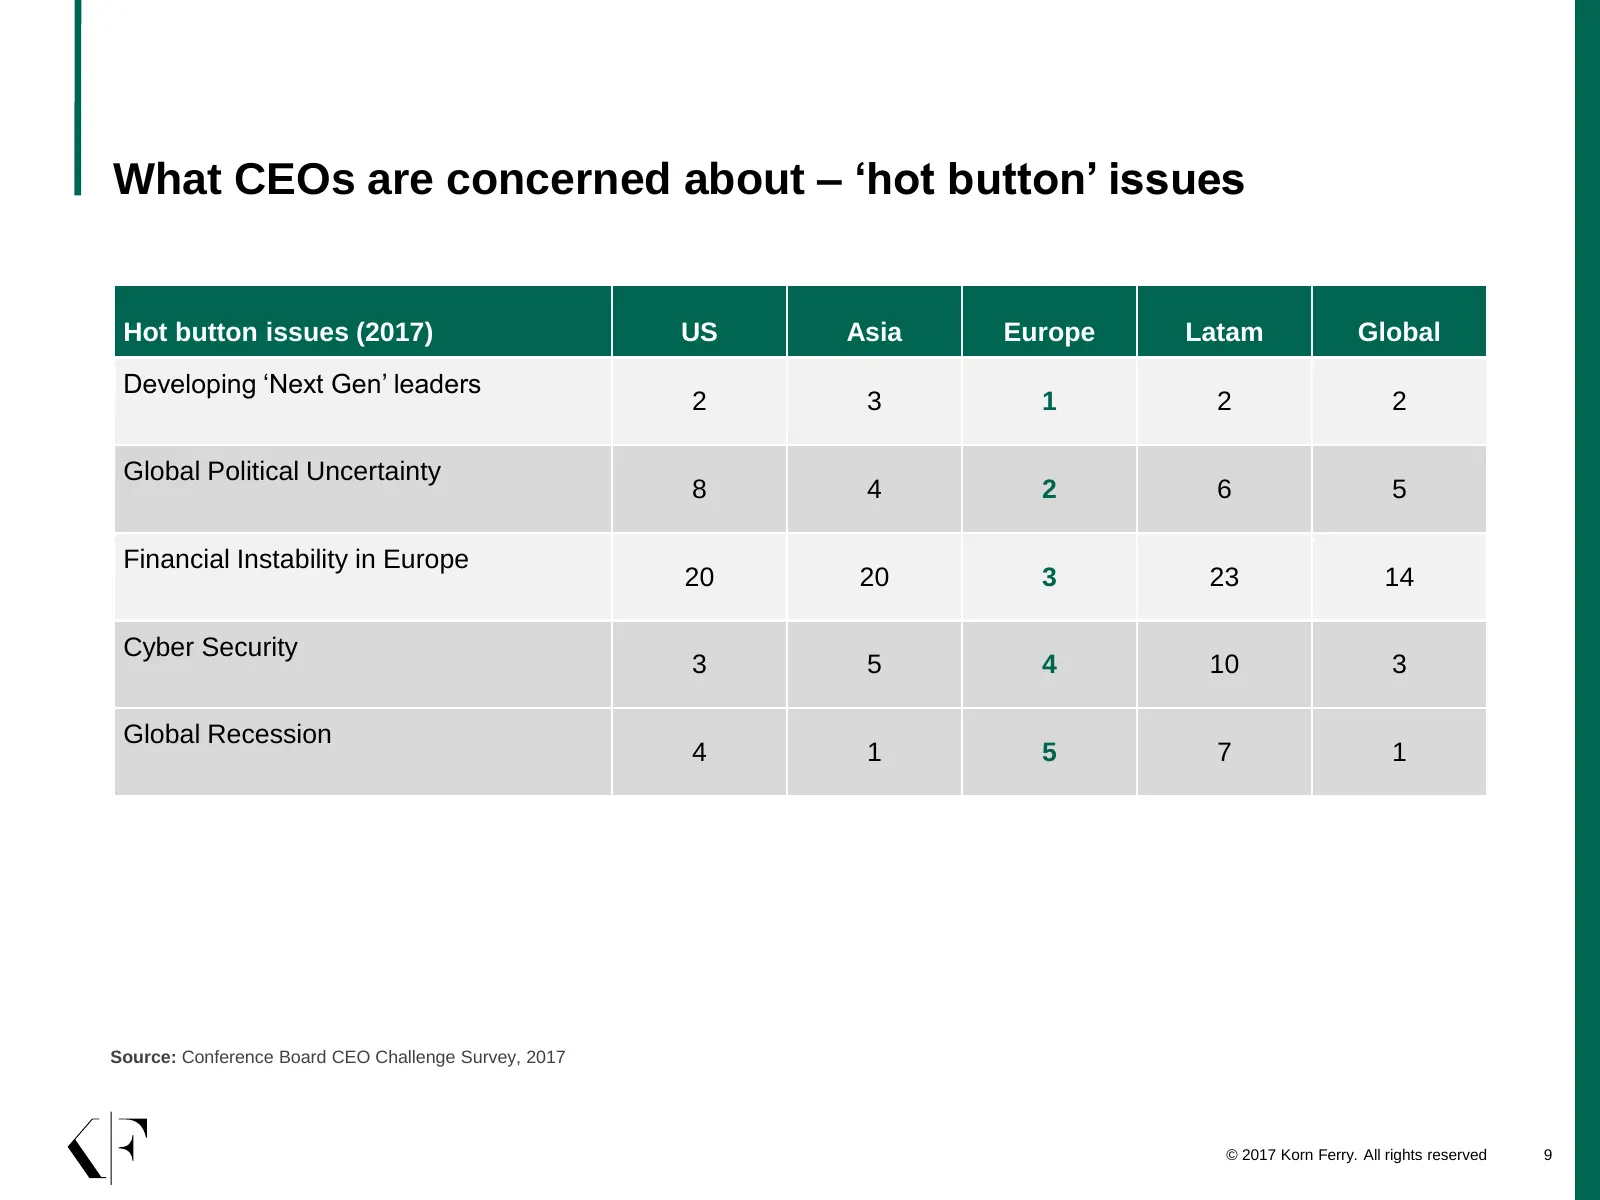
What CEOs are concerned about – ‘hot button’ issues Hot button issues (2017) US Asia Europe Latam Global Developing ‘Next Gen’ leaders 2 3 1 2 2 Global Political Uncertainty 8 4 2 6 5 Financial Instability in Europe 20 20 3 23 14 Cyber Security 3 5 4 10 3 Global Recession 4 1 5 7 1 Source: Conferenc
Slide 10: What CEOs are concerned about – human capital strategies
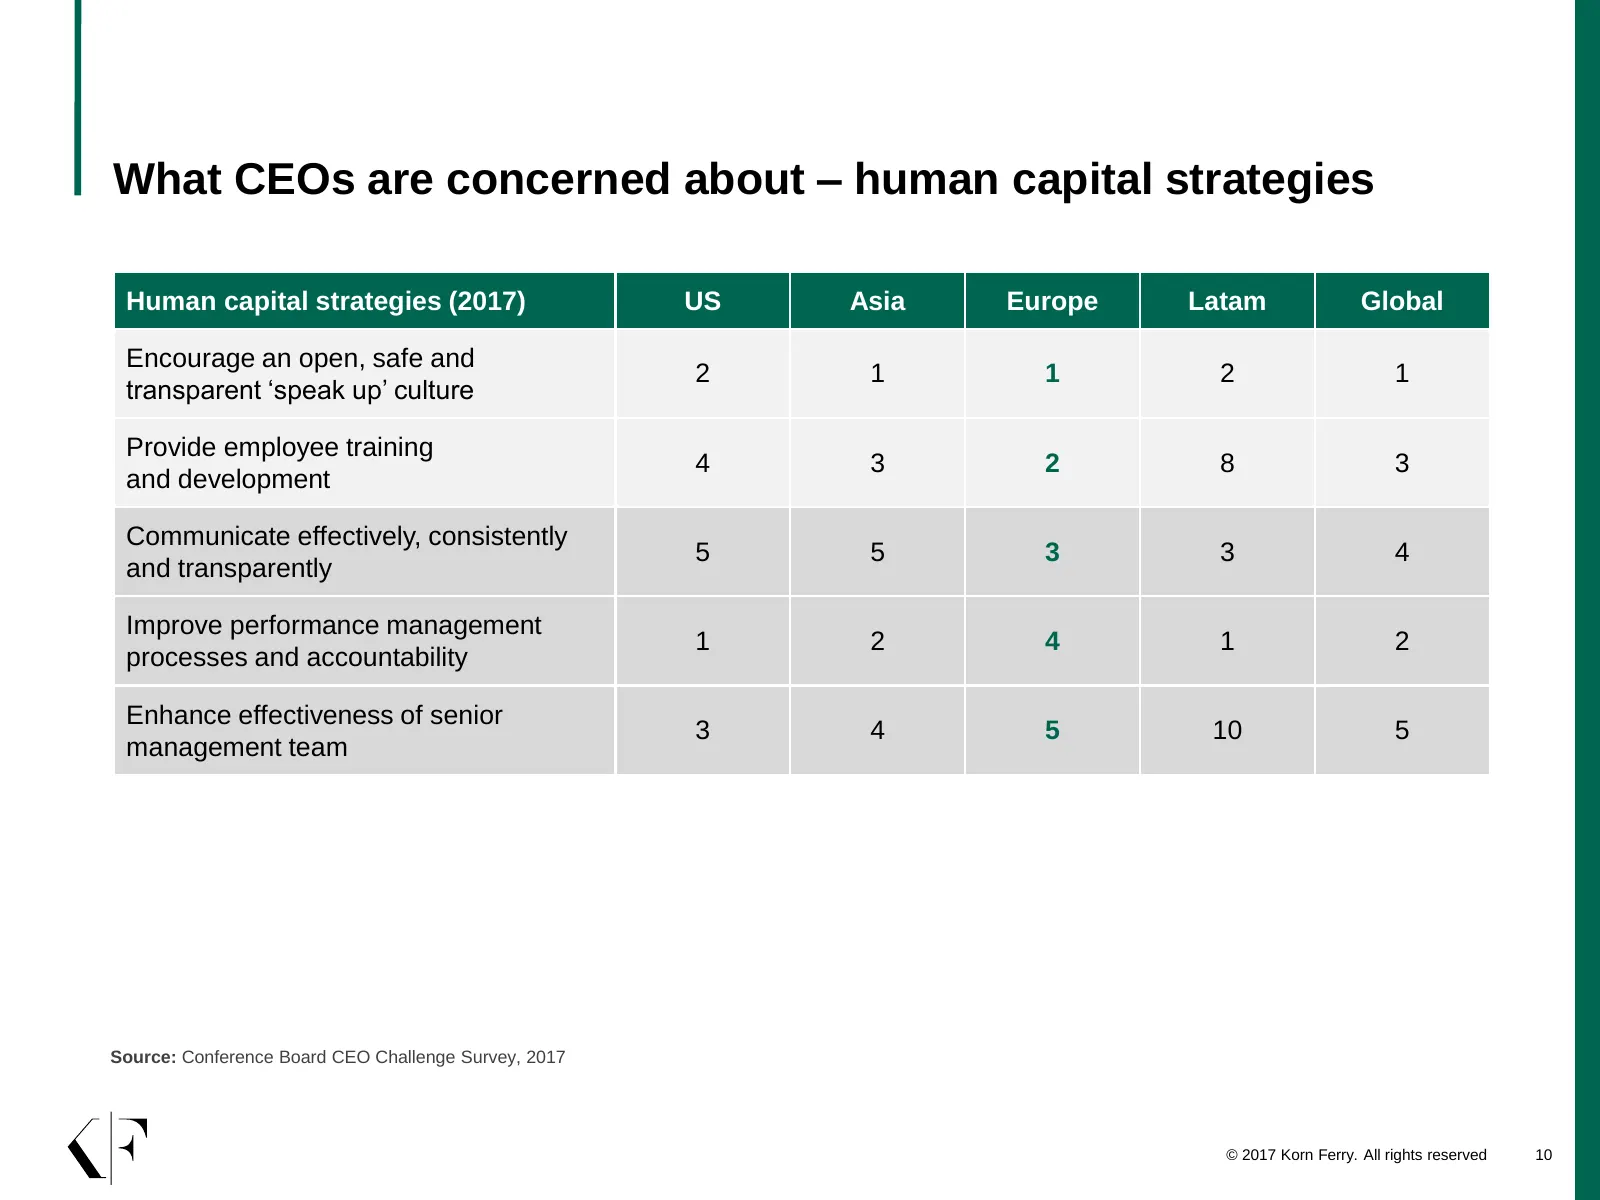
What CEOs are concerned about – human capital strategies Human capital strategies (2017) US Asia Europe Latam Global Encourage an open, safe and 2 1 1 2 1 transparent ‘speak up’ culture Provide employee training 4 3 2 8 3 and development Communicate effectively, consistently 5 5 3 3 4 and transparen
Slide 11: UK context – headlines
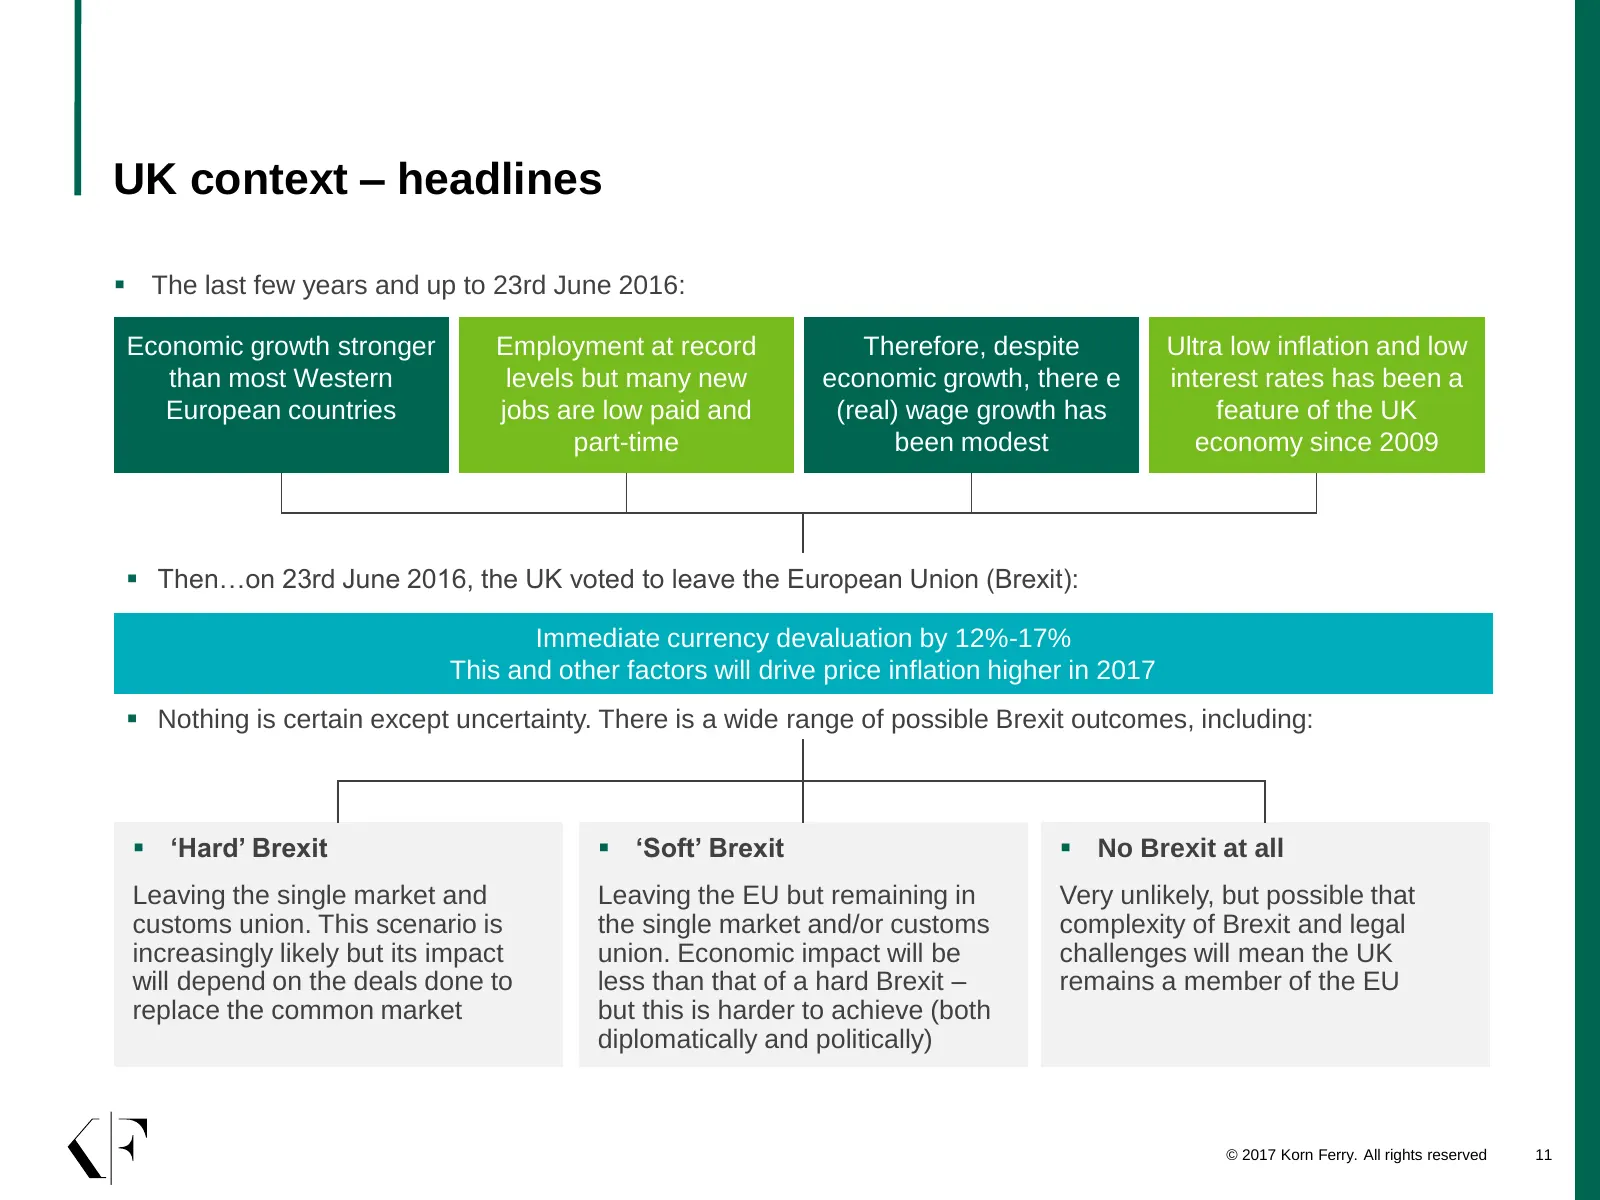
UK context – headlines The last few years and up to 23rd June 2016: Economic growth stronger Employment at record Therefore, despite Ultra low inflation and low than most Western levels but many new economic growth, there e interest rates has been a European countries jobs are low paid and (real)
Slide 12: UK context – talent management
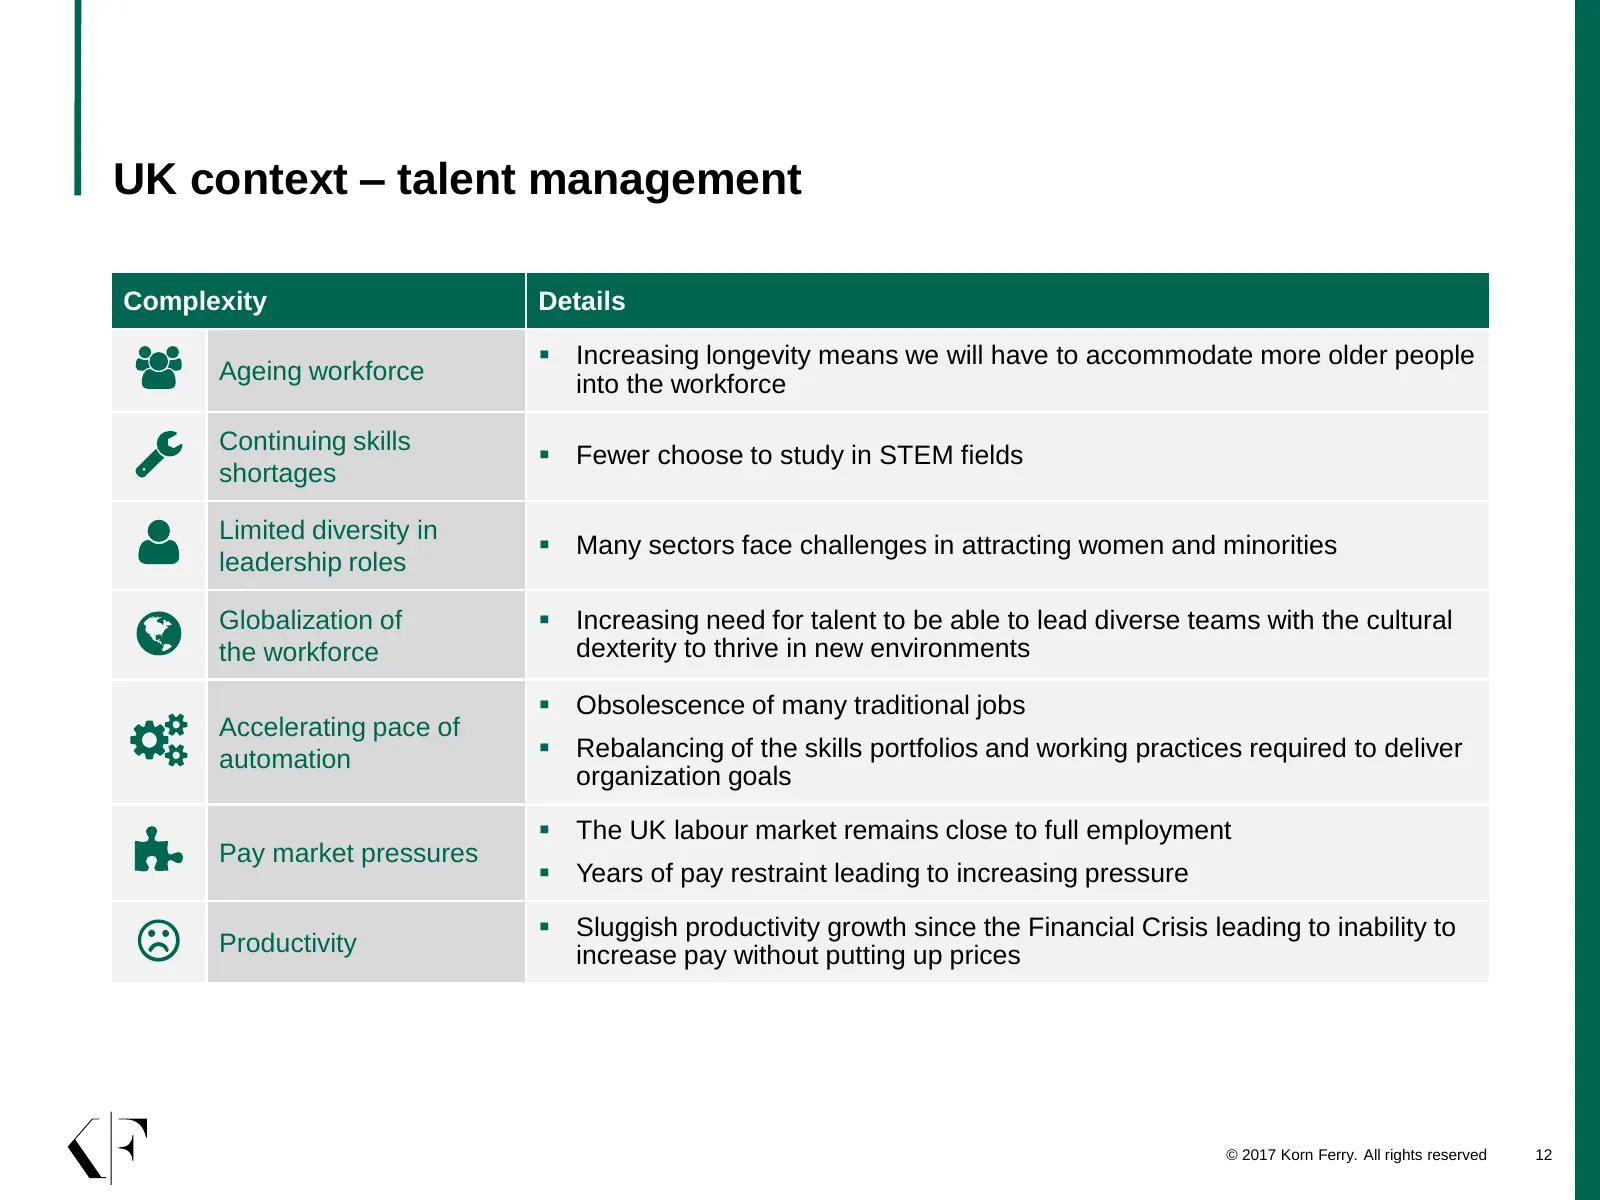
UK context – talent management Complexity Details Increasing longevity means we will have to accommodate more older people Ageing workforce into the workforce Continuing skills Fewer choose to study in STEM fields shortages Limited diversity in Many sectors face challenges in attracting women
Slide 13: UK recruitment challenges
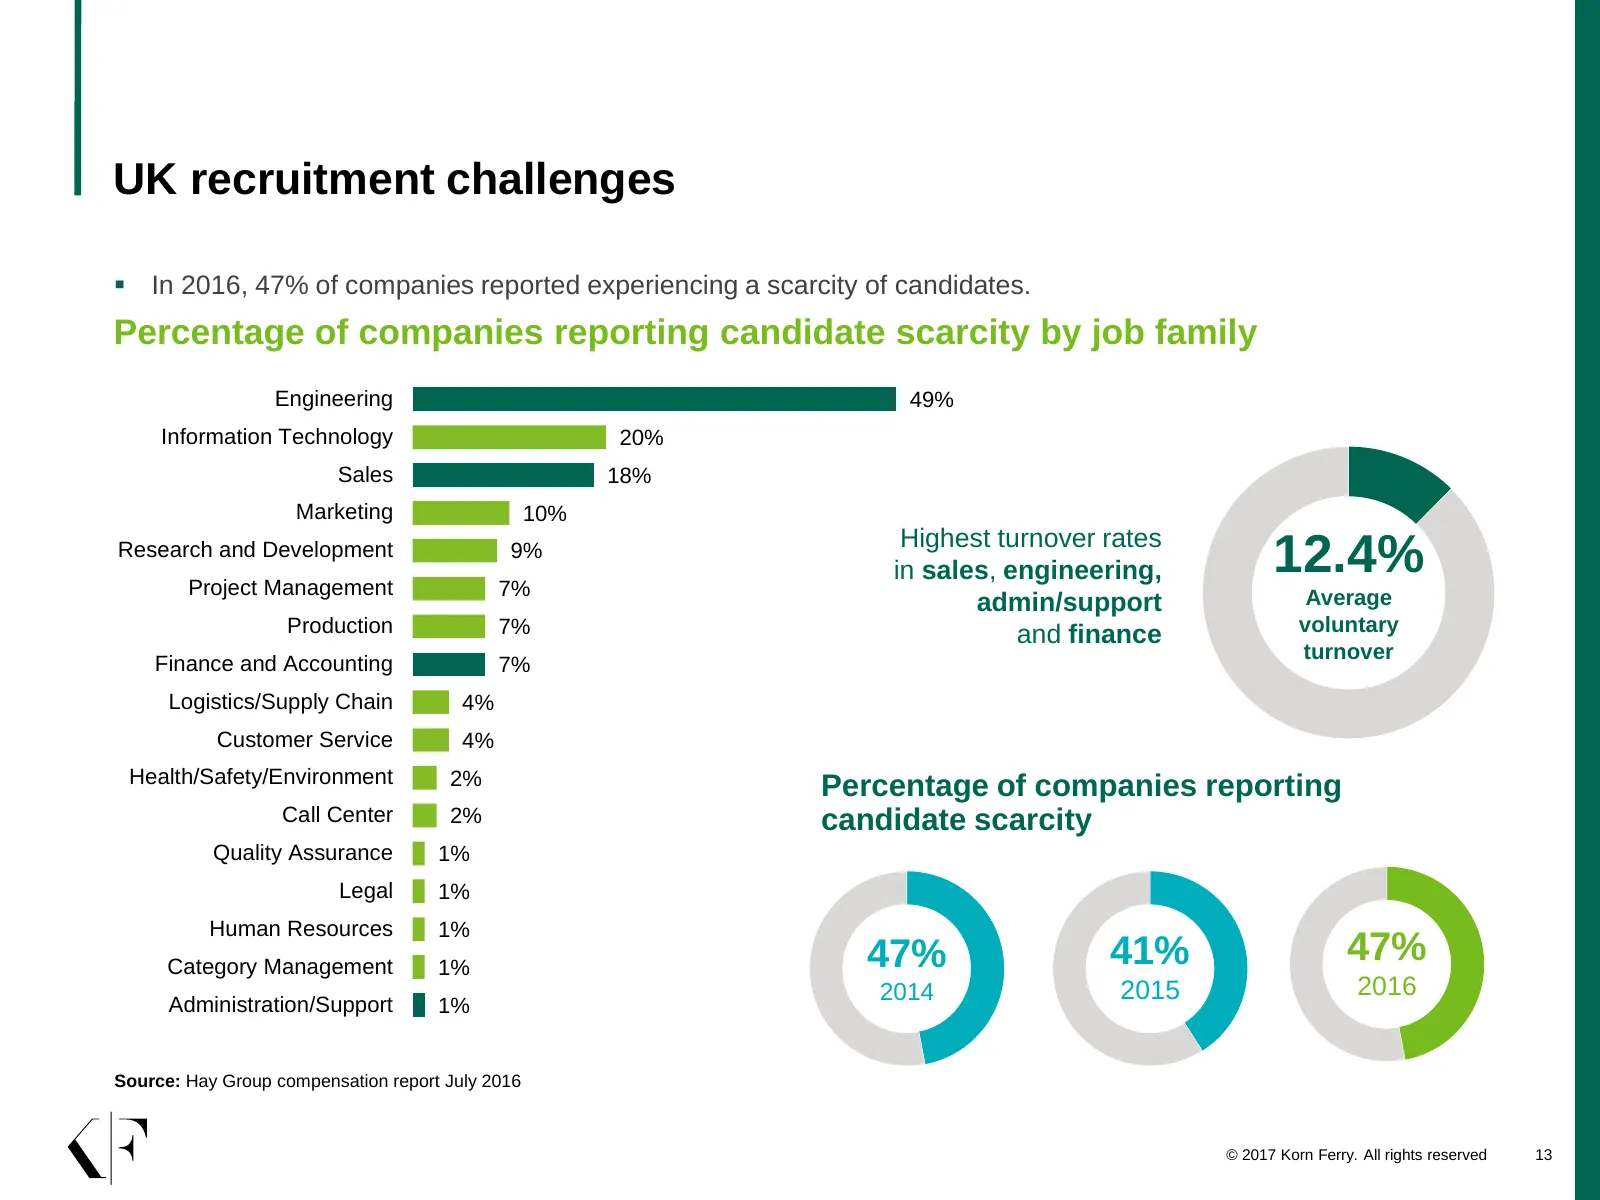
UK recruitment challenges In 2016, 47% of companies reported experiencing a scarcity of candidates. Percentage of companies reporting candidate scarcity by job family Engineering 49% Information Technology 20% Sales 18% Marketing 10% Highest turnover rates Research and Development Project Manageme
Slide 14: Global pay outlook
3 Global pay outlook Salary trends and predictions for 2017
Slide 15: Our pay data – key figures
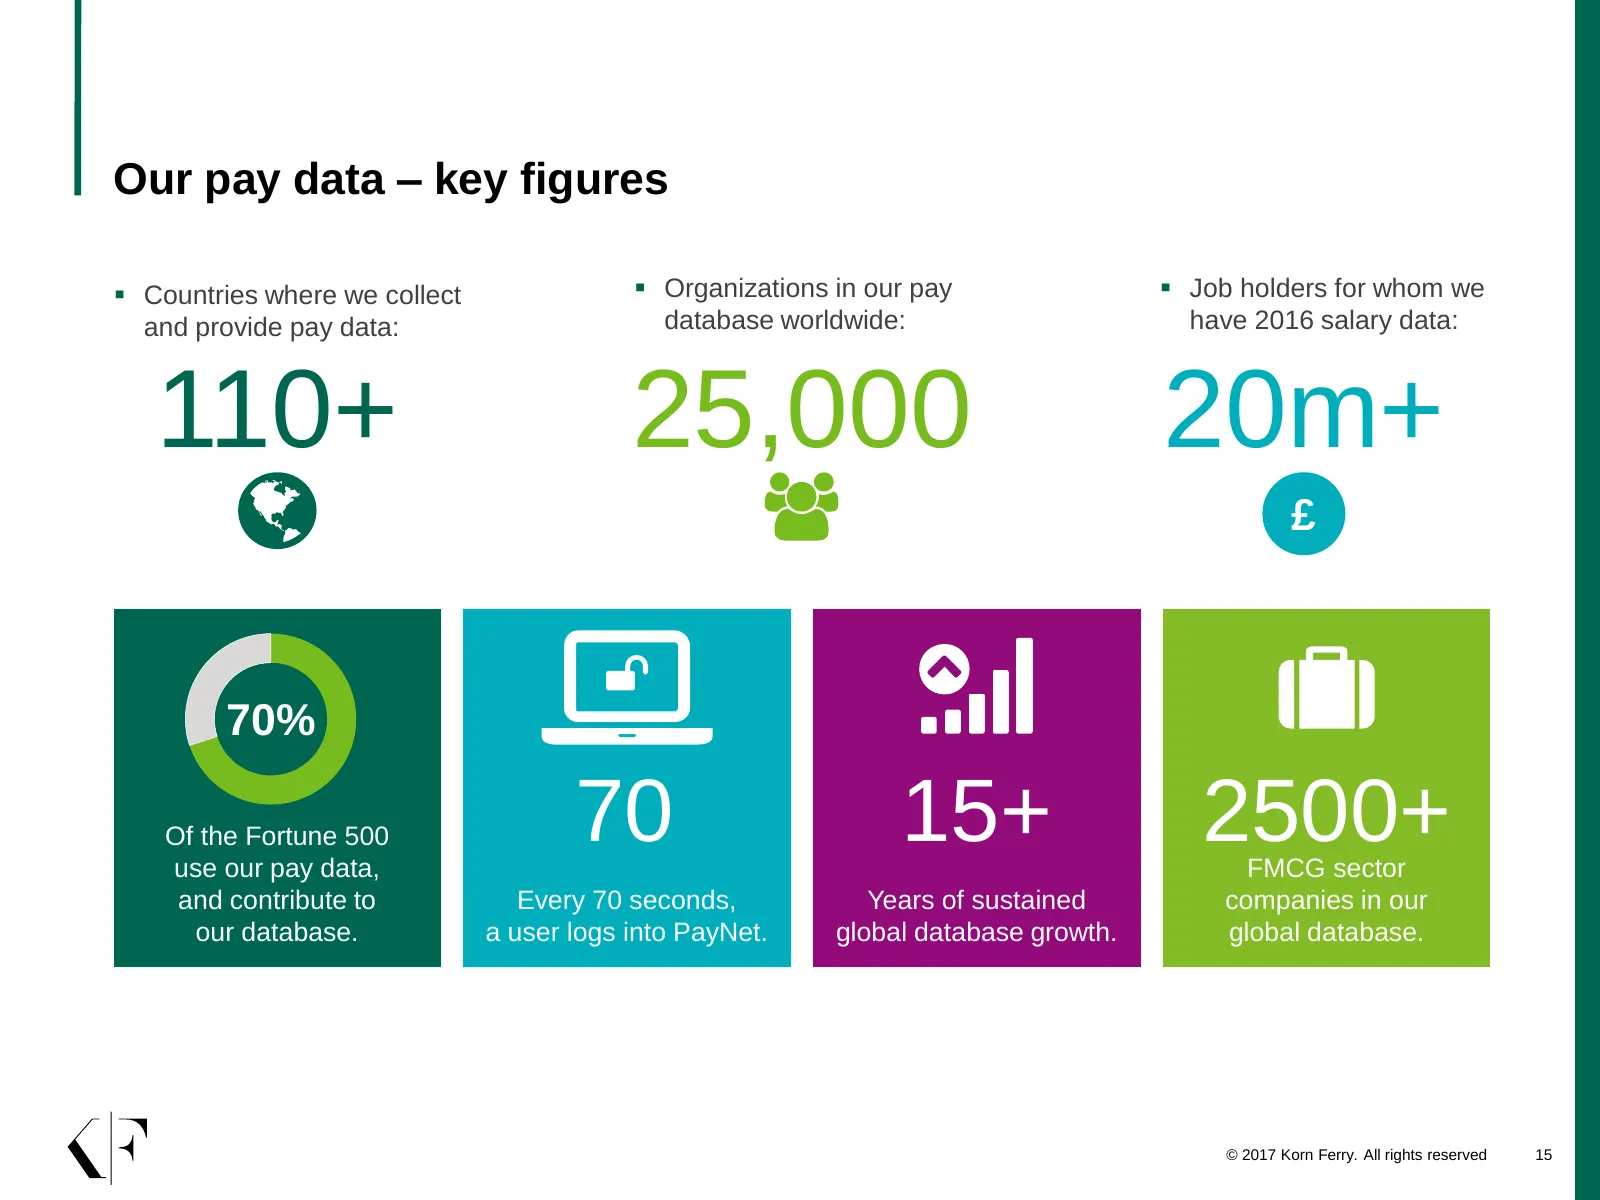
Our pay data – key figures Countries where we collect Organizations in our pay Job holders for whom we and provide pay data: database worldwide: have 2016 salary data: 110+ 25,000 20m+ £ 70% Of the Fortune 500 use our pay data, 70 15+ 2500+ FMCG sector and contribute to Every 70 seconds, Years
Slide 16: Where do we have data?
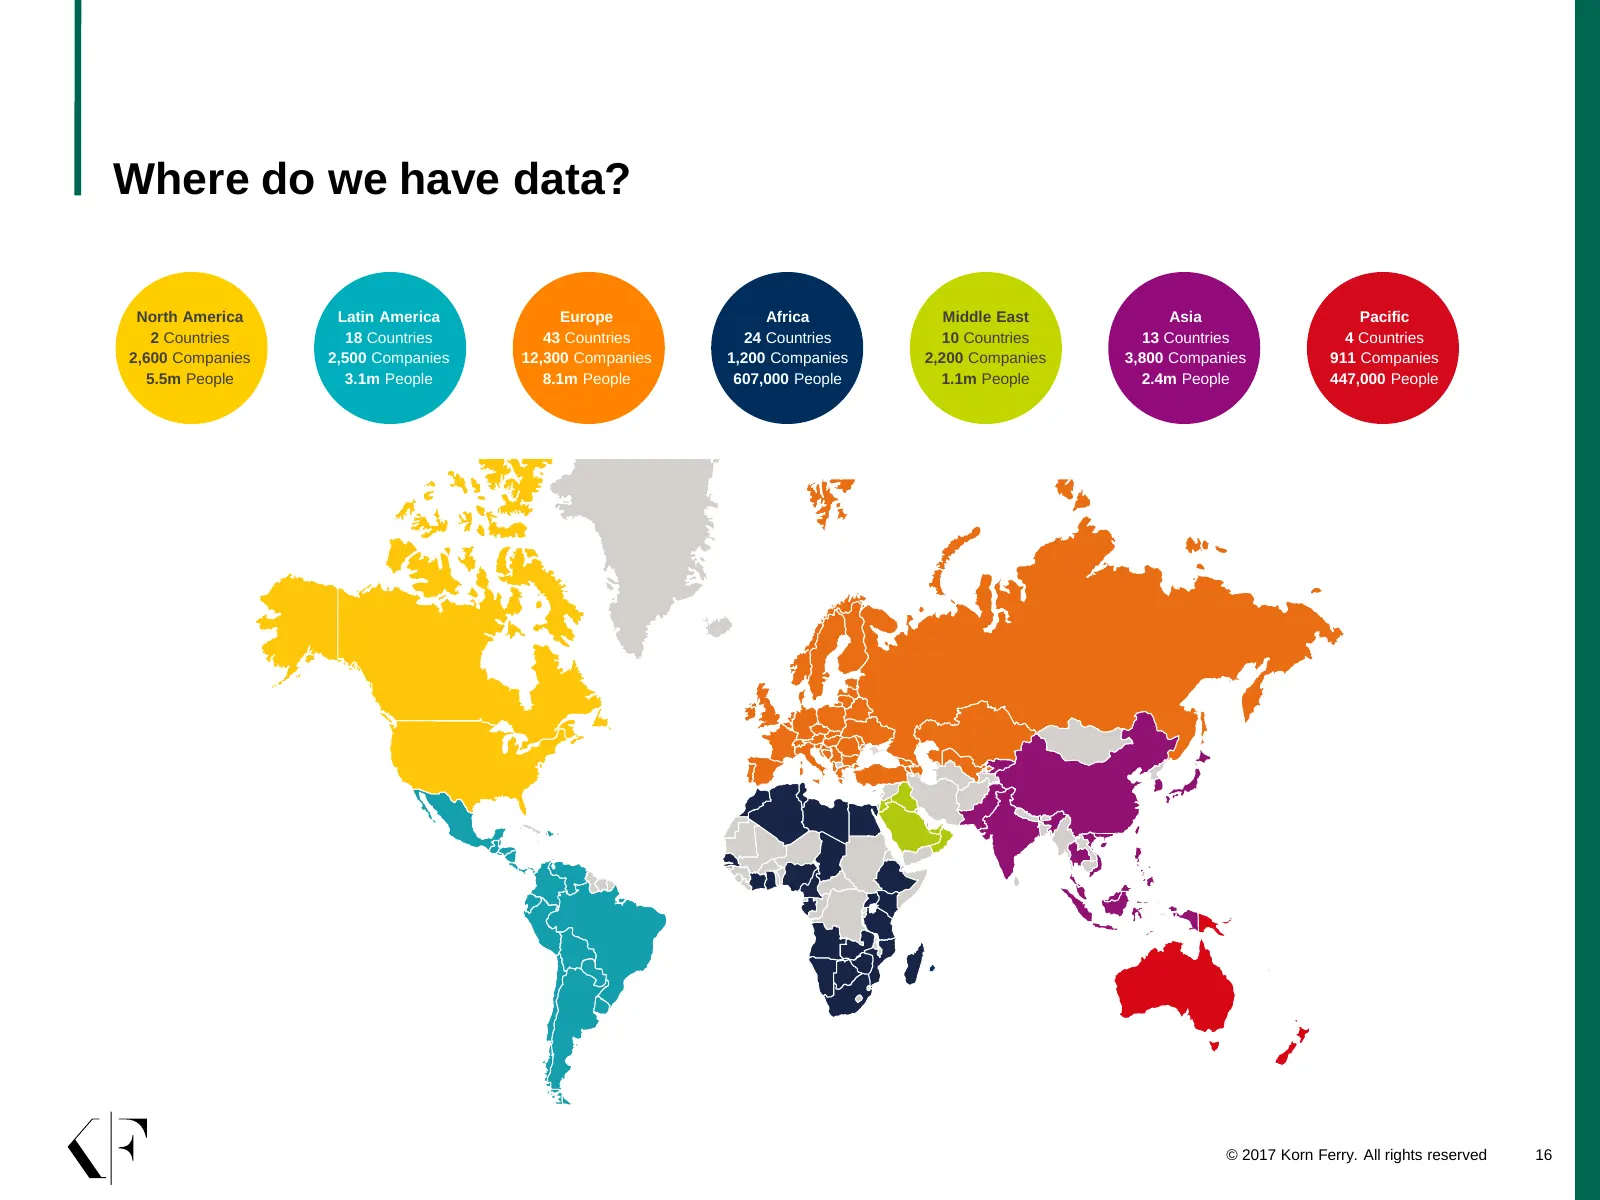
Where do we have data? North America Latin America Europe Africa Middle East Asia Pacific 2 Countries 18 Countries 43 Countries 24 Countries 10 Countries 13 Countries 4 Countries 2,600 Companies 2,500 Companies 12,300 Companies 1,200 Companies 2,200 Companies 3,800 Companies 911 Companies 5.5m Peopl
Slide 17: Global outlook: salary trends and predictions for 2017
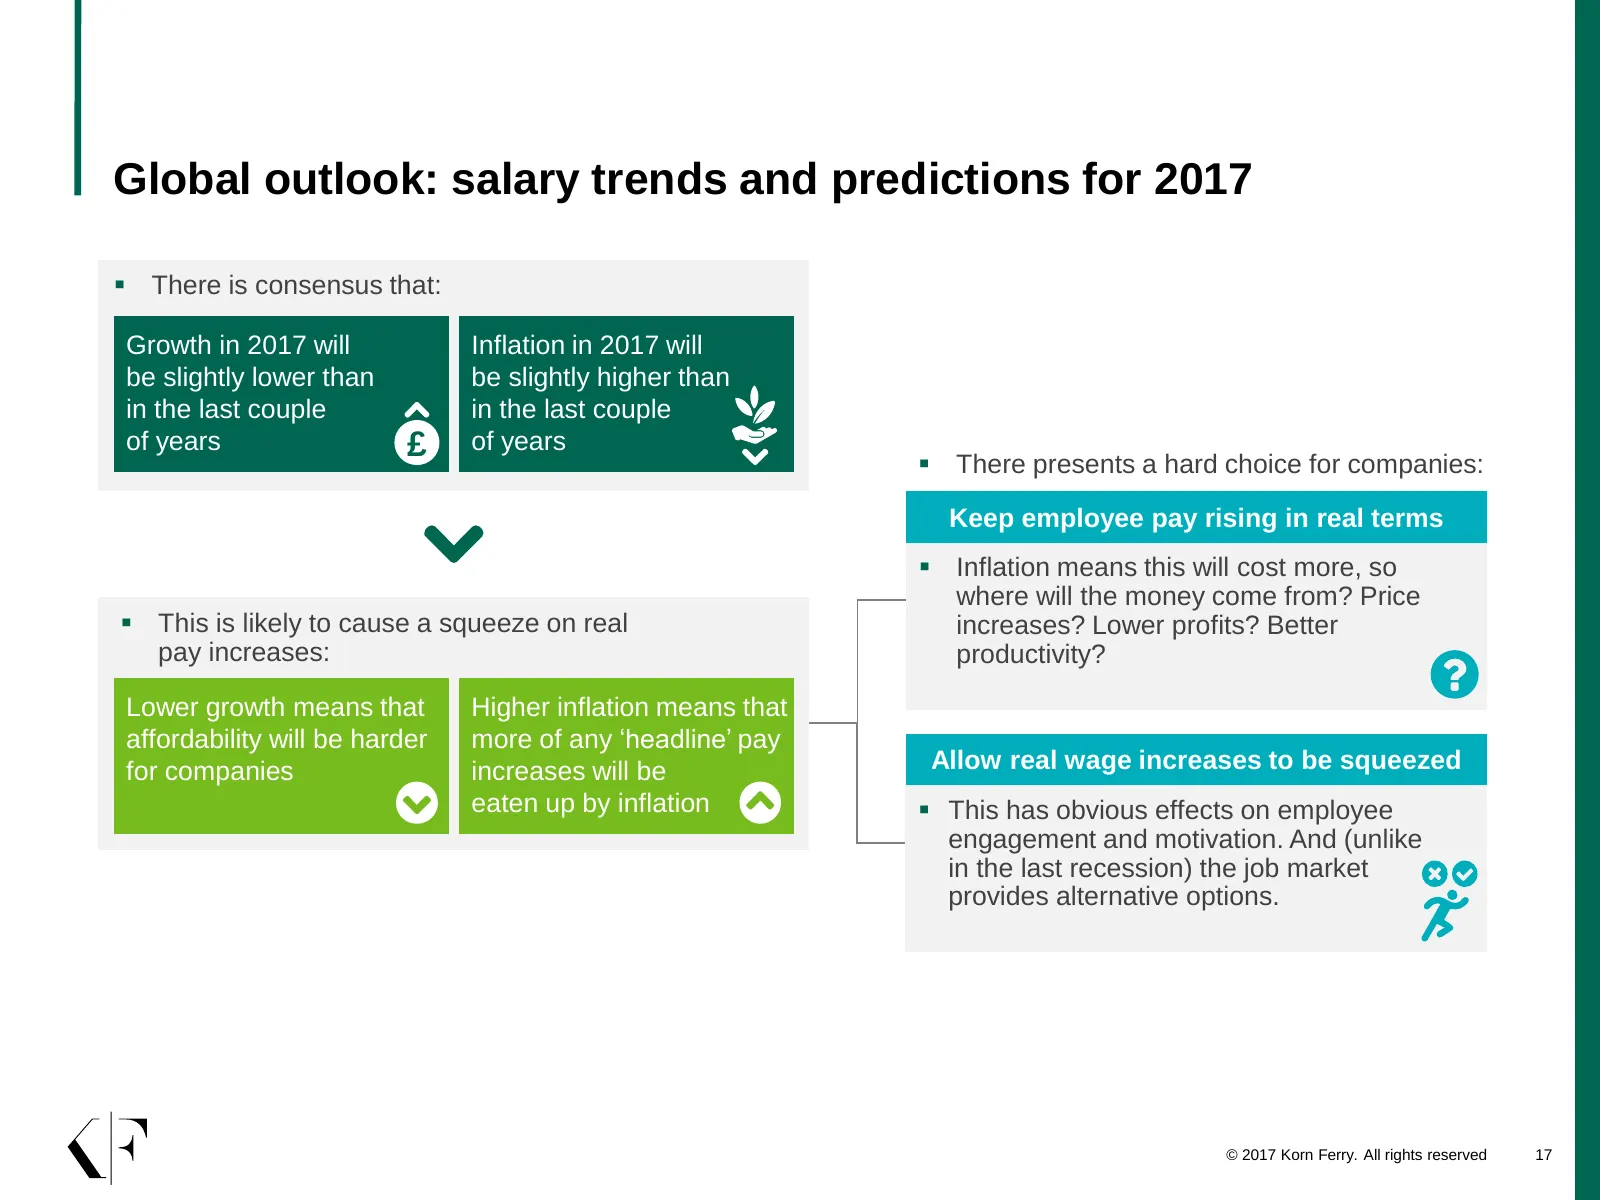
Global outlook: salary trends and predictions for 2017 There is consensus that: Growth in 2017 will Inflation in 2017 will be slightly lower than be slightly higher than in the last couple in the last couple of years £ of years There presents a hard choice for companies: Keep employee pay rising
Slide 18: Global outlook – salary trends and predictions for 2017
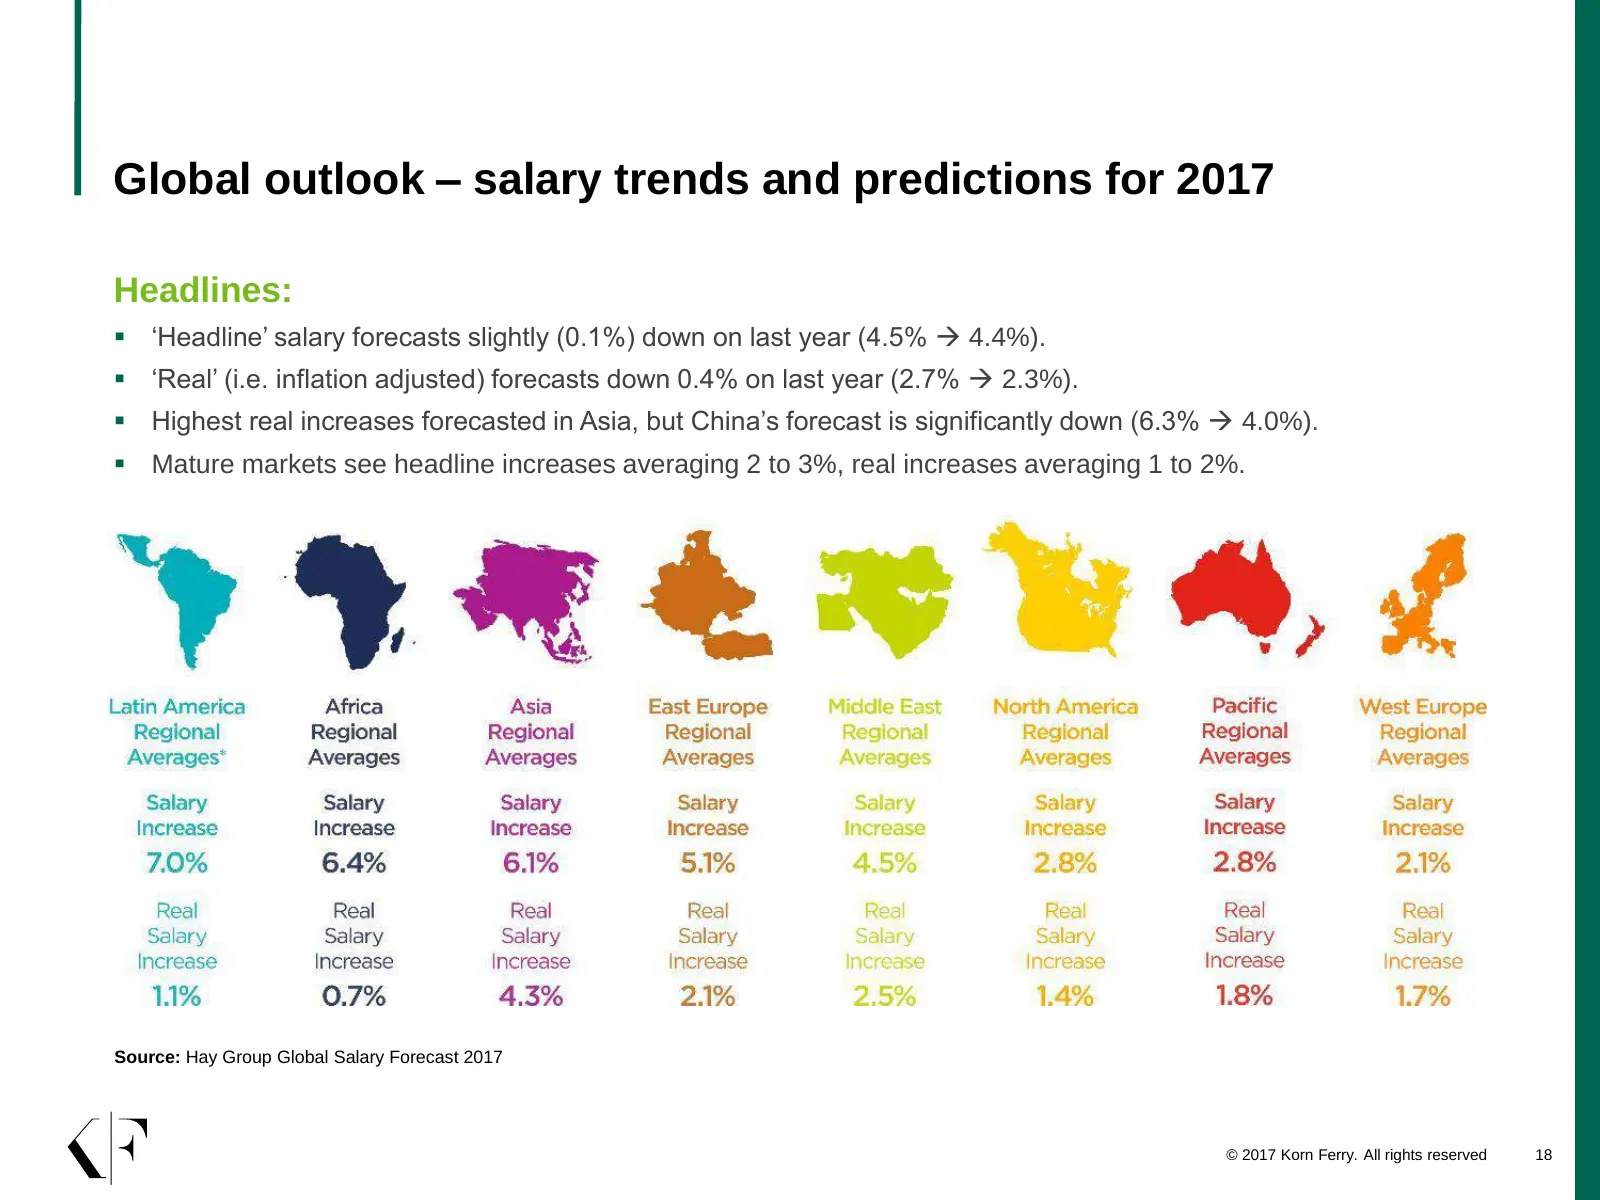
Global outlook – salary trends and predictions for 2017 Headlines: ‘Headline’ salary forecasts slightly (0.1%) down on last year (4.5% 4.4%). ‘Real’ (i.e. inflation adjusted) forecasts down 0.4% on last year (2.7% 2.3%). Highest real increases forecasted in Asia, but China’s forecast is si
Slide 19: Global outlook – salary trends and predictions for 2017
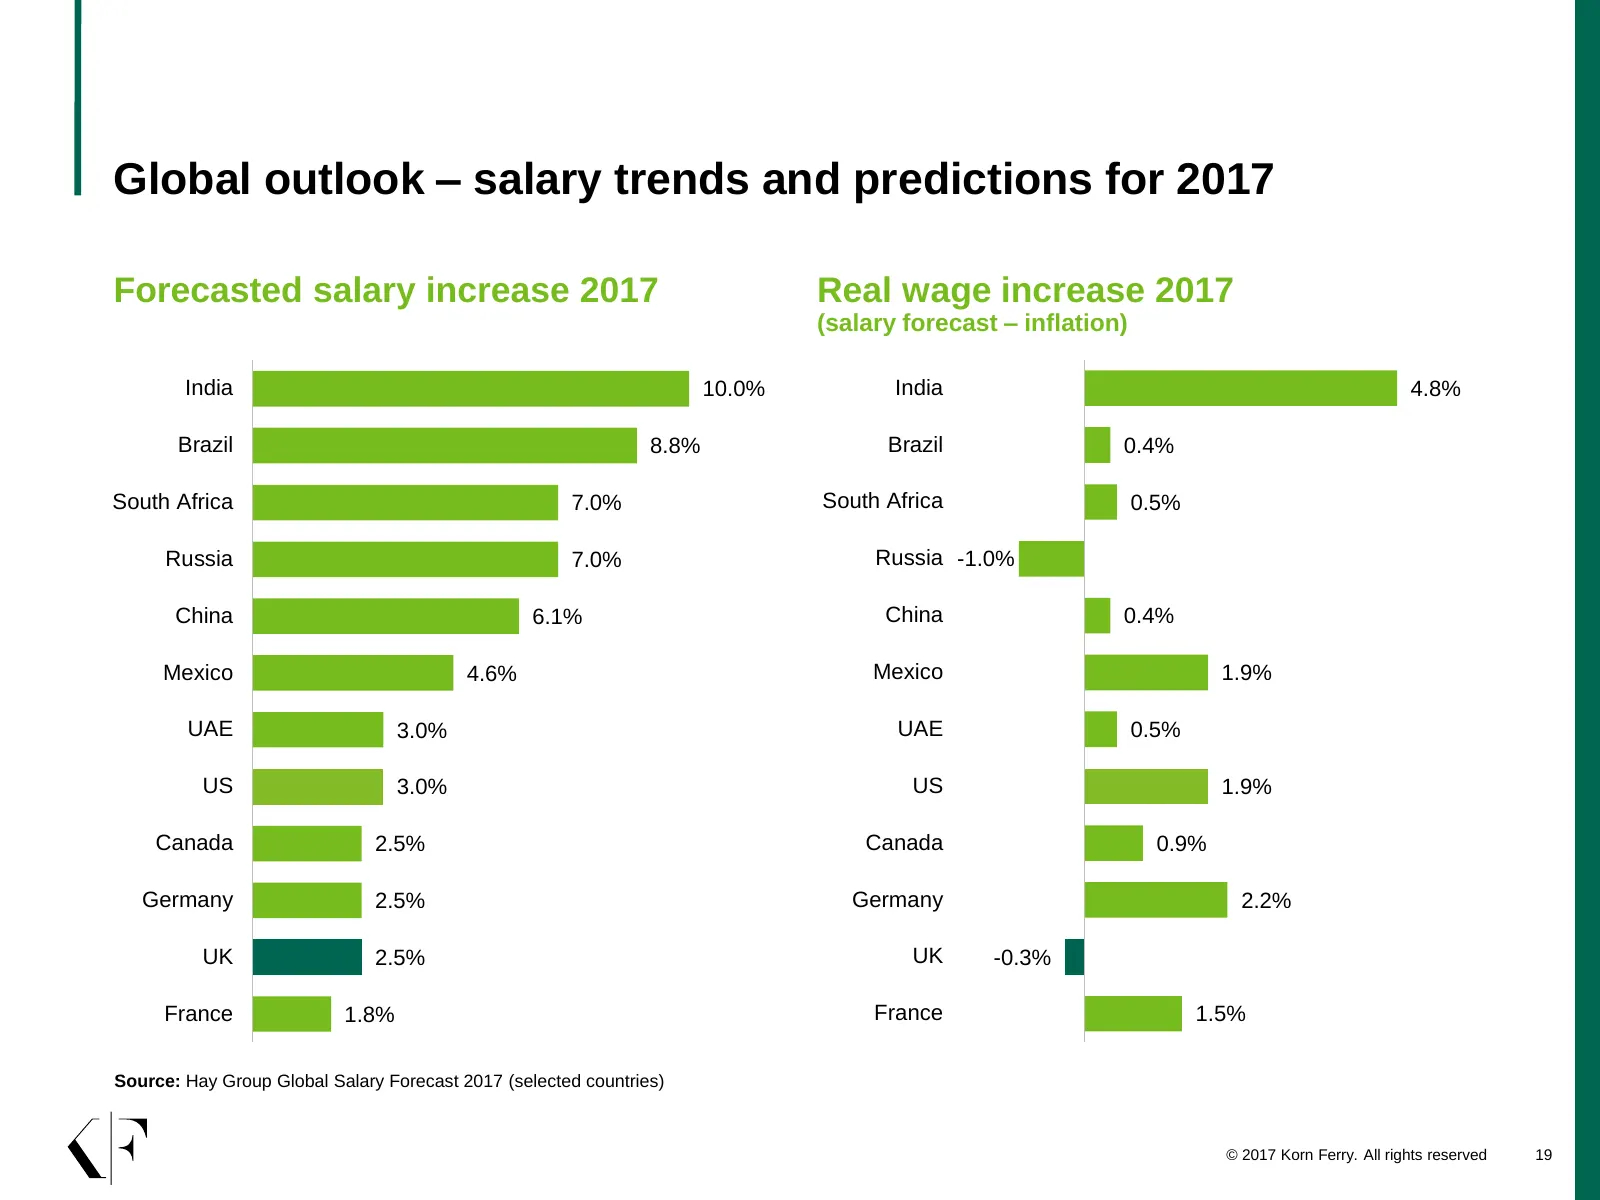
Global outlook – salary trends and predictions for 2017 Forecasted salary increase 2017 Real wage increase 2017 (salary forecast – inflation) India 10.0% India 4.8% Brazil 8.8% Brazil 0.4% South Africa 7.0% South Africa 0.5% Russia 7.0% Russia -1.0% China 6.1% China 0.4% Mexico 4.6% Mexico 1.9% UAE
Slide 20: How sectors are currently performing globally
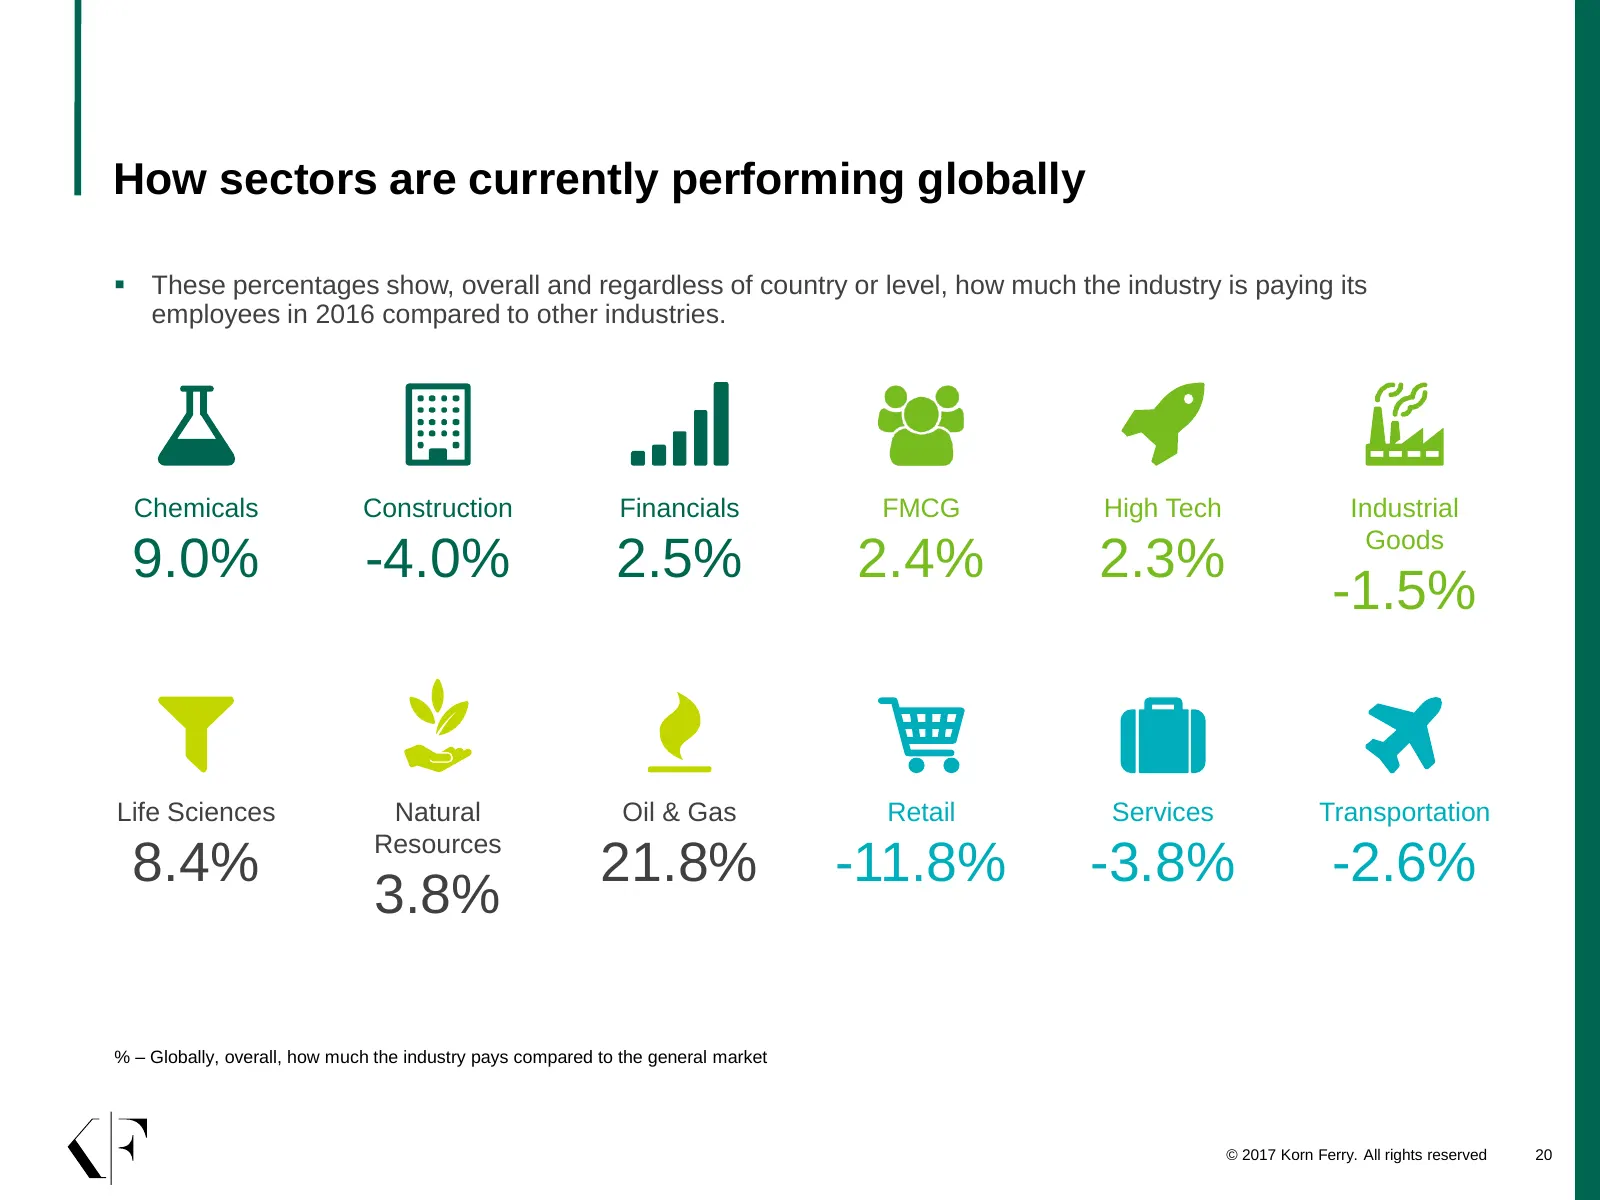
How sectors are currently performing globally These percentages show, overall and regardless of country or level, how much the industry is paying its employees in 2016 compared to other industries. Chemicals Construction Financials FMCG High Tech Industrial Goods 9.0% -4.0% 2.5% 2.4% 2.3% -1.5% Li
Slide 21: European data headlines
4 European data headlines
Slide 22: European salary forecast 2017
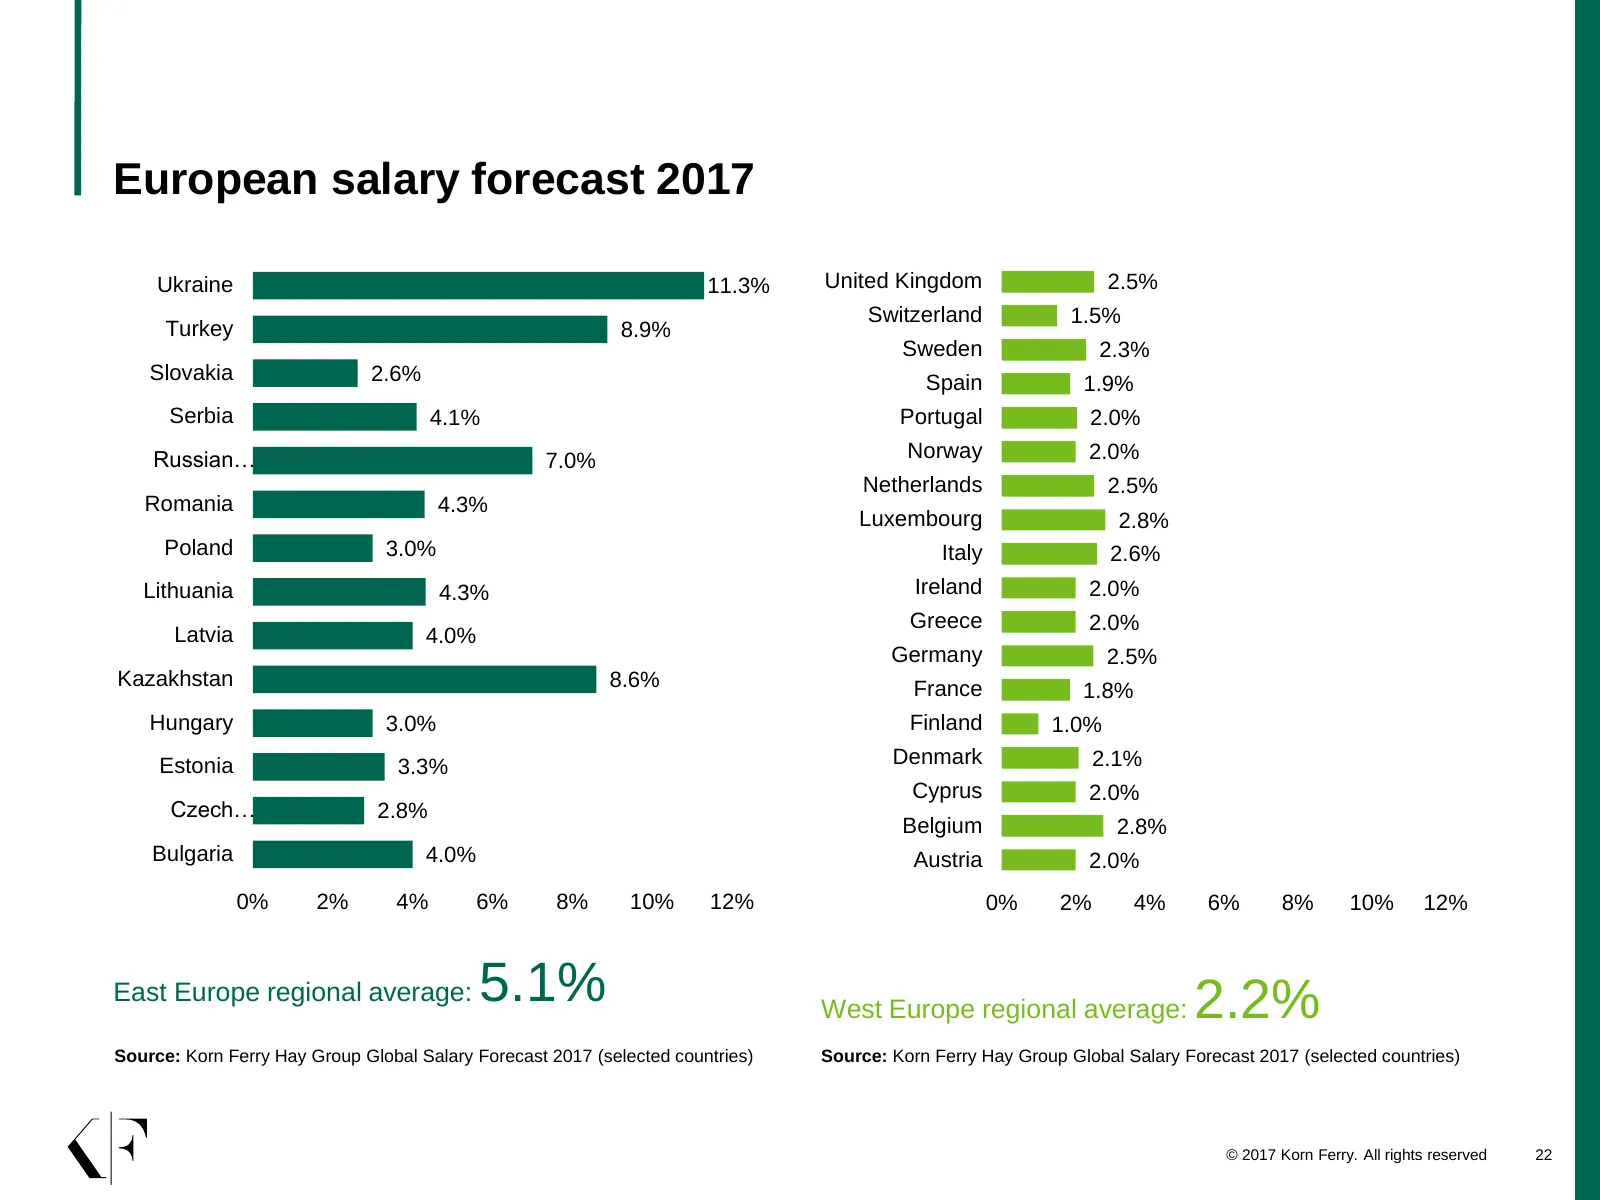
European salary forecast 2017 Ukraine 11.3% United Kingdom 2.5% Switzerland 1.5% Turkey 8.9% Sweden 2.3% Slovakia 2.6% Spain 1.9% Serbia 4.1% Portugal 2.0% Russian… 7.0% Norway 2.0% Netherlands 2.5% Romania 4.3% Luxembourg 2.8% Poland 3.0% Italy 2.6% Lithuania 4.3% Ireland 2.0% Greece 2.0% Latvia 4.
Slide 23: European salary comparisons
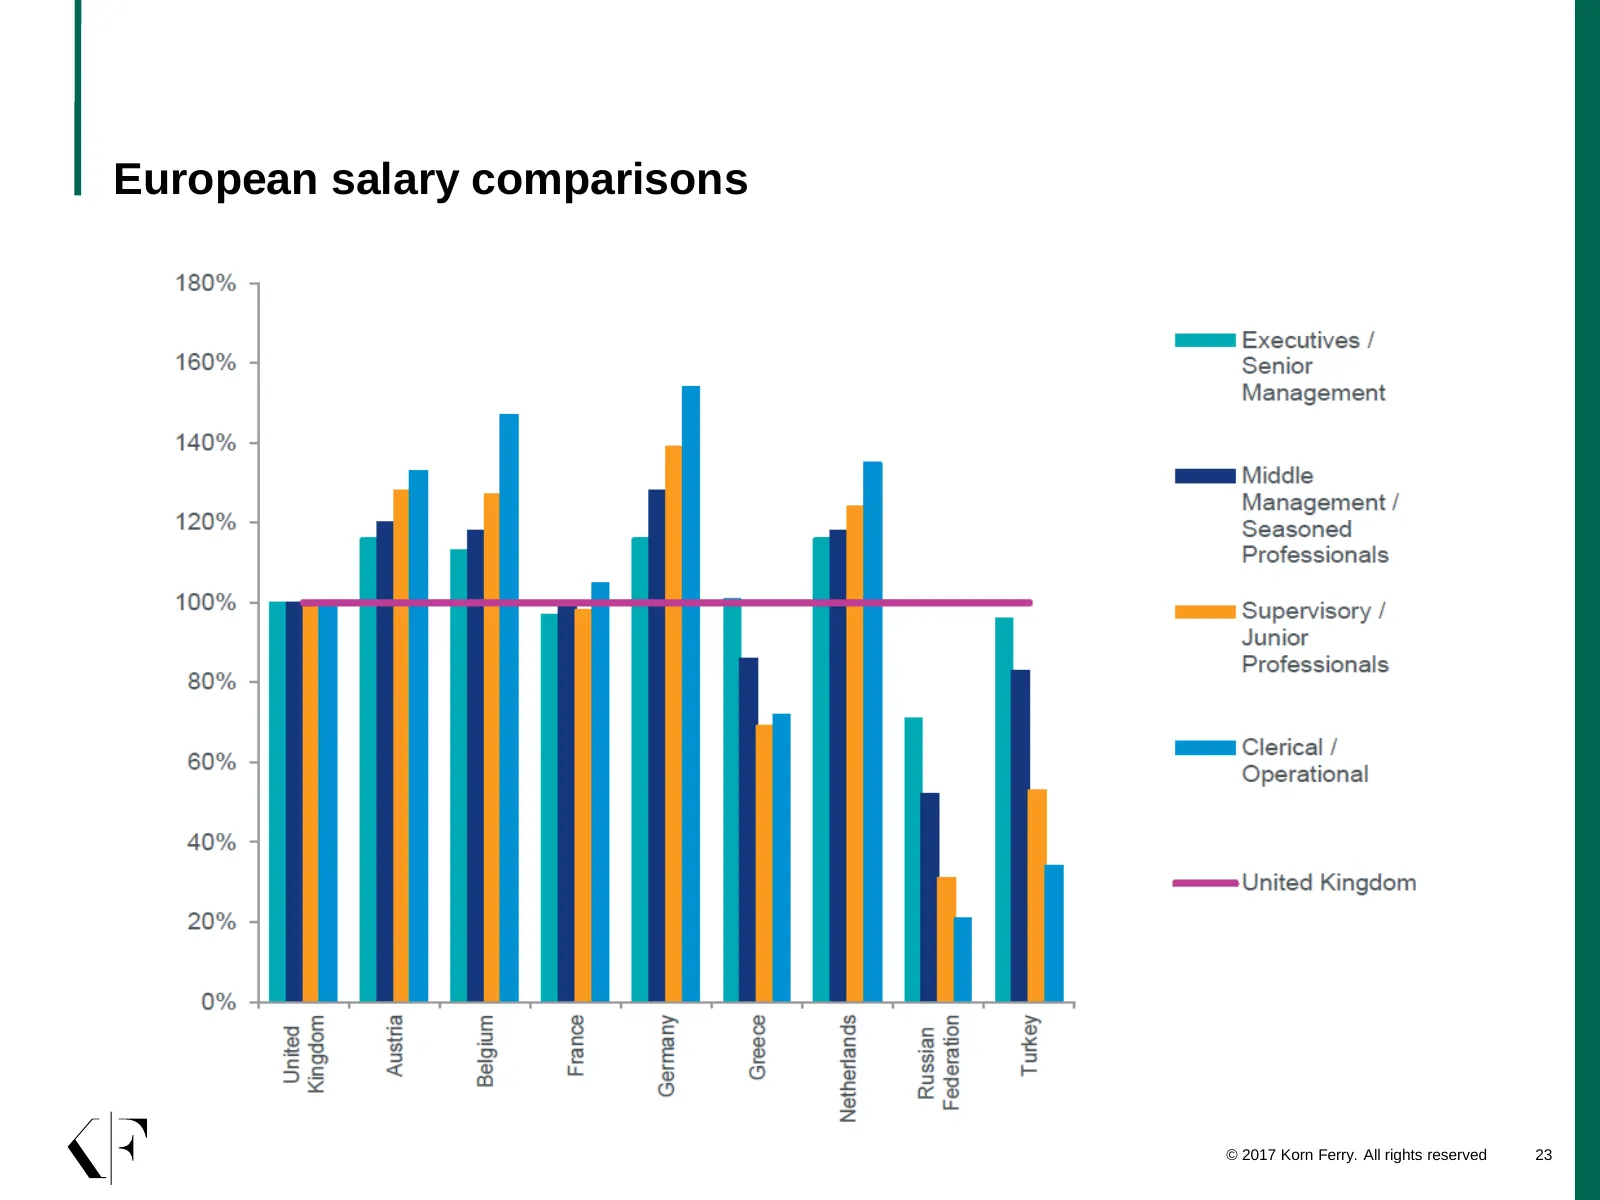
European salary comparisons © 2017 Korn Ferry. All rights reserved 23

Slide 24: UK data in detail
5 UK data in detail
Slide 25: UK general industry overview
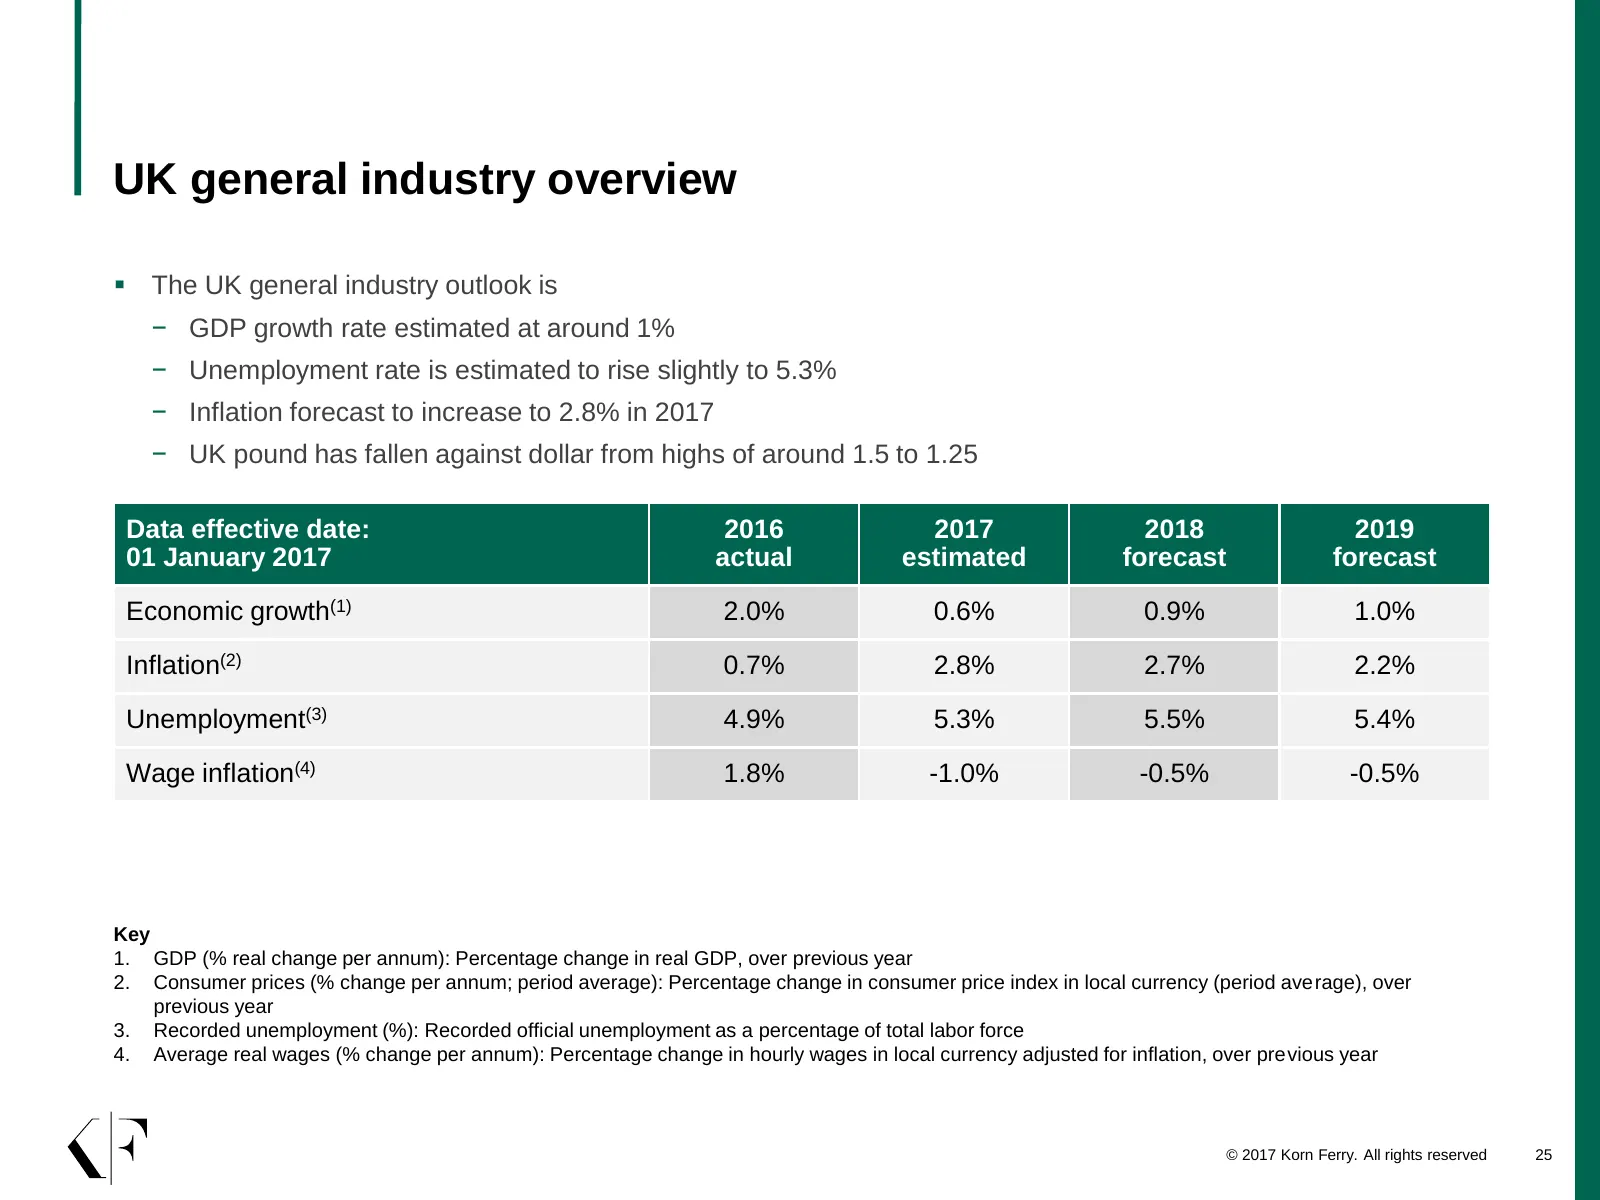
UK general industry overview The UK general industry outlook is − GDP growth rate estimated at around 1% − Unemployment rate is estimated to rise slightly to 5.3% − Inflation forecast to increase to 2.8% in 2017 − UK pound has fallen against dollar from highs of around 1.5 to 1.25 Data effective d
Slide 26: UK salary data in detail
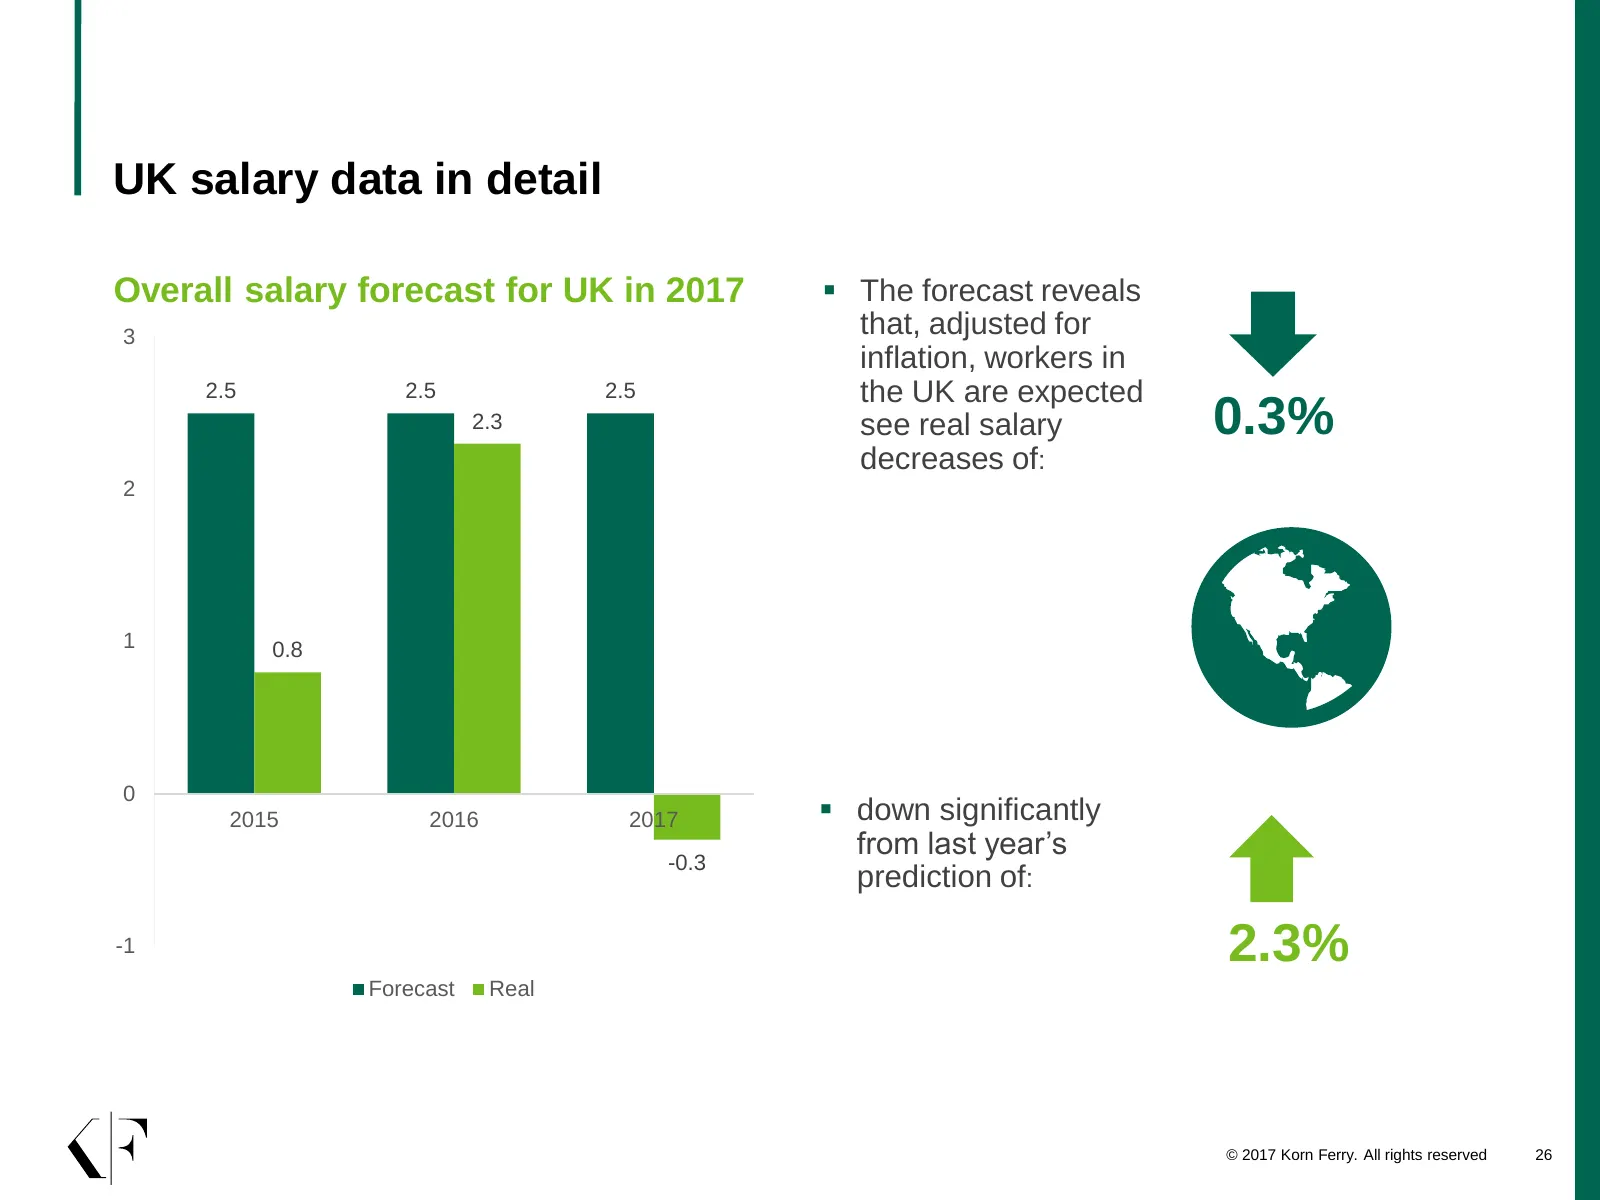
UK salary data in detail Overall salary forecast for UK in 2017 The forecast reveals 3 that, adjusted for inflation, workers in 2.5 2.5 2.5 the UK are expected 2.3 see real salary 0.3% decreases of: 2 1 0.8 0 2015 2016 2017 down significantly from last year’s -0.3 prediction of: -1 2.3% Forecast
Slide 27: Salary movements vs inflation
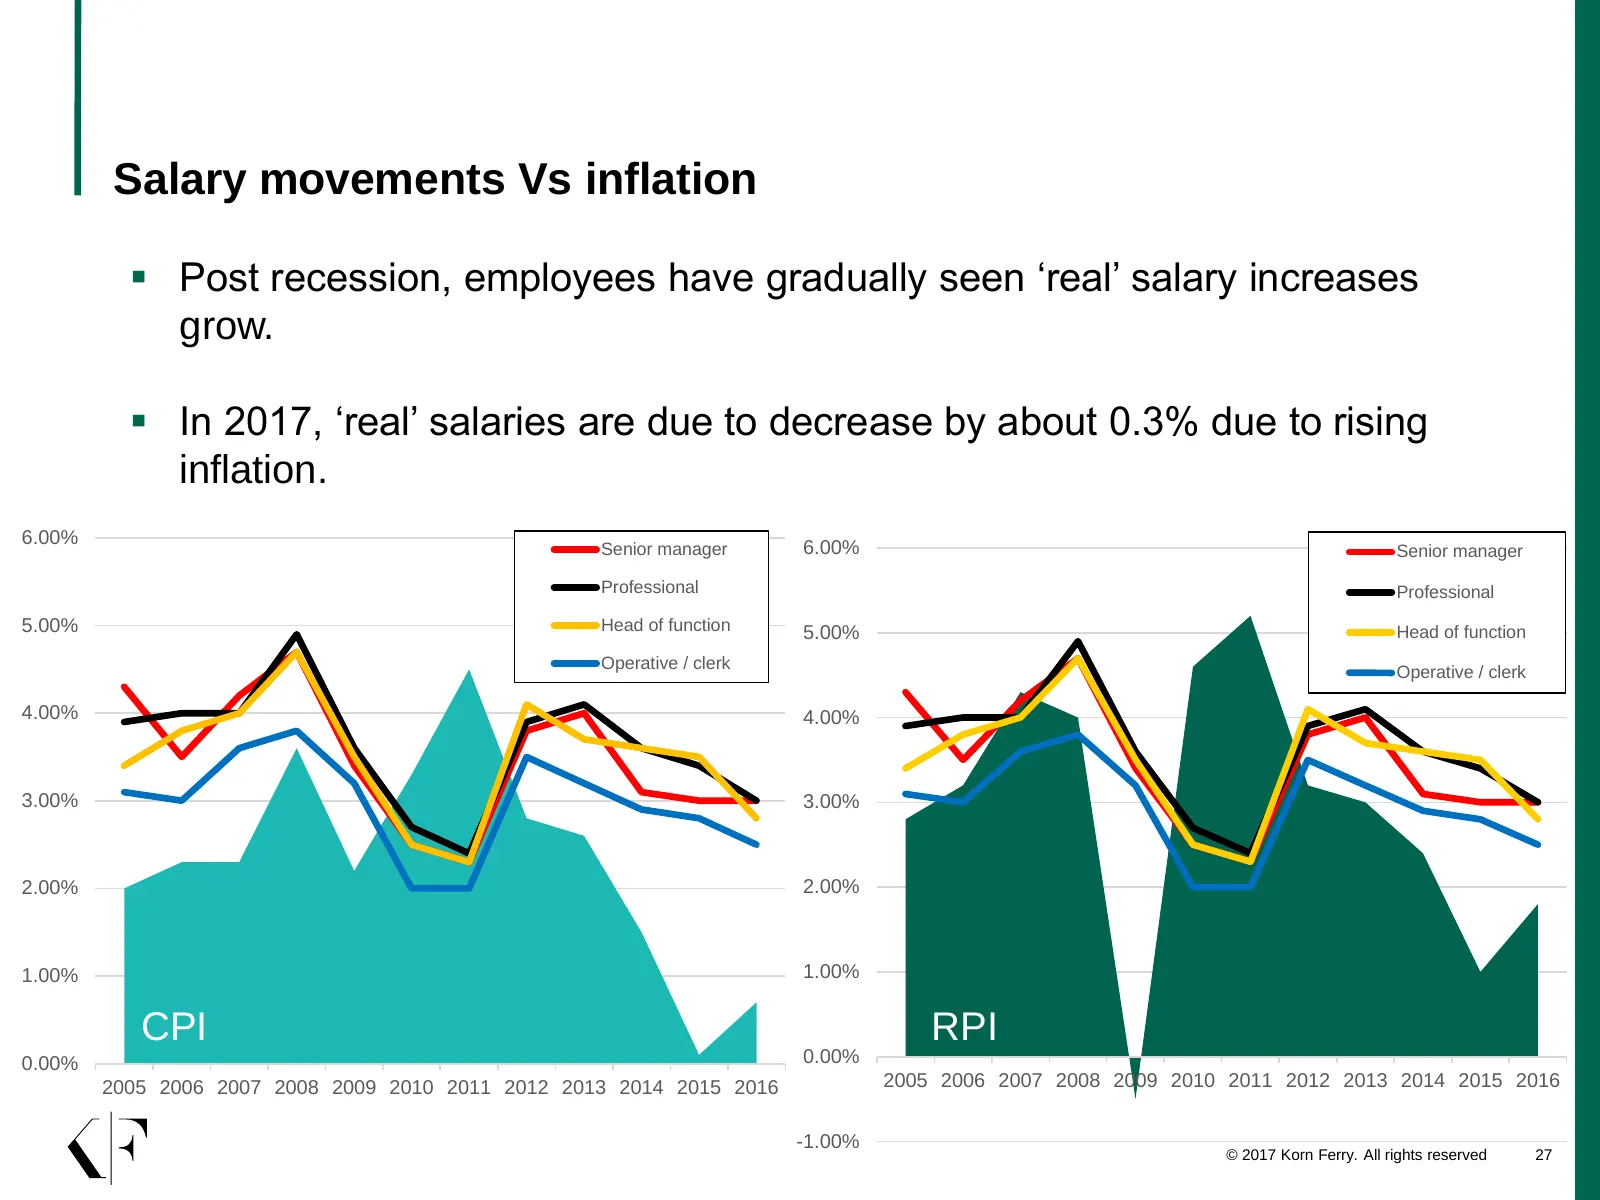
Salary movements Vs inflation Post recession, employees have gradually seen ‘real’ salary increases grow. In 2017, ‘real’ salaries are due to decrease by about 0.3% due to rising inflation. 6.00% Senior manager 6.00% Senior manager Professional Professional 5.00% Head of function 5.00% Head of f
Slide 28: UK sector comparisons
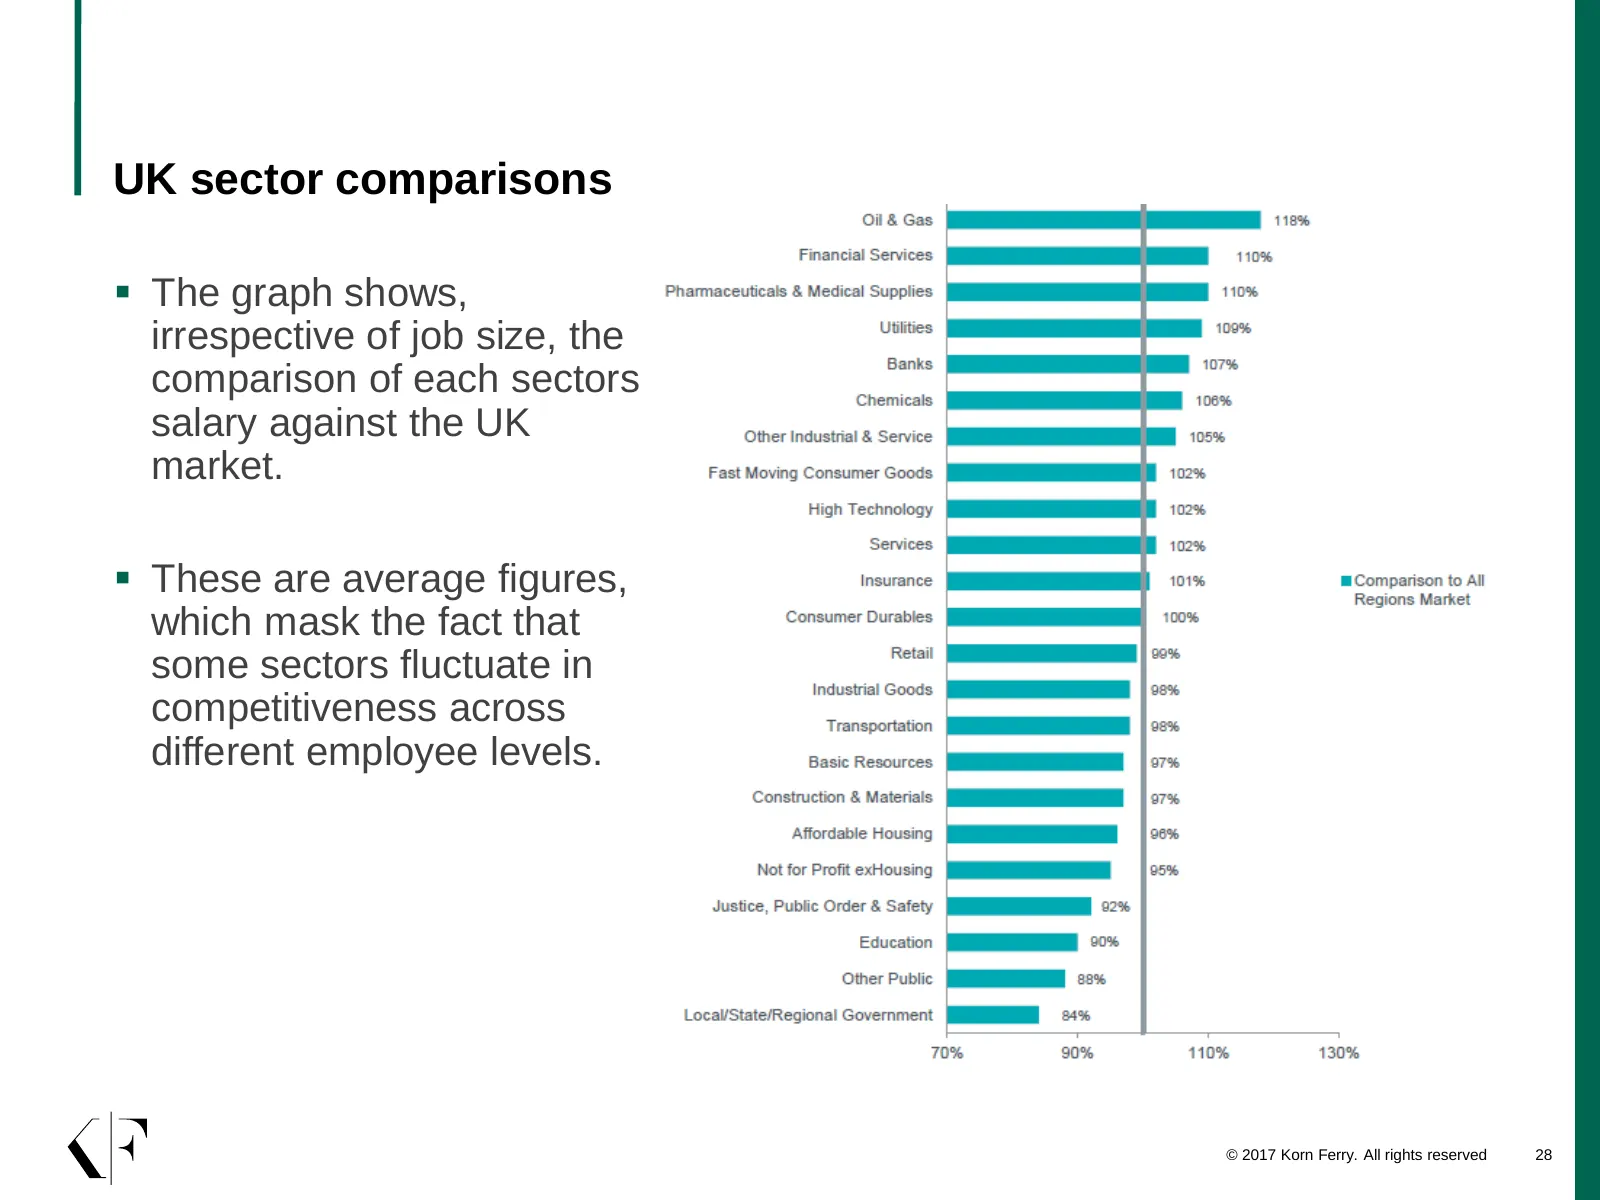
UK sector comparisons The graph shows, irrespective of job size, the comparison of each sectors salary against the UK market. These are average figures, which mask the fact that some sectors fluctuate in competitiveness across different employee levels. © 2017 Korn Ferry. All rights reserved 28
Slide 29: UK job family comparisons
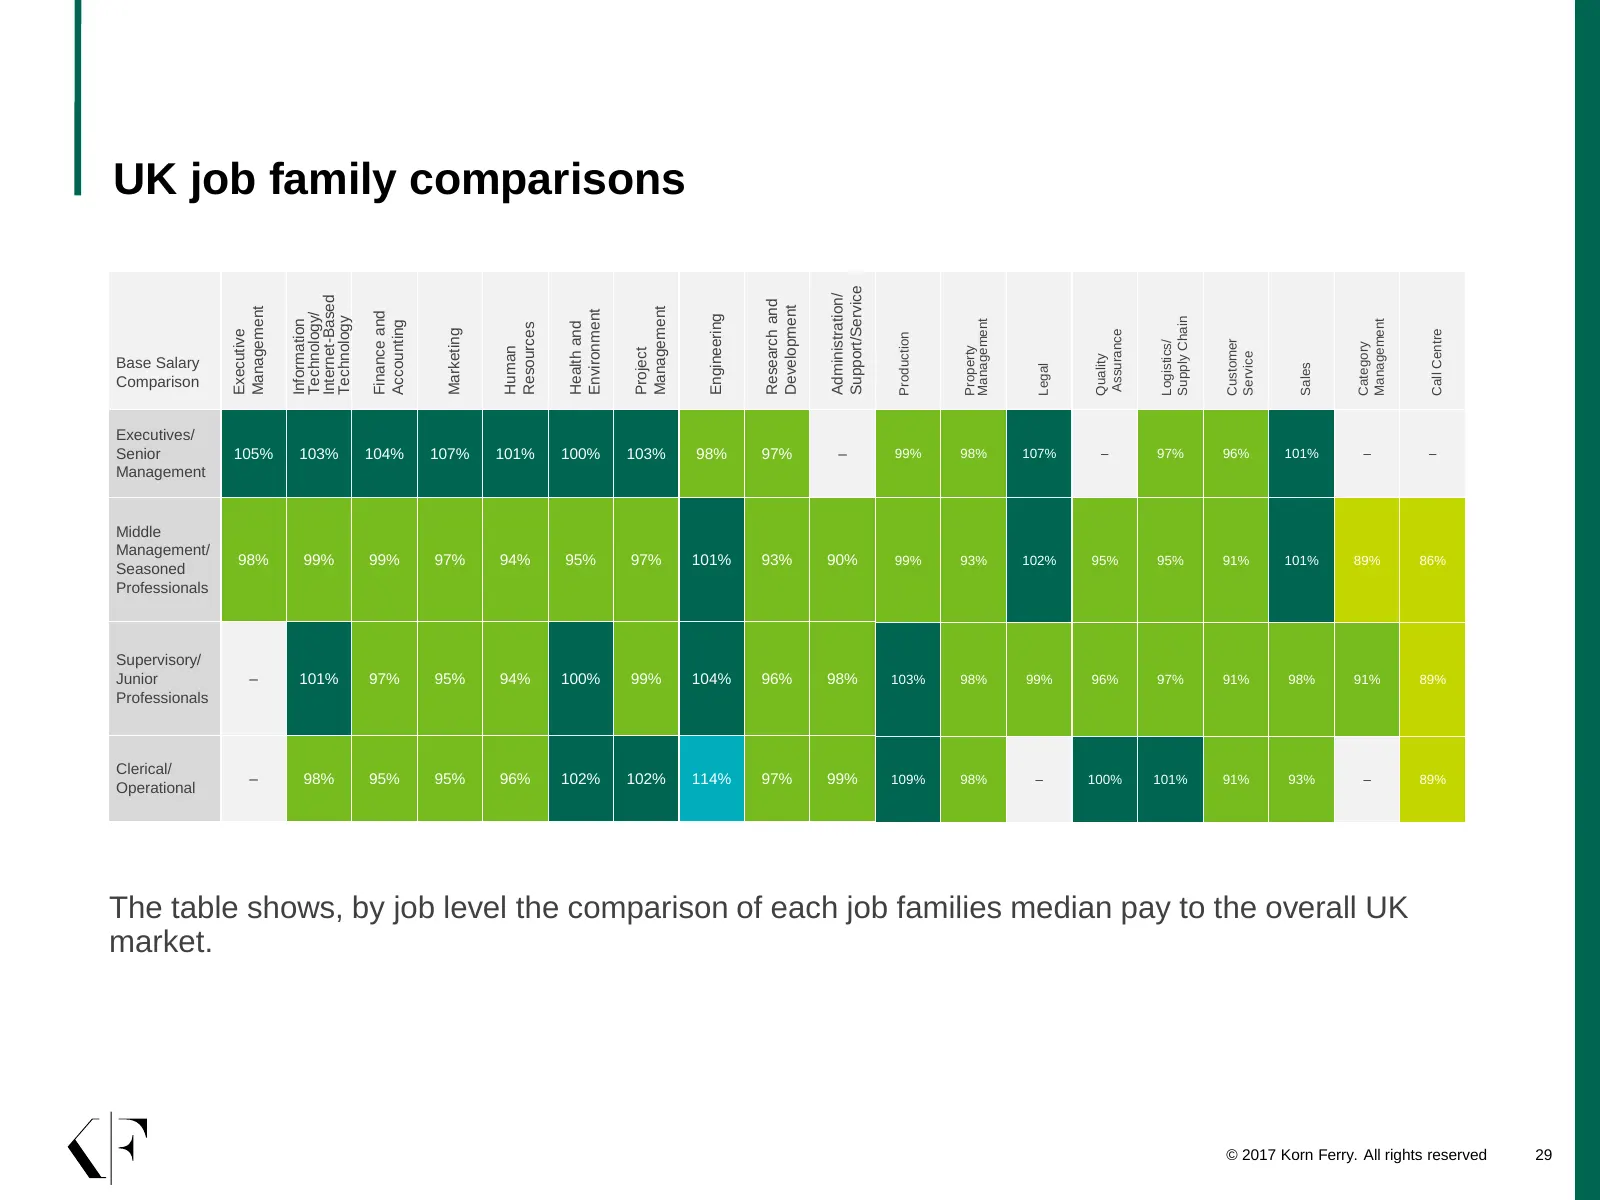
UK job family comparisons Support/Service Administration/ Internet-Based Research and Development Management Management Environment Finance and Technology/ Engineering Technology Supply Chain Management Management Information Accounting Health and Resources Marketing Call Centre Executive Assurance
Slide 30: UK regional comparisons
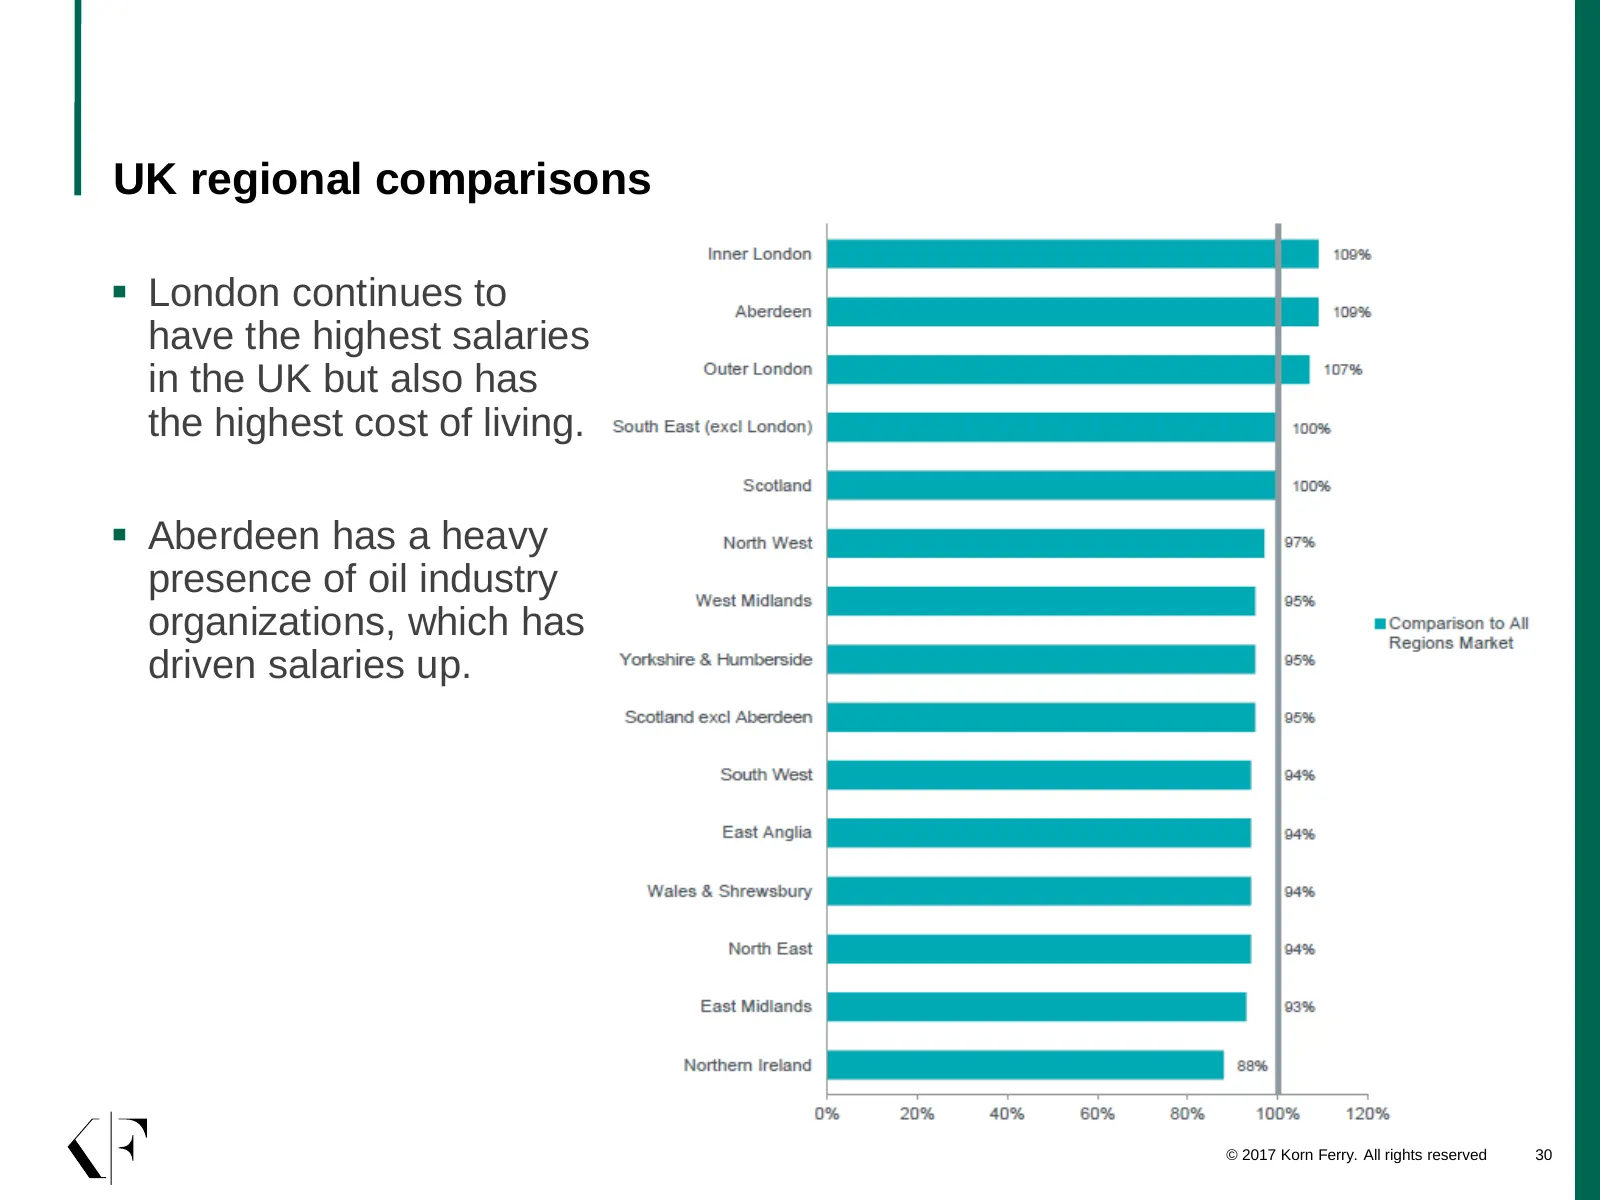
UK regional comparisons London continues to have the highest salaries in the UK but also has the highest cost of living. Aberdeen has a heavy presence of oil industry organizations, which has driven salaries up. © 2017 Korn Ferry. All rights reserved 30
Slide 31: UK key business issues
6 UK key business issues
Slide 32: Key business issues: talent management
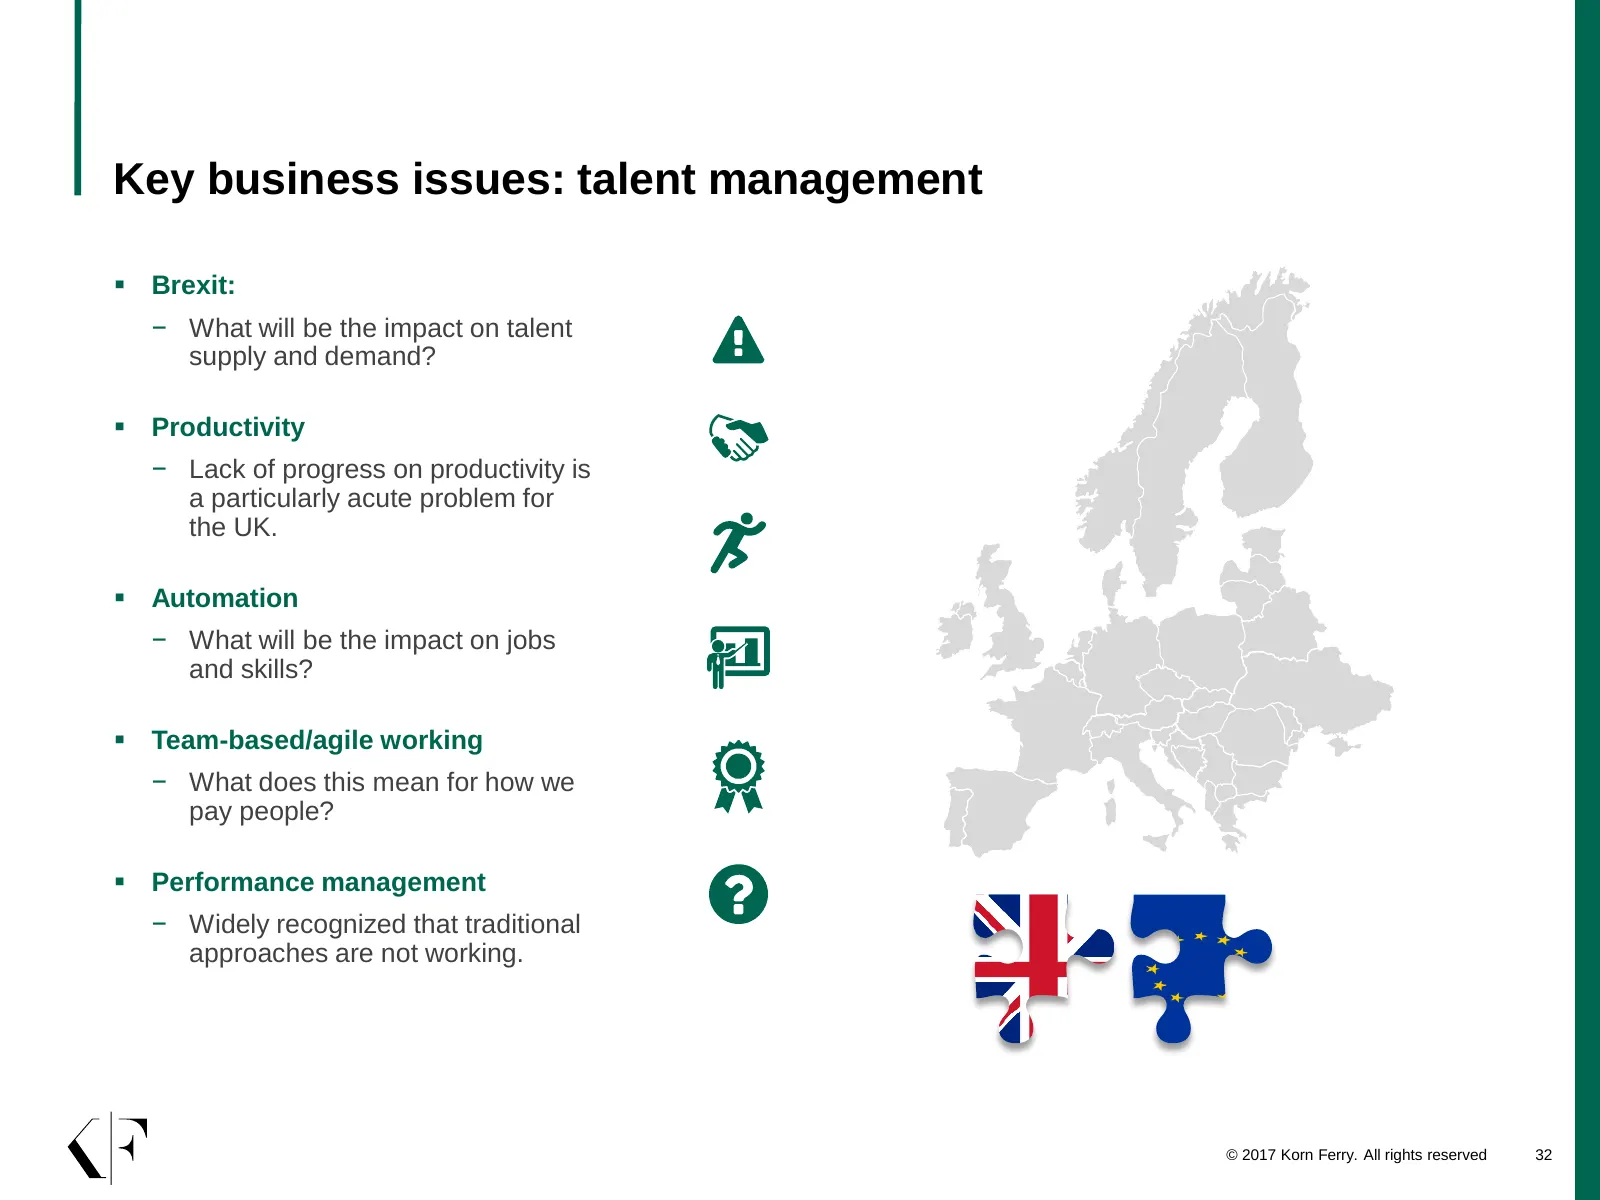
Key business issues: talent management Brexit: − What will be the impact on talent supply and demand? Productivity − Lack of progress on productivity is a particularly acute problem for the UK. Automation − What will be the impact on jobs and skills? Team-based/agile working − What does this
Slide 33: Key business issues: regulations
Key business issues: regulations Gender pay gap − Government expected to pass laws mandating ‘gender pay gap’ reporting from 2017: − Companies will need to publish mean and median salary and bonus, for men and women – as well as data on female representation at senior job levels. − The data being
Slide 34: Key business issues: Engagement
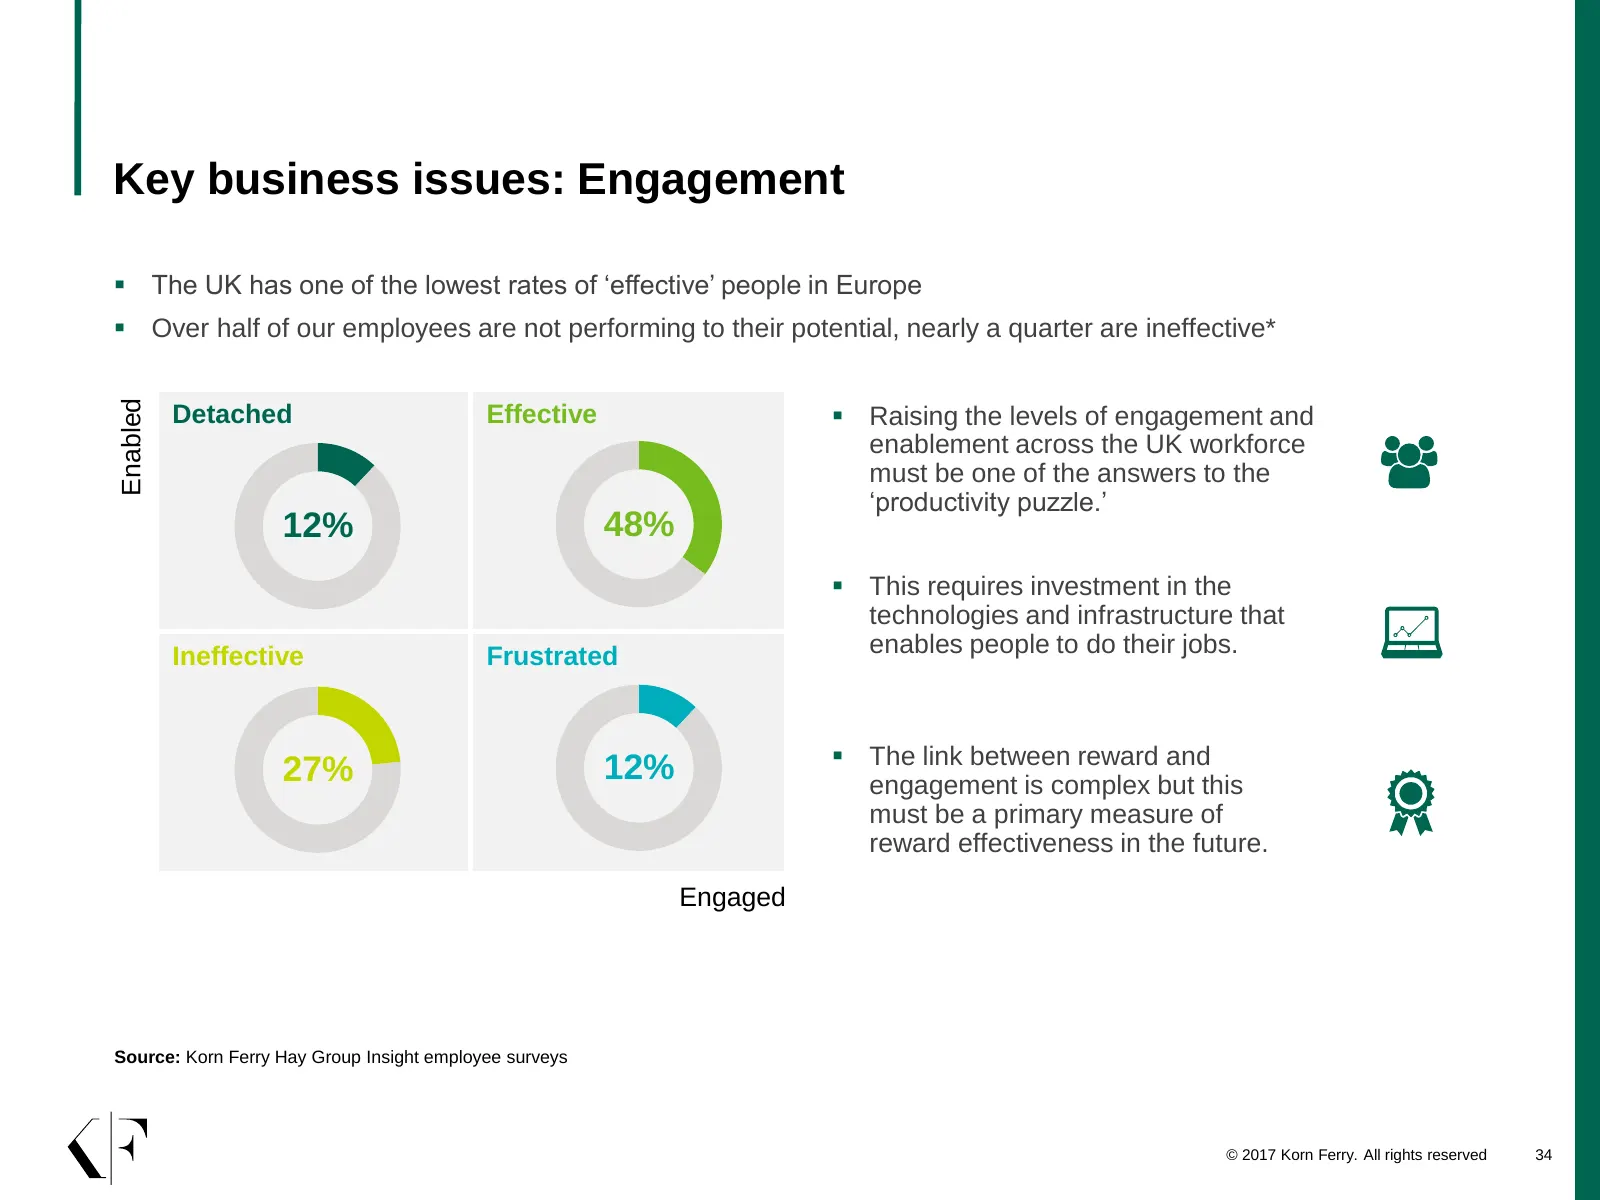
Key business issues: Engagement The UK has one of the lowest rates of ‘effective’ people in Europe Over half of our employees are not performing to their potential, nearly a quarter are ineffective* Enabled Detached Effective Raising the levels of engagement and enablement across the UK workfo
Slide 35: Keeping talent – predictors of employee retention
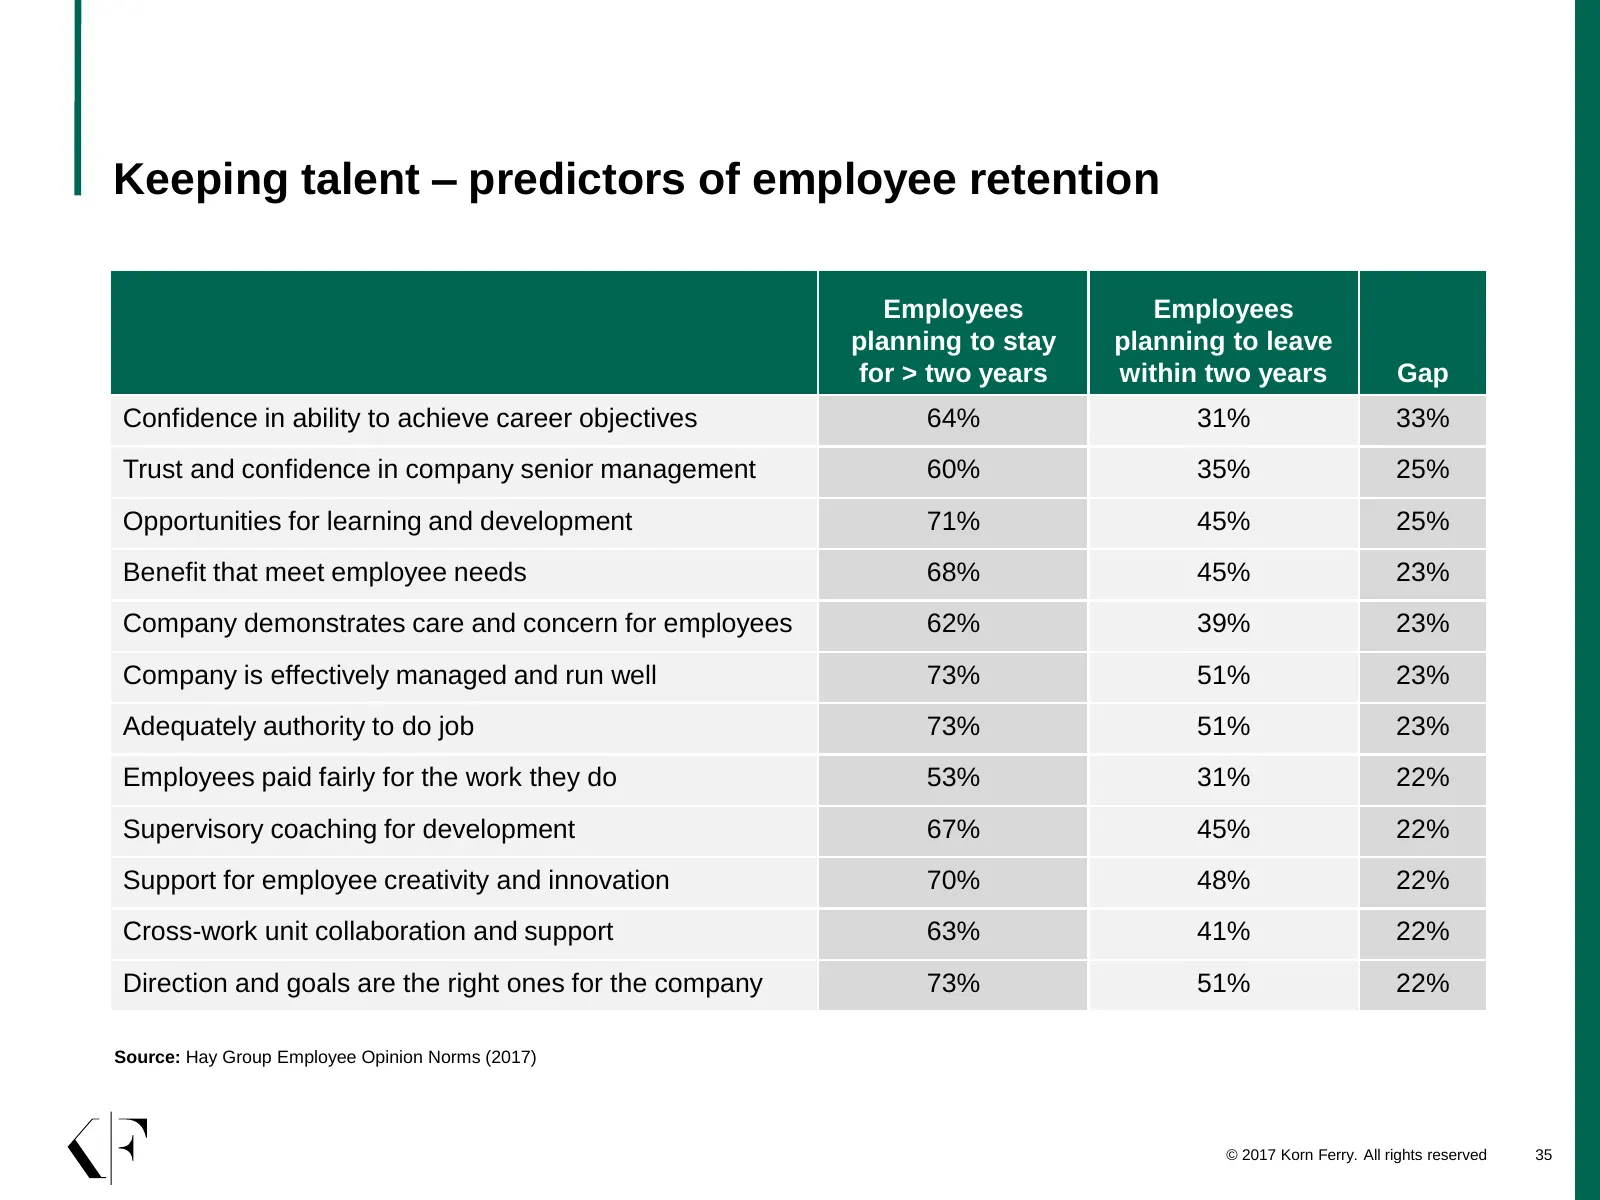
Keeping talent – predictors of employee retention Employees Employees planning to stay planning to leave for > two years within two years Gap Confidence in ability to achieve career objectives 64% 31% 33% Trust and confidence in company senior management 60% 35% 25% Opportunities for learning and de
Slide 36: Key business issues: career development
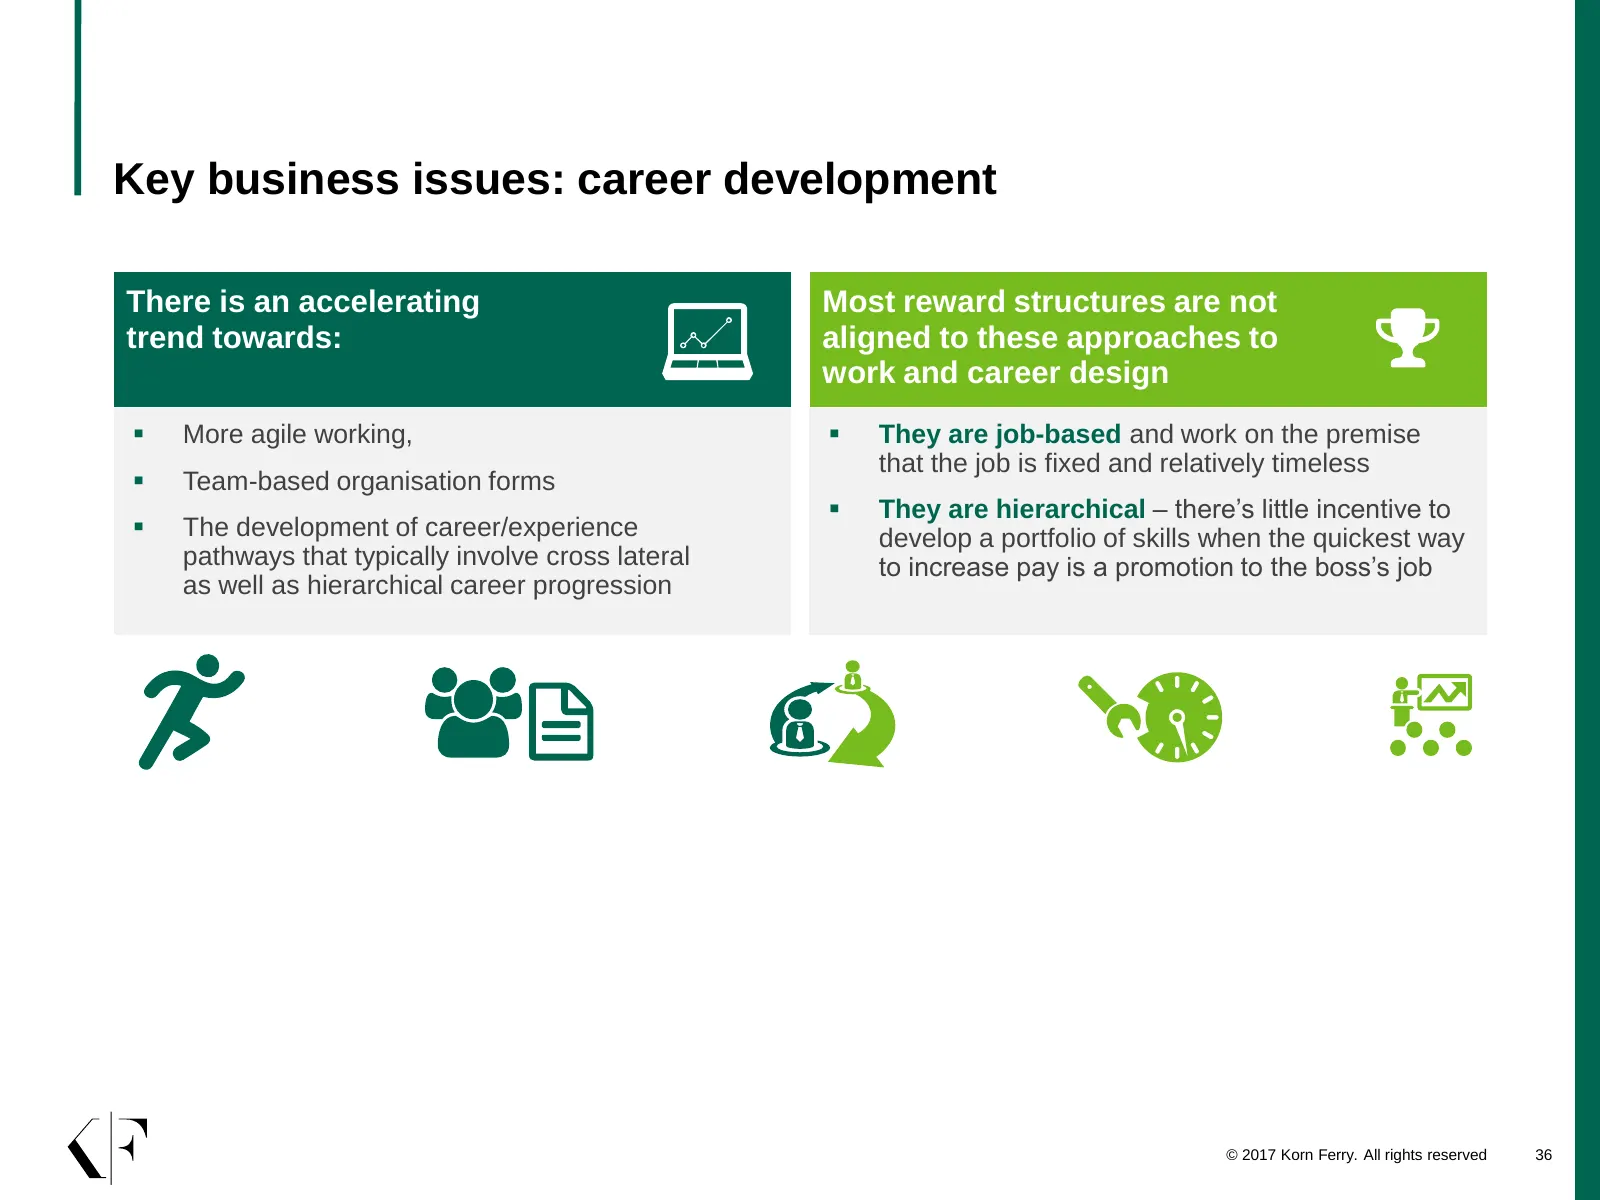
Key business issues: career development There is an accelerating Most reward structures are not trend towards: aligned to these approaches to work and career design More agile working, They are job-based and work on the premise that the job is fixed and relatively timeless Team-based organisat
Slide 37: Korn Ferry Hay Group's reward framework
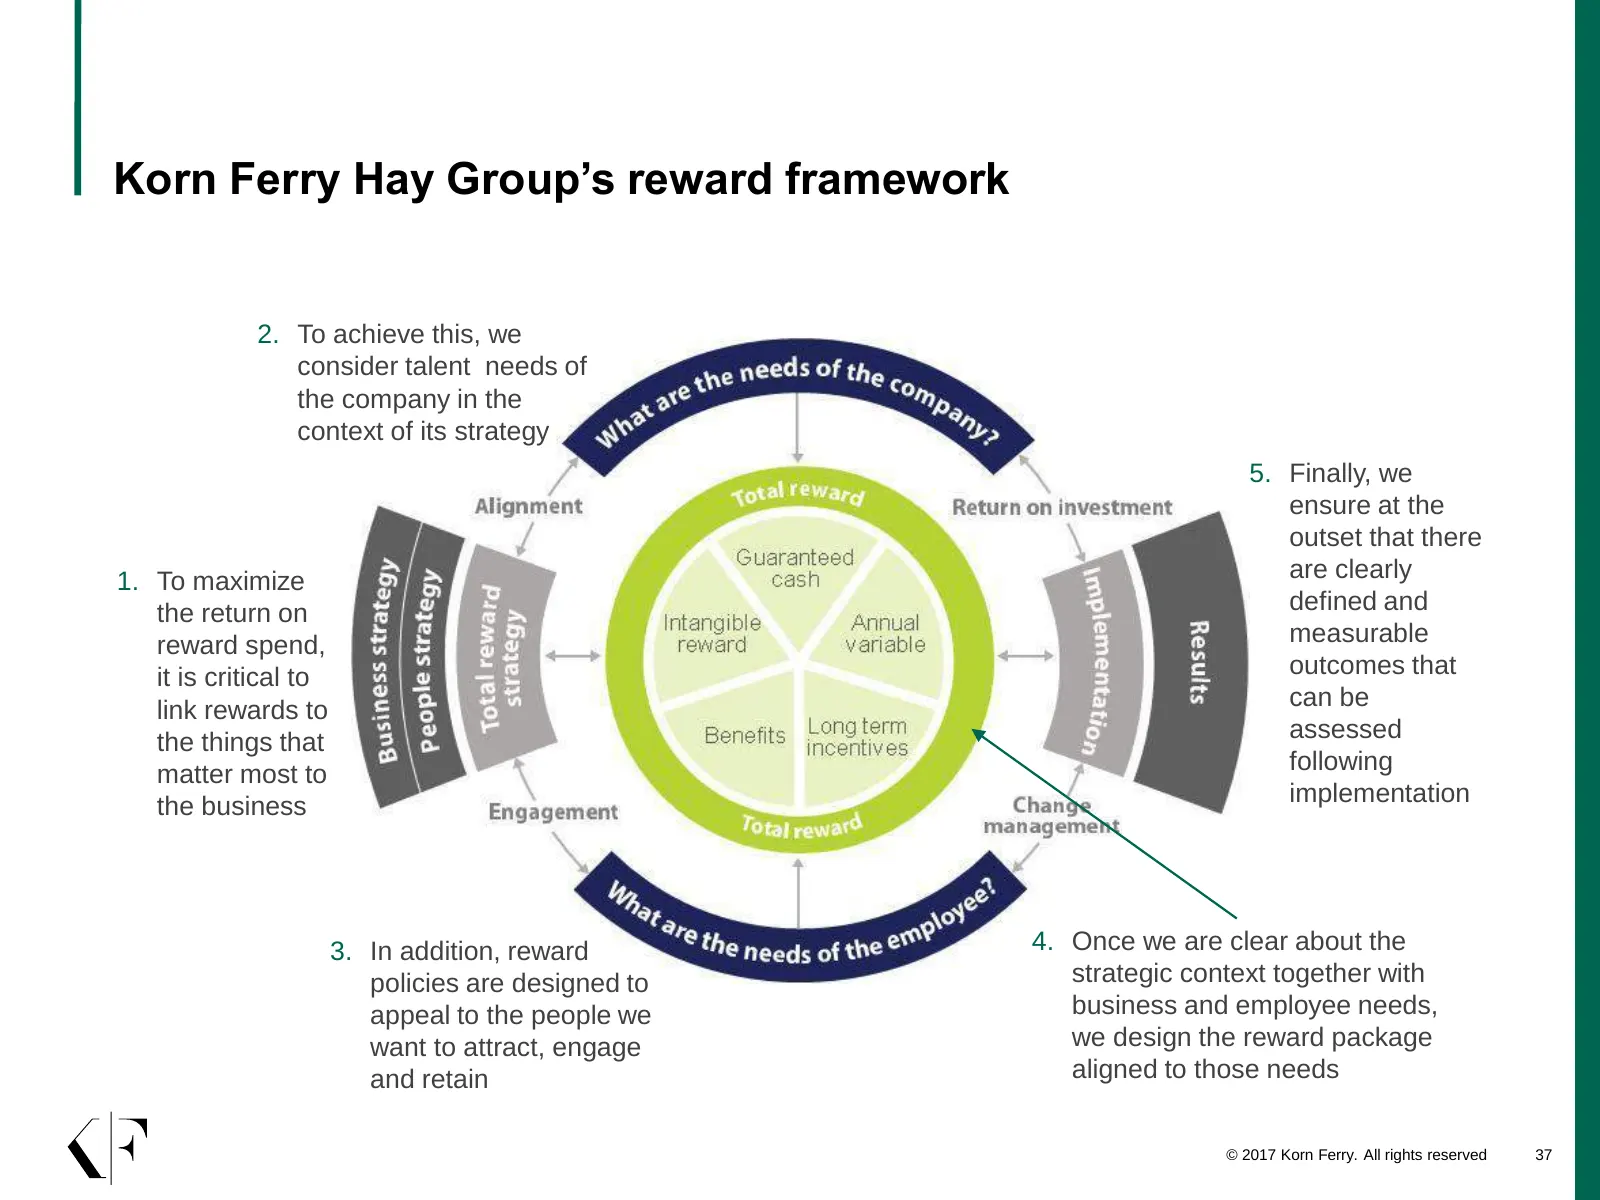
Korn Ferry Hay Group’s reward framework 2. To achieve this, we consider talent needs of the company in the context of its strategy 5. Finally, we ensure at the outset that there 1. To maximize are clearly the return on defined and reward spend, measurable it is critical to outcomes that link rewards
Slide 38: A reward manager's to-do list UK 2017
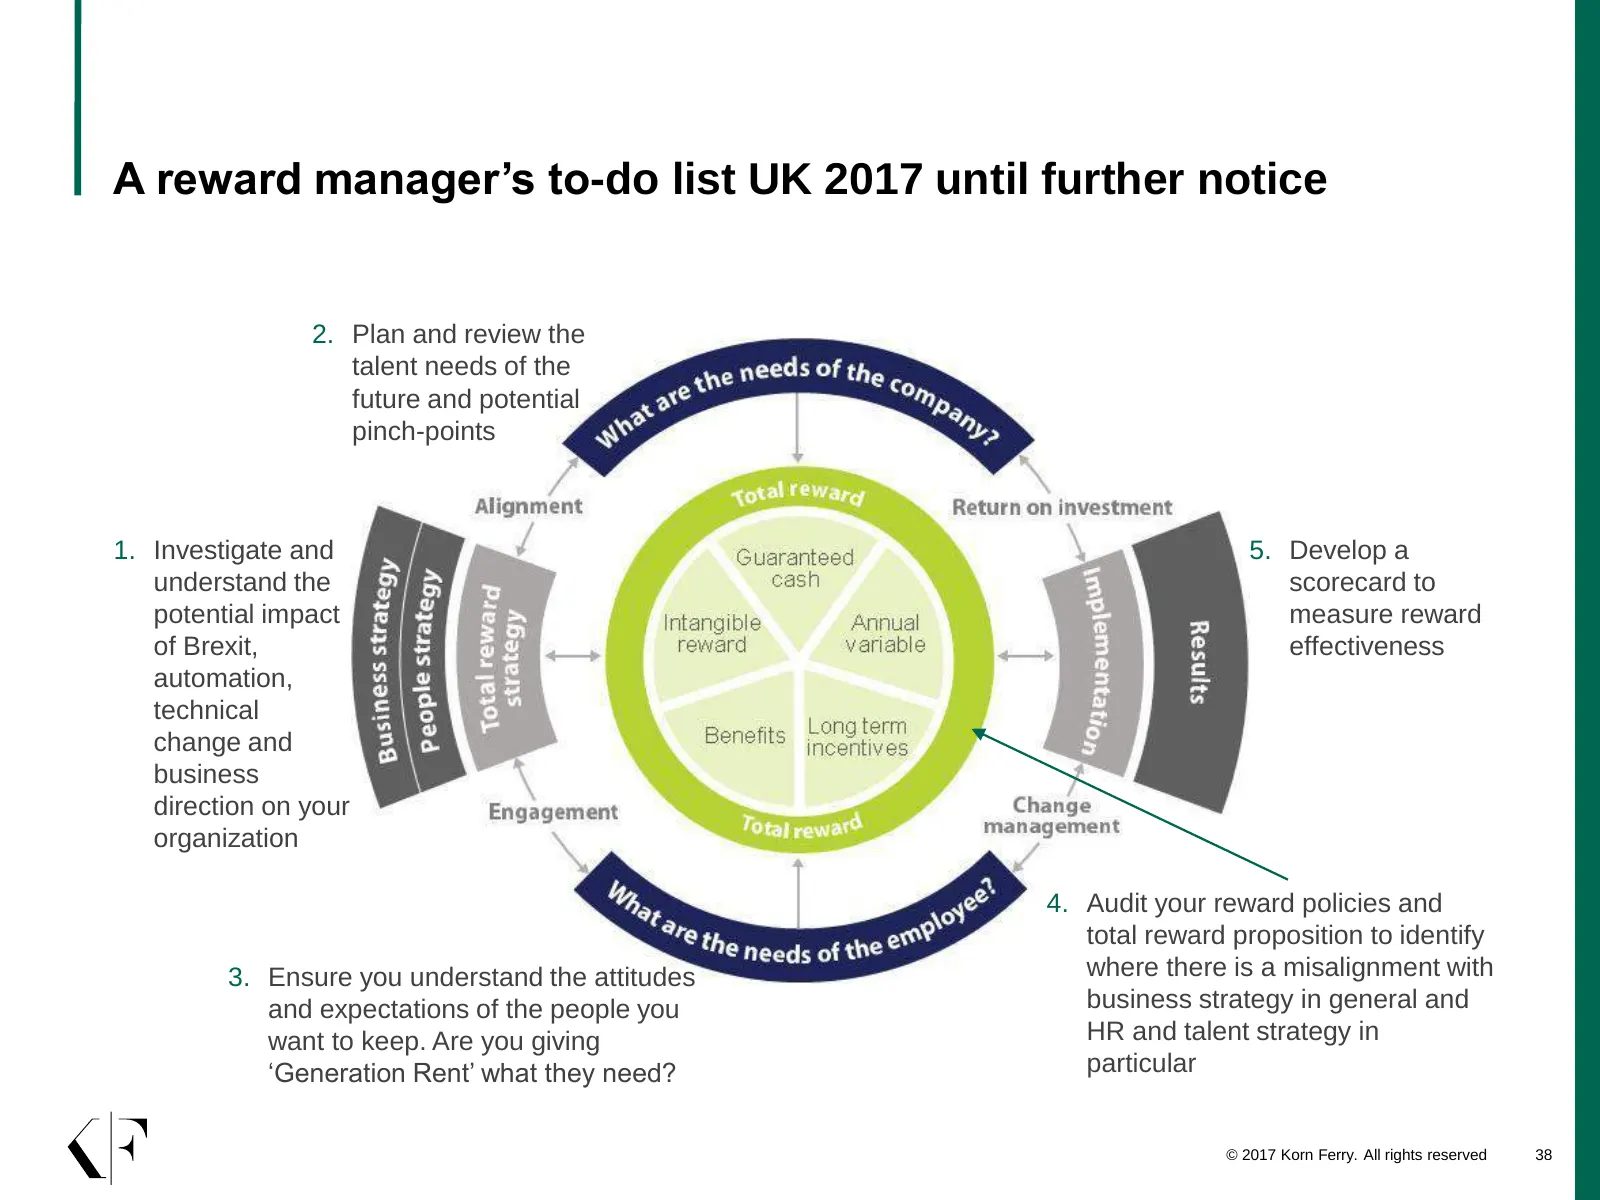
A reward manager’s to-do list UK 2017 until further notice 2. Plan and review the talent needs of the future and potential pinch-points 1. Investigate and 5. Develop a understand the scorecard to potential impact measure reward of Brexit, effectiveness automation, technical change and business direc
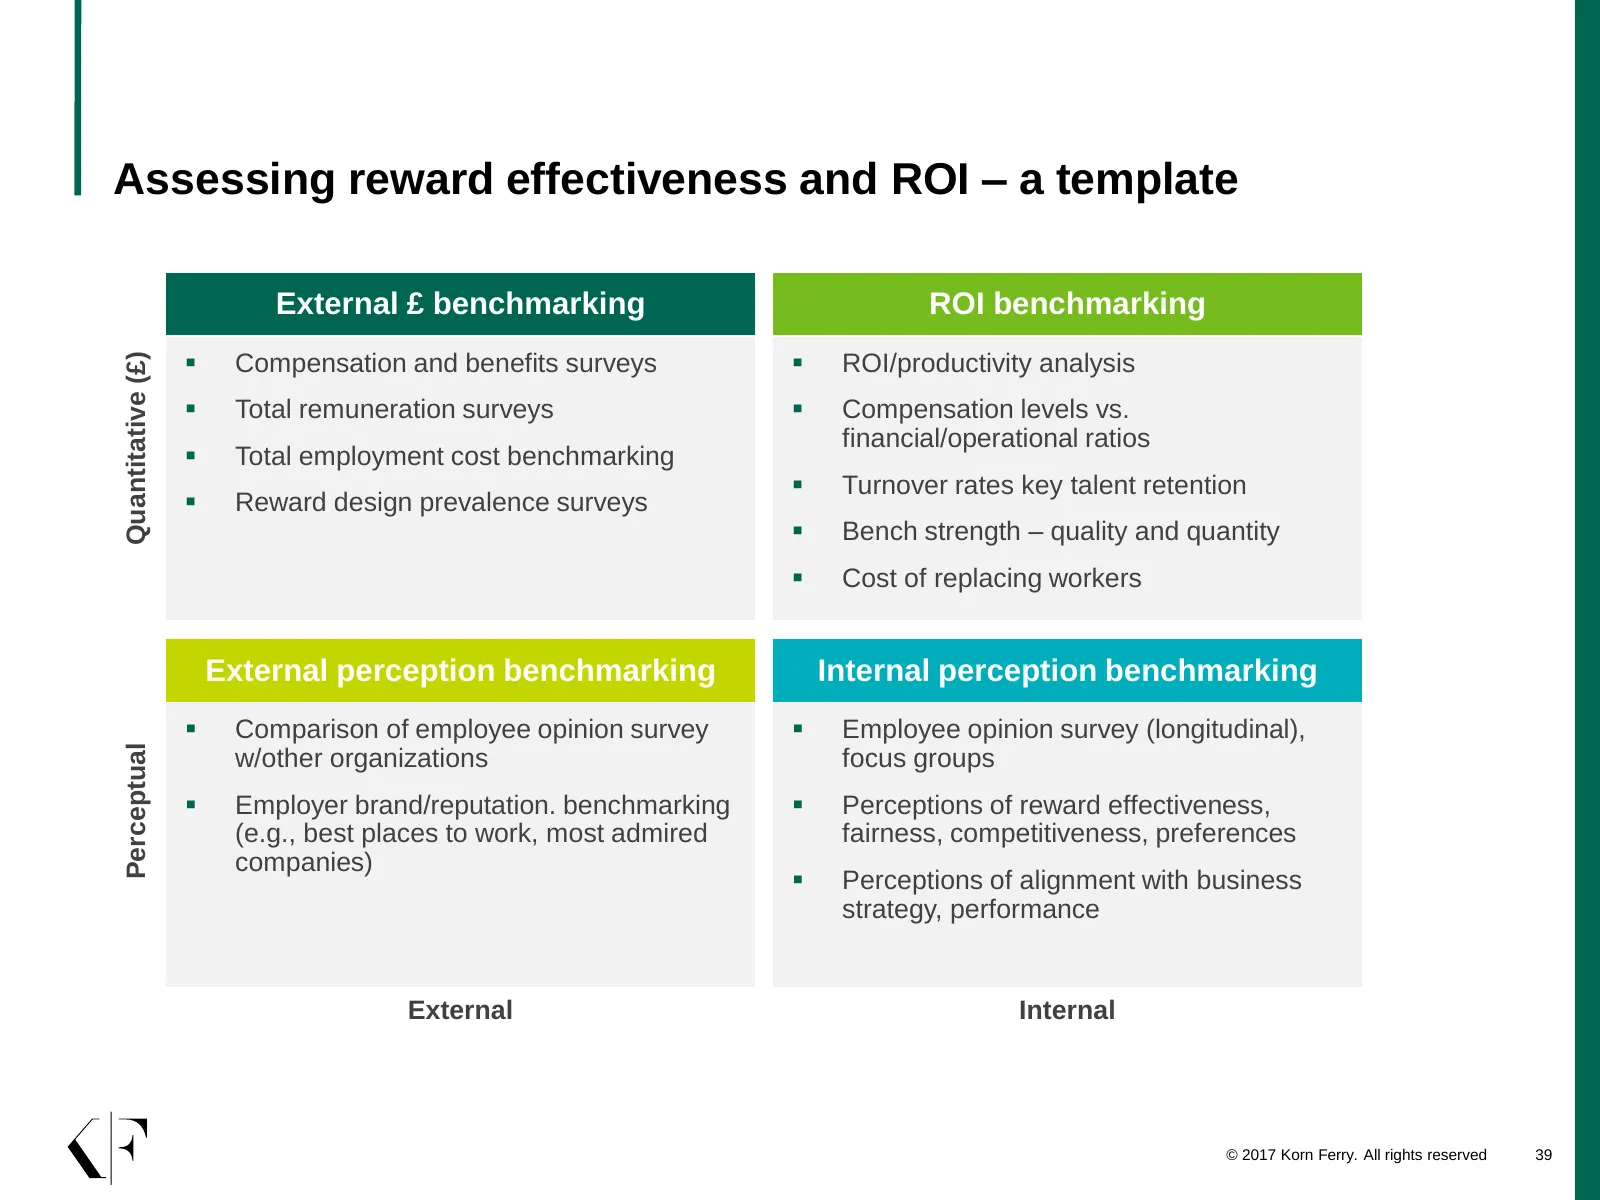
Slide 39: Assessing reward effectiveness and ROI – a template
Assessing reward effectiveness and ROI – a template External £ benchmarking ROI benchmarking Quantitative (£) Compensation and benefits surveys ROI/productivity analysis Total remuneration surveys Compensation levels vs. financial/operational ratios Total employment cost benchmarking Tur
Slide 40: One last thing
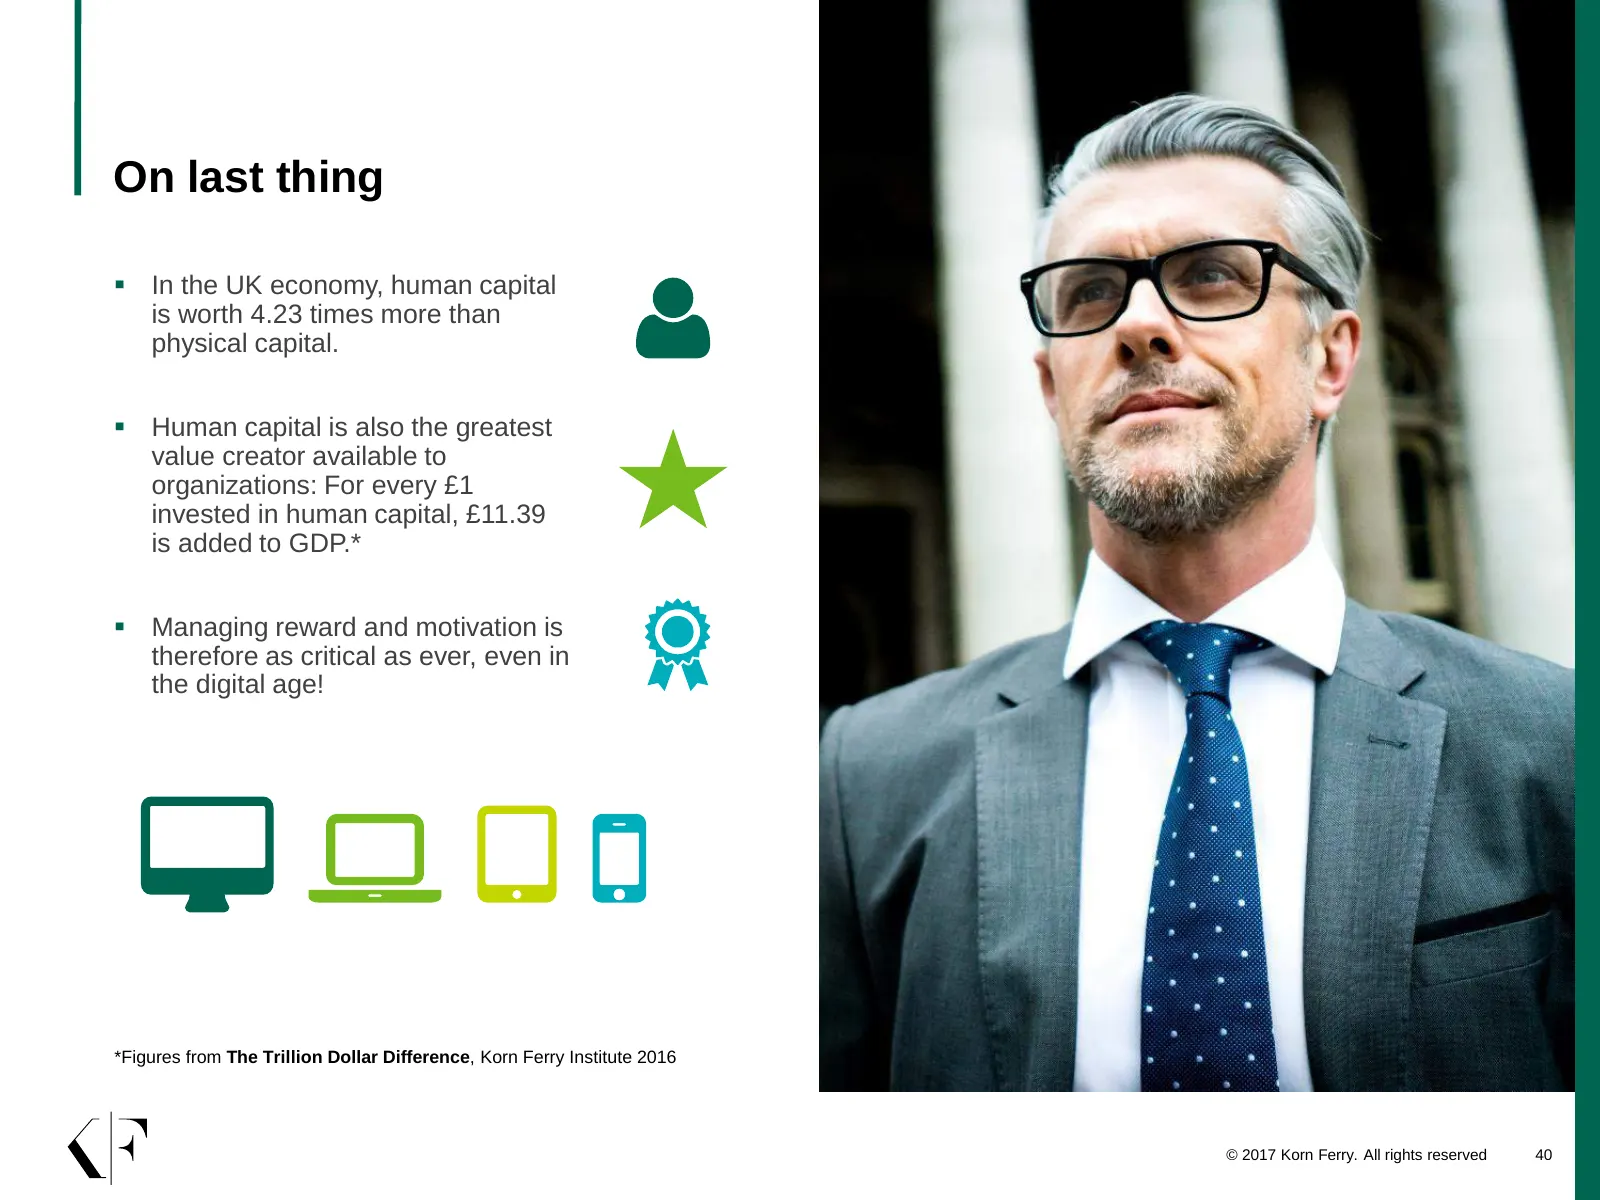
On last thing In the UK economy, human capital is worth 4.23 times more than physical capital. Human capital is also the greatest value creator available to organizations: For every £1 invested in human capital, £11.39 is added to GDP.* Managing reward and motivation is therefore as critical a
Slide 41: Mark Thompson, Mark Robinson contact details
Mark Thompson Mark Robinson Senior Partner and Head of Reward and Benefits Senior Account Manager, Reward Solutions for the UK and Ireland Korn Ferry Hay Group Korn Ferry Hay Group Phone: +44 (0)161 831 2492 Phone: +44 (0)20 3819 7223 Email: mark.robinson@kornferry.com Email: mark.thompson@kornferry

Slide 42: Thank you for joining our webinar today
Thank you for joining our webinar today Sign up for other reward webinars in the series here: http://bit.ly/RewardWebinarHub
Source: Internet Archive copy of infokf.kornferry.com
More decks from Korn Ferry
 Q1 2027 Earnings Presentation25 slides · Sep 9, 2026
 Q4 2026 Earnings Presentation26 slides · Jun 23, 2026
 Q3 2026 Earnings Presentation26 slides · Mar 9, 2026
 Q2 2026 Earnings Presentation26 slides · Dec 9, 2025
 Q1 2026 Earnings Presentation26 slides · Sep 9, 2025
 Q4 FY2025 Earnings Presentation26 slides · Jun 18, 2025