Owens Realty Mortgage — Merger or Acquisition (November 2018)
15 slides from Owens Realty Mortgage's merger presentation, Nov 8, 2018
Slide 1: Disclaimer: Forward Looking Statements
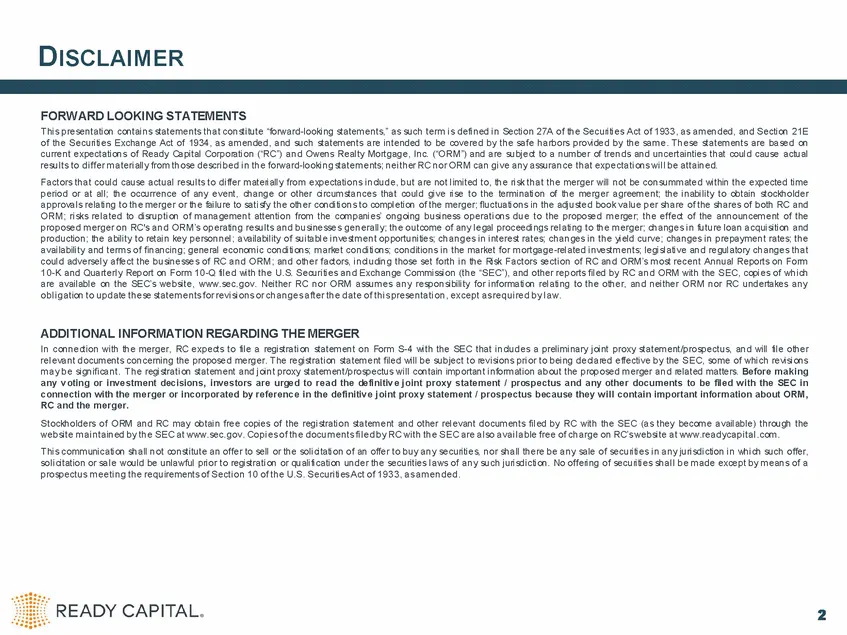
DISCLAIMER FORWARD LOOKING STATEMENTS T hi s presentati on contai ns statements that consti tute “forward-looki ng statements,” as such term is defi ned in Secti on 27A of the Securi ti es Act of 1933, as amended, and Secti on 21E of the Securi ti es Exchange Act of 1934, as amended, and such statem
Slide 2: Transaction Summary
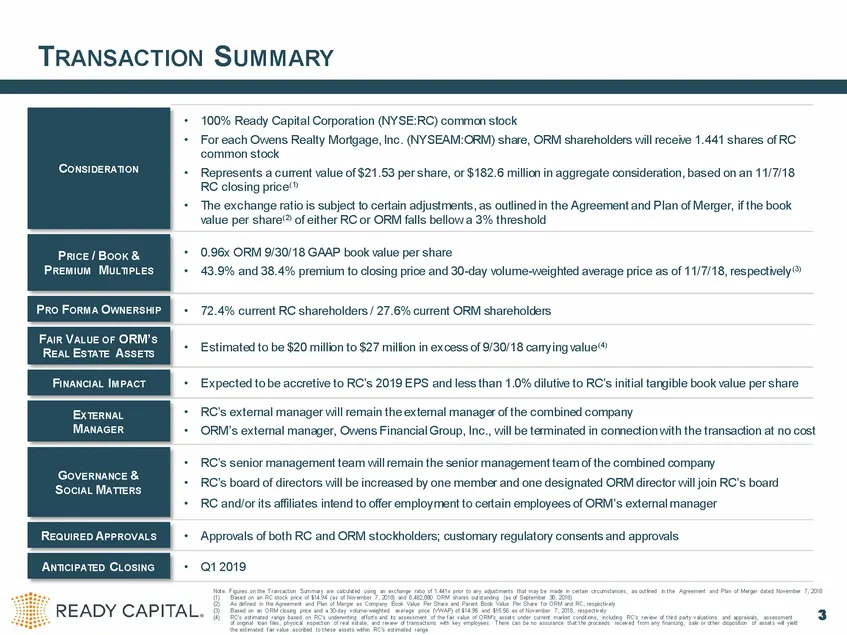
TRANSACTION SUMMARY • Estimated to be $20 million to $27 million in excess of 9/30/18 carrying value t Note: Figures on the Transaction Summary are calculated using an exchange ratio of 1.441x prior to any adjustments that may be made in certain circumstances, as outlined in the Agreement and Plan o
Slide 3: An Introduction to Owens Realty Mortgage, Inc.
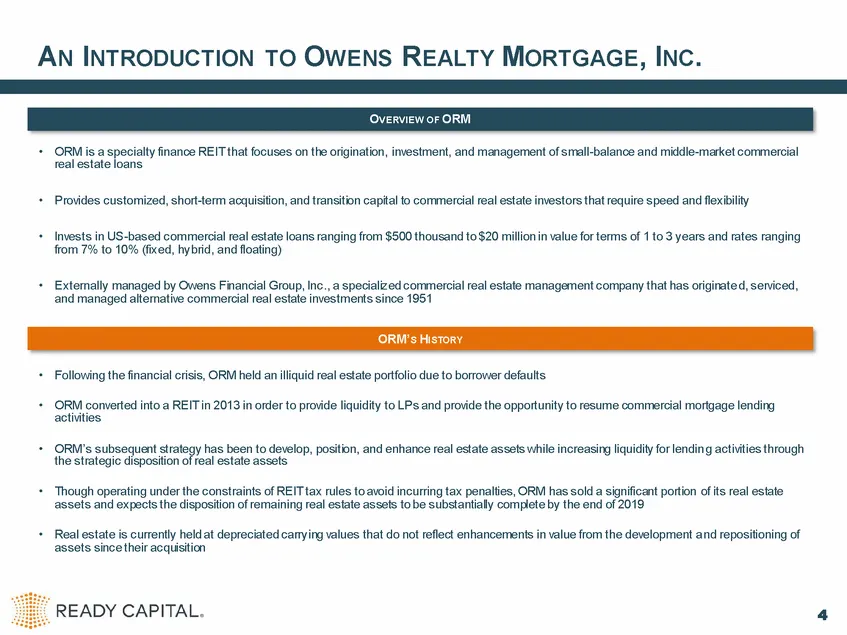
AN INTRODUCTION TO OWENS REALTY MORTGAGE, INC. • ORM is a specialty finance REIT that focuses on the origination, investment, and management of small-balance and middle-market commercial real estate loans • Provides customized, short-term acquisition, and transition capital to commercial real estate
Slide 4: Significant Benefits to Ready Capital Shareholders
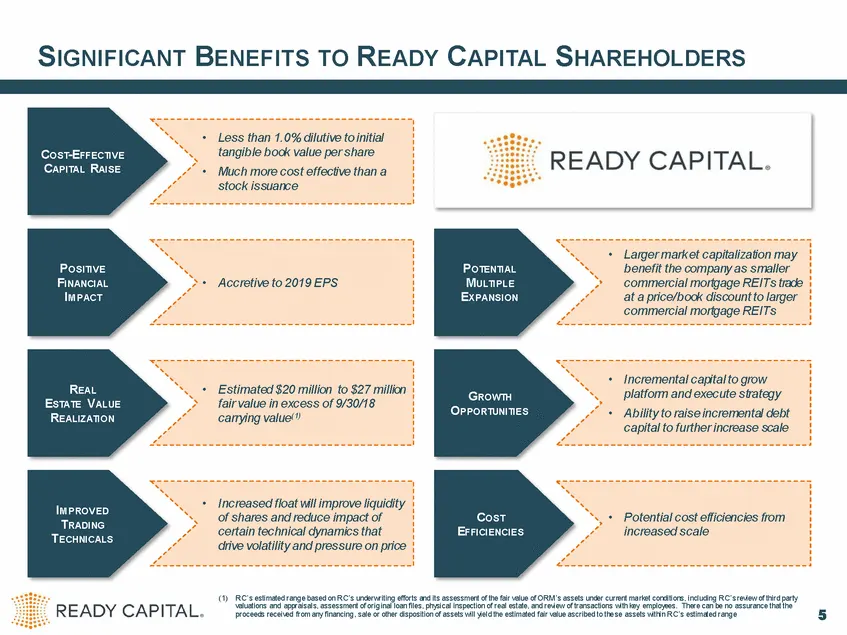
SIGNIFICANT BENEFITS TO READY CAPITAL SHAREHOLDERS • Less than 1.0% dilutive to initial tangible book value per share Much more cost effective than a stock issuance COST-EFFECTIVE CAPITAL RAISE • • Larger mark et capitalization may benefit the company as smaller commercial mortgage REITs trade at a
Slide 5: Compelling Transaction for Owens Shareholders
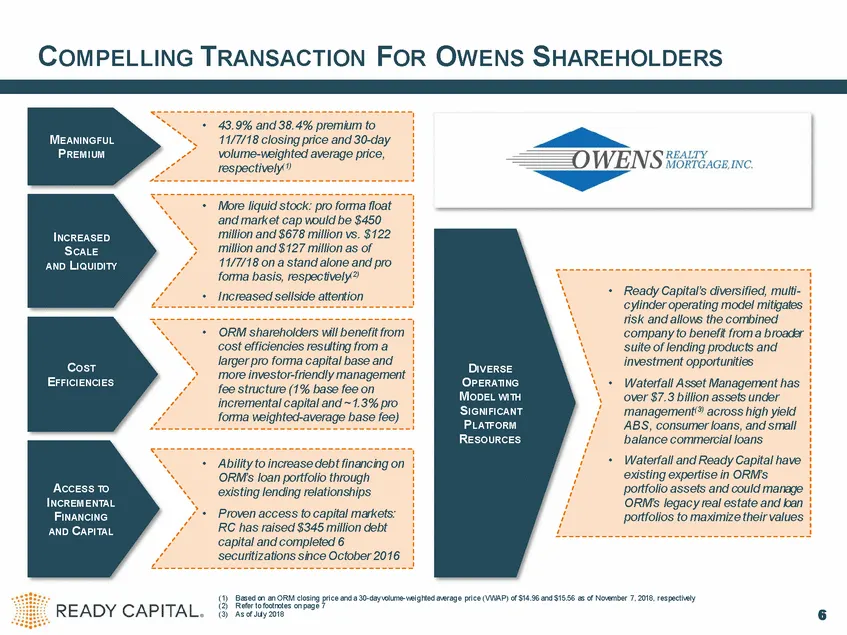
COMPELLING TRANSACTION FOR OWENS SHAREHOLDERS • 43.9% and 38.4% premium to 11/7/18 closing price and 30-day volume-weighted average price, respectively(1) MEANINGFUL PREMIUM • More liquid stock: pro forma float and mark et cap would be $450 million and $678 million vs. $122 million and $127 million
Slide 6: Combined Company Liquidity Benefits from Increased Scale & Share Float
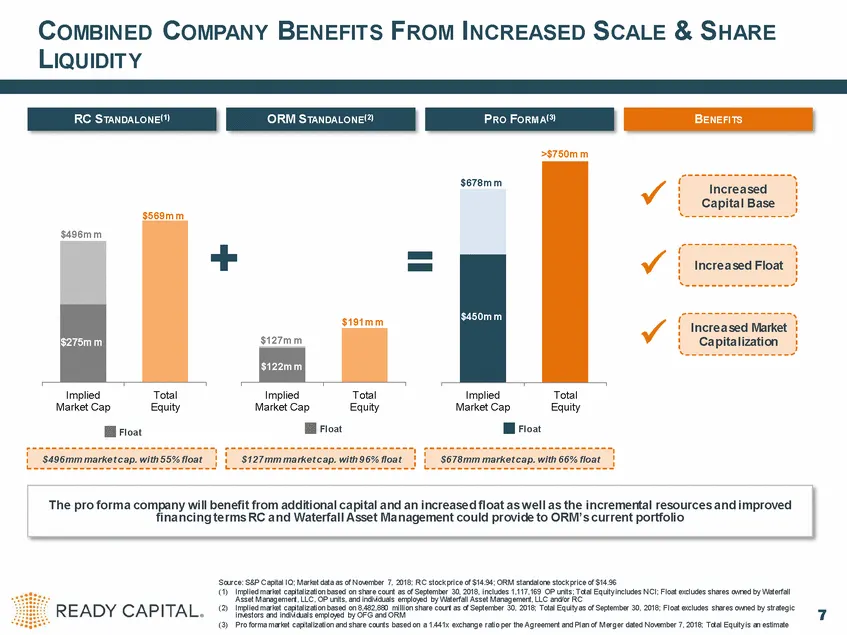
COMBINED COMPANY LIQUIDIT Y BENEFIT S FROM INCREASED SCALE & SHARE >$750m m Increased Capital Base $569m m Increased Float $191m m Increased Market Capitalization Implied Market Cap Total Equity Implied Market Cap Total Equity Implied Market Cap Total Equity Float Float Float Source: S&P Capital IQ;
Slide 7: A Multidimensional Platform to Drive Growth
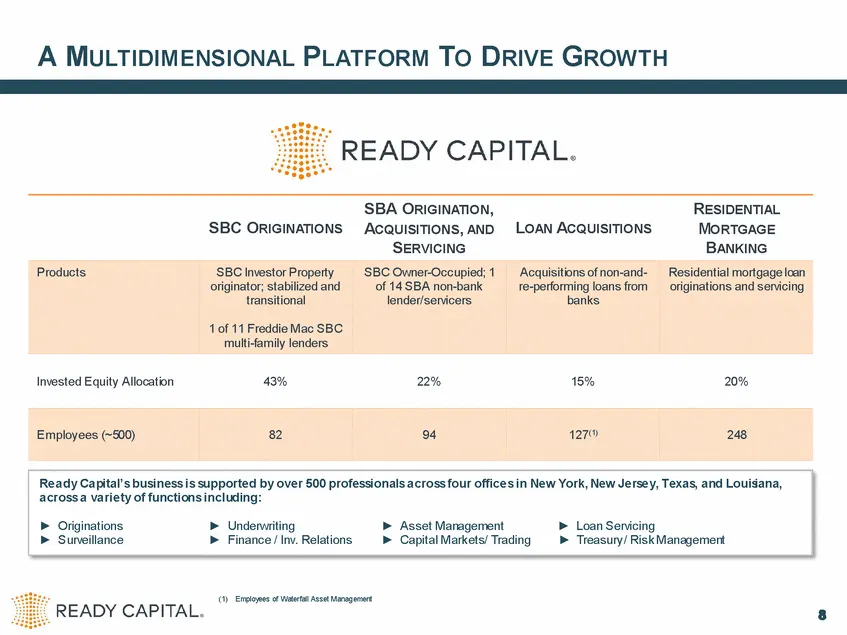
A MULTIDIMENSIONAL PLATFORM TO DRIVE GROWTH SBA ORIGINATION, ACQUISITIONS, AND SERVICING RESIDENTIAL MORTGAGE BANKING SBC ORIGINATIONS LOAN ACQUISITIONS Invested Equity Allocation 43% 22% 15% 20% (1) Employees of Waterfall Asset Management 8 Ready Capital’s business is supported by over 500 professi
Slide 8: Generation of Shareholder Value Since Reverse Merger with ZAIS Financial Corp.
GENERAT ION OF SHAREHOLDER VALUE SINCE REVERSE MERGER WIT H ZAIS FINANCIAL CORP. 60.0% 50.0% 40.0% 33.9% 30.0% 29.6% 20.0% 10.0% 0.0% (10.0%) Oct-16 Jan-17 Apr-17 Jul-17 Oct-17 Jan-18 Apr-18 Jul-18 Oct-18 Peer Median (1) RC Origination Volume between Source: S&P Capital IQ; Market data as of Novembe
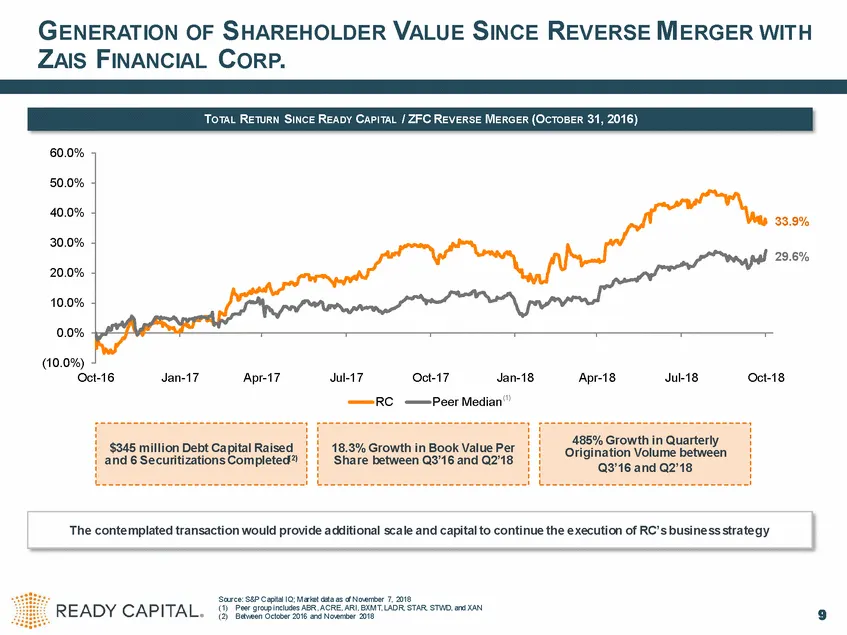
Slide 9: Generation of Shareholder Value Since Reverse Merger with ZAIS Financial Corp.
GENERATION OF SHAREHOLDER VALUE SINCE REVERSE MERGER WITH Zais FINANCIAL CORP. 93.9% 29.6% Oct-16 Jan-17 AprtT Jul7 Oct-17 Jan-18 Aprts Juk18 Oct-18 ——RC_—Peer Median’ 485% Growth in Quarterly | $245 million Debt CapitalRaised | | 18.3% Growth in Book Value Per ri sare and 6 Securitizations Complete

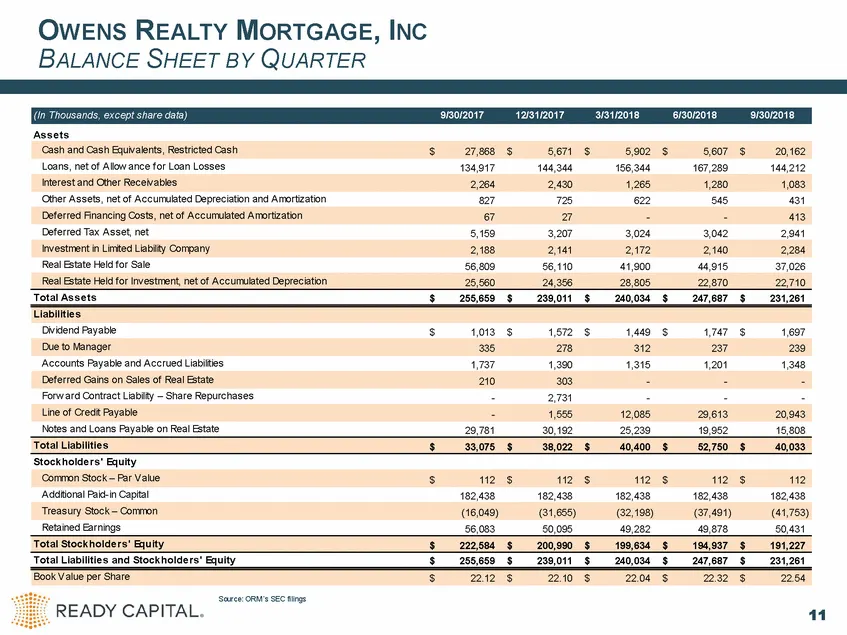
Slide 10: Owens Realty Mortgage, Inc. Balance Sheet by Quarter
OWENS REALTY MORTGAGE, BALANCE SHEET BY QUARTER INC As s e ts Loans, net of Allow ance f or Loan Losses 134,917 144,344 156,344 167,289 144,212 Other Assets, net of Accumulated Depreciation and Amortization 827 725 622 545 431 Def erred Tax Asset, net 5,159 3,207 3,024 3,042 2,941 Real Estate Held f
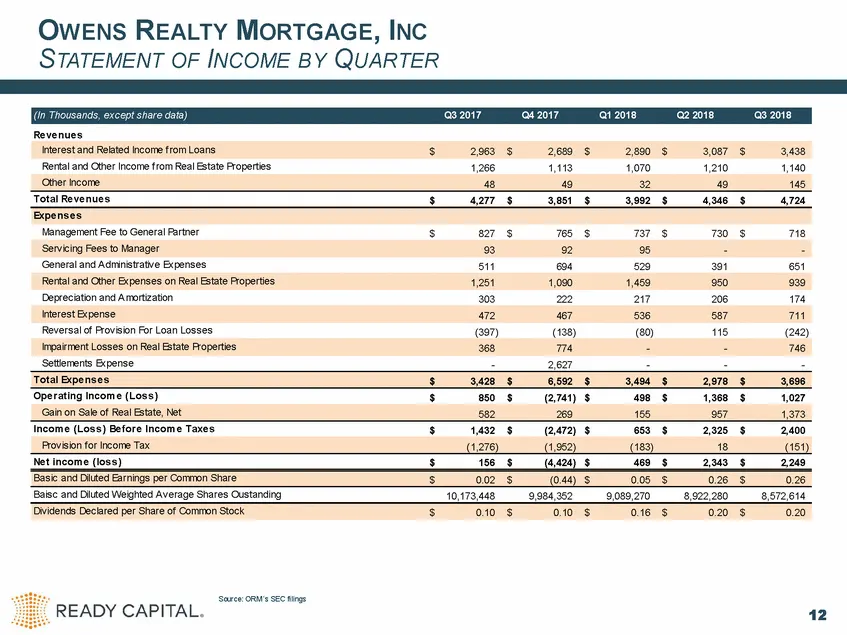
Slide 11: Owens Realty Mortgage, Inc. Statement of Income by Quarter
OWENS REALTY MORTGAGE, INC STATEMENT OF INCOME QUARTER BY Re ve nue s Rental and Other Income f rom Real Estate Properties 1,266 1,113 1,070 1,210 1,140 Total Re ve nue s $ 4,277 $ 3,851 $ 3,992 $ 4,346 $ 4,724 Management Fee to General Partner $ 827 $ 765 $ 737 $ 730 $ 718 General and Administrativ
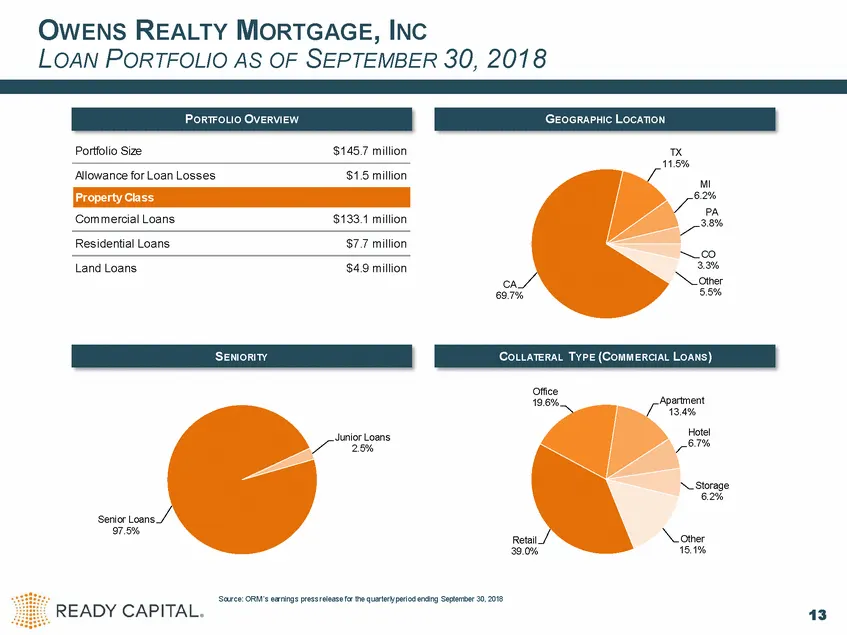
Slide 12: Owens Realty Mortgage, Inc. Loan Portfolio as of September 30, 2018
OWENS REALTY MORTGAGE, INC LOAN PORTFOLIO SEPTEMBER 30, 2018 AS OF Portfolio Size $145.7 m illion TX 11.5% Allowance for Loan Los s es $1.5 m illion MI 6.2% PA 3.8% Com m ercial Loans $133.1 m illion Res idential Loans $7.7 m illion CO 3.3% Other 5.5% Land Loans $4.9 m illion CA 69.7% Office 19.6% A
Slide 13: Owens Realty Mortgage, Inc. REO Portfolio as of September 30, 2018
OWENS REALTY MORTGAGE, INC REO PORTFOLIO SEPTEMBER 30, 2018 AS OF Held for Investment 38.0% Held for Sale 62.0% Retail 20.7% Land 26.2% Marina 4.1% Land 28.9% Office 5.3% Retail 71.1% Residential 43.7% Source: ORM’s earnings press release for the quarterly period ending September 30, 2018 Note: REO
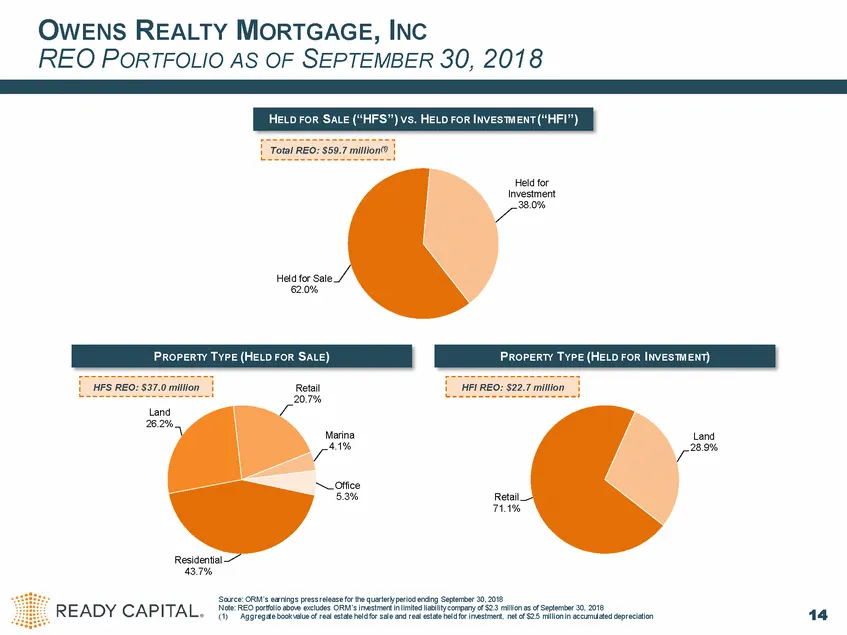
Slide 14: Owens Realty Mortgage, Inc. REO Portfolio as of September 30, 2018
OweNs REALTY MORTGAGE, INC REO PORTFOLIO AS OF SEPTEMBER 30, 2018 Helfer Sale 20% Property TYPE (HELD FOR SALE) Property TyPE (HELD FOR INVESTMENT) Leng 289% Residential aar% asd ete 14 READY CAPITAL.

Slide 15: Ready Capital
HEE READY SEES. CAPITAL.
Source: SEC EDGAR · 425 filed Nov 8, 2018
More decks from Owens Realty Mortgage Inc
 Q4 2018 Earnings Presentation24 slides · Mar 12, 2019
 Proxy Contest (June 2018)35 slides · Jun 28, 2018
 Proxy Contest (June 2018)30 slides · Jun 26, 2018
 Investor Presentation (December 2016)19 slides · Dec 8, 2016
 Investor Presentation (May 2016)20 slides · May 23, 2016
 Investor Presentation (December 2014)27 slides · Dec 1, 2014