Owens Realty Mortgage — Investor Presentation (December 2016)
19 slides from Owens Realty Mortgage's investor presentation, Dec 8, 2016
Slide 1: Investor Presentation Q3 2016
Investor Presentation Q3 2016
Slide 2: Important Notice
IMPORTANT NOTICE:This presentation contains forward-looking statements, within the meaning of the safe harbor provisions of the United States Private Securities Litigation Reform Act of 1995 (the “Reform Act”). All such forward-looking statements are intended to be subject to the safe harbor and oth
Slide 3: Company Overview
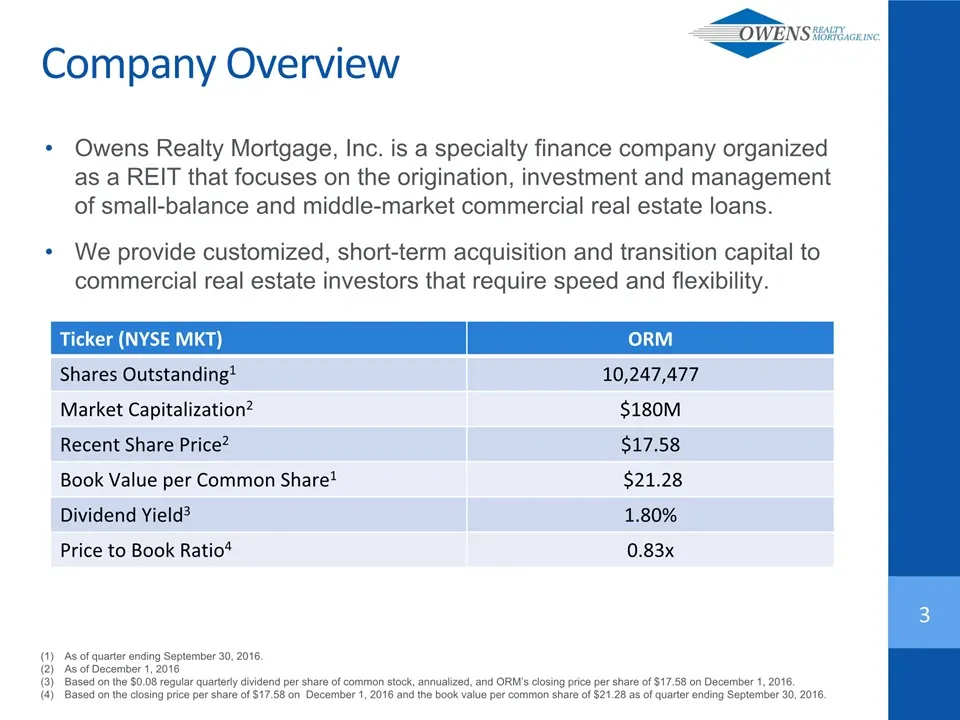
Ticker (NYSE MKT) ORM Shares Outstanding1 10,247,477 Market Capitalization2 $180M Recent Share Price2 $17.58 Book Value per Common Share1 $21.28 Dividend Yield3 1.80% Price to Book Ratio4 0.83x 3 As of quarter ending September 30, 2016.As of December 1, 2016Based on the $0.08 regular quarterly divid
Slide 4: Company Overview
4 Company Overview During recession, beginning in 2009, foreclosed on 50%+ of loan portfolio, LP redemptions and lending activity suspended. During recovery repositioned and improved real estate assets, maximizing potential market value. In May 2013, ORM completed a reorganization into a publicly-tr
Slide 5: Our Strategy
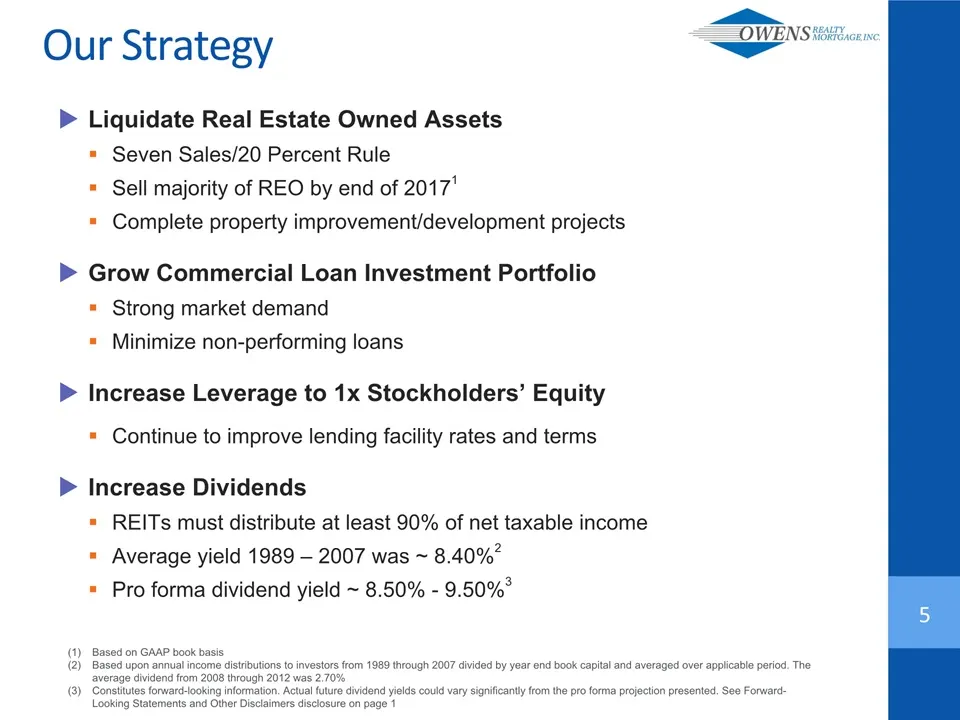
5 Our Strategy Liquidate Real Estate Owned AssetsSeven Sales/20 Percent RuleSell majority of REO by end of 20171Complete property improvement/development projectsGrow Commercial Loan Investment PortfolioStrong market demandMinimize non-performing loansIncrease Leverage to 1x Stockholders’ EquityCont
Slide 6: Investment Opportunity
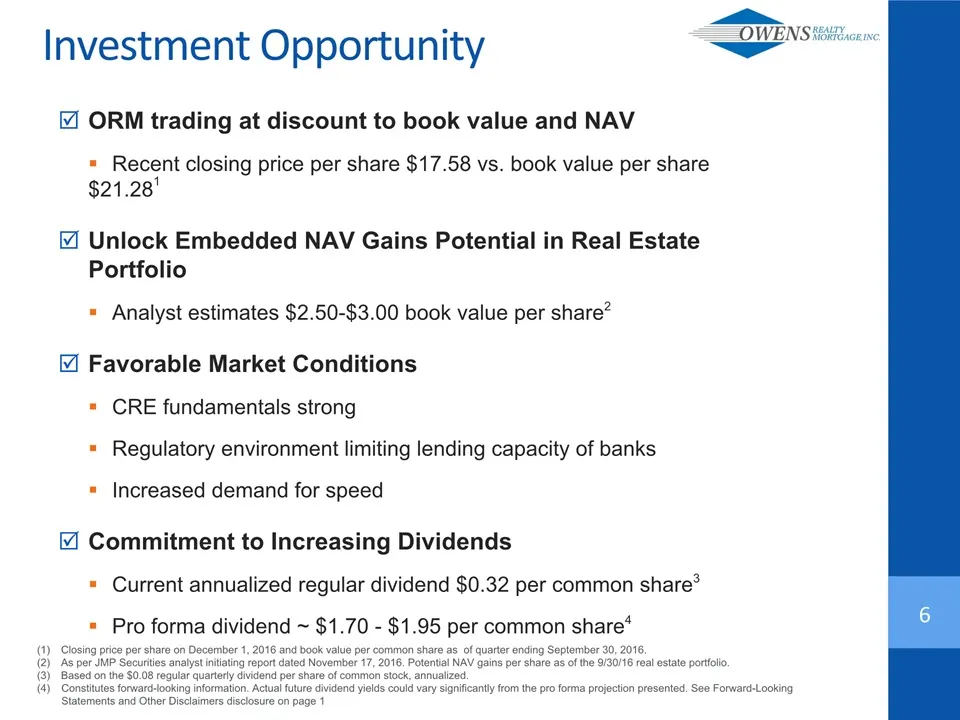
6 Investment Opportunity ORM trading at discount to book value and NAVRecent closing price per share $17.58 vs. book value per share $21.281Unlock Embedded NAV Gains Potential in Real Estate PortfolioAnalyst estimates $2.50-$3.00 book value per share2Favorable Market ConditionsCRE fundamentals stron
Slide 7: Significant Progress Since 2015
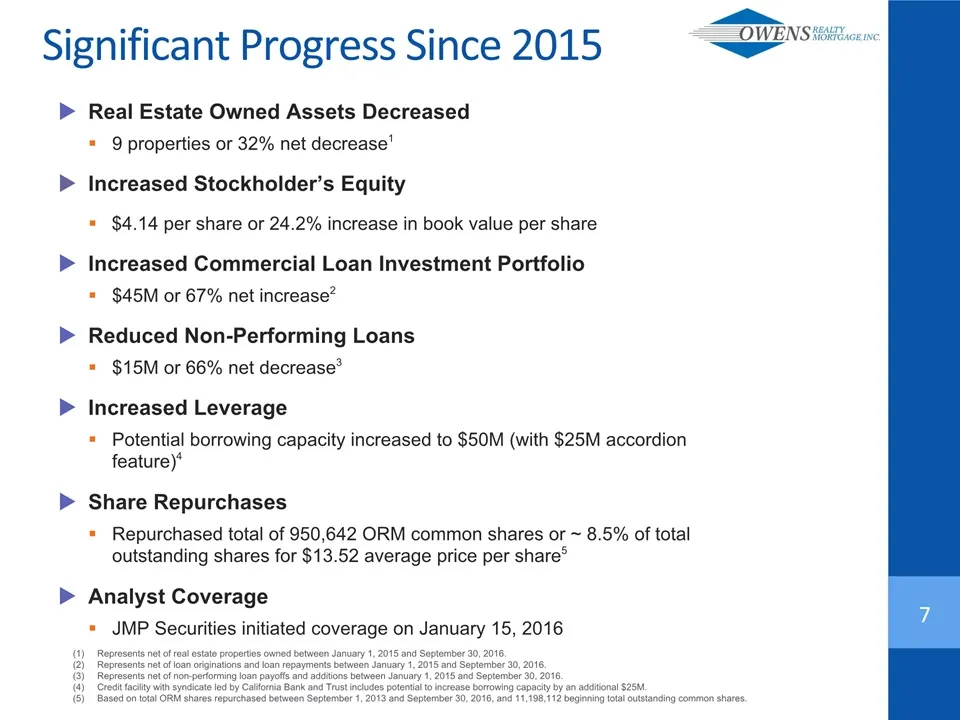
7 Significant Progress Since 2015 Real Estate Owned Assets Decreased9 properties or 32% net decrease1Increased Stockholder’s Equity$4.14 per share or 24.2% increase in book value per shareIncreased Commercial Loan Investment Portfolio$45M or 67% net increase2 Reduced Non-Performing Loans$15M or 66%
Slide 8: Small Balance Commercial (SBC) Market
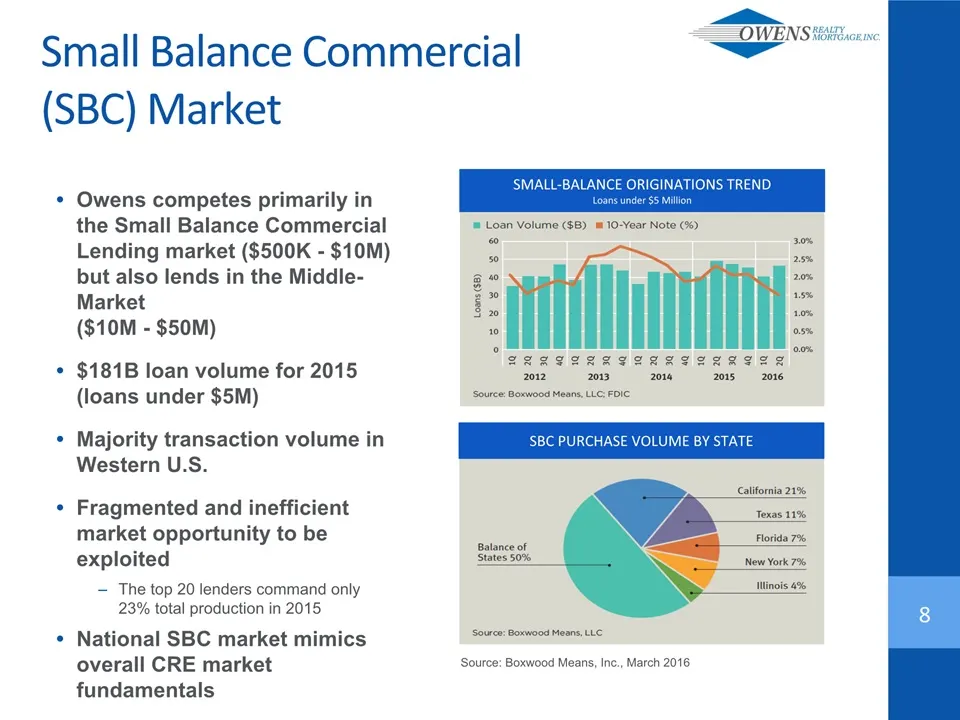
Owens competes primarily in the Small Balance Commercial Lending market ($500K - $10M) but also lends in the Middle-Market ($10M - $50M)$181B loan volume for 2015 (loans under $5M)Majority transaction volume in Western U.S.Fragmented and inefficient market opportunity to be exploitedThe top 20 lende
Slide 9: Commercial Real Estate (CRE) Market
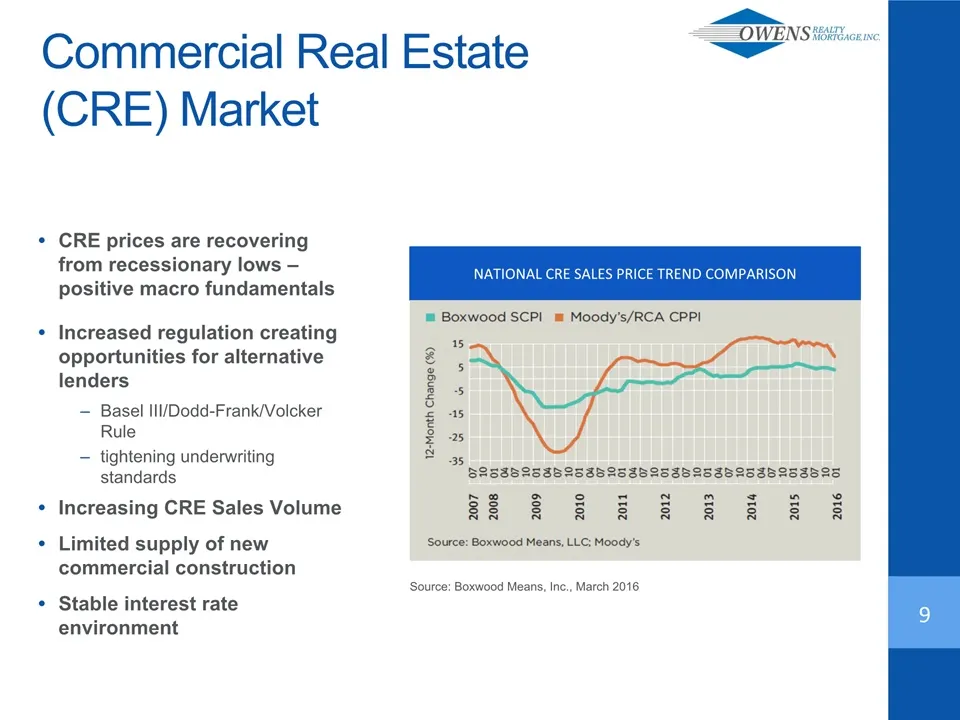
9 CRE prices are recovering from recessionary lows – positive macro fundamentalsIncreased regulation creating opportunities for alternative lendersBasel III/Dodd-Frank/Volcker Ruletightening underwriting standardsIncreasing CRE Sales VolumeLimited supply of new commercial constructionStable interest
Slide 10: Competitive Advantage
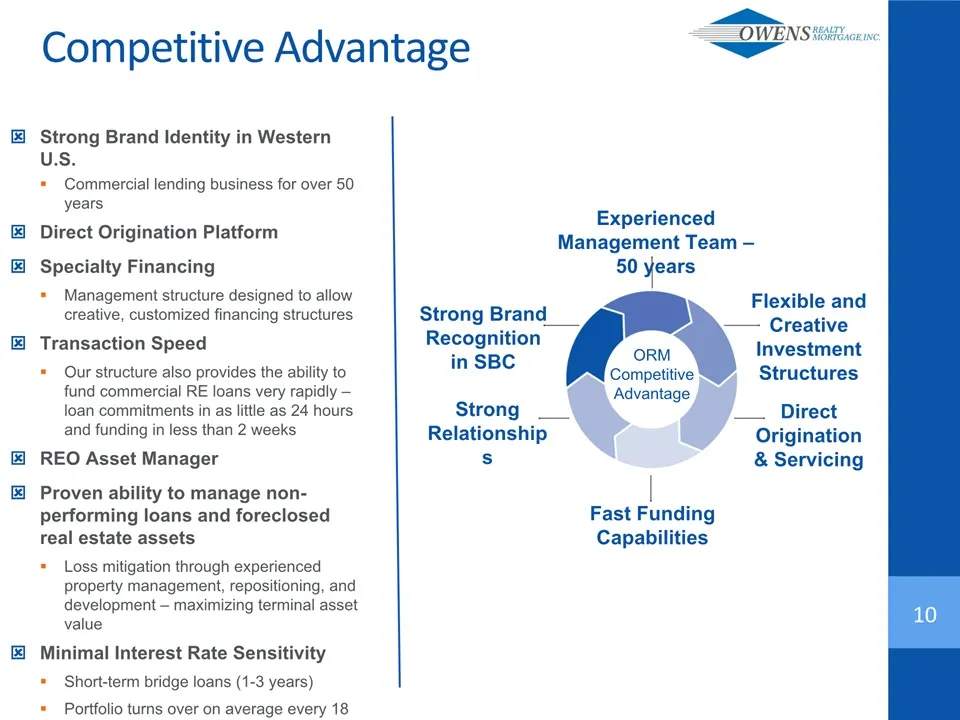
10 Competitive Advantage ORMCompetitive Advantage Experienced Management Team – 50 years Flexible and Creative Investment Structures Strong Brand Recognition in SBC Strong Relationships Fast Funding Capabilities Direct Origination & Servicing Strong Brand Identity in Western U.S.Commercial lending b
Slide 11: Investment Strategy: Loan Investment Profile
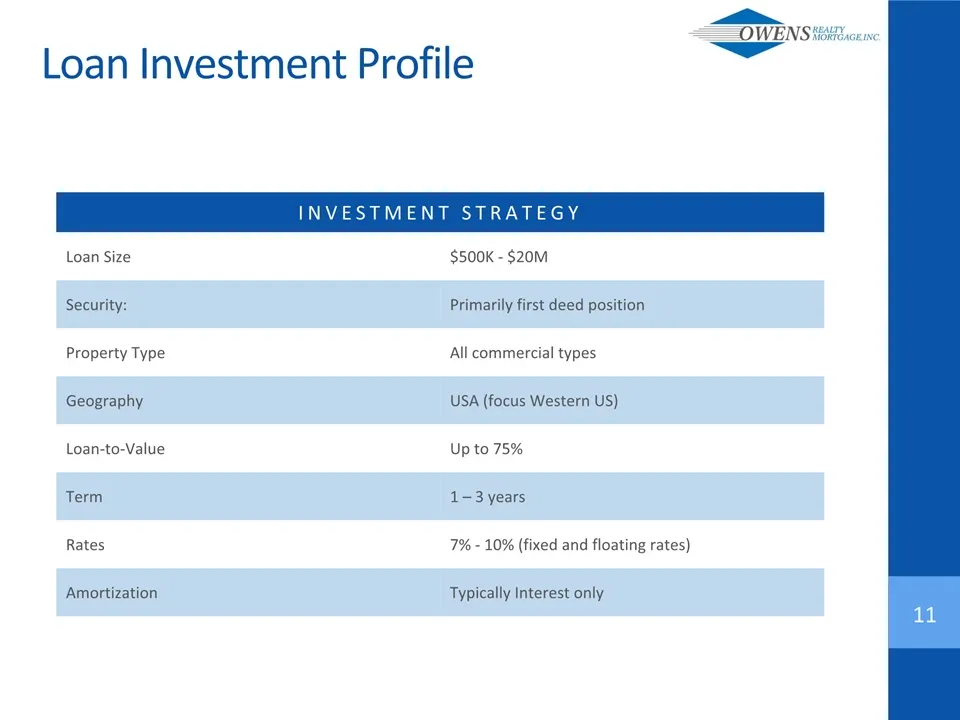
11 INVESTMENT STRATEGY Loan Size $500K ‐ $20M Security: Primarily first deed position Property Type All commercial types Geography USA (focus Western US) Loan-to-Value Up to 75% Term 1 – 3 years Rates 7% - 10% (fixed and floating rates) Amortization Typically Interest only Loan Investment Profile
Slide 12: Sample Transaction: University Plaza, Santa Clara CA
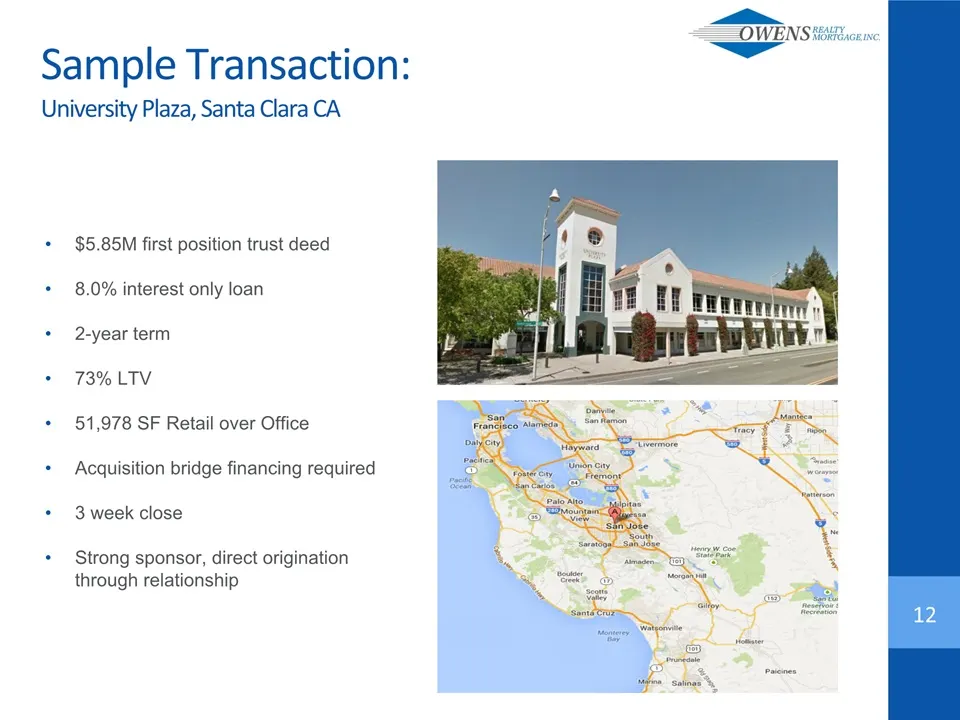
12 Sample Transaction:University Plaza, Santa Clara CA $5.85M first position trust deed8.0% interest only loan2-year term73% LTV51,978 SF Retail over OfficeAcquisition bridge financing required 3 week closeStrong sponsor, direct origination through relationship
Slide 13: Loan Portfolio Overview
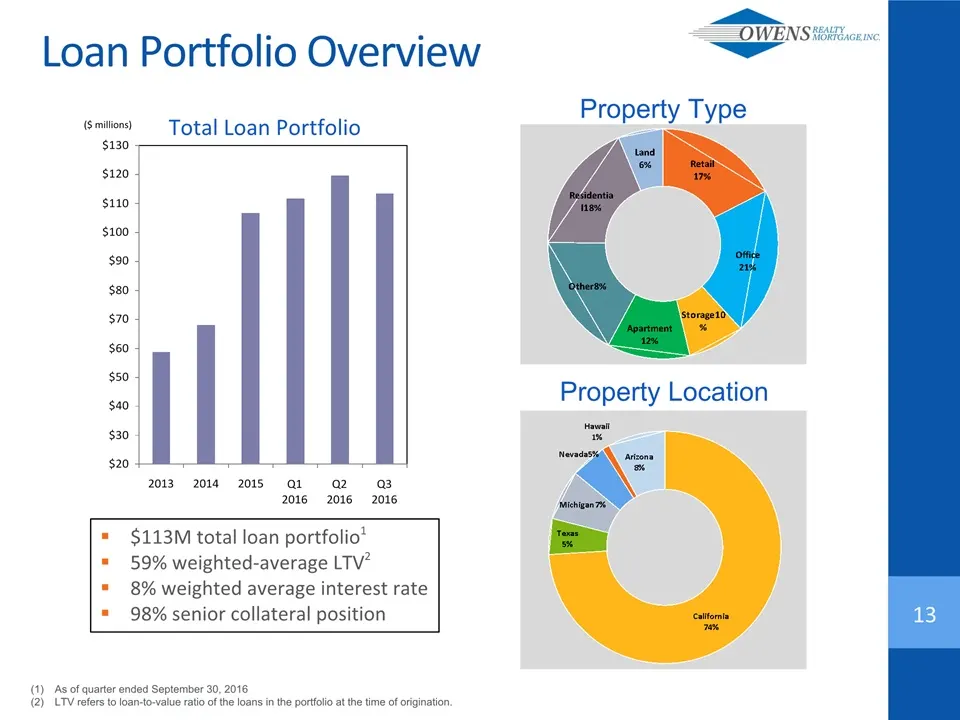
Property Location 13 As of quarter ended September 30, 2016LTV refers to loan-to-value ratio of the loans in the portfolio at the time of origination. Property Type Loan Portfolio Overview ($ millions) Total Loan Portfolio $113M total loan portfolio159% weighted-average LTV28% weighted average inter
Slide 14: Real Estate Portfolio Overview
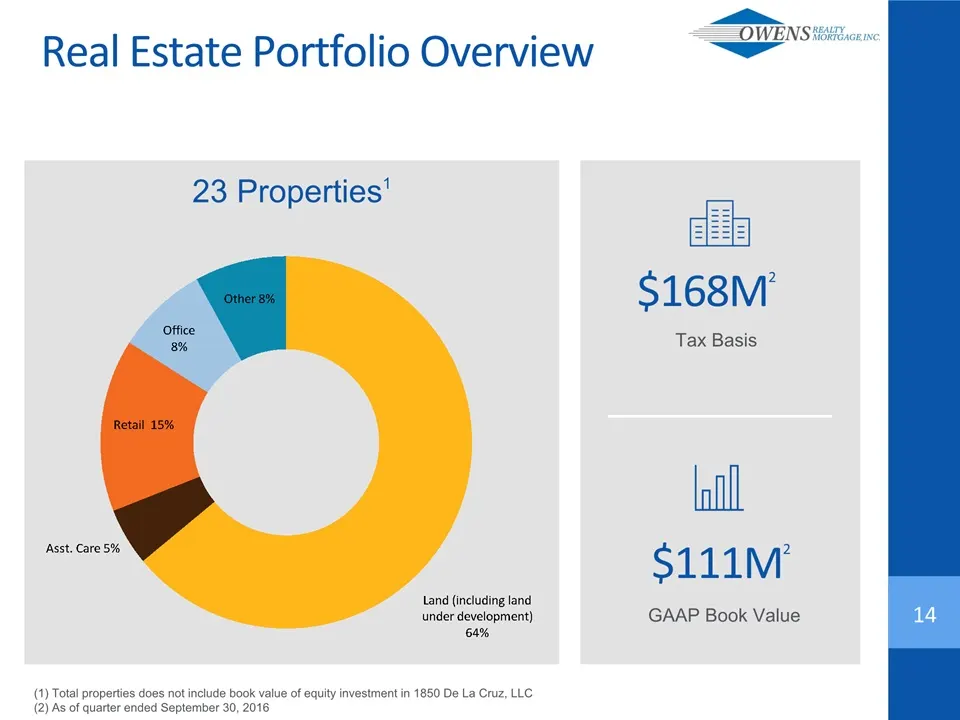
Real Estate Portfolio Overview Tax Basis 14 23 Properties1 (1) Total properties does not include book value of equity investment in 1850 De La Cruz, LLC(2) As of quarter ended September 30, 2016 $168M2 GAAP Book Value $111M2
Slide 15: Property at Lake Tahoe, South Lake Tahoe, CA
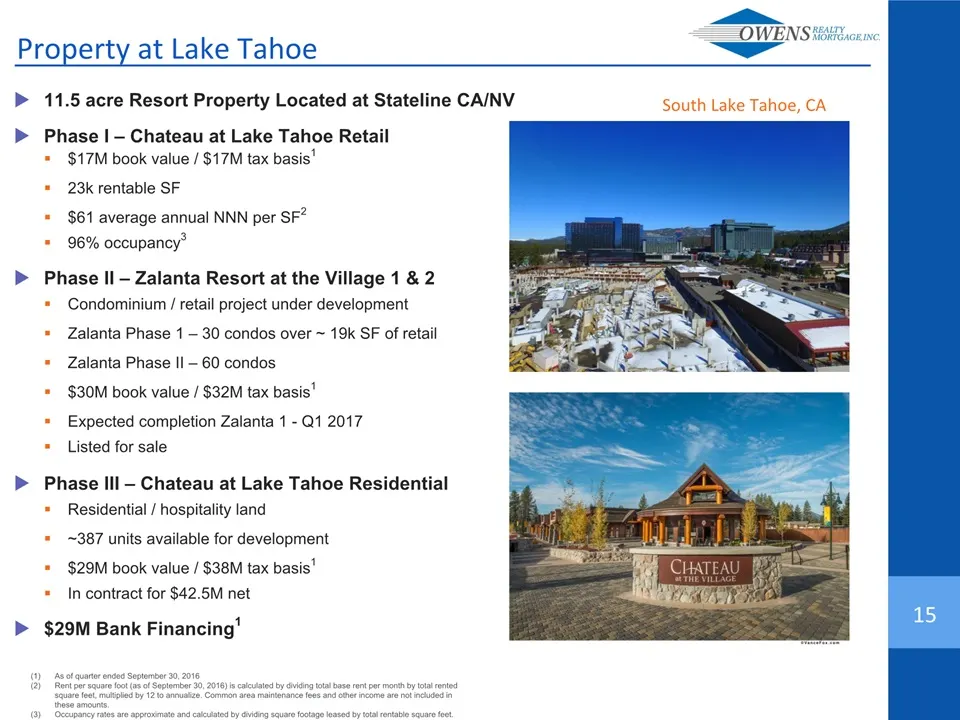
11.5 acre Resort Property Located at Stateline CA/NVPhase I – Chateau at Lake Tahoe Retail $17M book value / $17M tax basis123k rentable SF$61 average annual NNN per SF296% occupancy3Phase II – Zalanta Resort at the Village 1 & 2Condominium / retail project under developmentZalanta Phase 1 – 30 cond
Slide 16: Investment Highlights
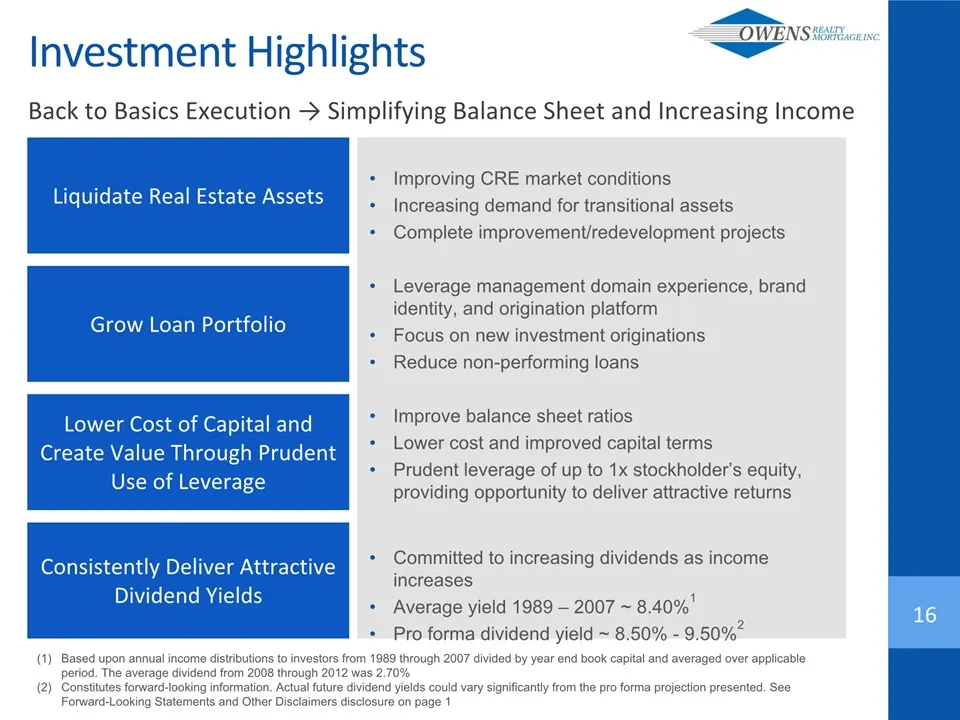
16 Investment Highlights Back to Basics Execution → Simplifying Balance Sheet and Increasing Income Liquidate Real Estate Assets Grow Loan Portfolio Lower Cost of Capital and Create Value Through Prudent Use of Leverage Consistently Deliver Attractive Dividend Yields Improving CRE market conditionsI
Slide 17: Appendix
> nN = OWENS: —_ Appendix
Slide 18: Corporate and Portfolio Timeline: Pre-2008 to 2013
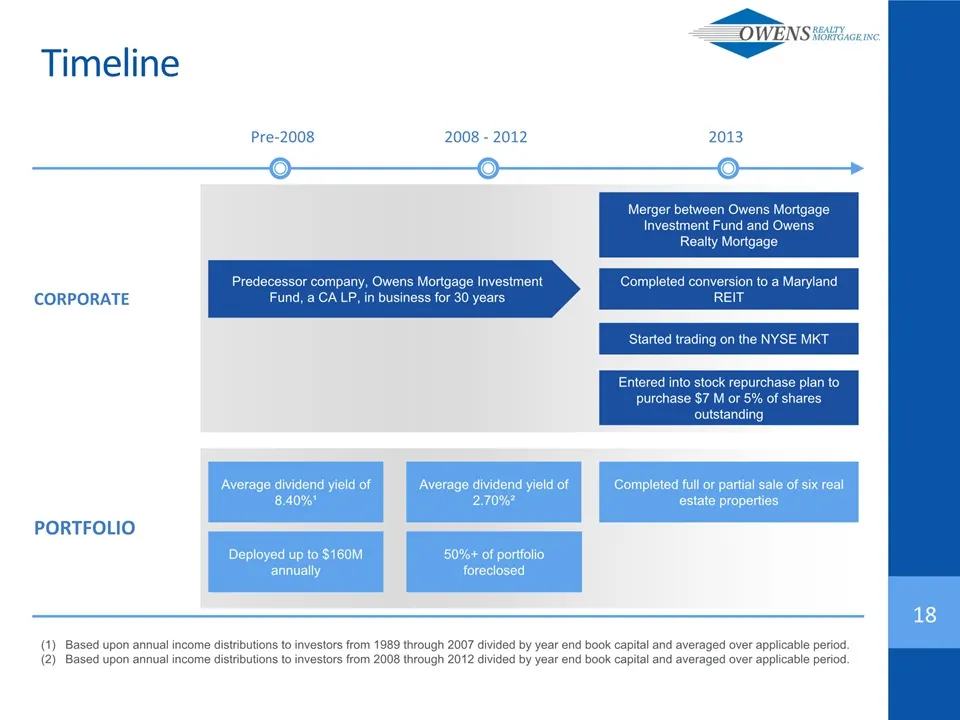
Pre-2008 2008 - 2012 2013 CORPORATE PORTFOLIO Timeline 18 Average dividend yield of 8.40%¹ Deployed up to $160M annually Completed conversion to a Maryland REIT Started trading on the NYSE MKT Entered into stock repurchase plan to purchase $7 M or 5% of shares outstanding Completed full or partial s
Slide 19: Corporate and Portfolio Timeline: 2014 to 2016
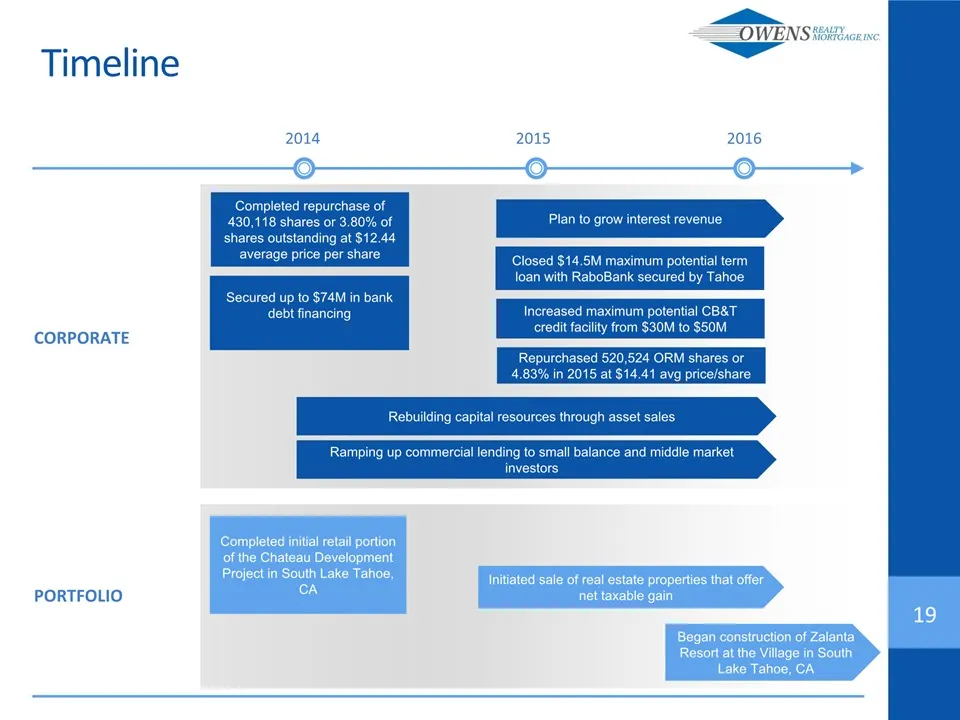
2014 2015 2016 CORPORATE PORTFOLIO 19 Initiated sale of real estate properties that offer net taxable gain Ramping up commercial lending to small balance and middle market investors Secured up to $74M in bank debt financing Rebuilding capital resources through asset sales Plan to grow interest reven
Source: SEC EDGAR · 8-K filed Dec 8, 2016
More decks from Owens Realty Mortgage Inc
 Q4 2018 Earnings Presentation24 slides · Mar 12, 2019
 Merger or Acquisition (November 2018)15 slides · Nov 8, 2018
 Proxy Contest (June 2018)35 slides · Jun 28, 2018
 Proxy Contest (June 2018)30 slides · Jun 26, 2018
 Investor Presentation (May 2016)20 slides · May 23, 2016
 Investor Presentation (December 2014)27 slides · Dec 1, 2014