goeasy Ltd. · TSX:GSY
goeasy — Q3 2026 Earnings Presentation
28 slides from goeasy's earnings presentation, Nov 11, 2026

Slide 1: Investor Presentation Third Quarter 2026
INVESTOR PRESENTATION THIRD QUARTER 2026 NOVEMBER 11, 2026
Slide 2: Important Information: Caution Regarding Forward-Looking Statements
Important Information Caution Regarding Forward -Looking Statements This presentation includes forward -looking statements about goeasy Ltd. (the “Company”) including, but not limited to, its business operations, strategy and expected financial performance and condition. Forward -looking statements
Slide 3: Important Information: Caution Regarding Forward-Looking Statements
Important Information Caution Regarding Forward -Looking Statements The Company particularly cautions that the Q4 2026 outlook presented below under the heading “Outlook” (the “2026 Outlook Inf orm ation”) constitutes forward -looking information and that in formulating its outlook, the Company make
Slide 4: Important Information: Restatement of Historical Financial Information
Important Information Restatement of Historical Financial Information As previously disclosed, subsequent to the year -ended December 31, 2025, the Company identified errors in certain financial info rmation for prior periods, which has caused the Company to restate its financial information as at a
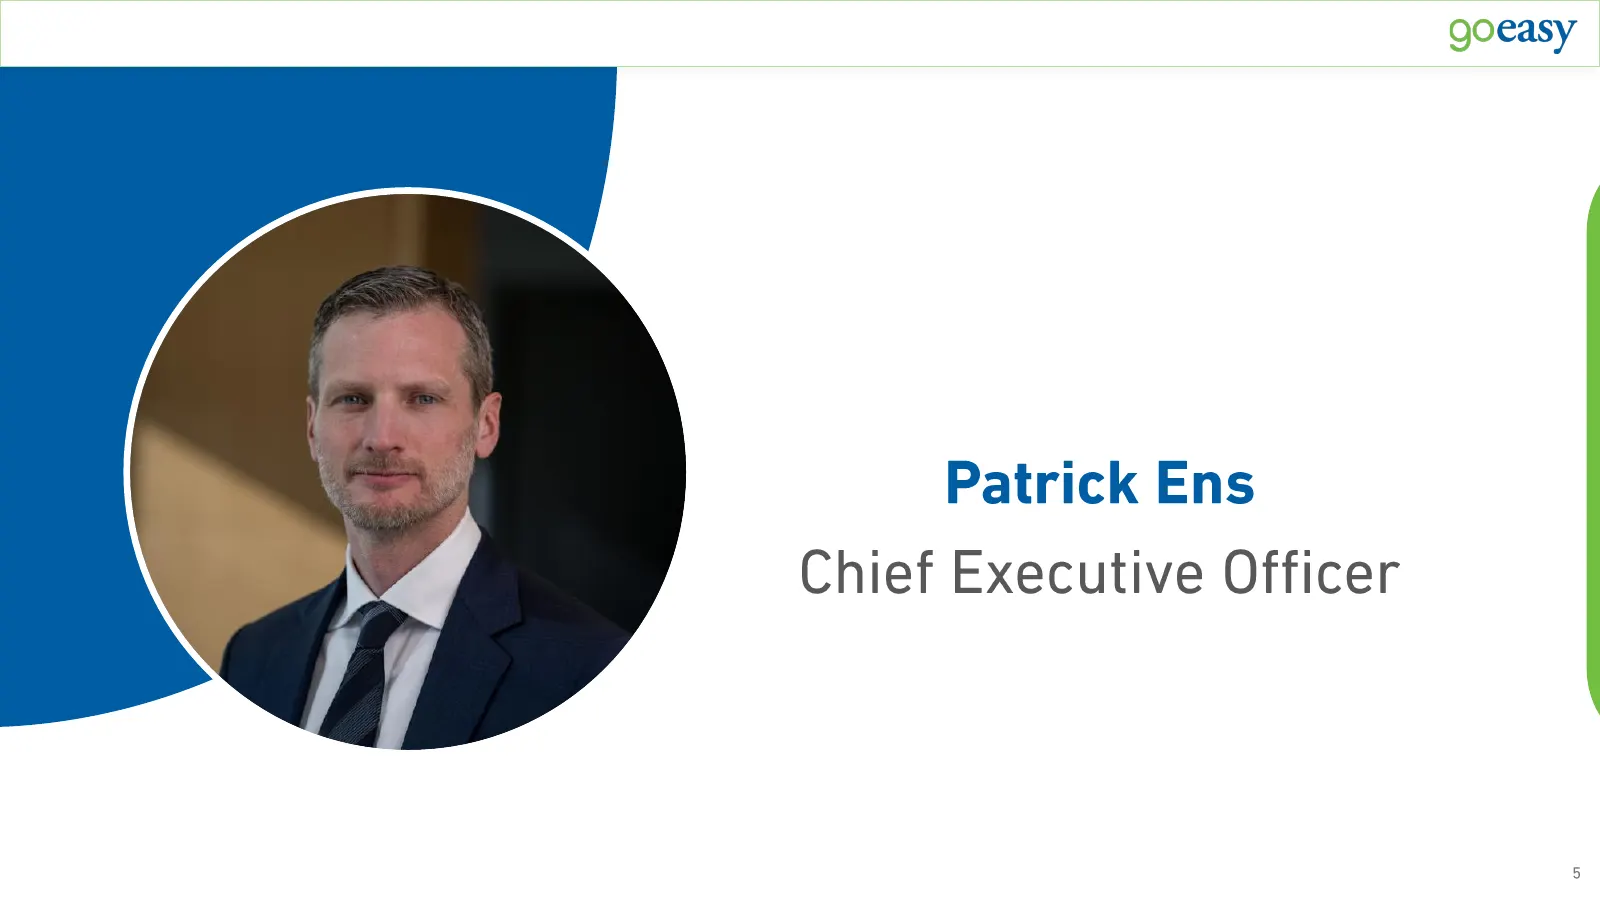
Slide 5: Patrick Ens, Chief Executive Officer
Patrick Ens Chief Executive Officer 5
Slide 6: Key Takeaways
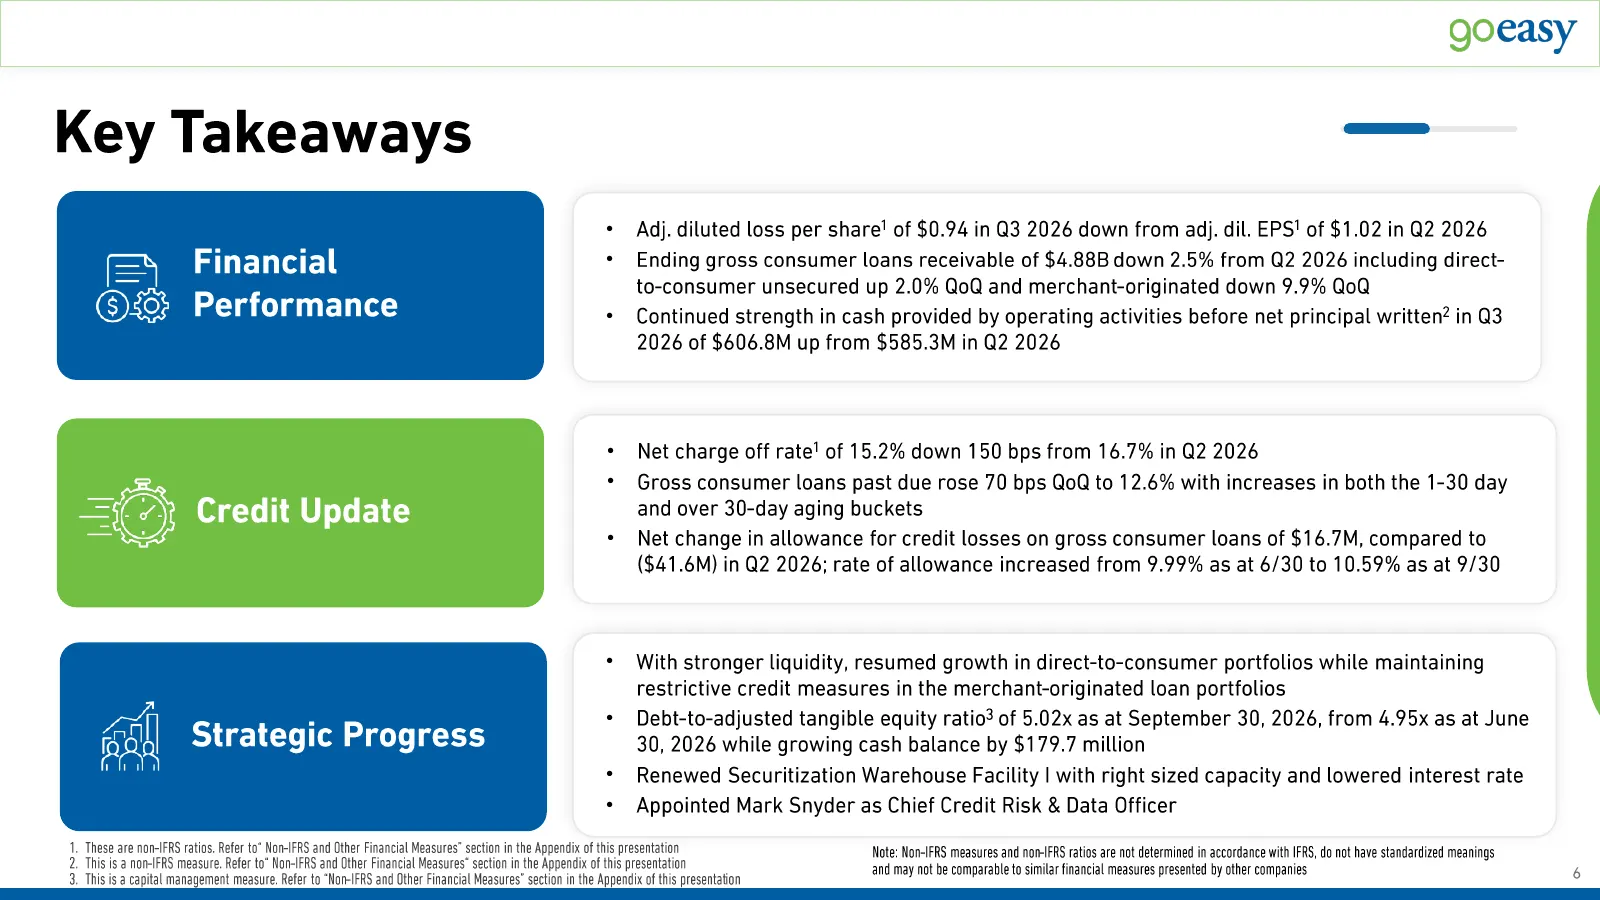
Key Takeaways • Adj. diluted loss per share 1 of $0.94 in Q3 2026 down from adj. dil. EPS 1 of $1.02 in Q2 2026 Financial • Ending gross consumer loans receivable of $4.88B down 2.5% from Q2 2026 including direct - to-consumer unsecured up 2.0% QoQ and merchant -originated down 9.9% QoQ Performance
Slide 7: Q3 Results Compared to Outlook
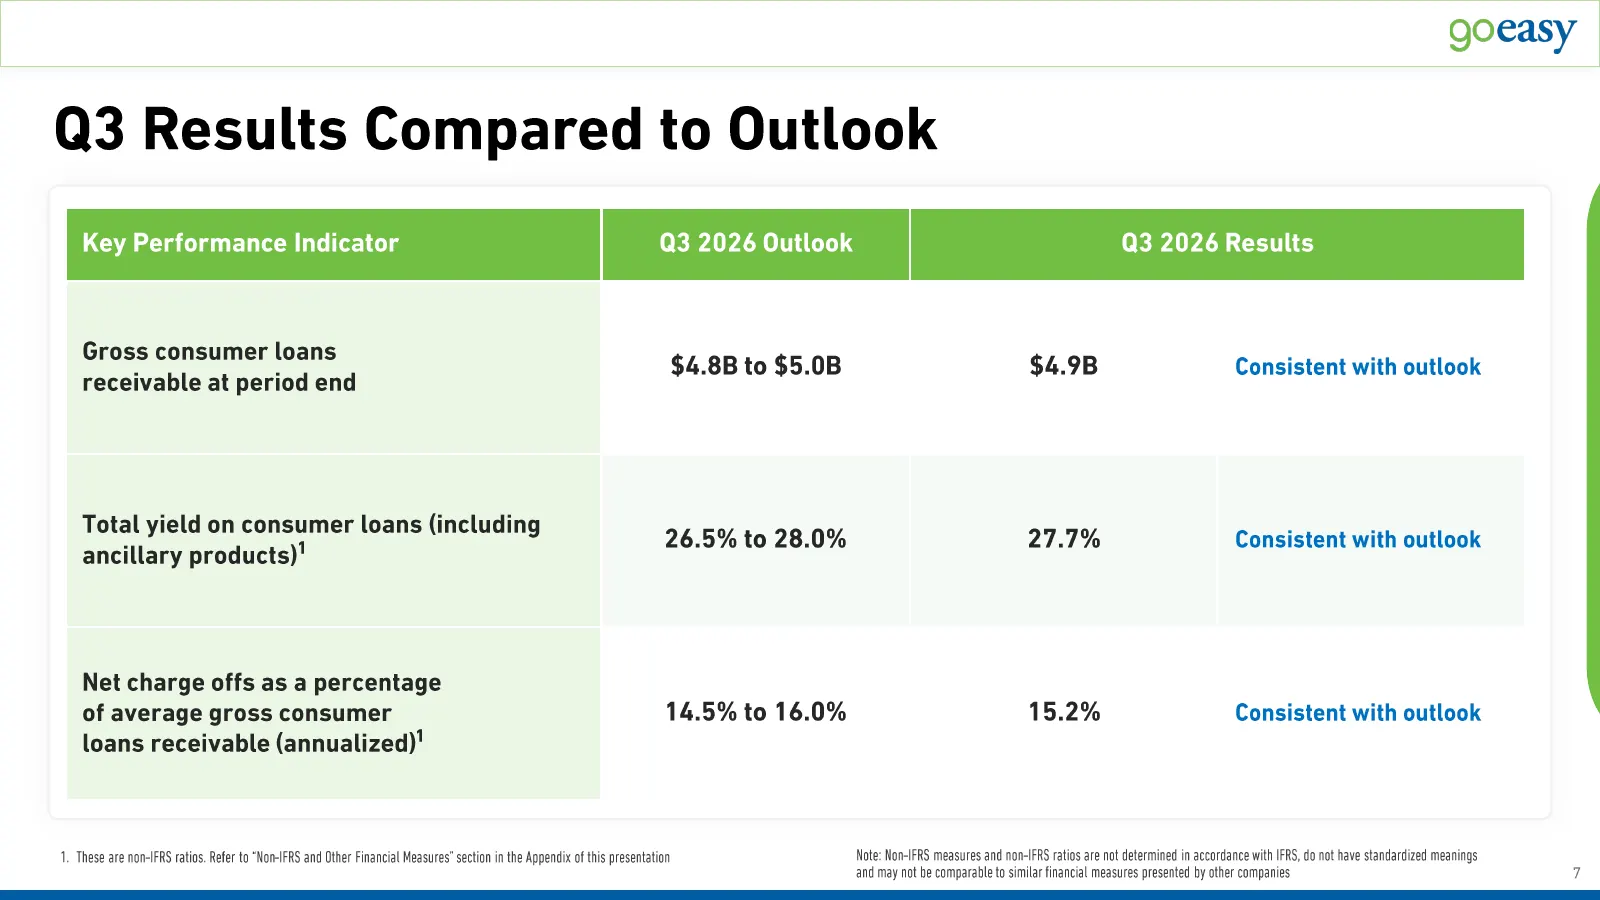
Q3 Results Compared to Outlook Key Performance Indicator Q3 2026 Outlook Q3 2026 Results Gross consumer loans $4.8B to $5.0B $4.9B Consistent with outlook receivable at period end Total yield on consumer loans (including 26.5% to 28.0% 27.7% Consistent with outlook ancillary products) 1 Net charge o
Slide 8: Direct-to-Consumer Channels are a Growing Share of the Portfolio
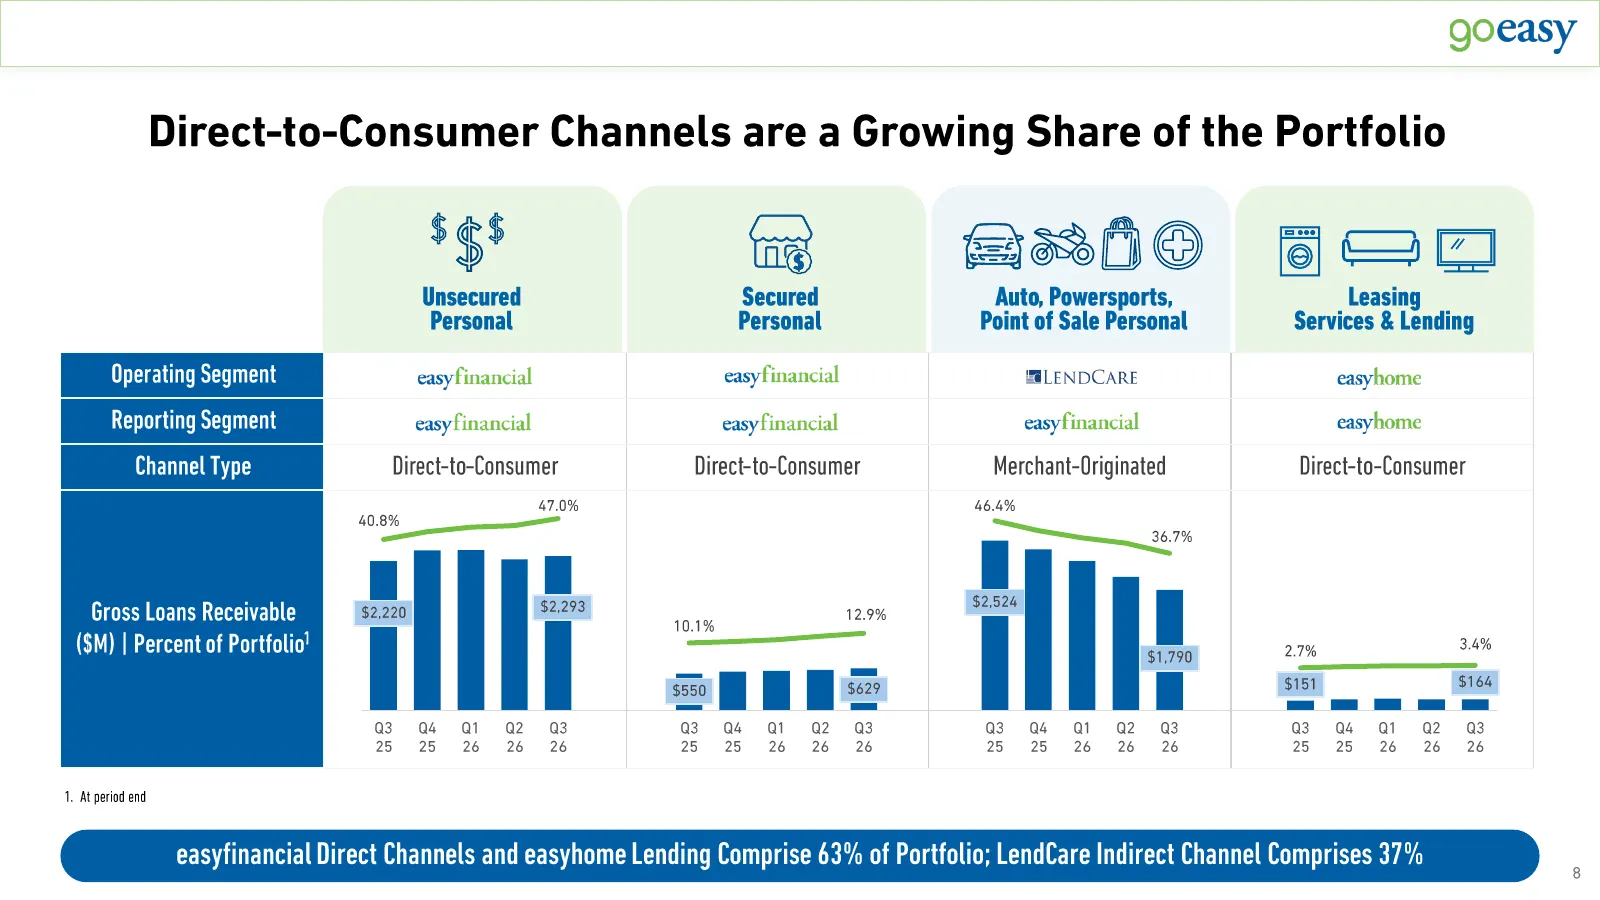
Direct -to-Consumer Channels are a Growing Share of the Portfolio Unsecured Secured Auto, Powersports, Leasing Personal Personal Point of Sale Personal Services & Lending Operating Segment Reporting Segment Channel Type Direct -to-Consumer Direct -to-Consumer Merchant -Originated Direct -to-Consumer
Slide 9: Continued Improvement in Merchant-Originated Performance
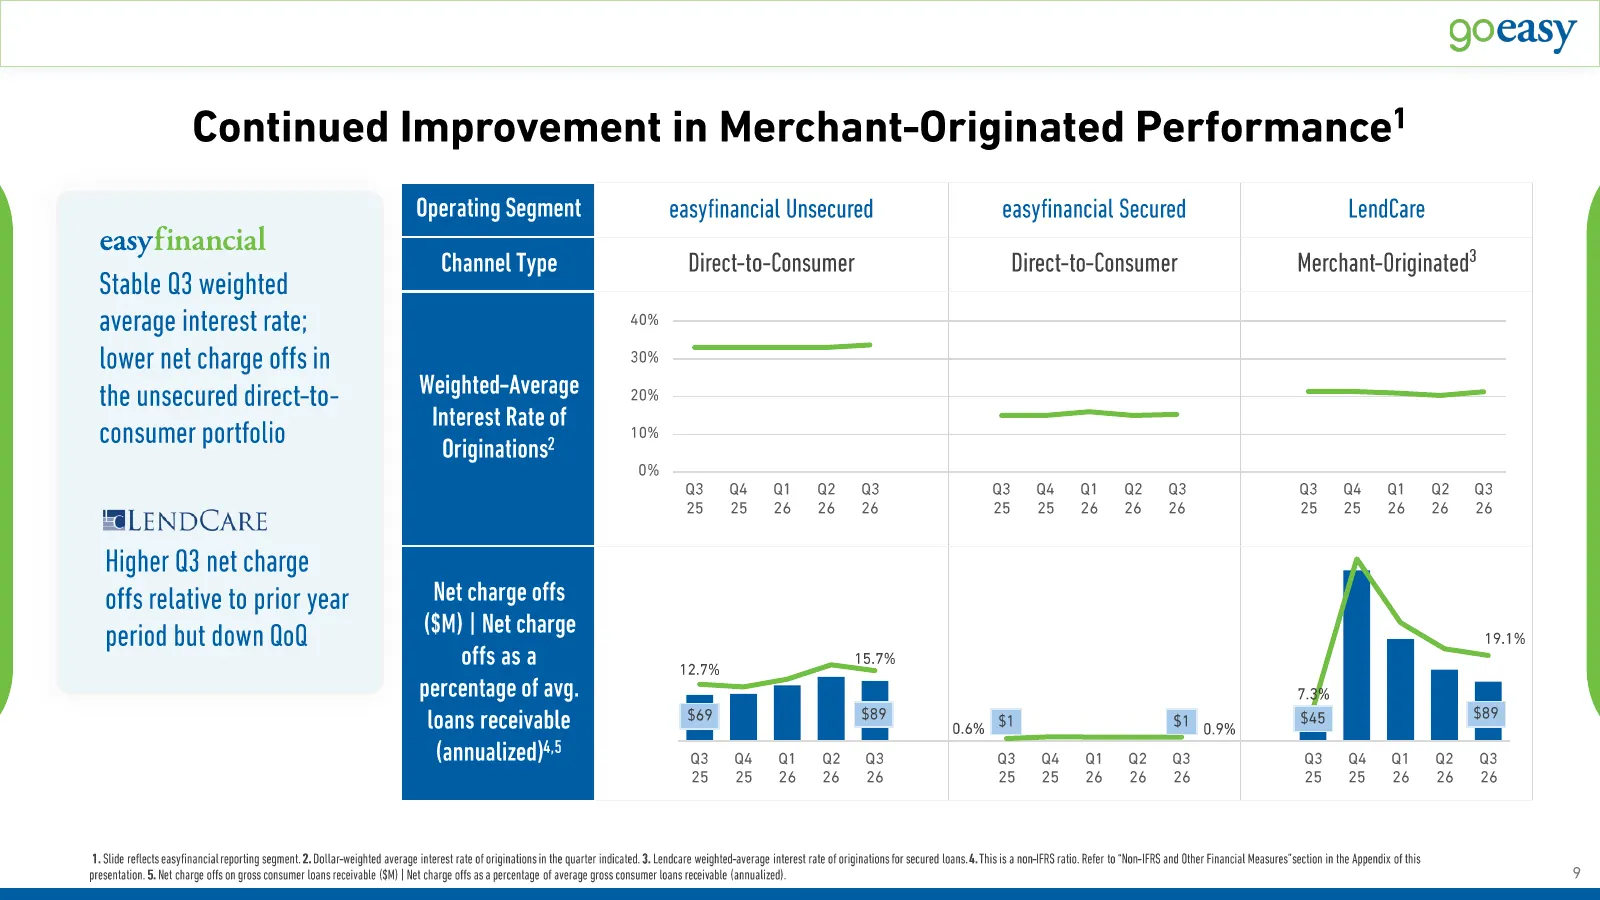
Continued Improvement in Merchant -Originated Performance 1 Operating Segment easyfinancial Unsecured easyfinancial Secured LendCare 3 Channel Type Direct -to-Consumer Direct -to-Consumer Merchant -Originated Stable Q3 weighted average interest rate; 40% lower net charge offs in 30% the unsecured di
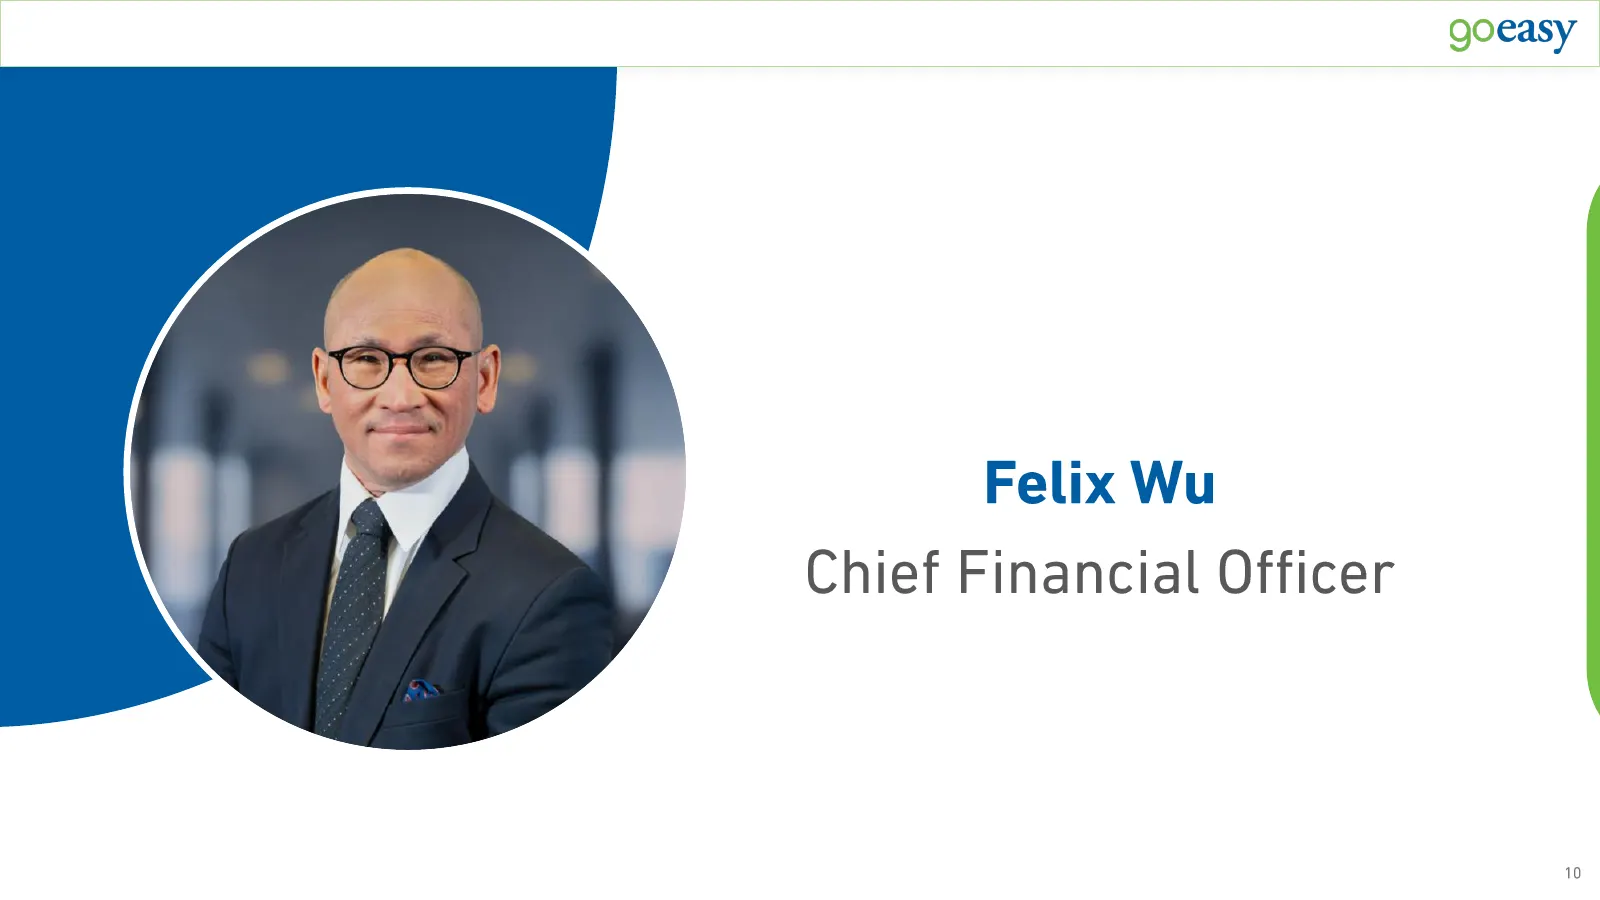
Slide 10: Felix Wu, Chief Financial Officer
Felix Wu Chief Financial Officer 10
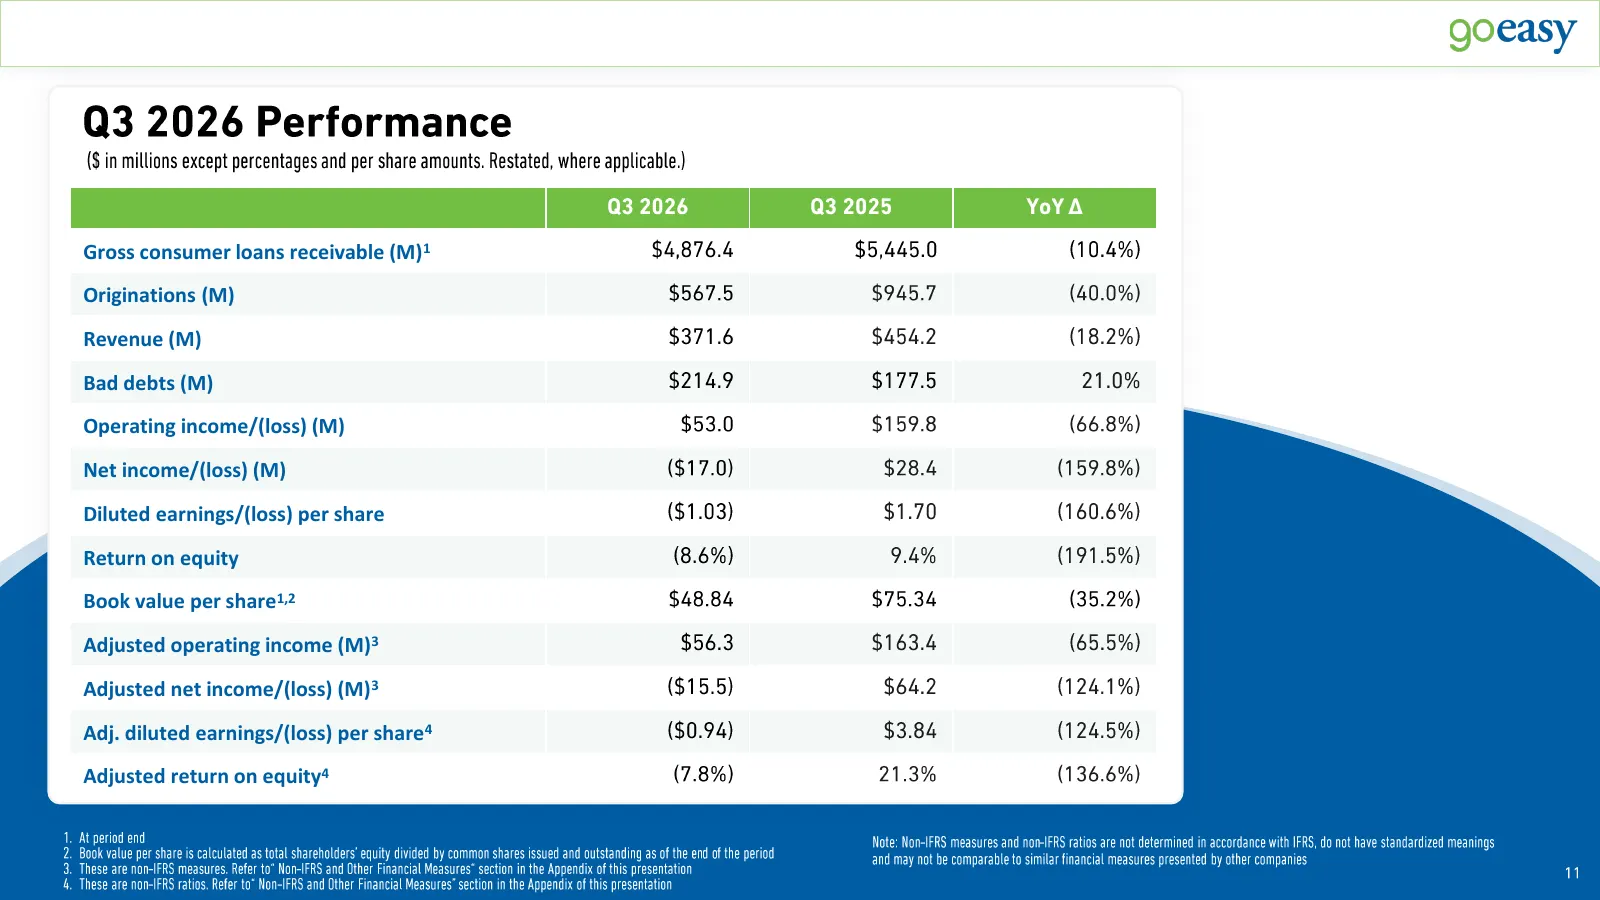
Slide 11: Q3 2026 Performance
Q3 2026 Performance ($ in millions except percentages and per share amounts. Restated, where applicable.) Q3 2026 Q3 2025 YoY ∆ Gross consumer loans receivable (M)1 $4,876.4 $5,445.0 (10.4%) Originations (M) $567.5 $945.7 (40.0%) Revenue (M) $371.6 $454.2 (18.2%) Bad debts (M) $214.9 $177.5 21.0% Op
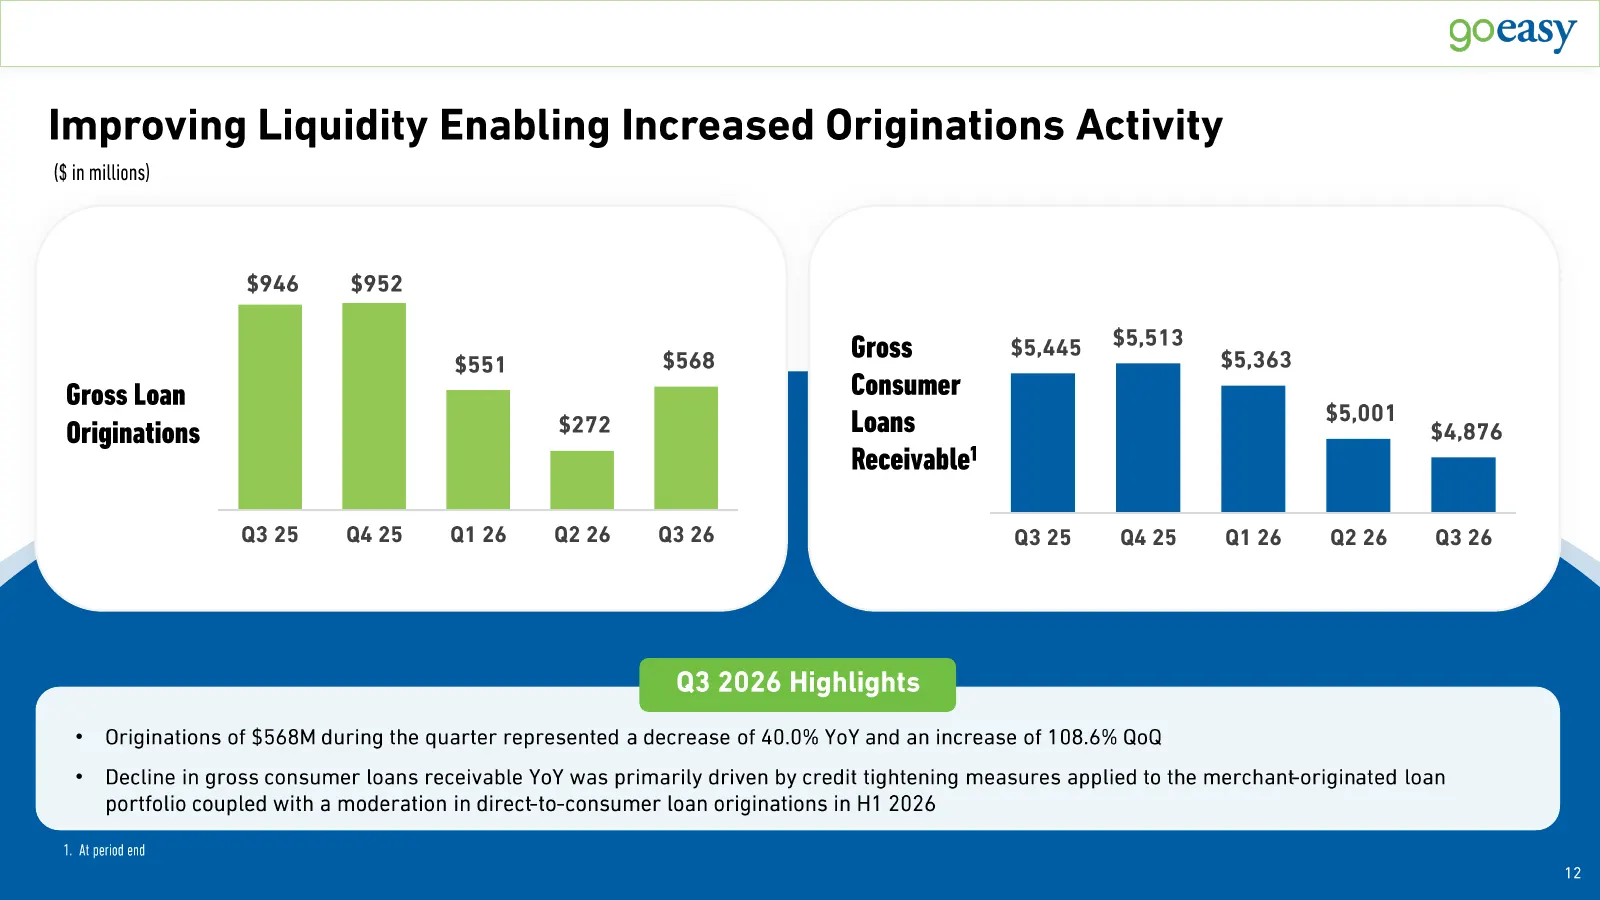
Slide 12: Improving Liquidity Enabling Increased Originations Activity
Improving Liquidity Enabling Increased Originations Activity ($ in millions) $946 $952 $5,513 $551 $568 Gross $5,445 $5,363 Gross Loan Consumer v $5,001 Originations $272 Loans $4,876 1 Receivable Q3 25 Q4 25 Q1 26 Q2 26 Q3 26 Q3 25 Q4 25 Q1 26 Q2 26 Q3 26 Q3 2026 Highlights • Originations of $568M
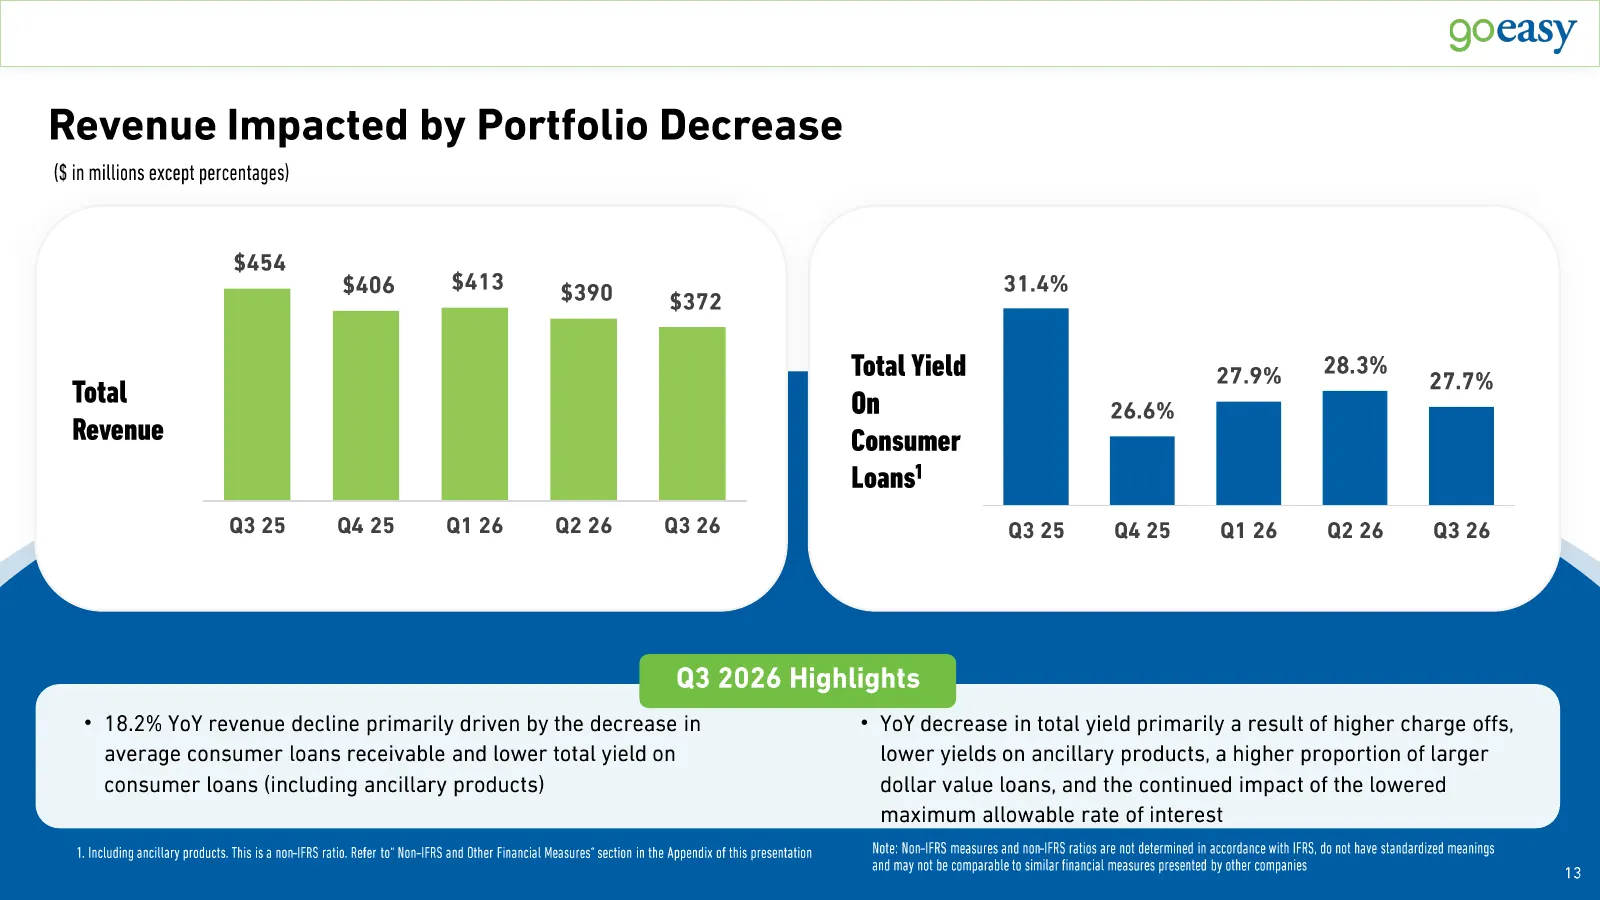
Slide 13: Revenue Impacted by Portfolio Decrease
Revenue Impacted by Portfolio Decrease ($ in millions except percentages) $454 $406 $413 $390 31.4% $372 Total Yield 27.9% 28.3% 27.7% Total v On 26.6% Revenue Consumer Loans1 Q3 25 Q4 25 Q1 26 Q2 26 Q3 26 Q3 25 Q4 25 Q1 26 Q2 26 Q3 26 Q3 2026 Highlights • 18.2% YoY revenue decline primarily driven
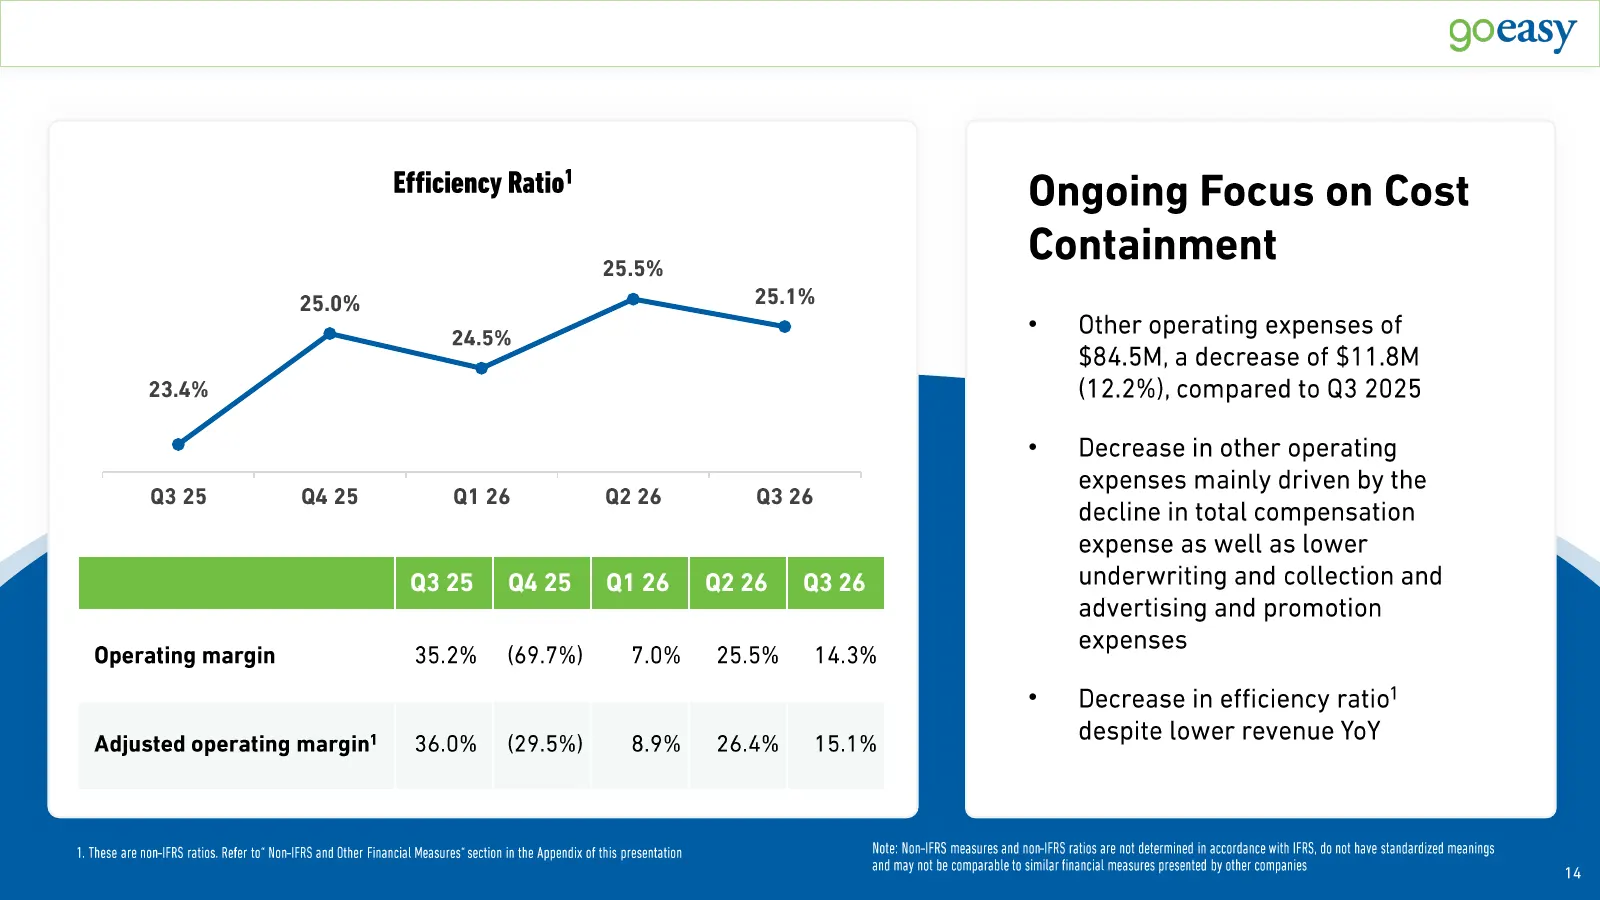
Slide 14: Ongoing Focus on Cost Containment
1 Efficiency Ratio Ongoing Focus on Cost 25.5% Containment 25.0% 25.1% 24.5% • Other operating expenses of $84.5M, a decrease of $11.8M 23.4% (12.2%), compared to Q3 2025 • Decrease OPERATINGin other operating INCOME 1OPERATING INCOME 1 expenses mainly driven by the Q3 25 Q4 25 Q1 26 Q2 26 Q3 26 dec
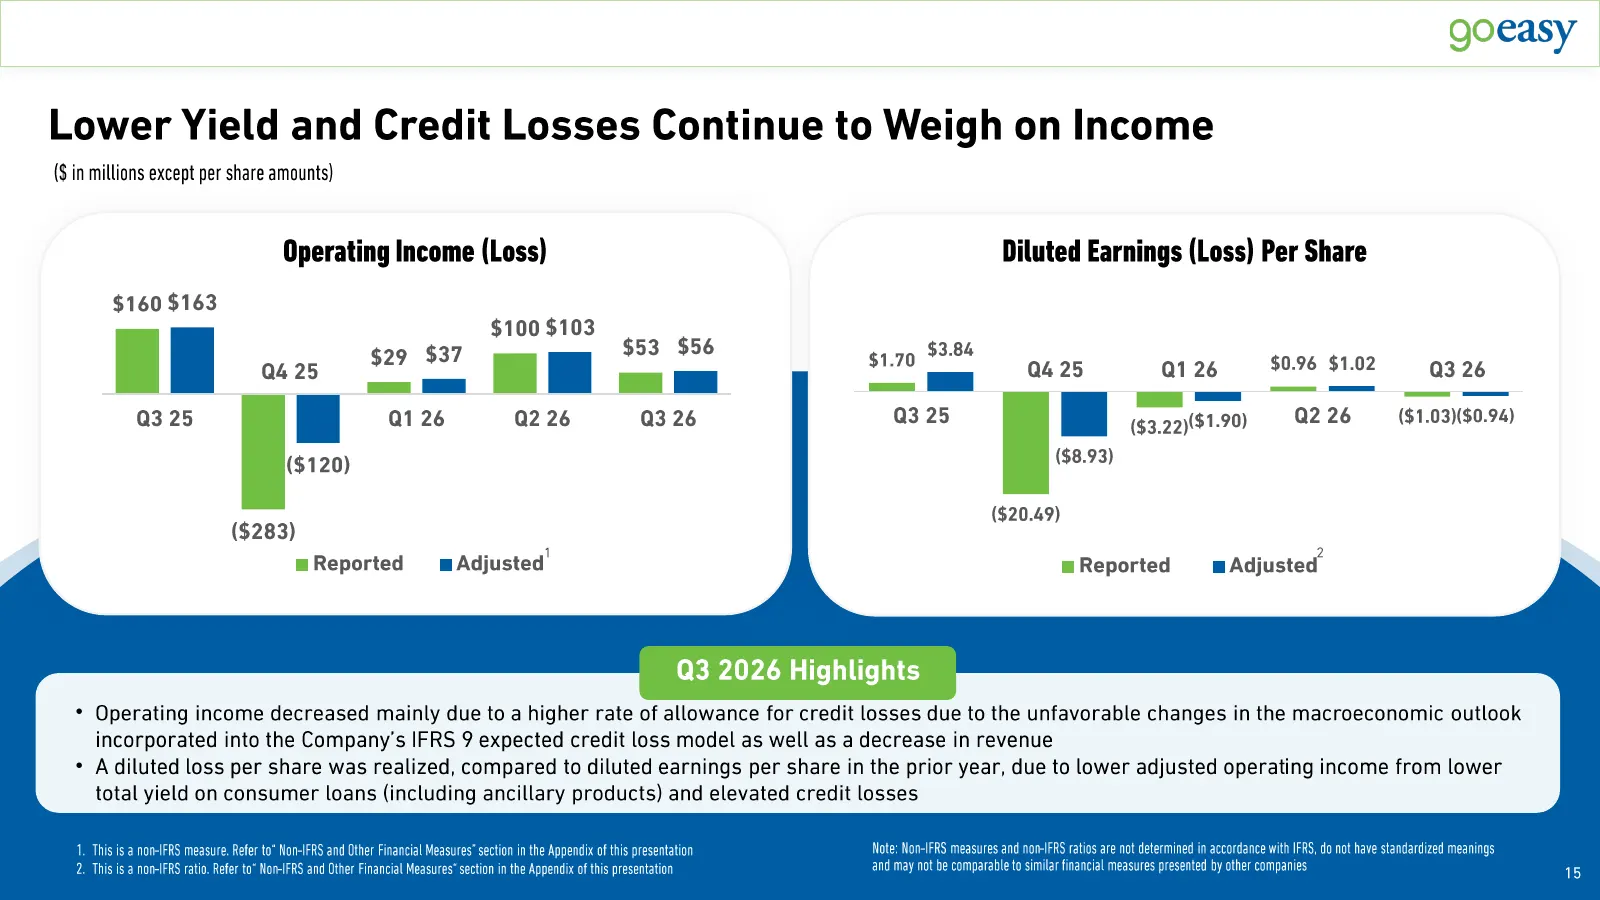
Slide 15: Lower Yield and Credit Losses Continue to Weigh on Income
Lower Yield and Credit Losses Continue to Weigh on Income ($ in millions except per share amounts) Operating Income (Loss) Diluted Earnings (Loss) Per Share $160 $163 $100 $103 $29 $37 $53 $56 $3.84 $1.70 $0.96 $1.02 Q4 25 Q4 25 Q1 26 Q3 26 Q3 25 Q1 26 Q2 26 Q3 26 Q3 25 ($3.22) ($1.90) Q2 26 ($1.03)
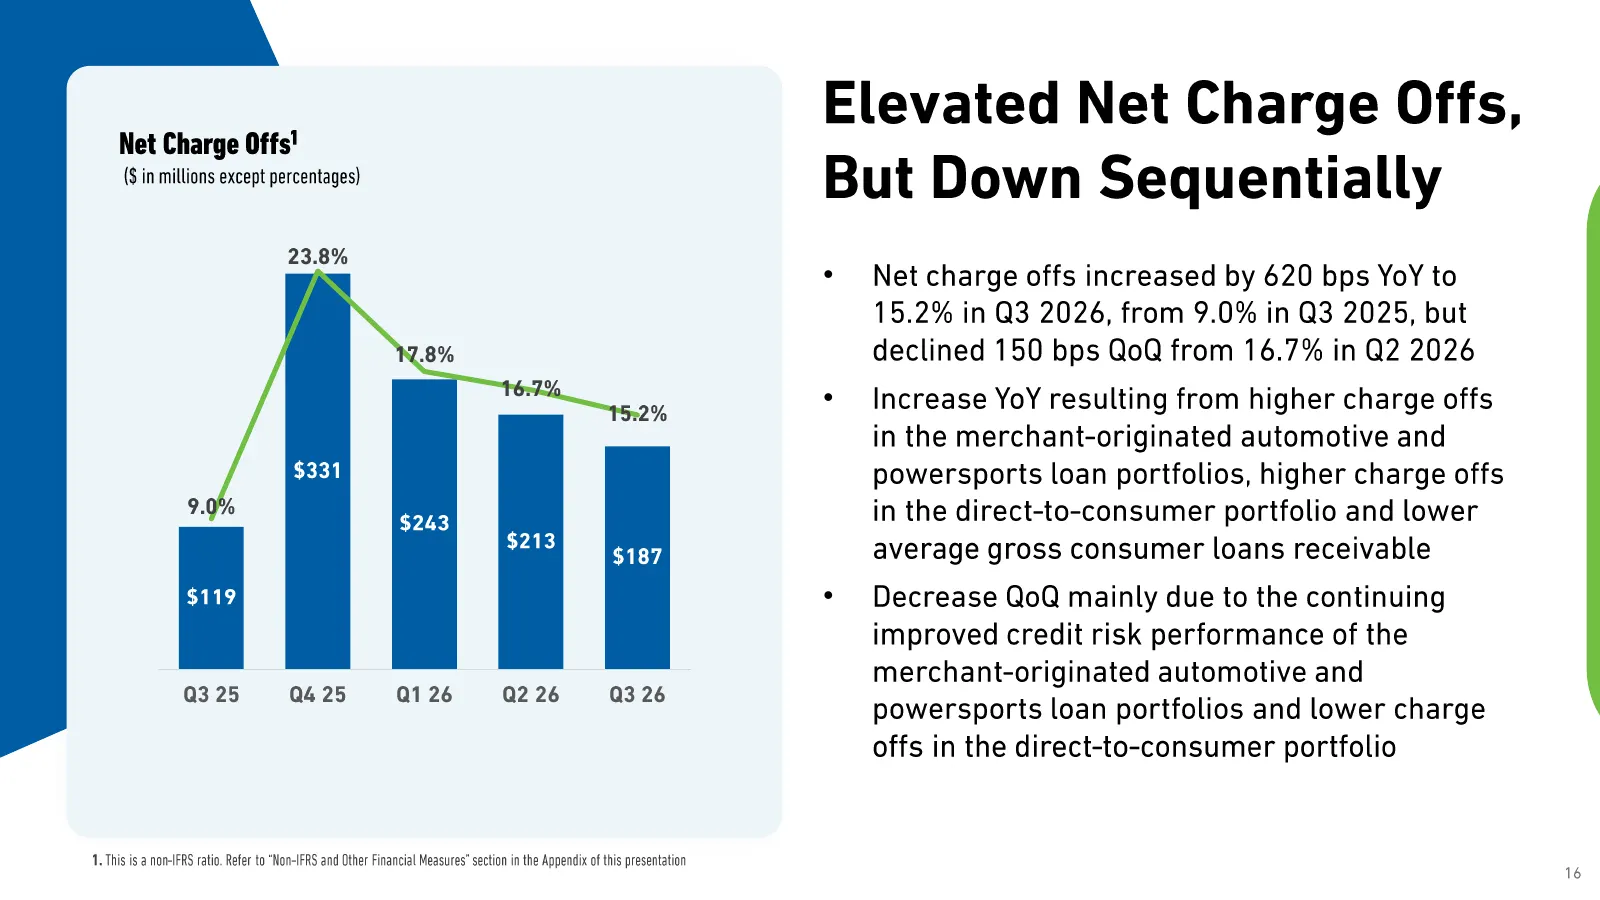
Slide 16: Elevated Net Charge Offs, But Down Sequentially
1 Net Charge Offs Elevated Net Charge Offs, ($ in millions except percentages) But Down Sequentially 23.8% • Net charge offs increased by 620 bps YoY to 15.2% in Q3 2026, from 9.0% in Q3 2025, but 17.8% declined 150 bps QoQ from 16.7% in Q2 2026 16.7% 15.2% • Increase YoY resulting from higher charg
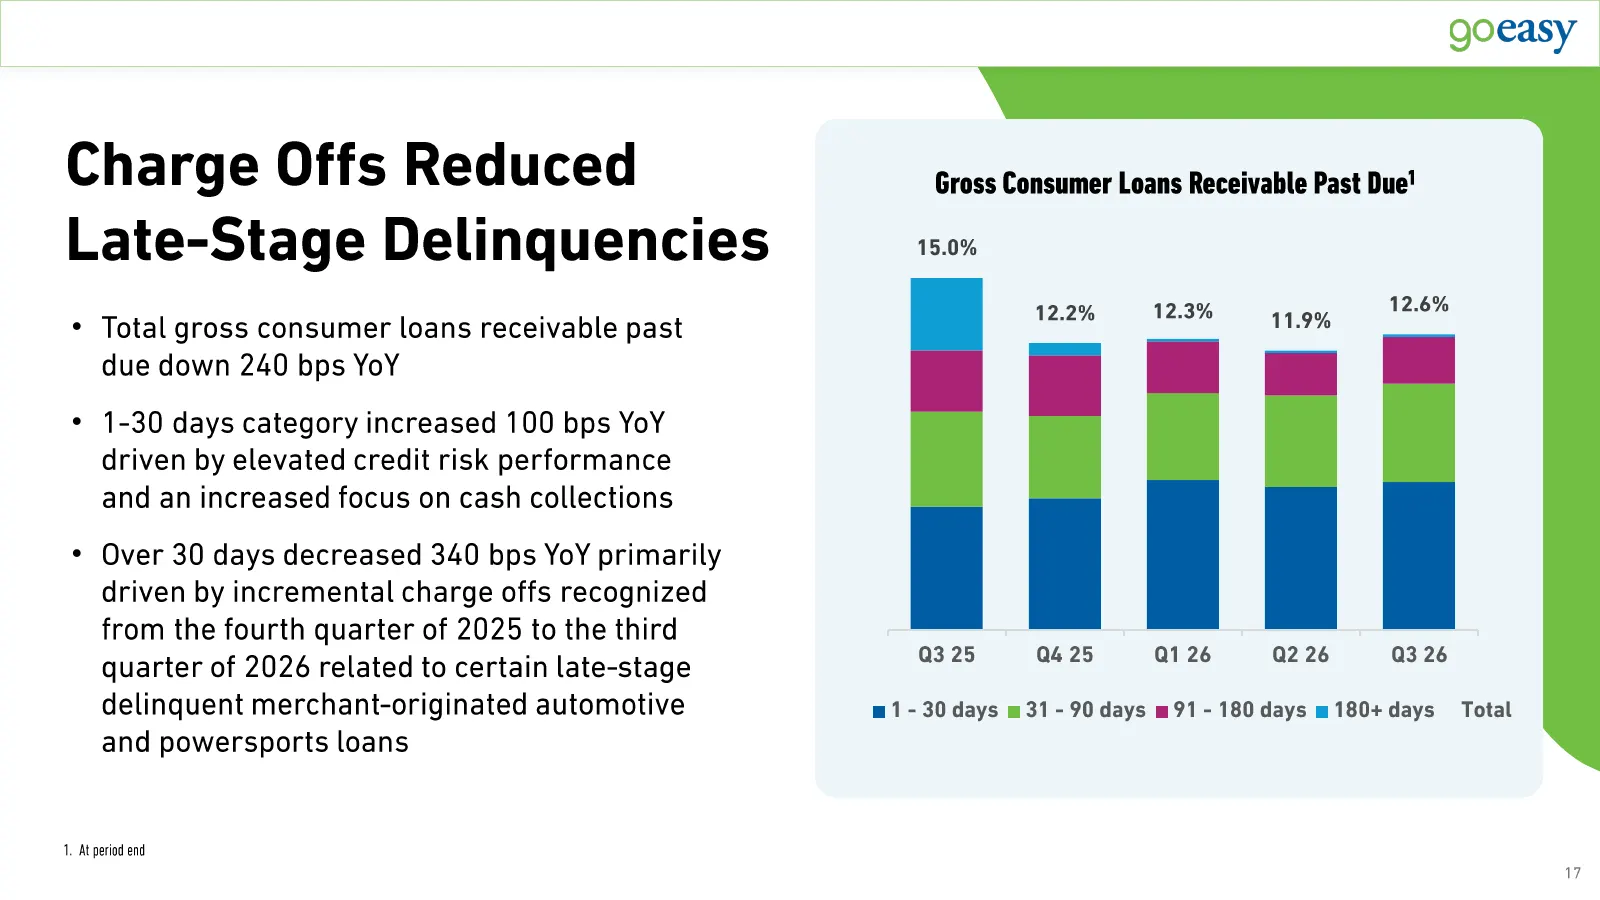
Slide 17: Charge Offs Reduced Late-Stage Delinquencies
Charge Offs Reduced 1 Due Gross Consumer Loans Receivable Past Late -Stage Delinquencies 15.0% 12.2% 12.3% 12.6% • Total gross consumer loans receivable past 11.9% due down 240 bps YoY • 1-30 days category increased 100 bps YoY driven by elevated credit risk performance and an increased focus on cas
Slide 18: ACL and Rate of Allowance Move Higher
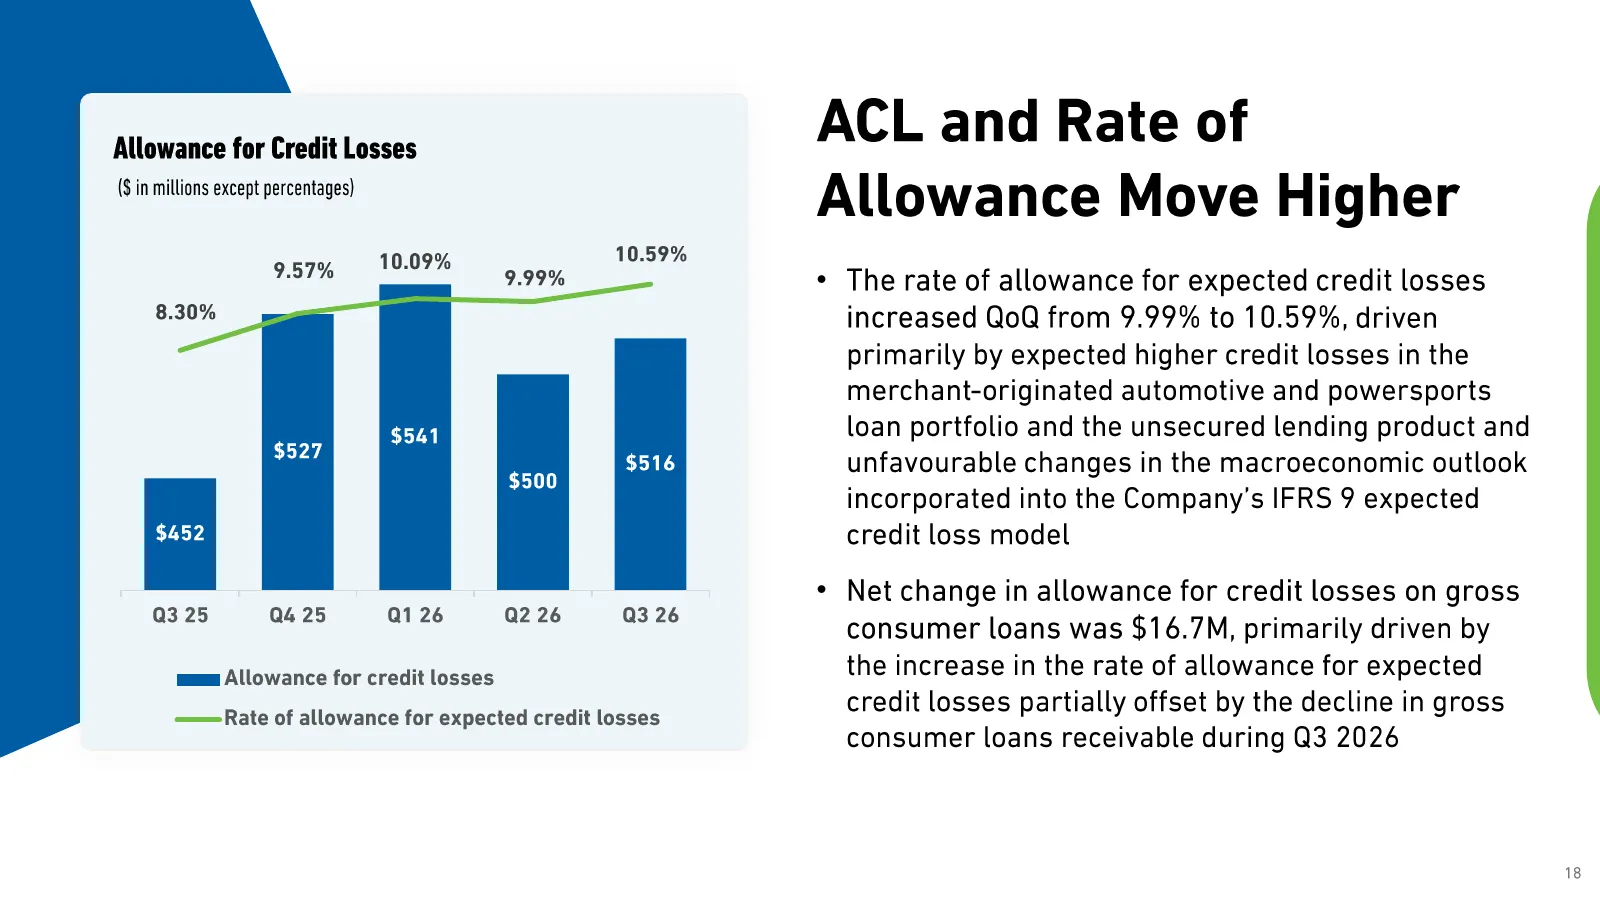
Allowance for Credit Losses ACL and Rate of ($ in millions except percentages) Allowance Move Higher 10.09% 10.59% 9.57% 9.99% • The rate of allowance for expected credit losses 8.30% increased QoQ from 9.99% to 10.59%, driven primarily by expected higher credit losses in the merchant -originated au
Slide 19: Continued to Generate Strong Organic Cash Flow
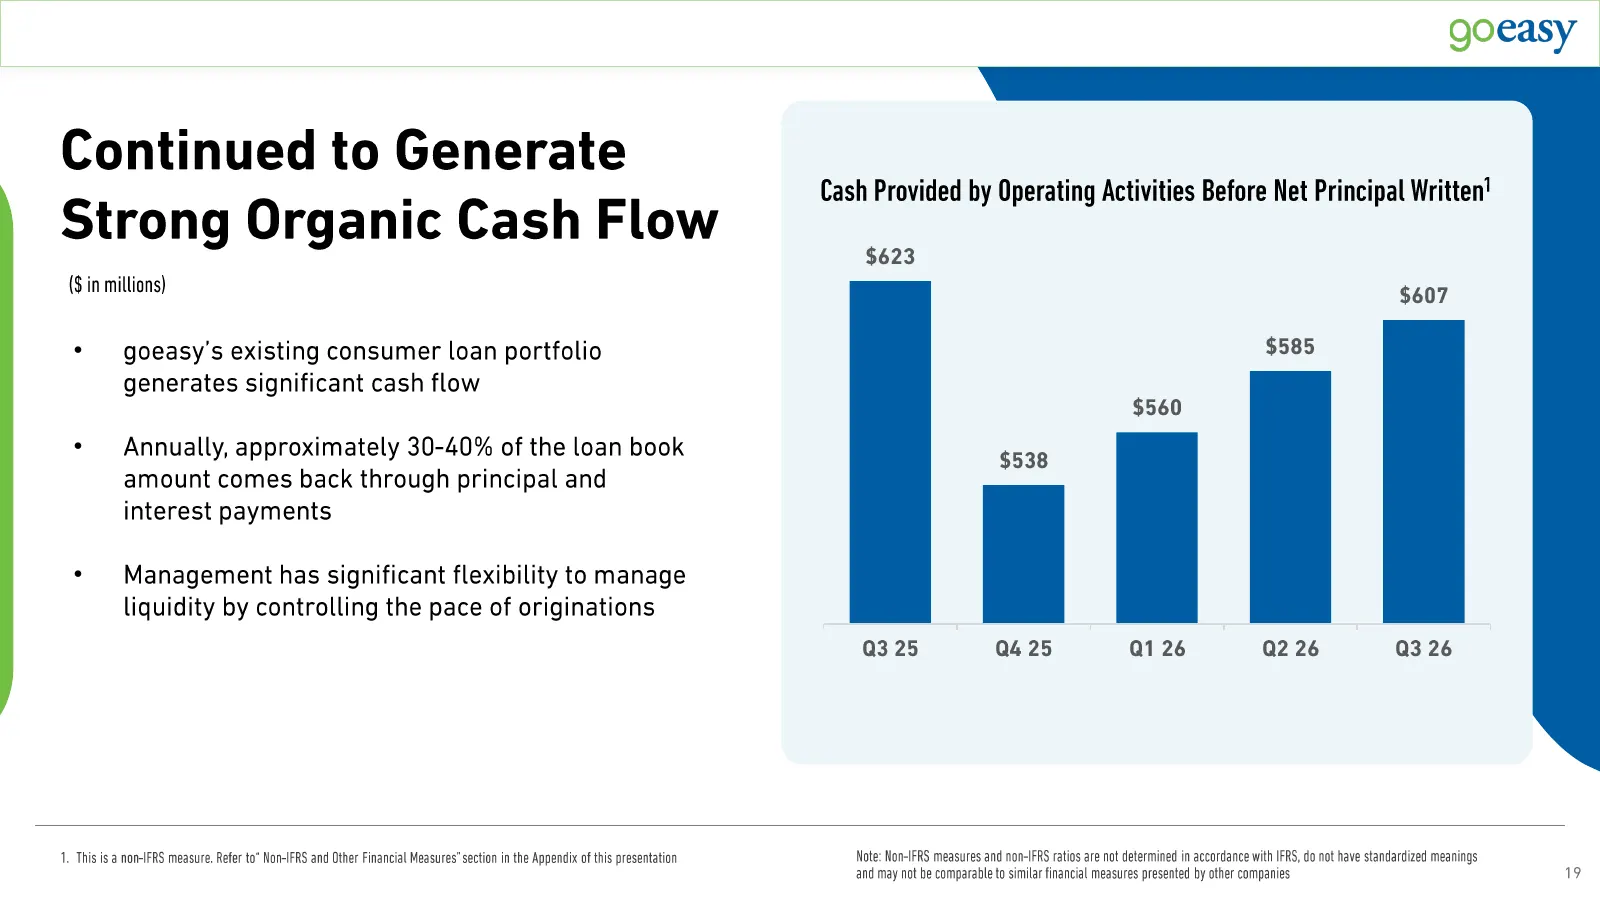
Continued to Generate 1 Cash Provided by Operating Activities Before Net Principal Wr Strong Organic Cash Flow $623 ($ in millions) $607 • goeasy’s existing consumer loan portfolio $585 generates significant cash flow $560 • Annually, approximately 30 -40% of the loan book $538 amount comes back thr
Slide 20: Balance Sheet & Capital Allocation Update
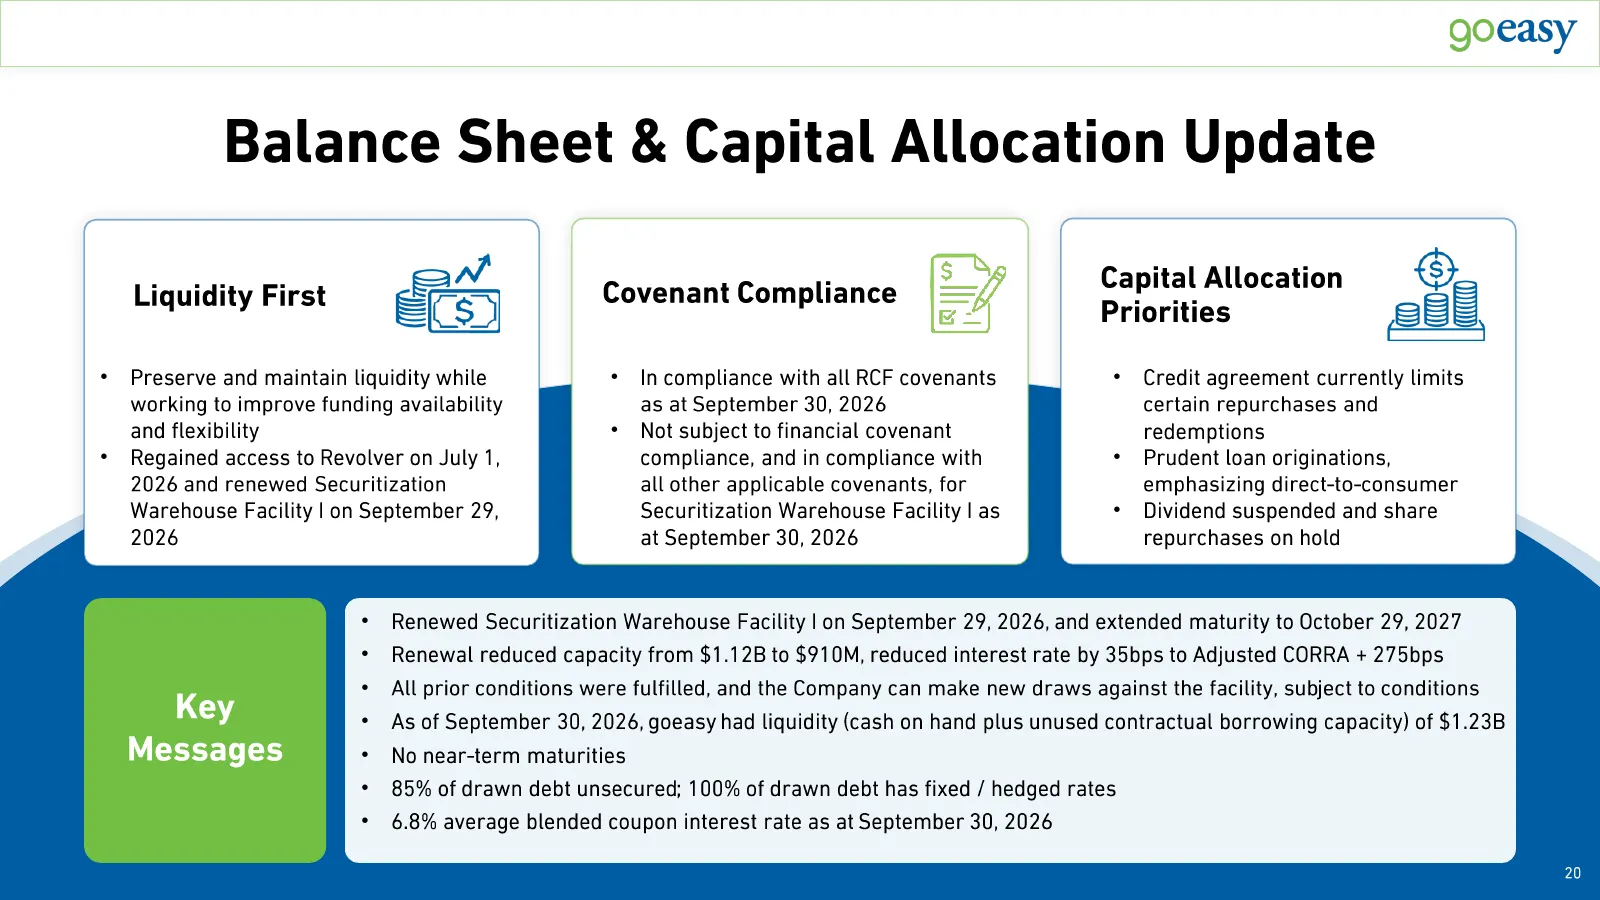
Balance Sheet & Capital Allocation Update Covenant Compliance Capital Allocation Liquidity First Priorities • Preserve and maintain liquidity while • In compliance with all RCF covenants • Credit agreement currently limits working to improve funding availability as at September 30, 2026 certain repu

Slide 21: Outlook
Outlook
Slide 22: Outlook
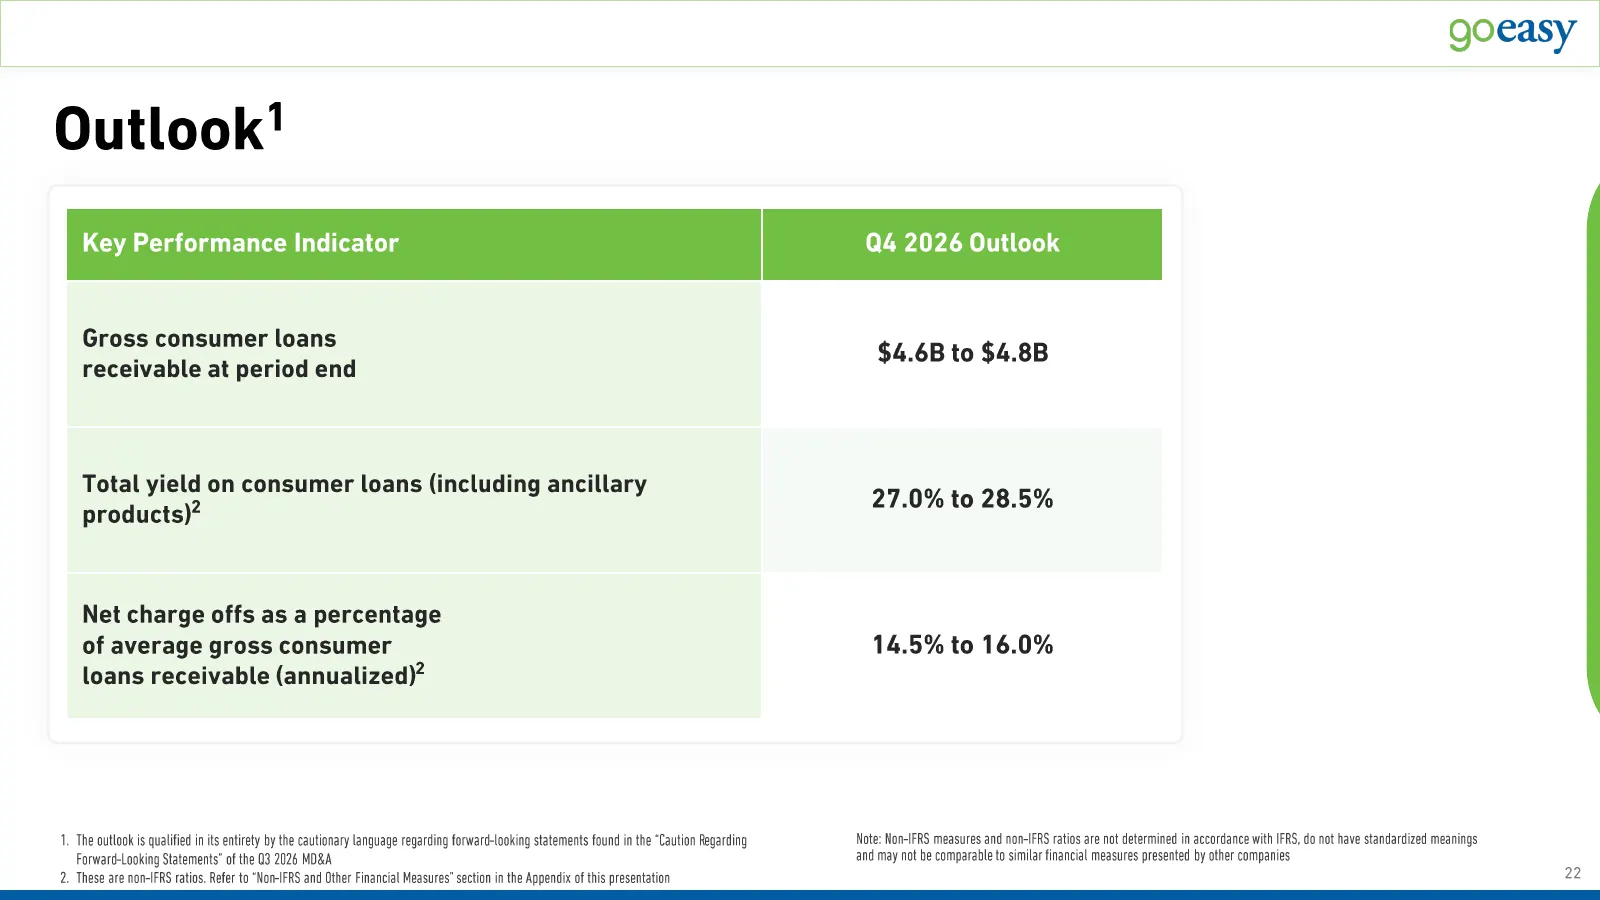
Outlook 1 Key Performance Indicator Q4 2026 Outlook Gross consumer loans $4.6B to $4.8B receivable at period end Total yield on consumer loans (including ancillary 27.0% to 28.5% products) 2 Net charge offs as a percentage of average gross consumer 14.5% to 16.0% loans receivable (annualized) 2 1. T

Slide 23: Questions?
goeasy A Questions?

Slide 24: Appendix
goeasy Appendix
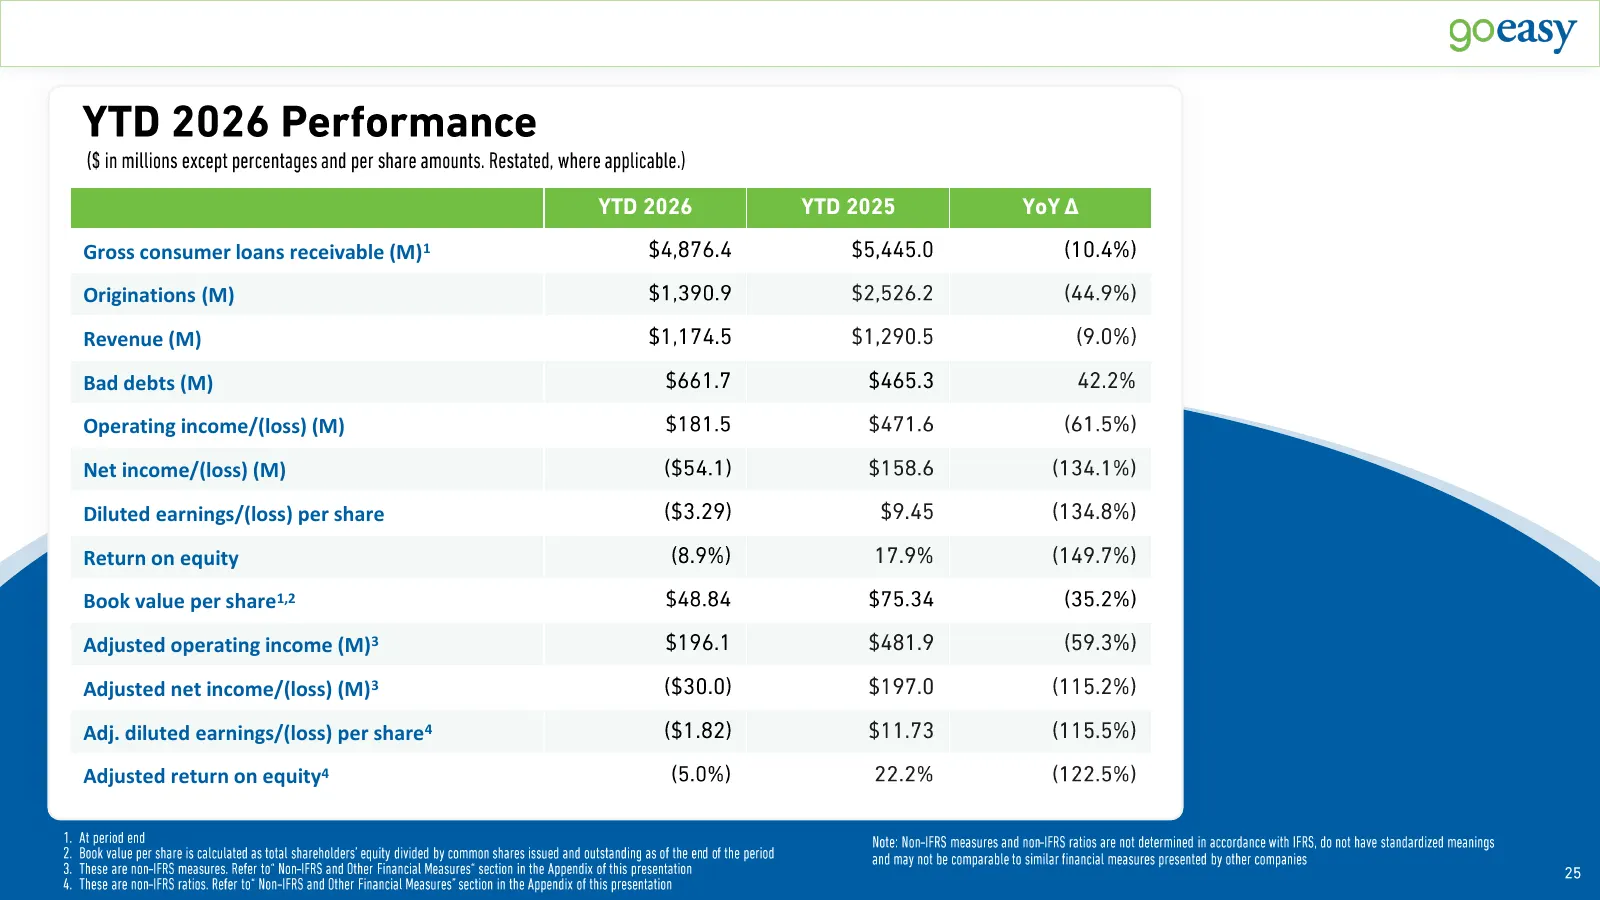
Slide 25: YTD 2026 Performance
YTD 2026 Performance ($ in millions except percentages and per share amounts. Restated, where applicable.) YTD 2026 YTD 2025 YoY ∆ Gross consumer loans receivable (M)1 $4,876.4 $5,445.0 (10.4%) Originations (M) $1,390.9 $2,526.2 (44.9%) Revenue (M) $1,174.5 $1,290.5 (9.0%) Bad debts (M) $661.7 $465.
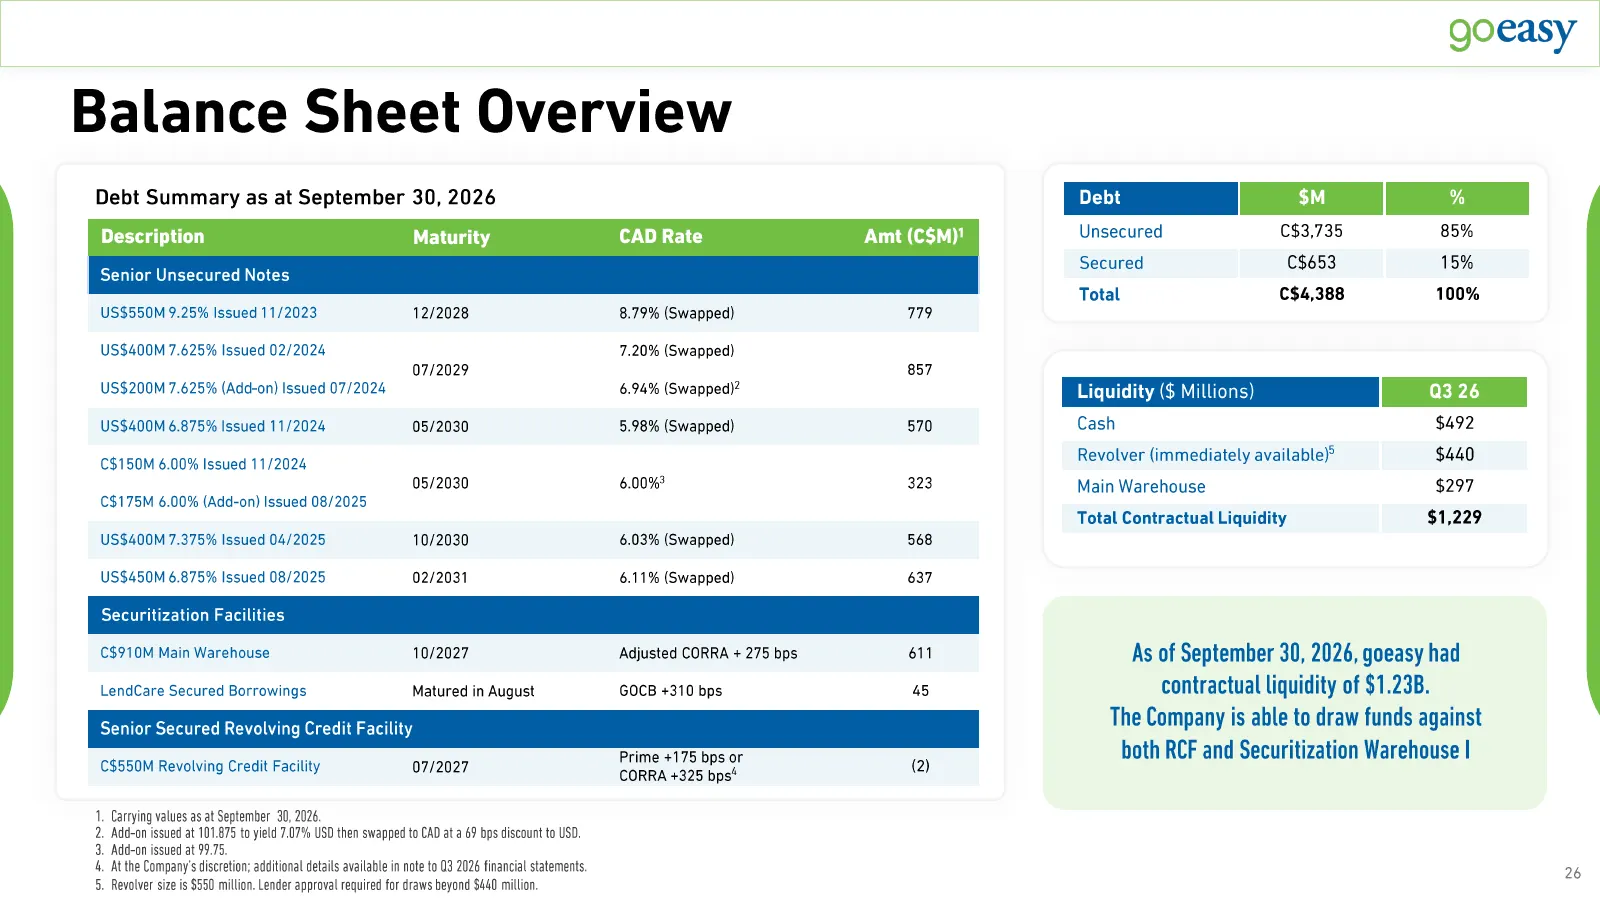
Slide 26: Balance Sheet Overview
Balance Sheet Overview Debt Summary as at September 30, 2026 Debt $M % Description Maturity CAD Rate Amt (C$M) 1 Unsecured C$3,735 85% Secured C$653 15% Senior Unsecured Notes Total C$4,388 100% US$550M 9.25% Issued 11/2023 12/2028 8.79% (Swapped) 779 US$400M 7.625% Issued 02/2024 7.20% (Swapped) 07
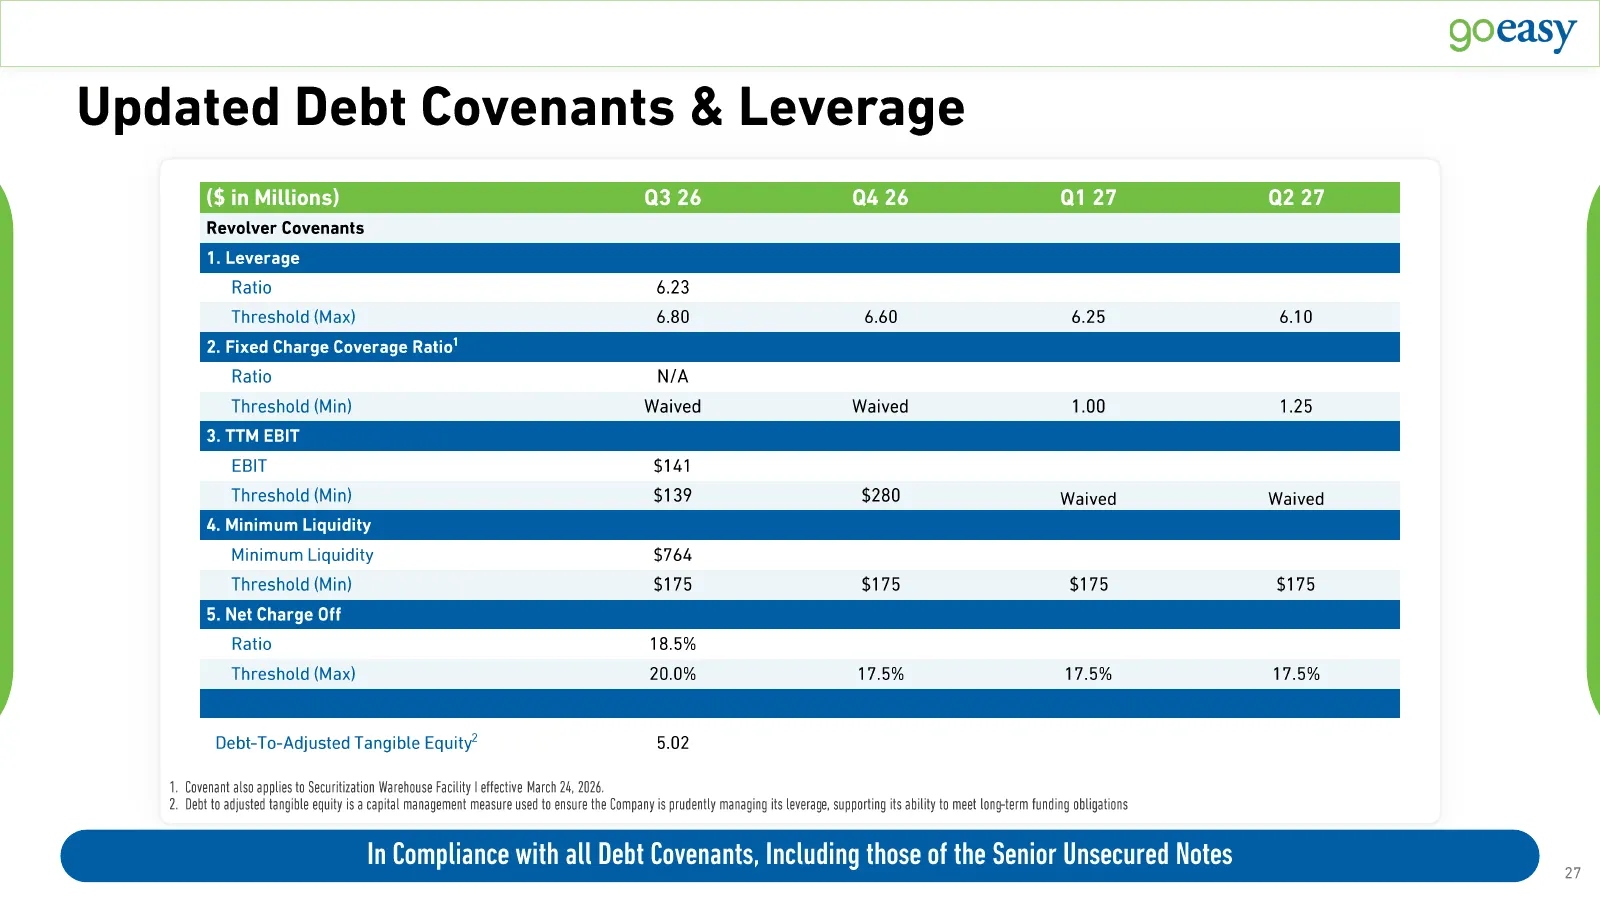
Slide 27: Updated Debt Covenants & Leverage
Updated Debt Covenants & Leverage ($ in Millions) Q3 26 Q4 26 Q1 27 Q2 27 Revolver Covenants 1. Leverage Ratio 6.23 Threshold (Max) 6.80 6.60 6.25 6.10 1 2. Fixed Charge Coverage Ratio Ratio N/A Threshold (Min) Waived Waived 1.00 1.25 3. TTM EBIT EBIT $141 Threshold (Min) $139 $280 Waived Waived 4.
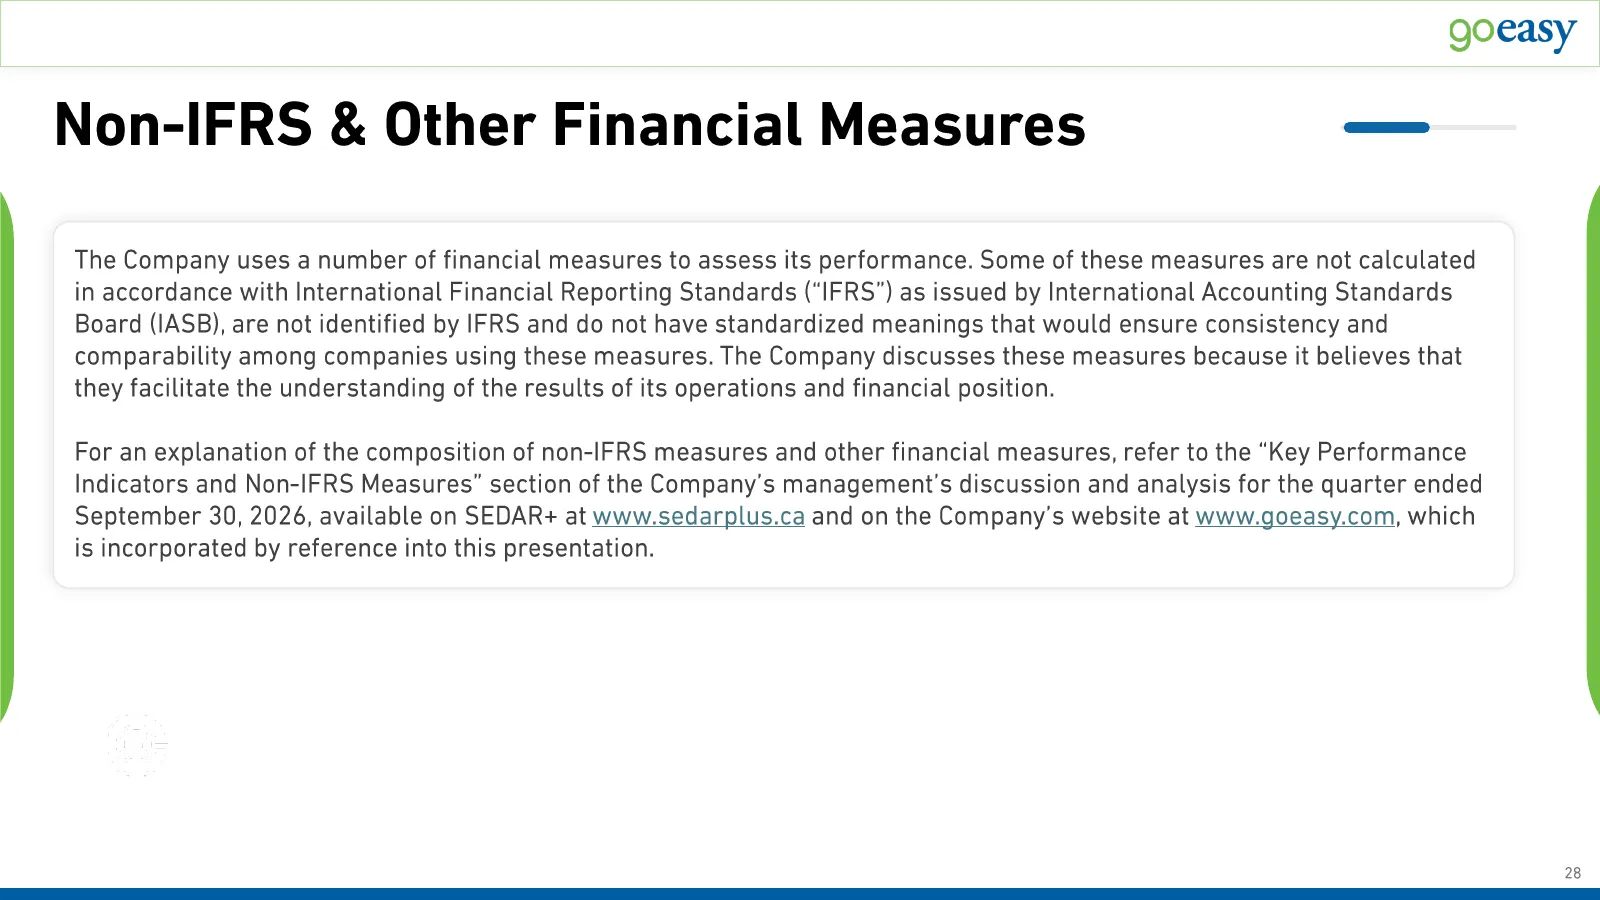
Slide 28: Non-IFRS & Other Financial Measures
Non-IFRS & Other Financial Measures The Company uses a number of financial measures to assess its performance. Some of these measures are not calculated in accordance with International Financial Reporting Standards (“IFRS”) as issued by International Accounting Standards Board (IASB), are not ident
Source: 6ix earnings call