goeasy Ltd. · TSX:GSY
goeasy — Investor Presentation (November 2025)
57 slides from goeasy's investor presentation, November 2025

Slide 1: Investor Presentation November 2025
INVESTOR PRESENTATION NOVEMBER 2025
Slide 2: Important Information
IMPORTANT INFORMATION Caution Regarding Forward-Looking Statements This presentation includes forward-looking statements about goeasy, including, but not limited to, its business operations, strategy and expected financial performance and condition. Forward-looking statements include, but are not li

Slide 3: goeasy Overview
goeasy GOEASY OVERVIEW
Slide 4: Who is goeasy
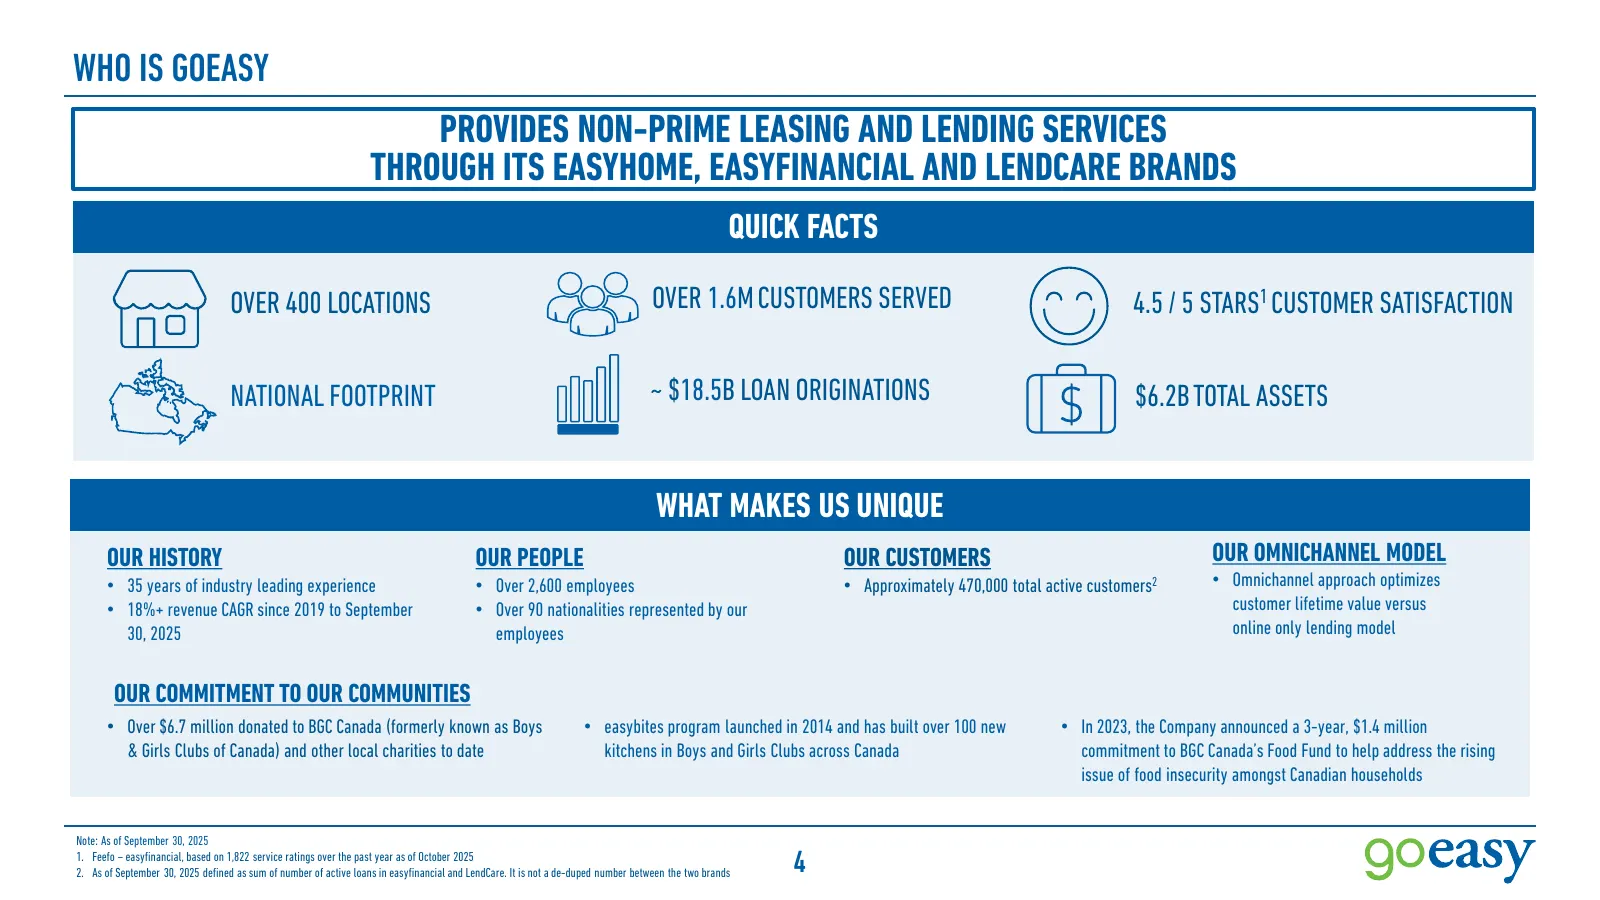
WHO IS GOEASY PROVIDES NON-PRIME LEASING AND LENDING SERVICES THROUGH ITS EASYHOME, EASYFINANCIAL AND LENDCARE BRANDS QUICK FACTS OVER 400 LOCATIONS OVER 1.6M CUSTOMERS SERVED 4.5 / 5 STARS1 CUSTOMER SATISFACTION NATIONAL FOOTPRINT ~ $18.5B LOAN ORIGINATIONS $6.2B TOTAL ASSETS WHAT MAKES US UNIQUE O
Slide 5: Comprehensively Serve Customers' Financial Needs
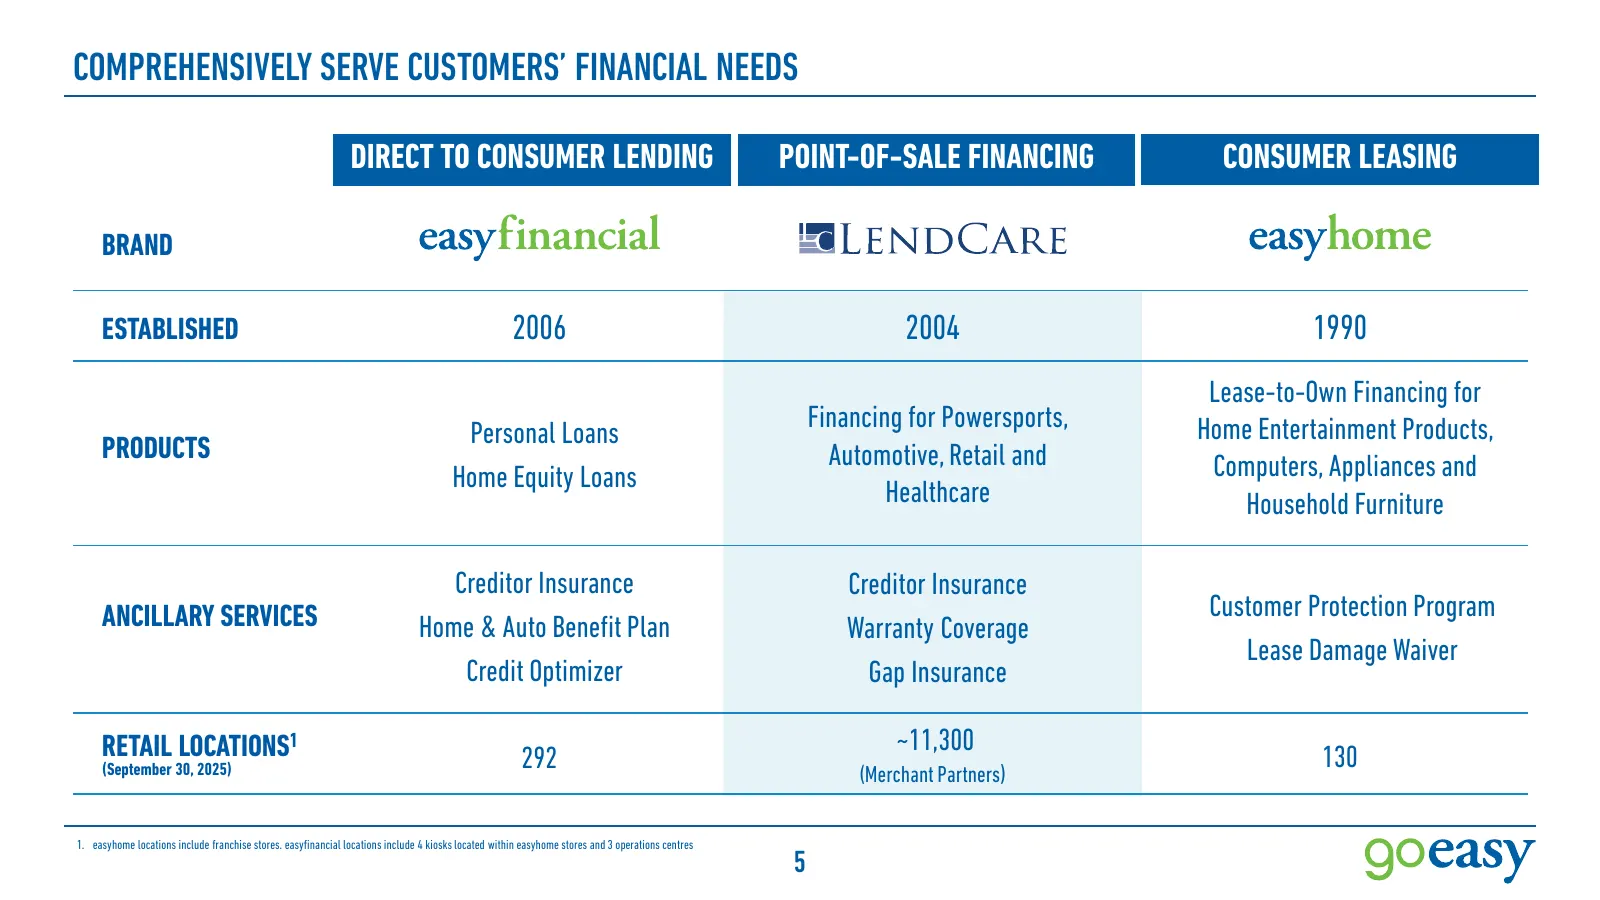
COMPREHENSIVELY SERVE CUSTOMERS’ FINANCIAL NEEDS DIRECT TO CONSUMER LENDING POINT-OF-SALE FINANCING CONSUMER LEASING BRAND ESTABLISHED 2006 2004 1990 Lease-to-Own Financing for Financing for Powersports, Home Entertainment Products, PRODUCTS Personal Loans Automotive, Retail and Computers, Appliance
Slide 6: Consistent Track Record of Revenue Growth and Profitability
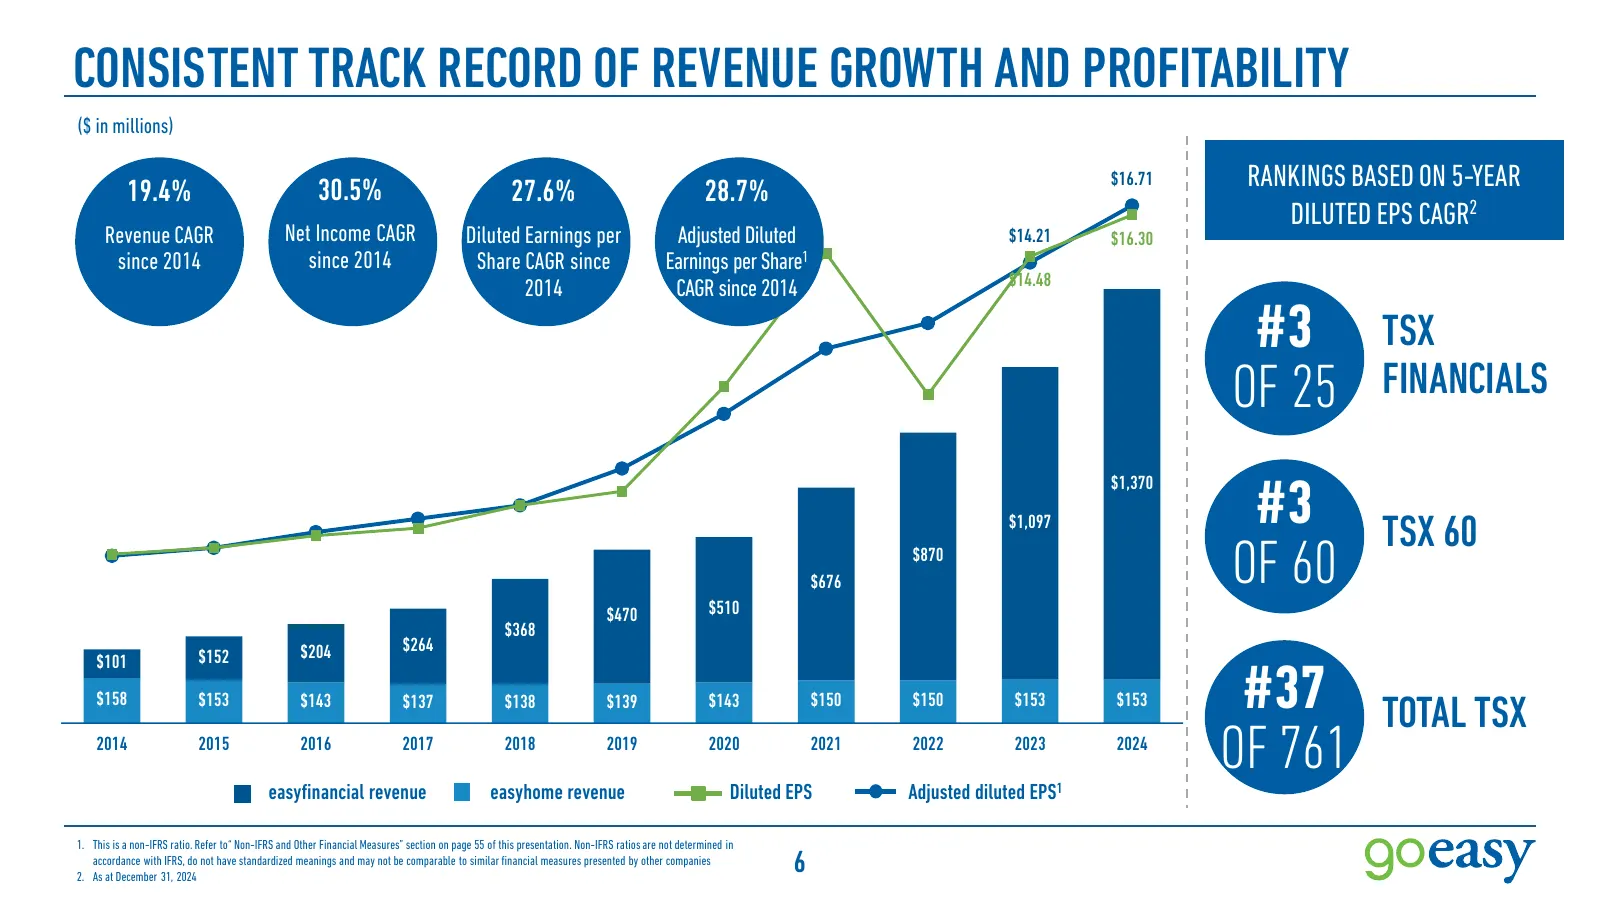
CONSISTENT TRACK RECORD OF REVENUE GROWTH AND PROFITABILITY ($ in millions) 19.4% 30.5% 27.6% 28.7% $16.71 RANKINGS BASED ON 5-YEAR DILUTED EPS CAGR2 Revenue CAGR Net Income CAGR Diluted Earnings per Adjusted Diluted $14.21 $16.30 since 2014 since 2014 Share CAGR since Earnings per Share1 2014 CAGR
Slide 7: Strong Management Team Driving Execution
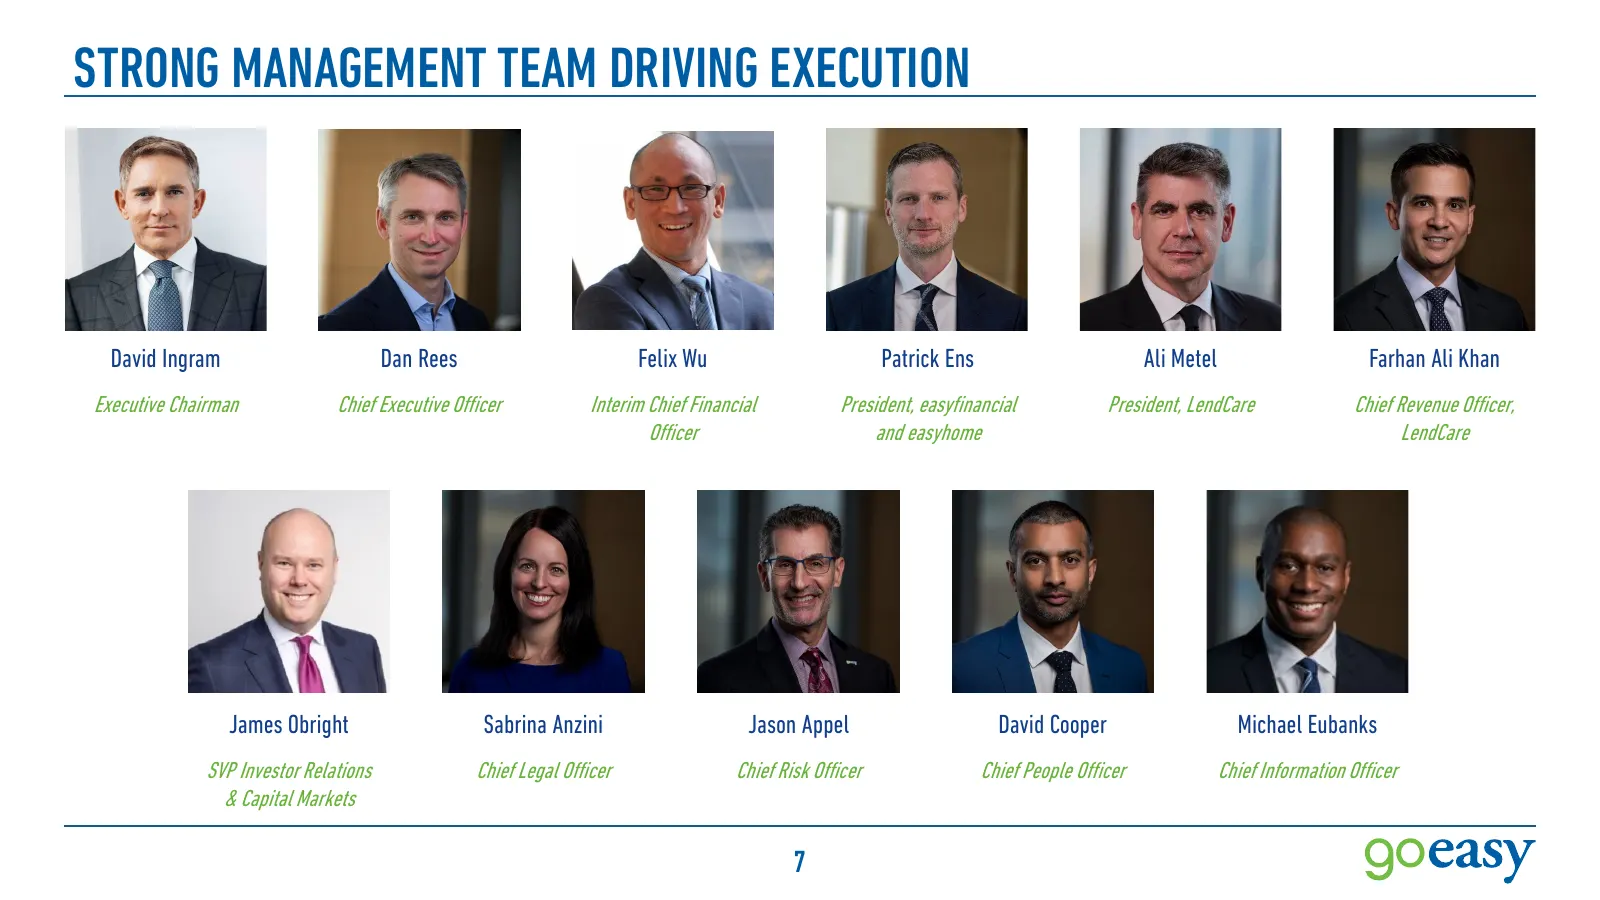
STRONG MANAGEMENT TEAM DRIVING EXECUTION David Ingram Dan Rees Felix Wu Patrick Ens Ali Metel Farhan Ali Khan Executive Chairman Chief Executive Officer Interim Chief Financial President, easyfinancial President, LendCare Chief Revenue Officer, Officer and easyhome LendCare James Obright Sabrina Anz

Slide 8: Our Market & Customers
goeasy OUR MARKET& CUSTOMERS ~
Slide 9: Established Constituent in the Sizable and Underserved Canadian Market
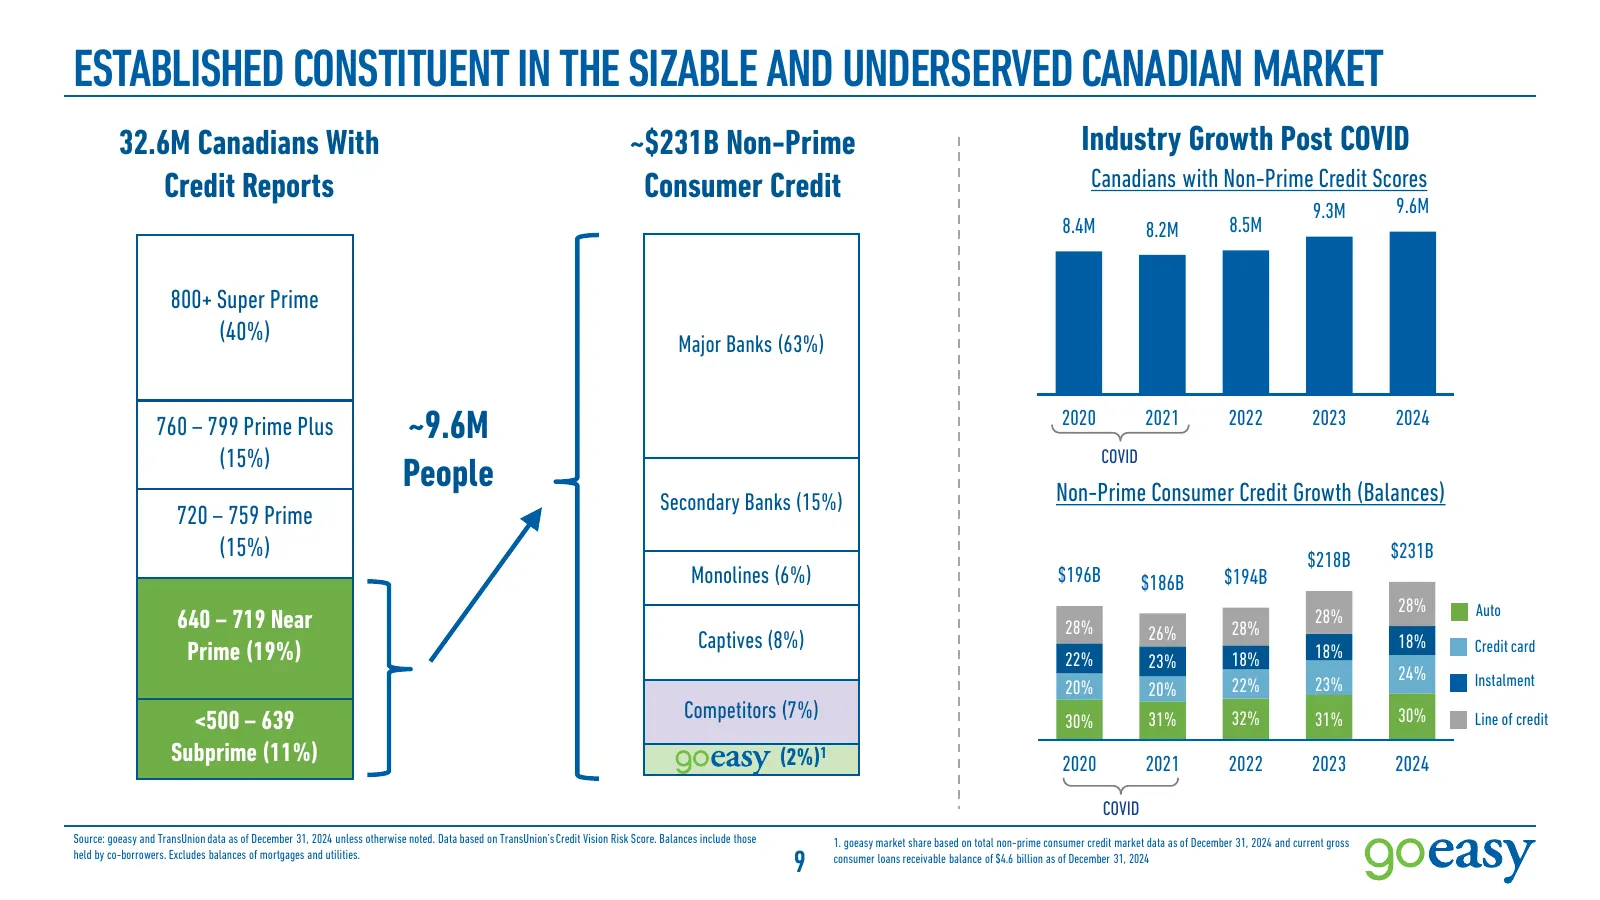
ESTABLISHED CONSTITUENT IN THE SIZABLE AND UNDERSERVED CANADIAN MARKET 32.6M Canadians With ~$231B Non-Prime Industry Growth Post COVID Credit Reports Consumer Credit Canadians with Non-Prime Credit Scores 9.3M 9.6M 8.4M 8.2M 8.5M 800+ Super Prime (40%) Major Banks (63%) 760 – 799 Prime Plus ~9.6M 2
Slide 10: Our Customers Are Everyday Canadians
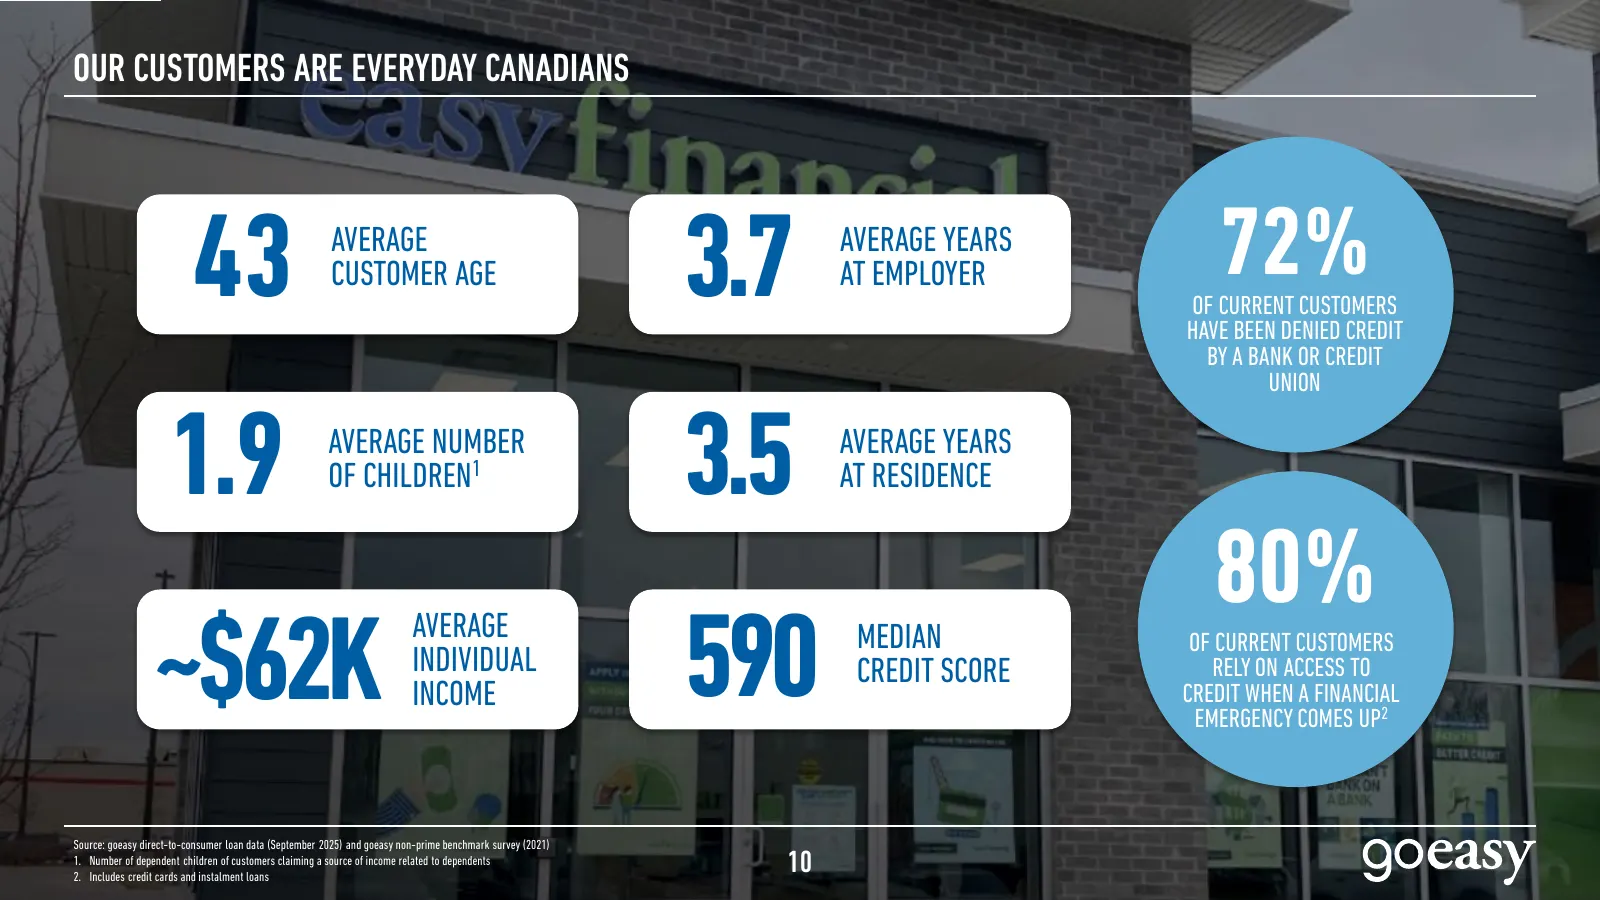
OUR CUSTOMERS ARE EVERYDAY CANADIANS 43 AVERAGE CUSTOMER AGE 3.7 AVERAGE YEARS AT EMPLOYER 72% OF CURRENT CUSTOMERS HAVE BEEN DENIED CREDIT BY A BANK OR CREDIT UNION 1.9 AVERAGE NUMBER OF CHILDREN1 3.5 AVERAGE YEARS AT RESIDENCE 80% ~$62K AVERAGE INDIVIDUAL INCOME 590 MEDIAN CREDIT SCORE OF CURRENT

Slide 11: Corporate Strategy
CORPORATE STRATEGY
Slide 12: Established Strategy Supported by Four Key Pillars
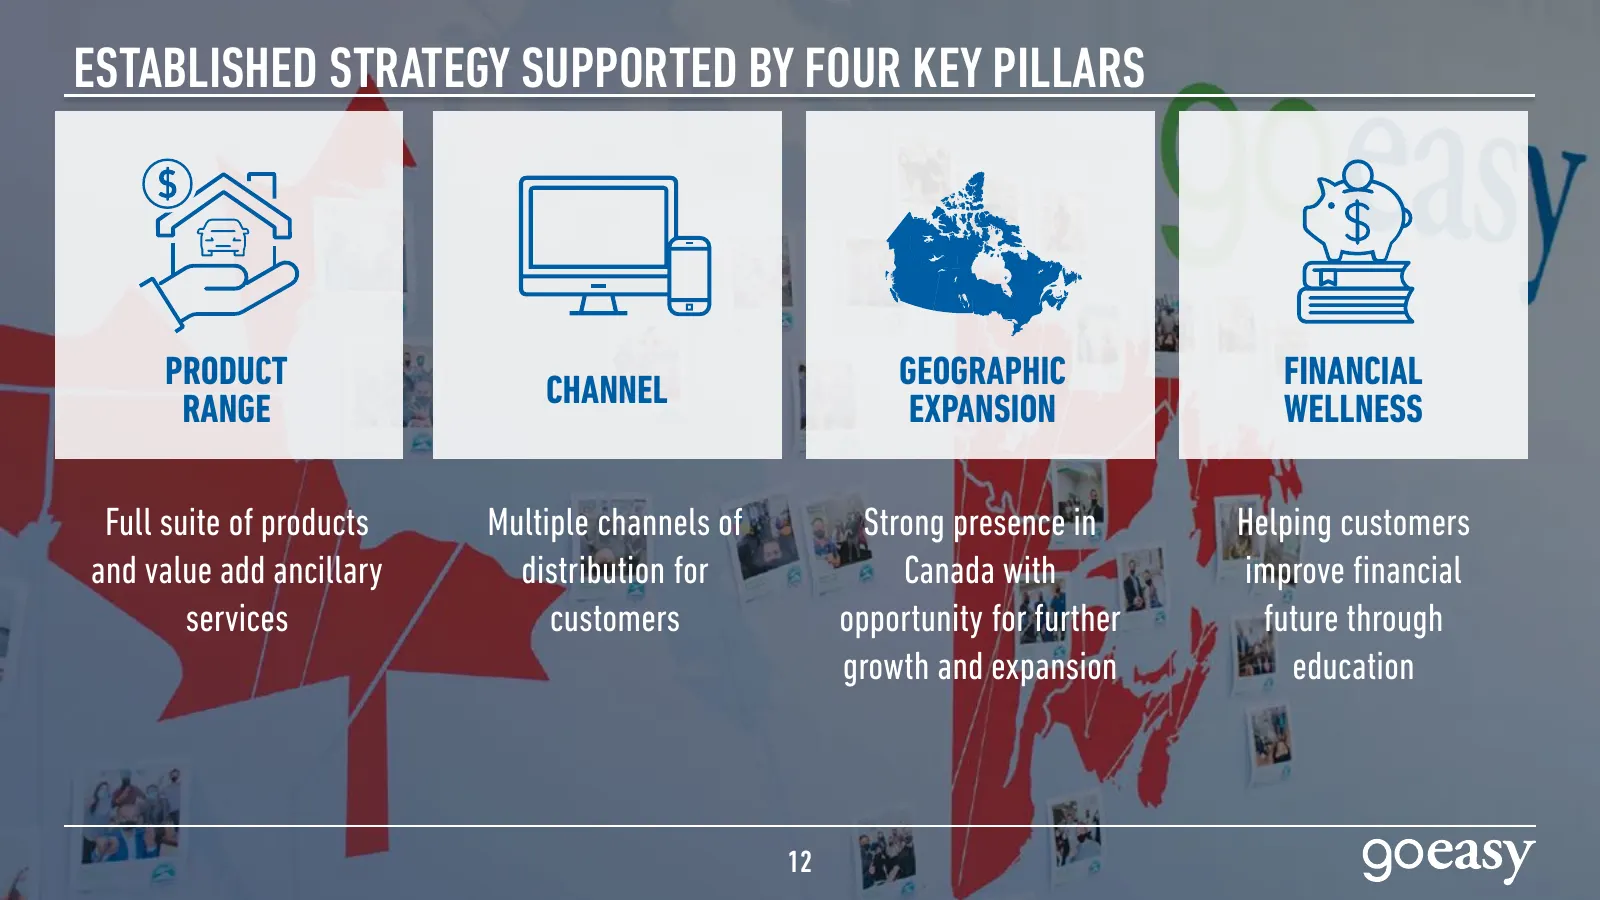
ESTABLISHED STRATEGY SUPPORTED BY FOUR KEY PILLARS PRODUCT CHANNEL GEOGRAPHIC FINANCIAL RANGE EXPANSION WELLNESS Full suite of products Multiple channels of Strong presence in Helping customers and value add ancillary distribution for Canada with improve financial services customers opportunity for
Slide 13: goeasy Framework – Business & Financial Decisions
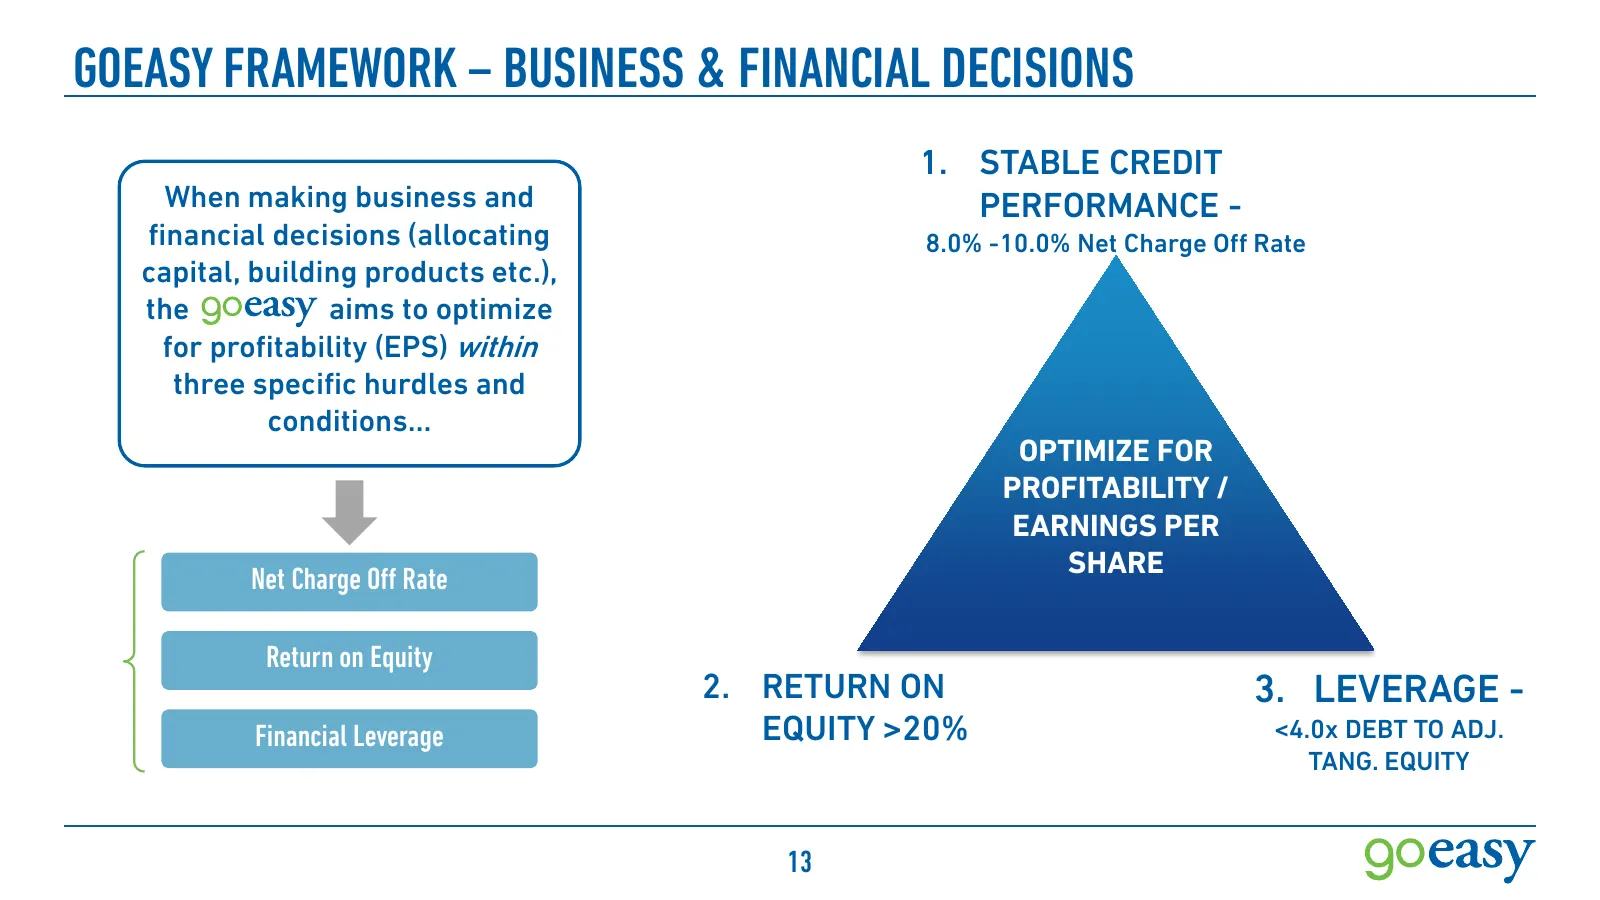
GOEASY FRAMEWORK – BUSINESS & FINANCIAL DECISIONS 1. STABLE CREDIT When making business and PERFORMANCE - financial decisions (allocating 8.0% -10.0% Net Charge Off Rate capital, building products etc.), the Company aims to optimize for profitability (EPS) within three specific hurdles and condition

Slide 14: Corporate Strategy: I. Product Range
CORPORATE STRATEGY I. PRODUCT RANGE
Slide 15: Comprehensive Suite of Products That Meet the Needs of Our Customers
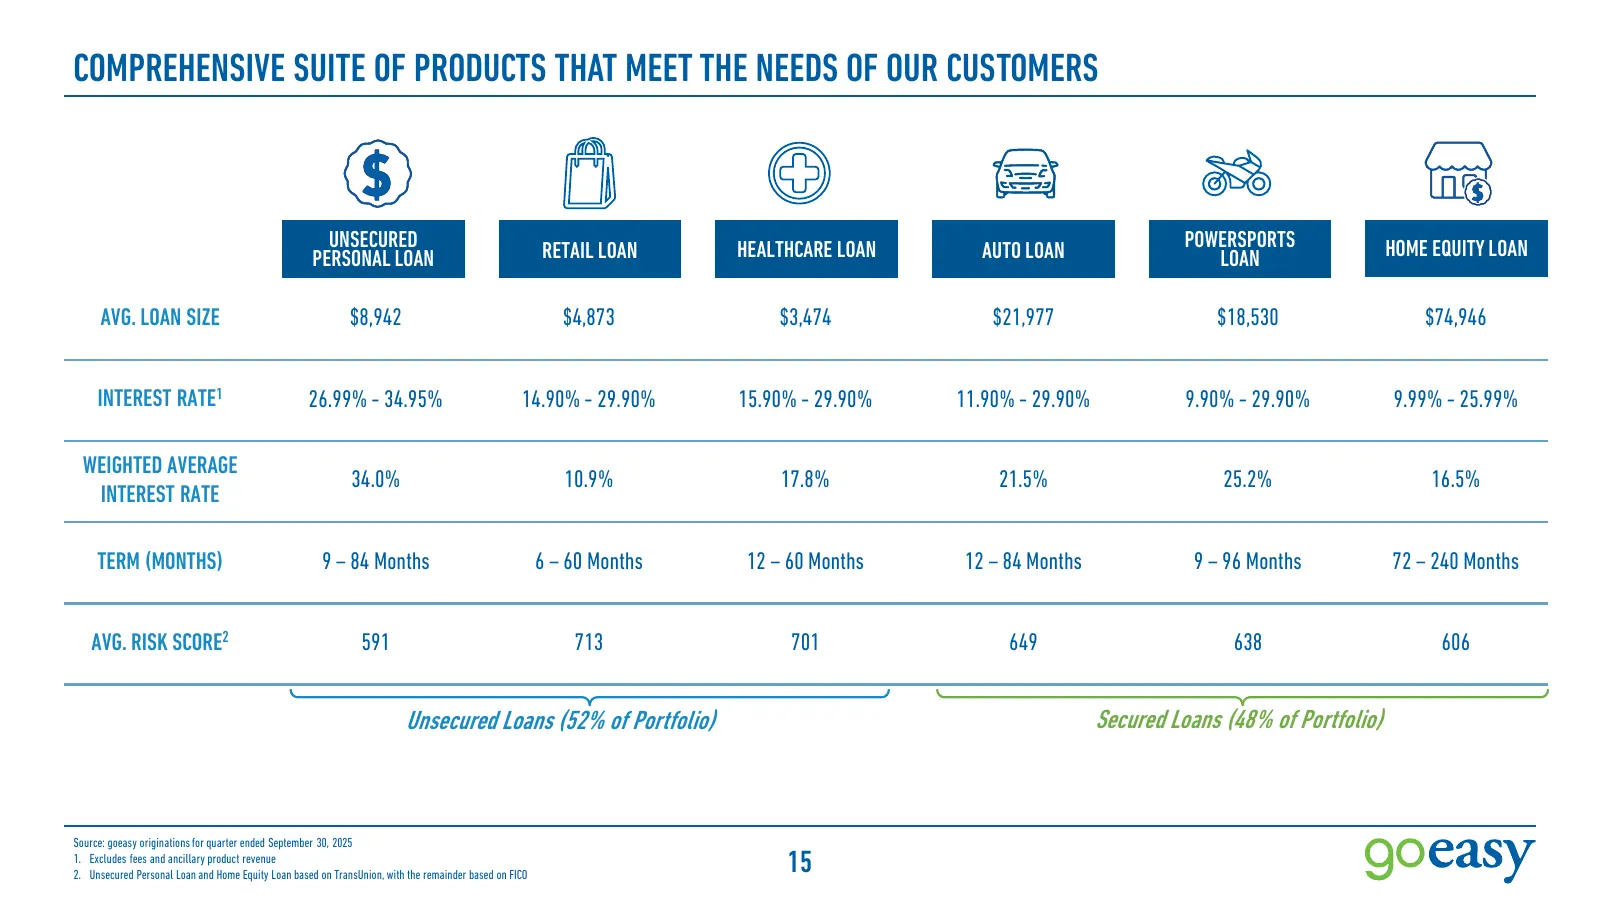
COMPREHENSIVE SUITE OF PRODUCTS THAT MEET THE NEEDS OF OUR CUSTOMERS UNSECURED RETAIL LOAN HEALTHCARE LOAN AUTO LOAN POWERSPORTS HOME EQUITY LOAN PERSONAL LOAN LOAN AVG. LOAN SIZE $8,942 $4,873 $3,474 $21,977 $18,530 $74,946 INTEREST RATE1 26.99% - 34.95% 14.90% - 29.90% 15.90% - 29.90% 11.90% - 29.
Slide 16: A Suite of Products: Personal Loan and Home Equity Loan
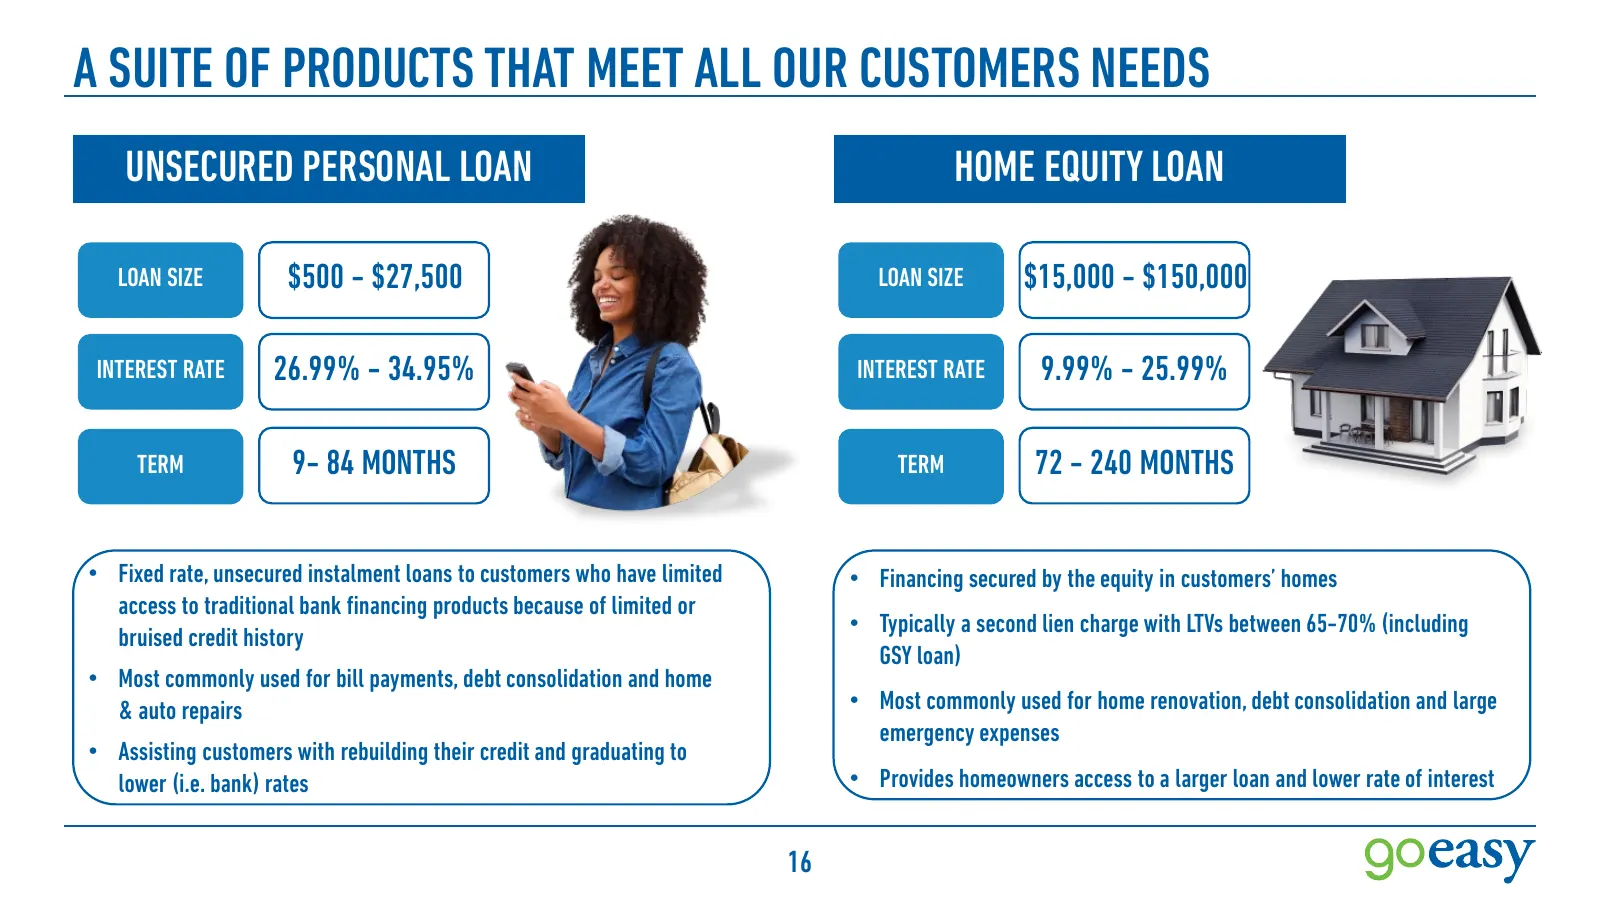
A SUITE OF PRODUCTS THAT MEET ALL OUR CUSTOMERS NEEDS UNSECURED PERSONAL LOAN HOME EQUITY LOAN LOAN SIZE $500 - $27,500 LOAN SIZE $15,000 - $150,000 INTEREST RATE 26.99% - 34.95% INTEREST RATE 9.99% - 25.99% TERM 9- 84 MONTHS TERM 72 - 240 MONTHS • Fixed rate, unsecured instalment loans to customers
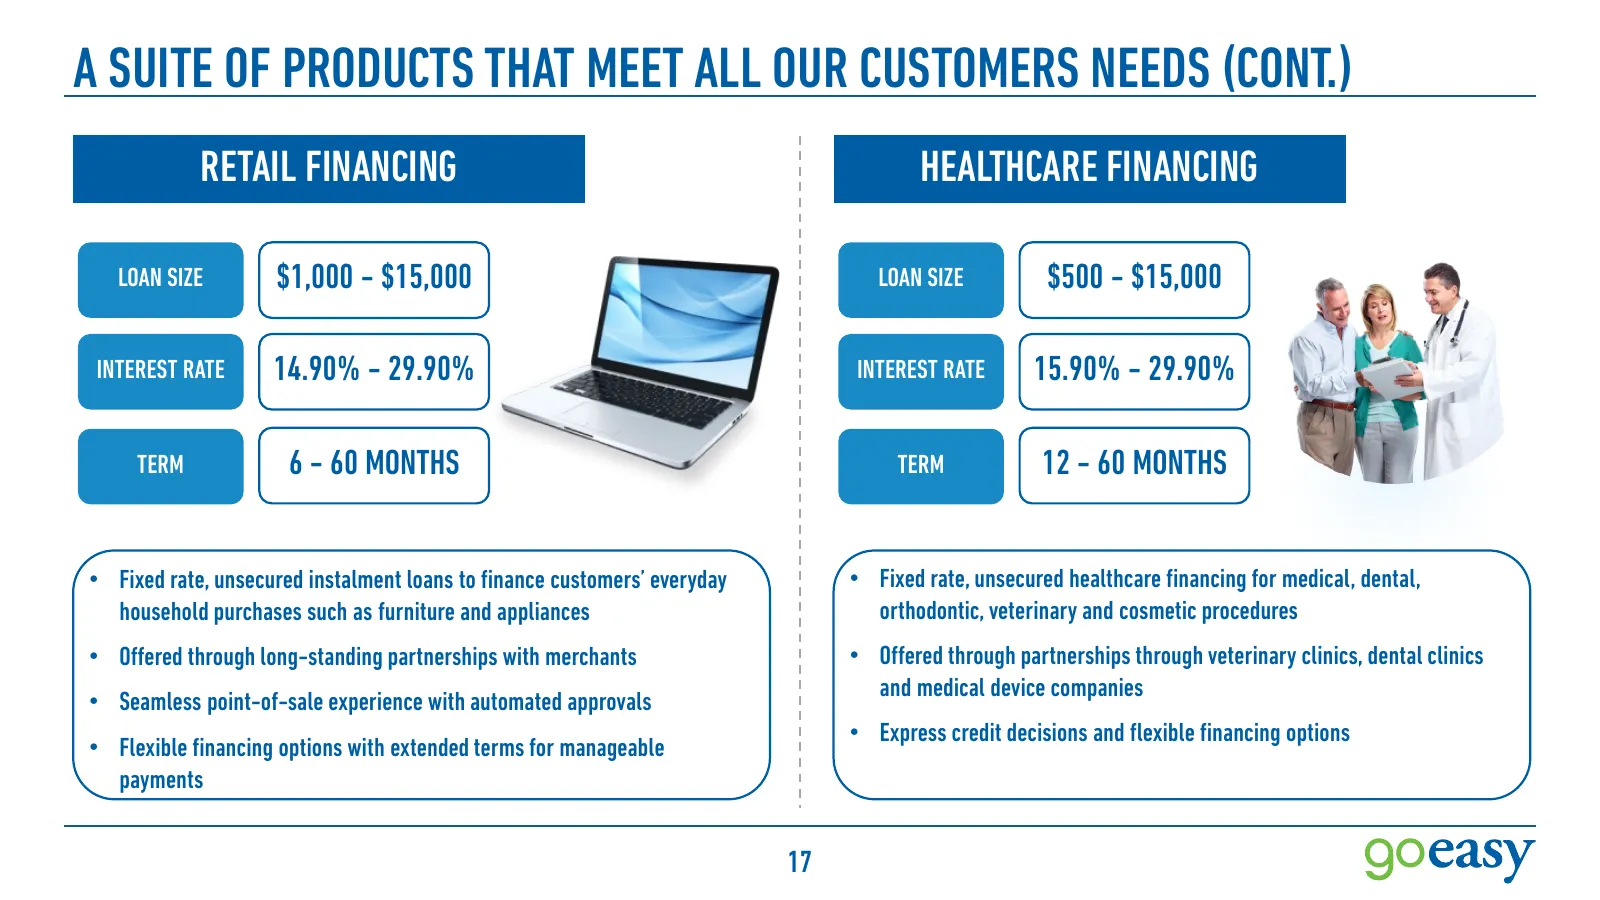
Slide 17: A Suite of Products: Retail and Healthcare Financing
A SUITE OF PRODUCTS THAT MEET ALL OUR CUSTOMERS NEEDS (CONT.) RETAIL FINANCING HEALTHCARE FINANCING LOAN SIZE $1,000 - $15,000 LOAN SIZE $500 - $15,000 INTEREST RATE 14.90% - 29.90% INTEREST RATE 15.90% - 29.90% TERM 6 - 60 MONTHS TERM 12 - 60 MONTHS • Fixed rate, unsecured instalment loans to finan
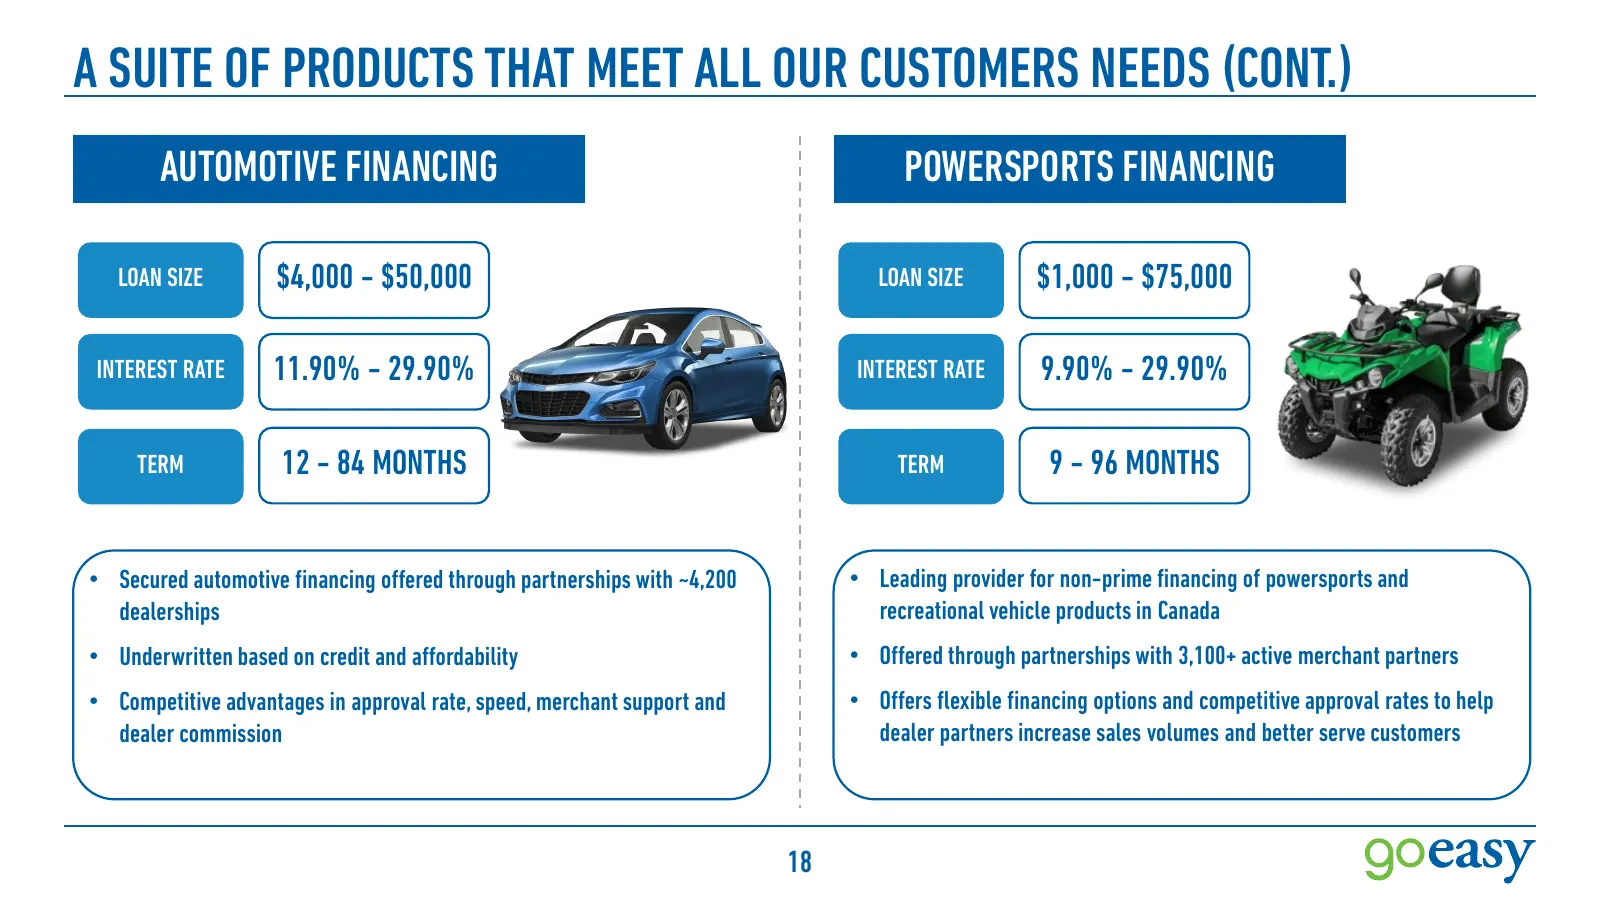
Slide 18: A Suite of Products: Automotive and Powersports Financing
A SUITE OF PRODUCTS THAT MEET ALL OUR CUSTOMERS NEEDS (CONT.) AUTOMOTIVE FINANCING POWERSPORTS FINANCING LOAN SIZE $4,000 - $50,000 LOAN SIZE $1,000 - $75,000 INTEREST RATE 11.90% - 29.90% INTEREST RATE 9.90% - 29.90% TERM 12 - 84 MONTHS TERM 9 - 96 MONTHS • Secured automotive financing offered thro
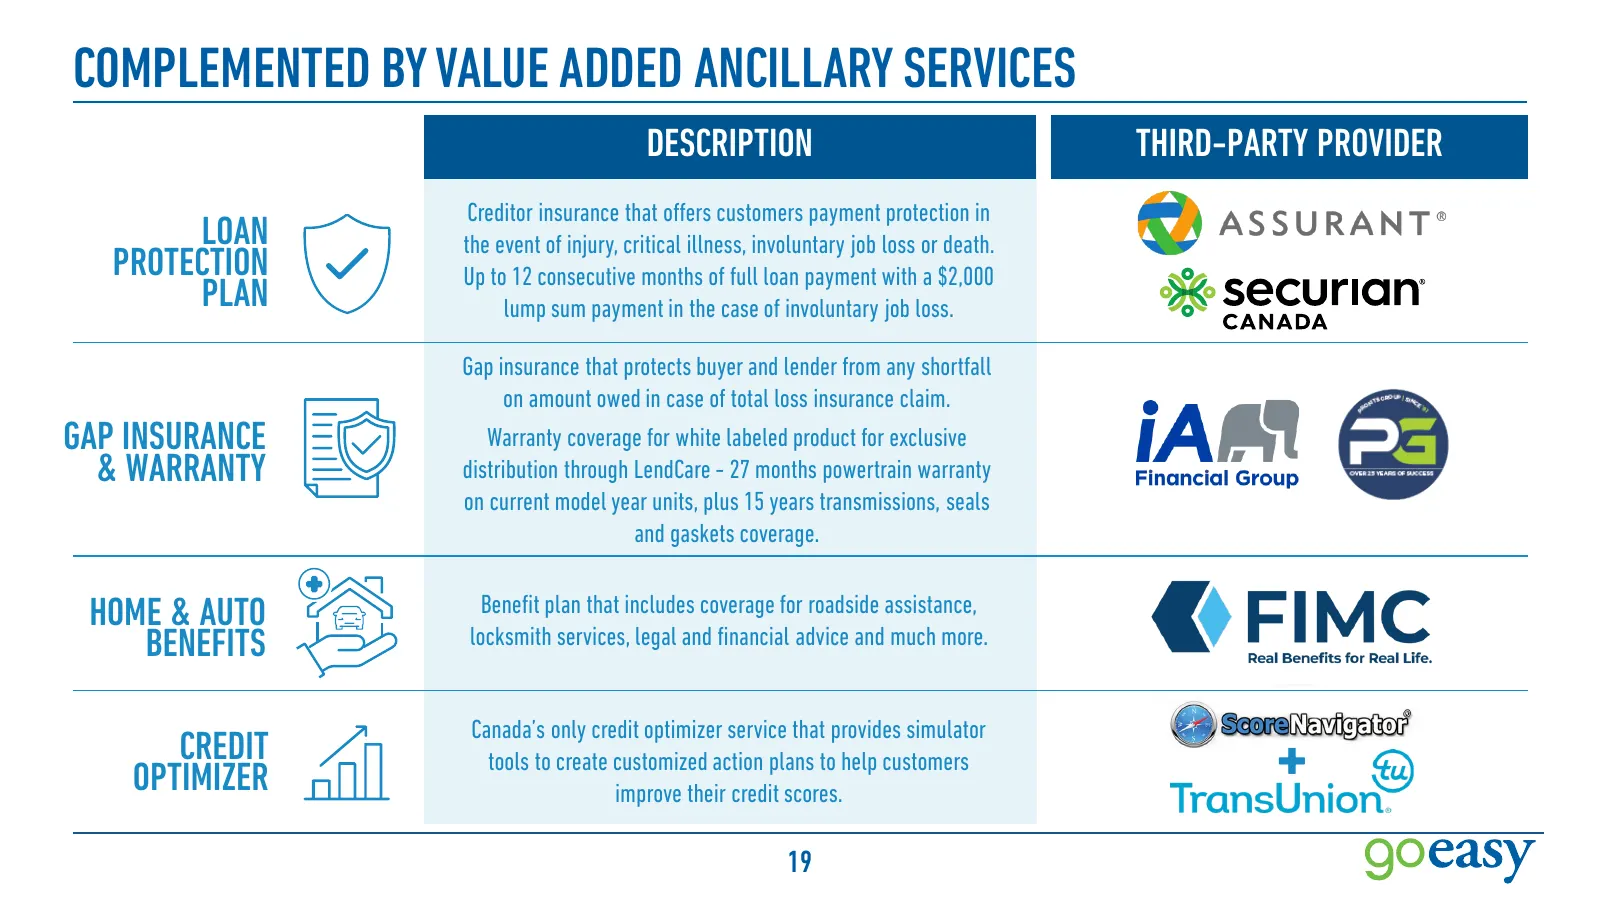
Slide 19: Complemented by Value Added Ancillary Services
COMPLEMENTED BY VALUE ADDED ANCILLARY SERVICES DESCRIPTION THIRD-PARTY PROVIDER Creditor insurance that offers customers payment protection in LOAN the event of injury, critical illness, involuntary job loss or death. PROTECTION Up to 12 consecutive months of full loan payment with a $2,000 PLAN lum

Slide 20: Corporate Strategy: II. Channel
CORPORATE STRATEGY II. CHANNEL
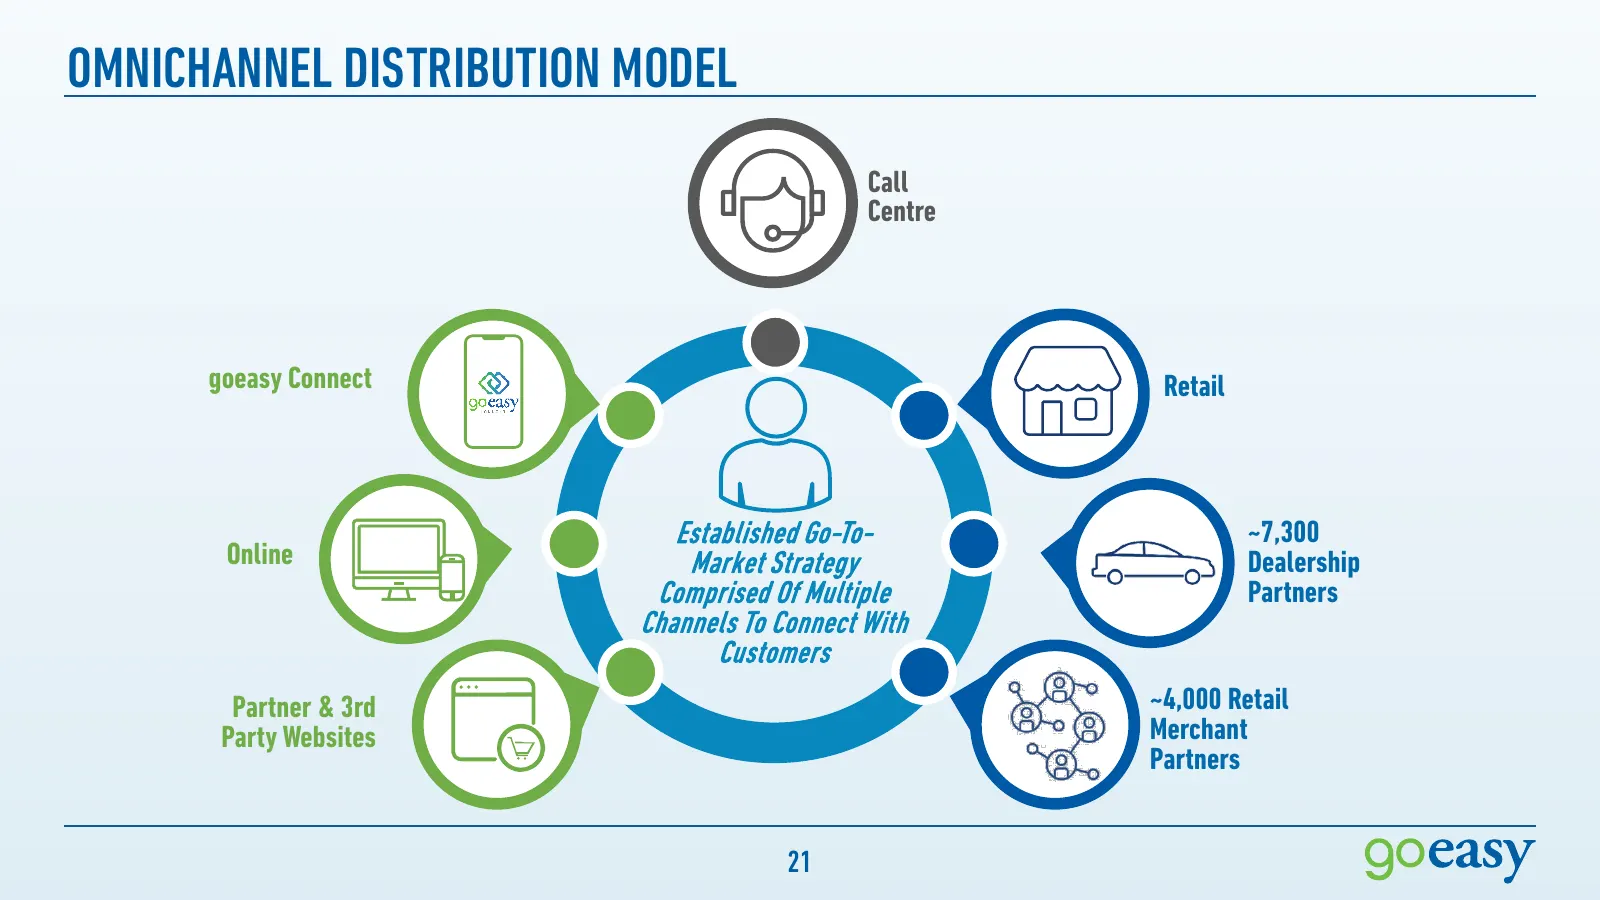
Slide 21: Omnichannel Distribution Model
OMNICHANNEL DISTRIBUTION MODEL Call Centre goeasy Connect Retail Established Go-To- ~7,300 Online Market Strategy Dealership Comprised Of Multiple Partners Channels To Connect With Customers Partner & 3rd ~4,000 Retail Party Websites Merchant Partners 21

Slide 22: Corporate Strategy: III. Geographic Expansion
CORPORATE STRATEGY III. GEOGRAPHIC EXPANSION
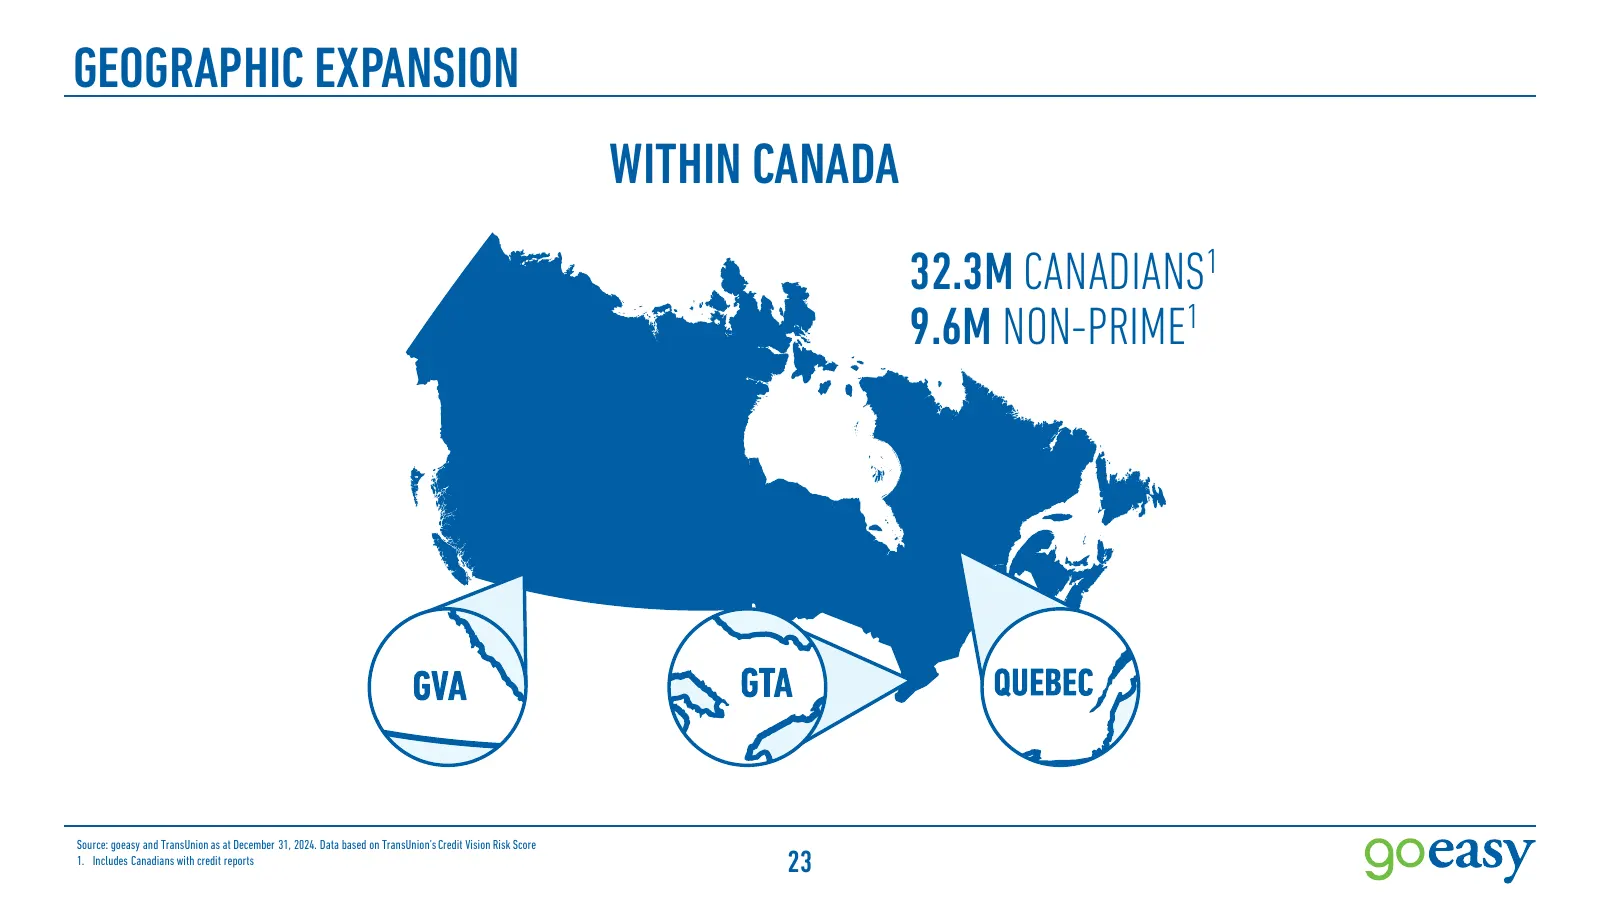
Slide 23: Geographic Expansion Within Canada
GEOGRAPHIC EXPANSION WITHIN CANADA 32.3M CANADIANS1 9.6M NON-PRIME1 Source: goeasy and TransUnion as at December 31, 2024. Data based on TransUnion’s Credit Vision Risk Score 1. Includes Canadians with credit reports 23

Slide 24: Corporate Strategy: IV. Financial Wellness
CORPORATE STRATEGY IV. FINANCIAL WELLNESS
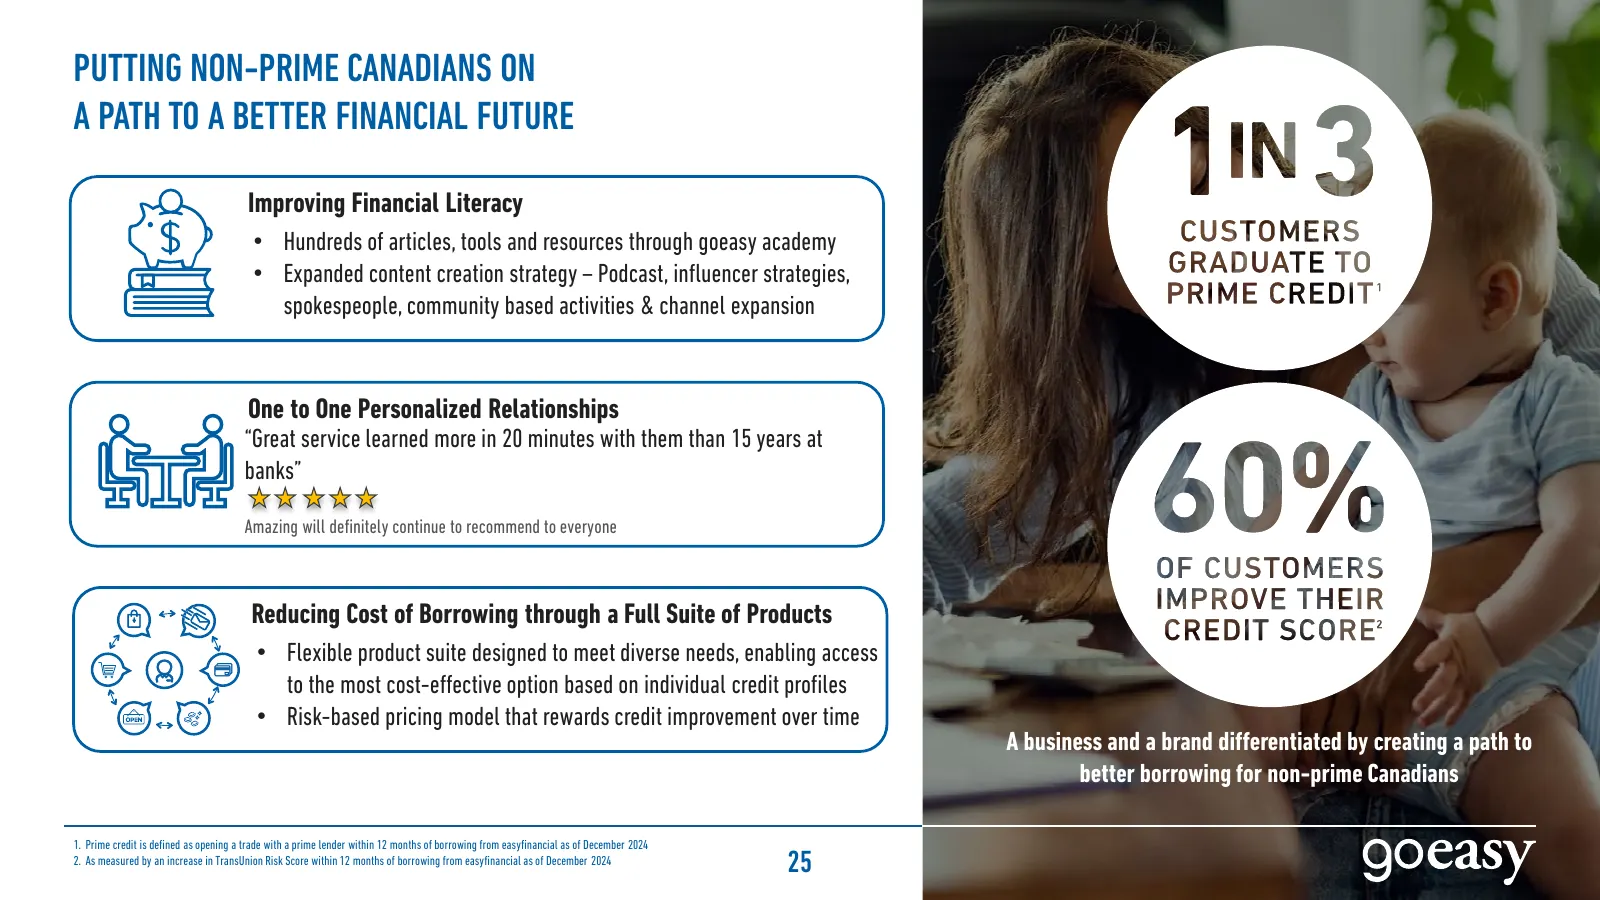
Slide 25: Putting Non-Prime Canadians on a Path to a Better Financial Future
PUTTING NON-PRIME CANADIANS ON A PATH TO A BETTER FINANCIAL FUTURE Improving Financial Literacy • Hundreds of articles, tools and resources through goeasy academy • Expanded content creation strategy – Podcast, influencer strategies, spokespeople, community based activities & channel expansion One t

Slide 26: Competitive & Legislative Landscape
COMPETITIVE & LEGISLATIVE LANDSCAPE
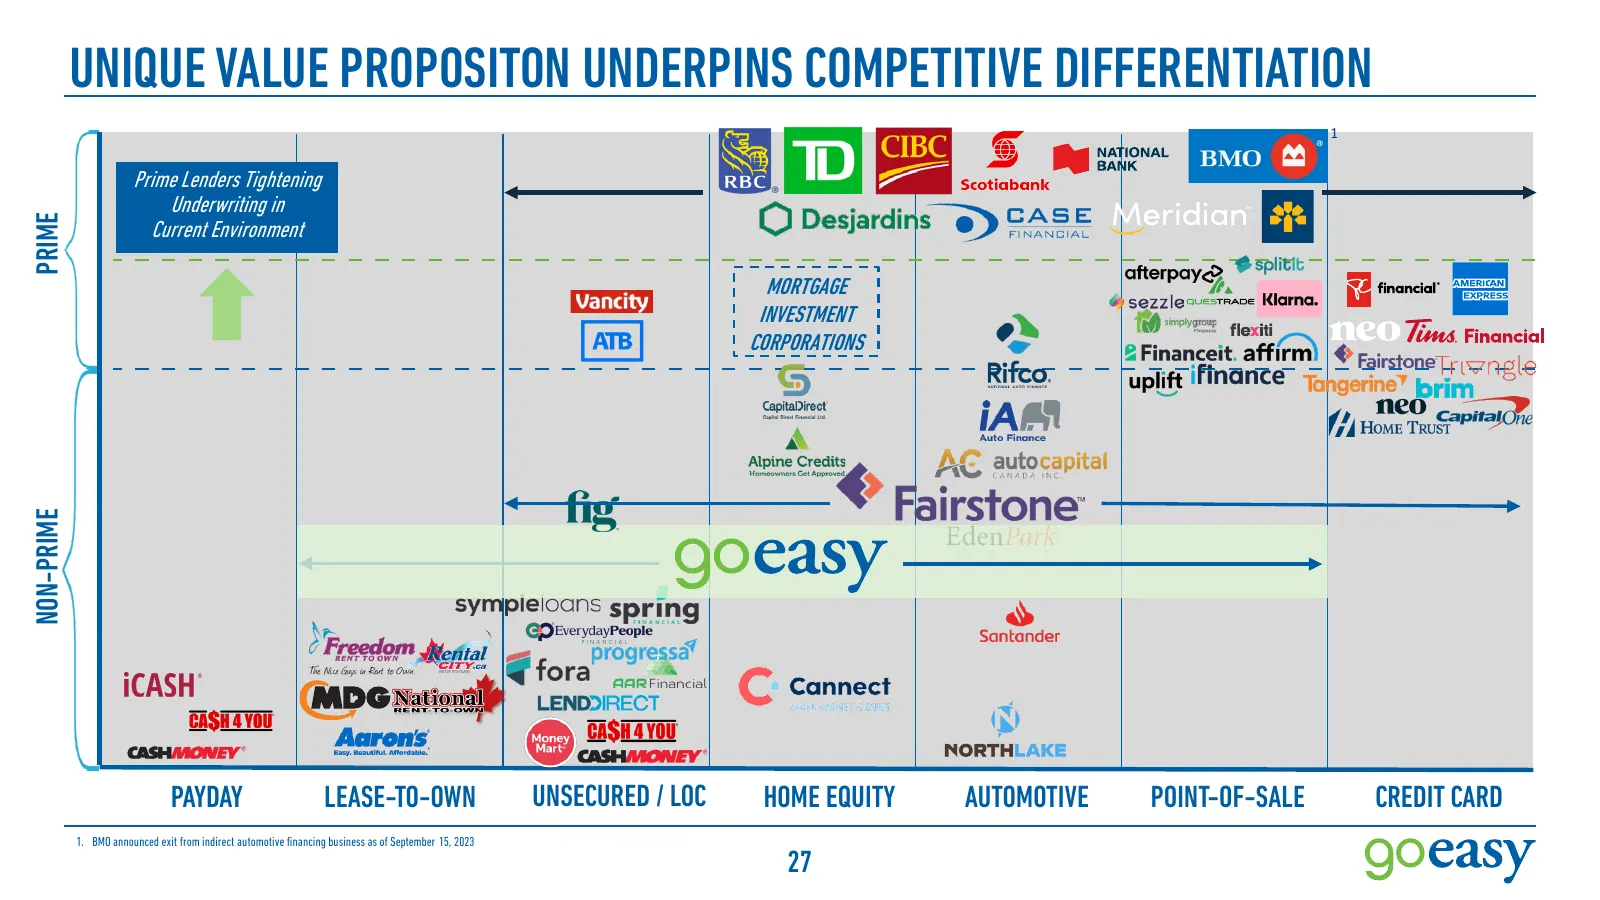
Slide 27: Unique Value Proposition Underpins Competitive Differentiation
UNIQUE VALUE PROPOSITON UNDERPINS COMPETITIVE DIFFERENTIATION 1 Prime Lenders Tightening Underwriting in PRIME Current Environment MORTGAGE INVESTMENT CORPORATIONS NON-PRIME PAYDAY LEASE-TO-OWN UNSECURED / LOC HOME EQUITY AUTOMOTIVE POINT-OF-SALE CREDIT CARD 1. BMO announced exit from indirect autom
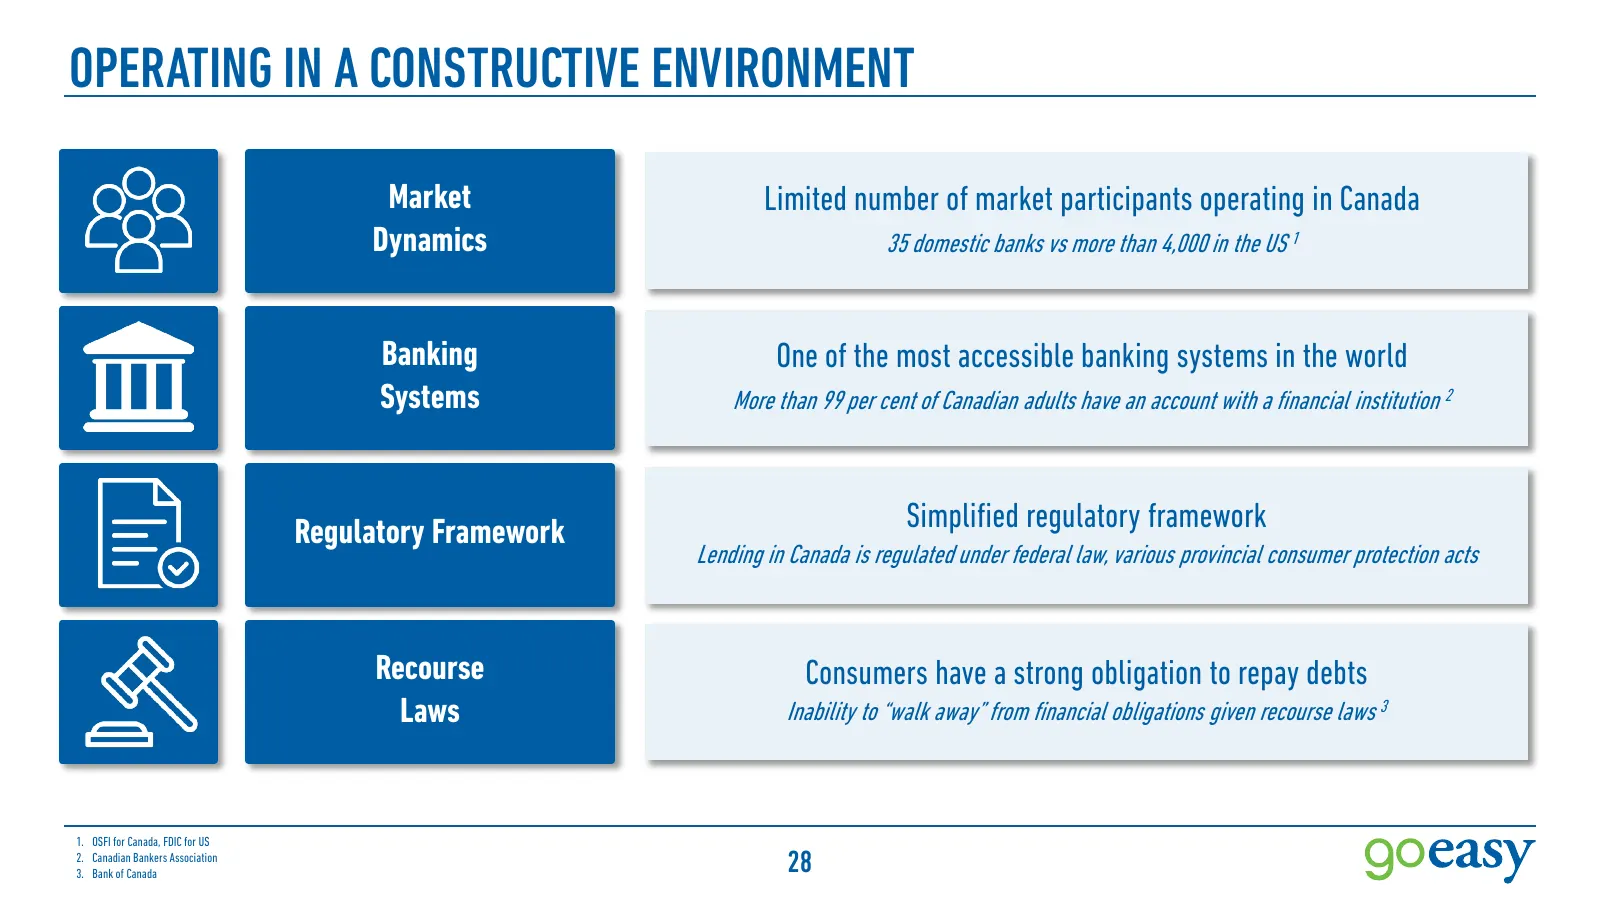
Slide 28: Operating in a Constructive Environment
OPERATING IN A CONSTRUCTIVE ENVIRONMENT Market Limited number of market participants operating in Canada Dynamics 35 domestic banks vs more than 4,000 in the US 1 Banking One of the most accessible banking systems in the world Systems More than 99 per cent of Canadian adults have an account with a f
Slide 29: Evolving and Constructive Regulatory Environment
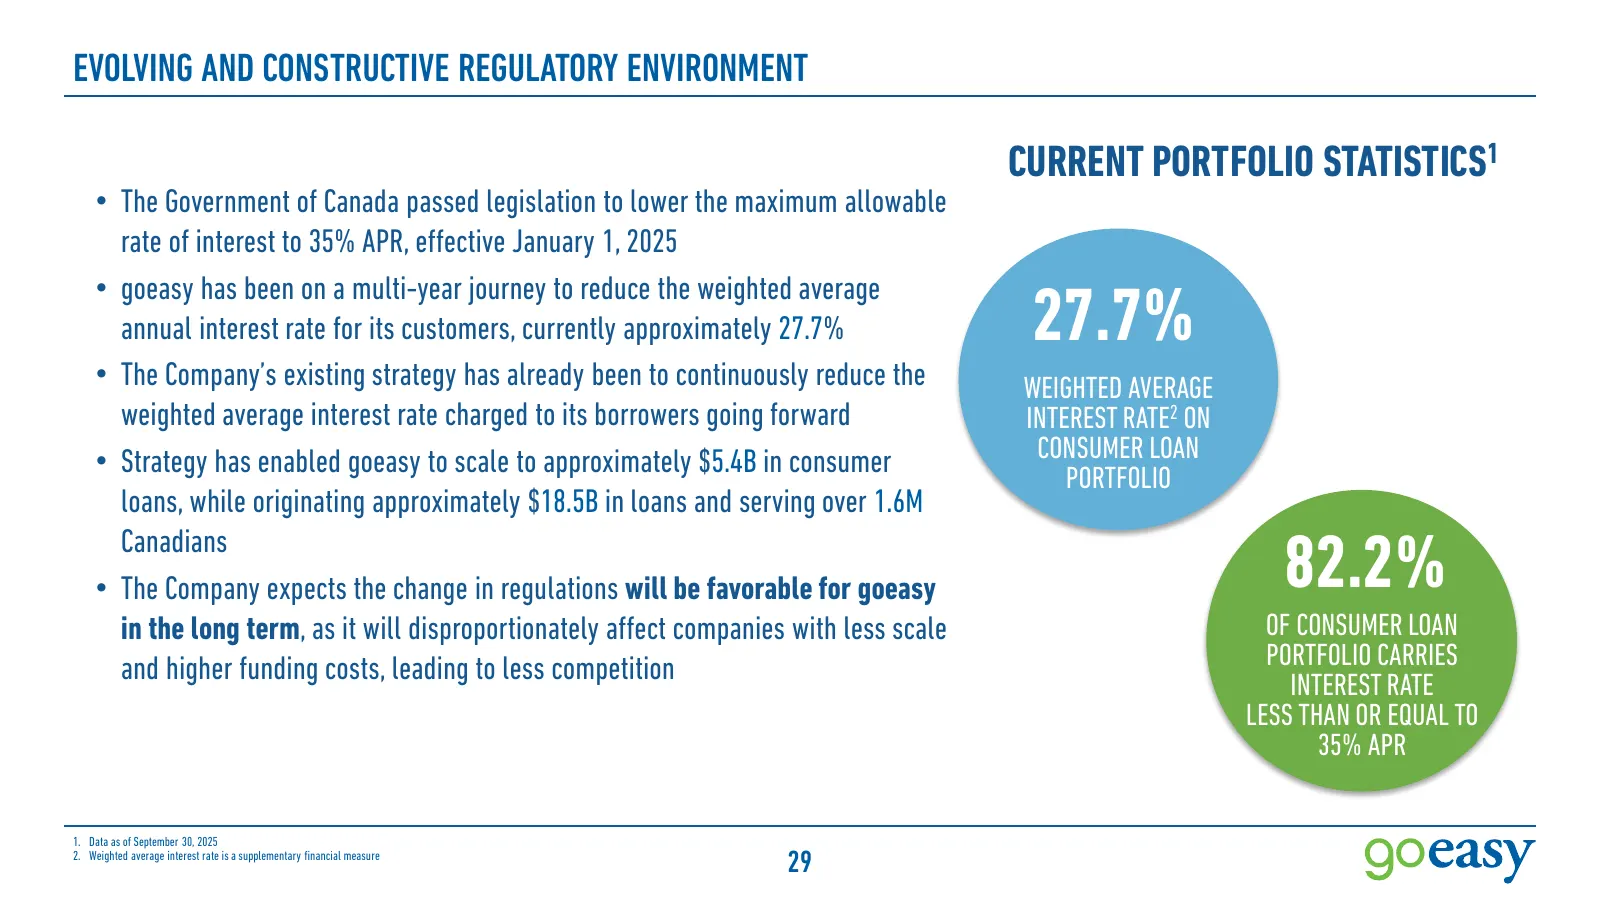
EVOLVING AND CONSTRUCTIVE REGULATORY ENVIRONMENT CURRENT PORTFOLIO STATISTICS1 • The Government of Canada passed legislation to lower the maximum allowable rate of interest to 35% APR, effective January 1, 2025 • goeasy has been on a multi-year journey to reduce the weighted average annual interest

Slide 30: Risk & Analytics
RISK & ANALYTICS
Slide 31: Rooted in Established Underwriting Practices to Manage Risk
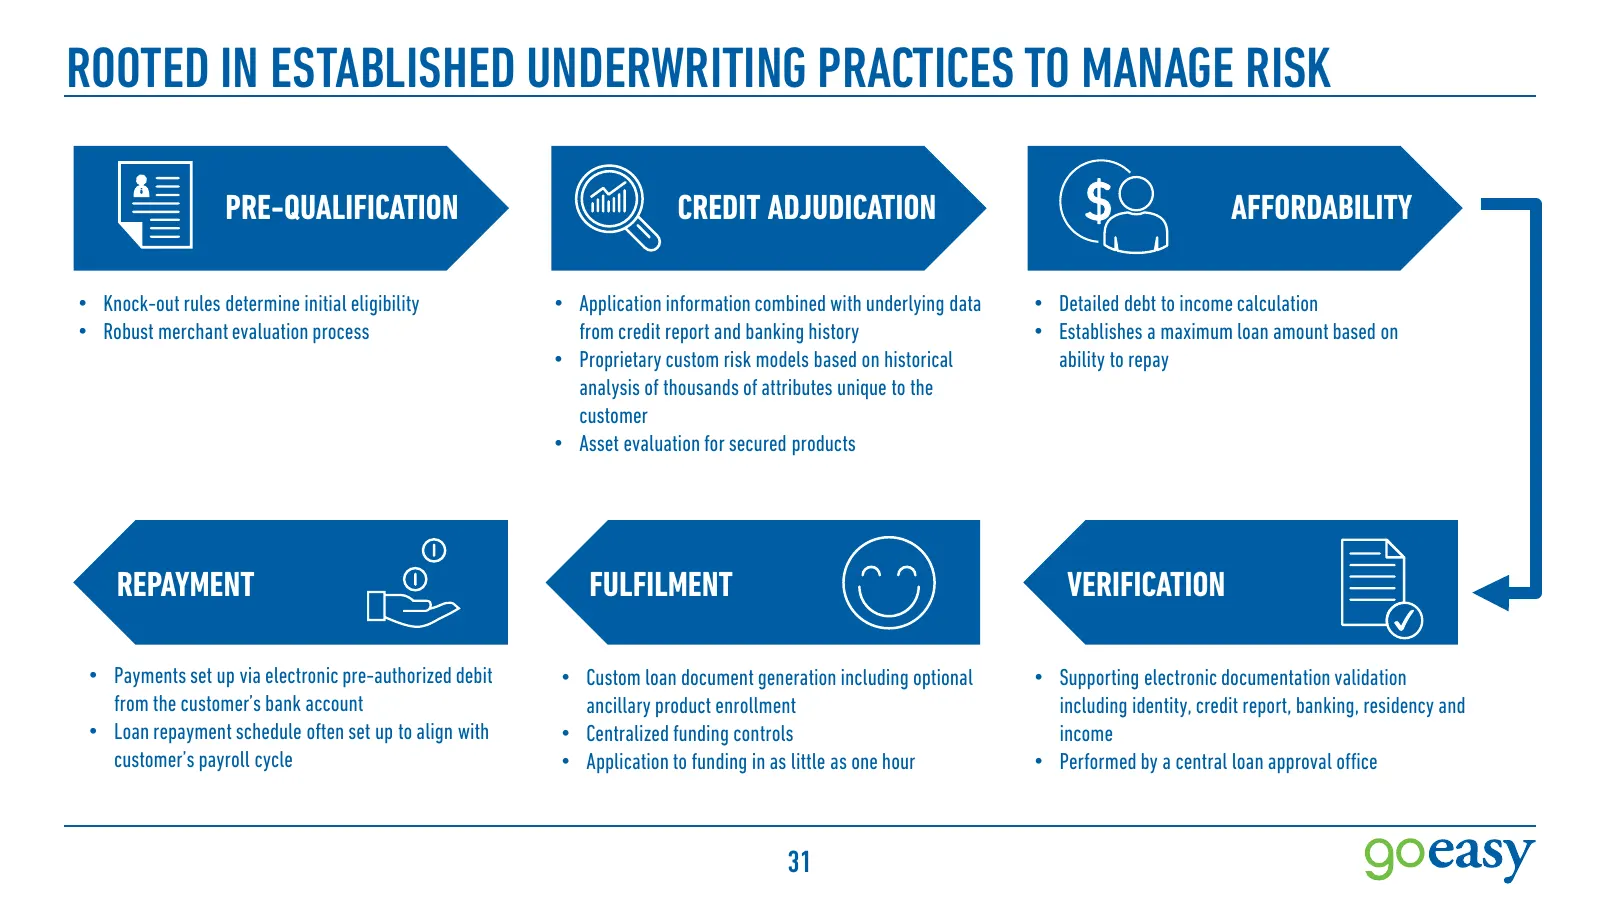
ROOTED IN ESTABLISHED UNDERWRITING PRACTICES TO MANAGE RISK PRE-QUALIFICATION CREDIT ADJUDICATION AFFORDABILITY • Knock-out rules determine initial eligibility • Application information combined with underlying data • Detailed debt to income calculation • Robust merchant evaluation process from cred
Slide 32: Robust Data Infrastructure and Advanced Modeling & Analytics
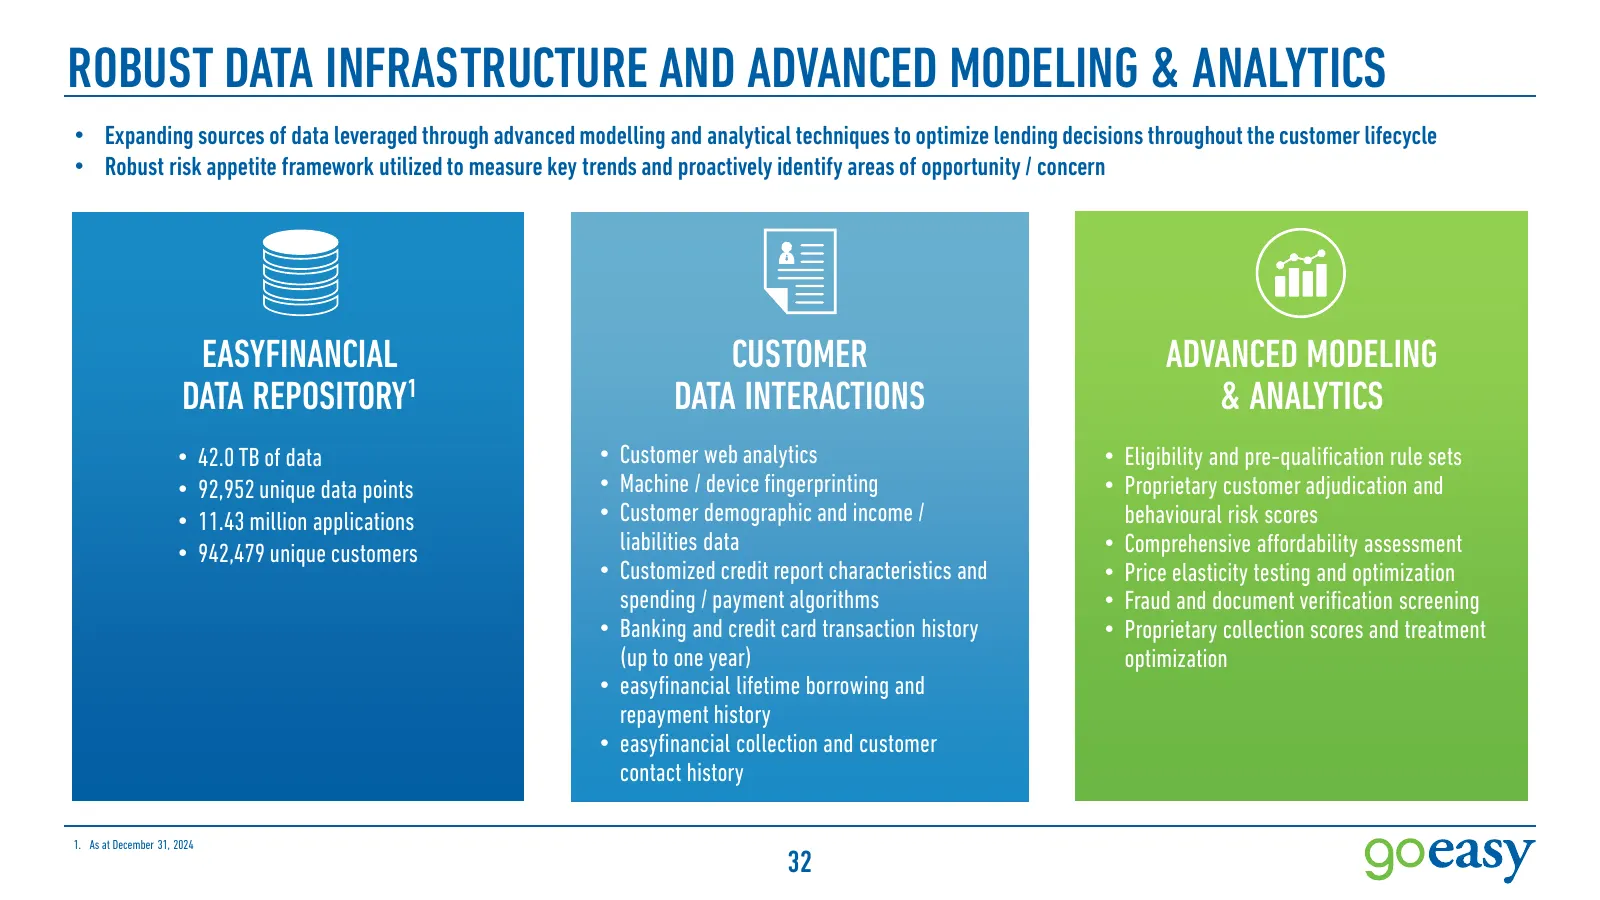
ROBUST DATA INFRASTRUCTURE AND ADVANCED MODELING & ANALYTICS • Expanding sources of data leveraged through advanced modelling and analytical techniques to optimize lending decisions throughout the customer lifecycle • Robust risk appetite framework utilized to measure key trends and proactively iden
Slide 33: Predictive Analytics and New Data Sources Improve Modelling
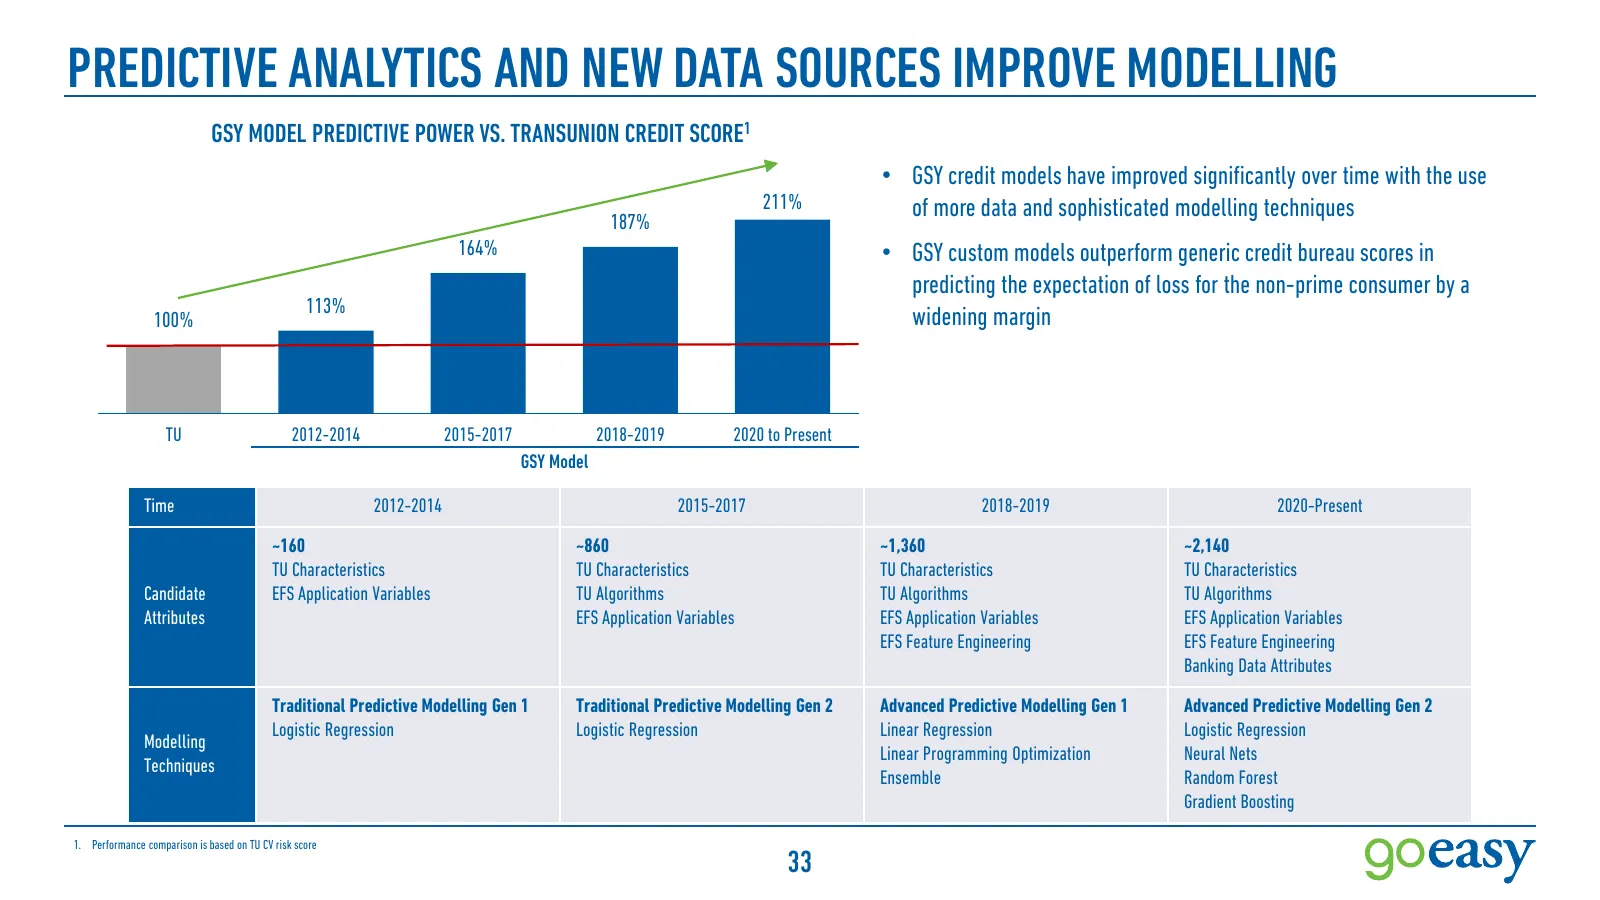
PREDICTIVE ANALYTICS AND NEW DATA SOURCES IMPROVE MODELLING GSY MODEL PREDICTIVE POWER VS. TRANSUNION CREDIT SCORE1 • GSY credit models have improved significantly over time with the use 211% of more data and sophisticated modelling techniques 187% 164% • GSY custom models outperform generic credit
Slide 34: Demonstrated Track Record of Driving Steady Financial Performance
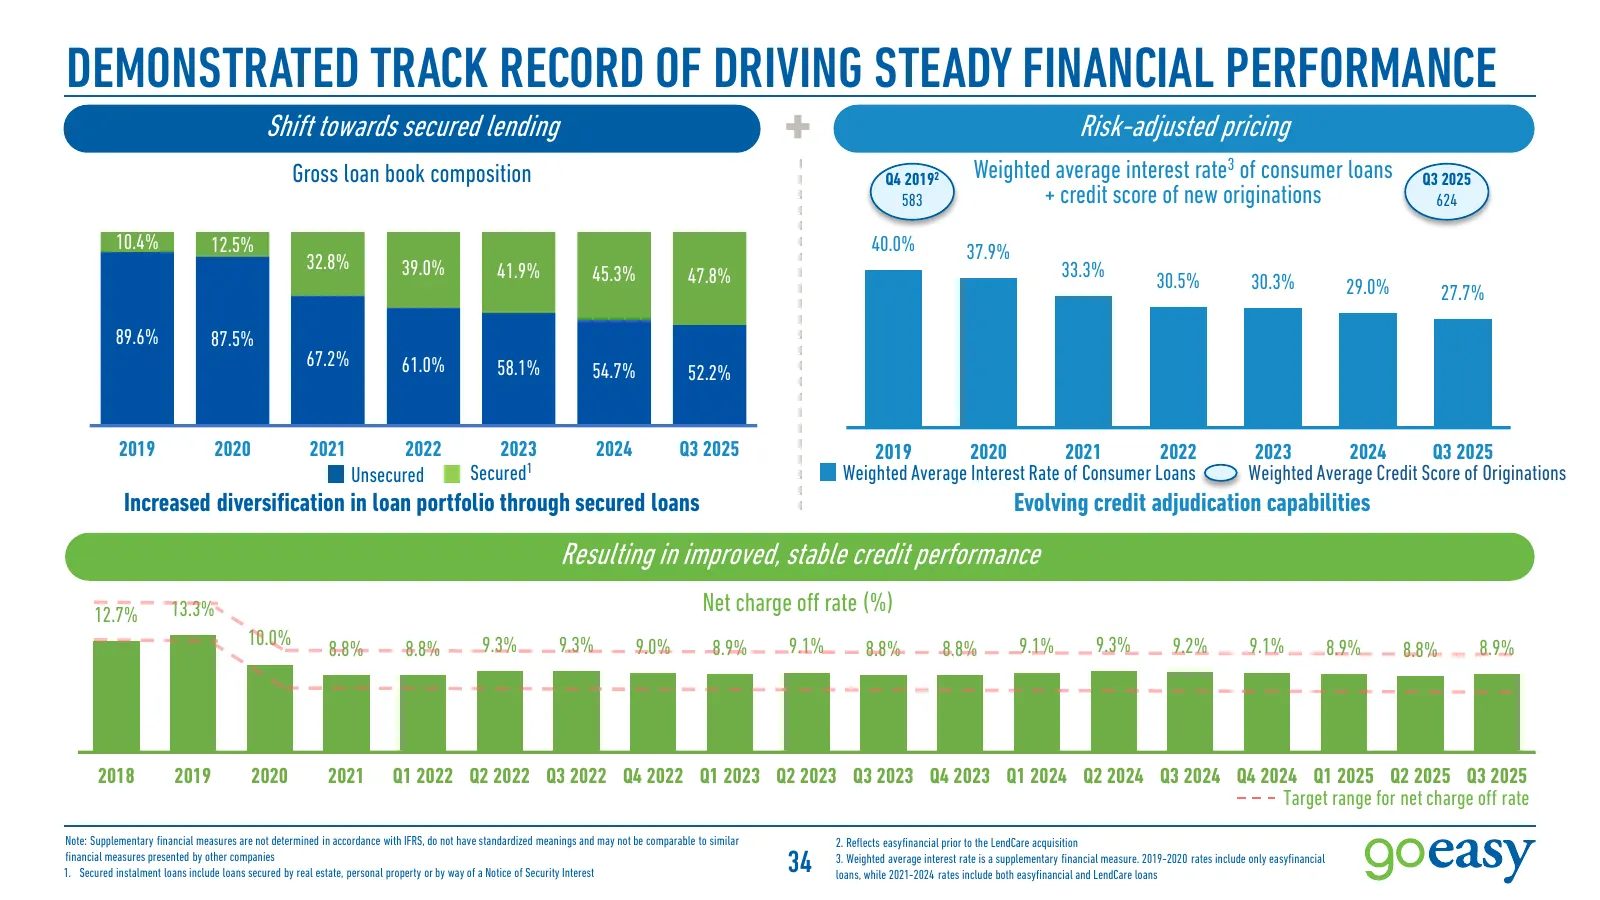
DEMONSTRATED TRACK RECORD OF DRIVING STEADY FINANCIAL PERFORMANCE Shift towards secured lending + Risk-adjusted pricing Weighted average interest rate3 of consumer loans Gross loan book composition Q4 20192 Q3 2025 583 + credit score of new originations 624 10.4% 12.5% 40.0% 37.9% 32.8% 39.0% 41.9%

Slide 35: Financial Performance & Capital Structure
FINANCIAL PERFORMANCE & CAPITAL STRUCTURE
Slide 36: Accelerating Loan Portfolio Growth Leading to Revenue Growth
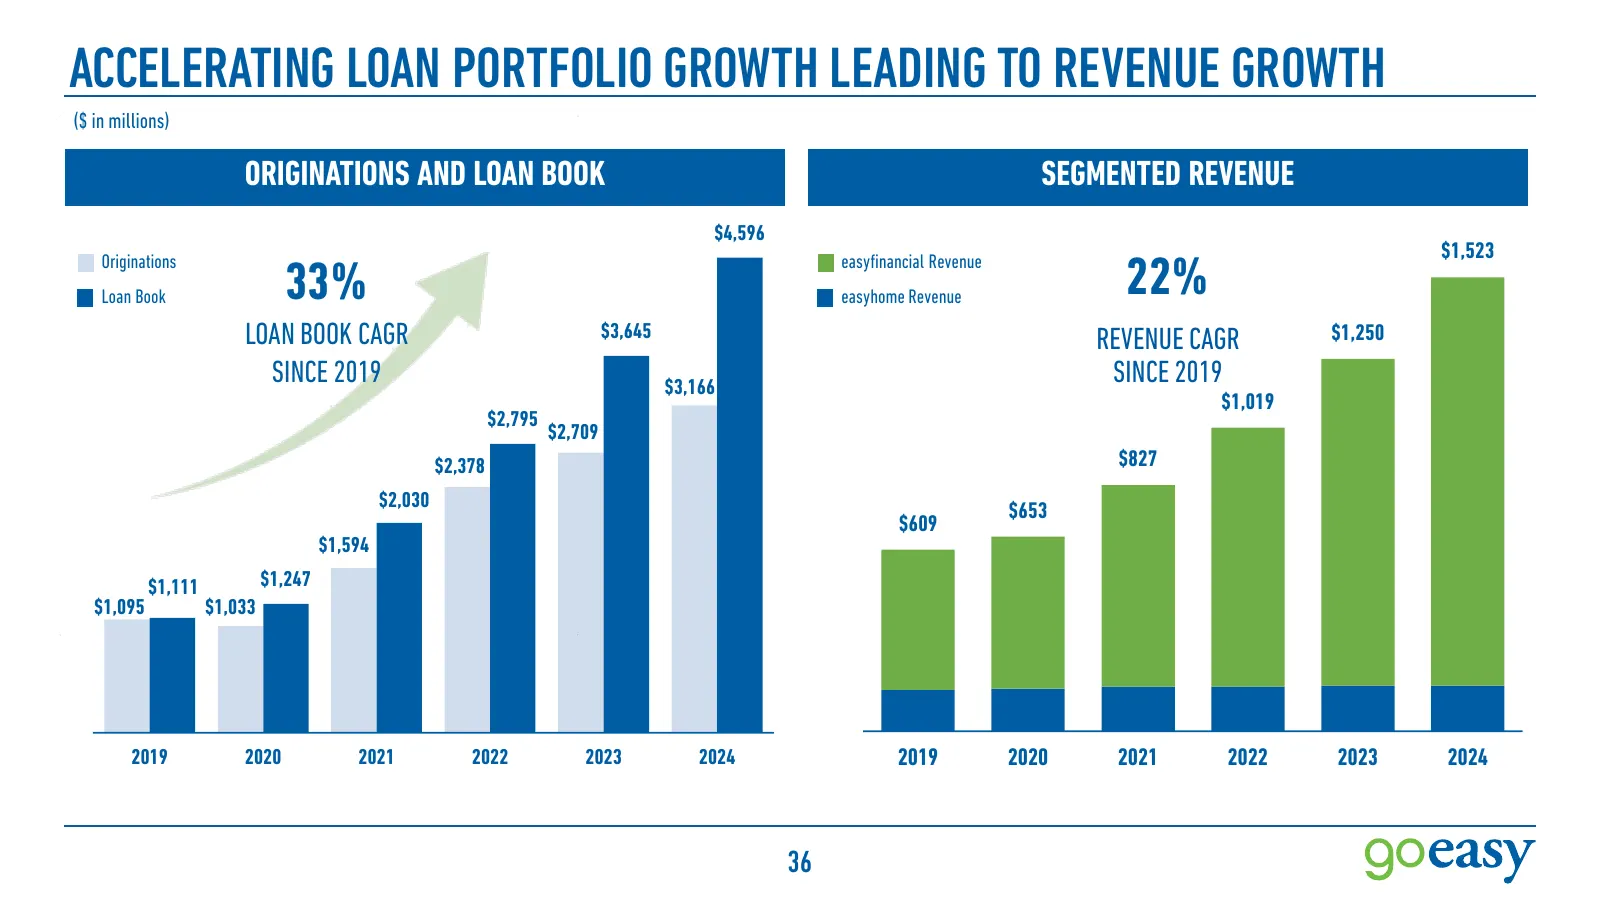
ACCELERATING LOAN PORTFOLIO GROWTH LEADING TO REVENUE GROWTH ($ in millions) ORIGINATIONS AND LOAN BOOK SEGMENTED REVENUE $4,596 $1,523 Originations Loan Book 33% easyfinancial Revenue easyhome Revenue 22% LOAN BOOK CAGR $3,645 REVENUE CAGR $1,250 SINCE 2019 $3,166 SINCE 2019 $1,019 $2,795 $2,709 $2
Slide 37: Robust Performance and Consistently Strong Return Metrics
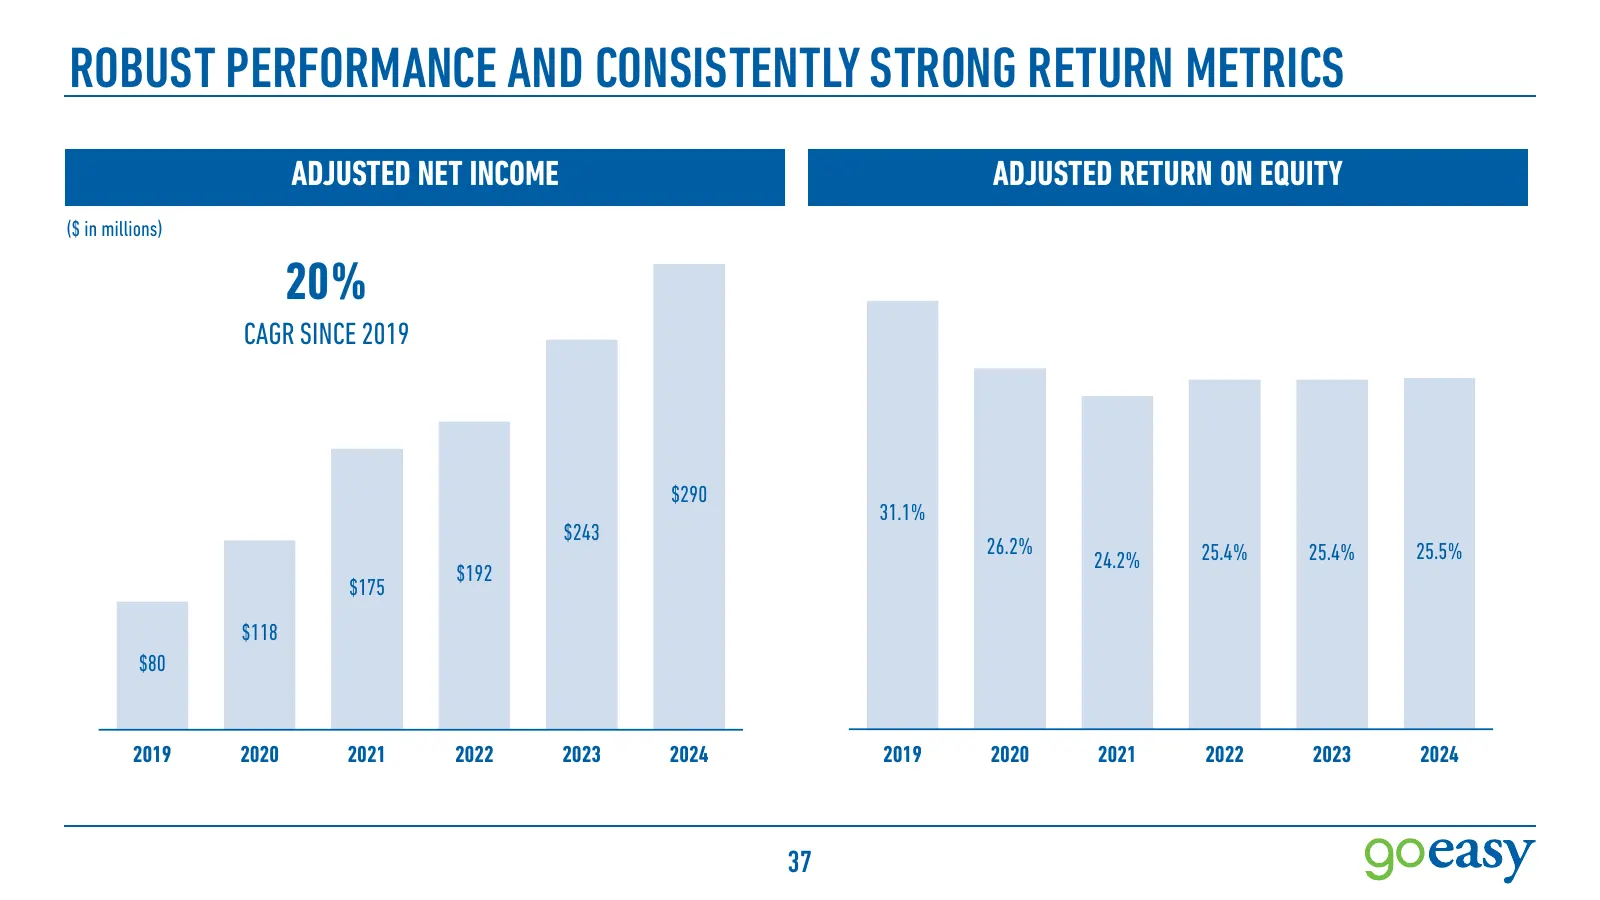
ROBUST PERFORMANCE AND CONSISTENTLY STRONG RETURN METRICS ADJUSTED NET INCOME ADJUSTED RETURN ON EQUITY ($ in millions) 20% CAGR SINCE 2019 $290 31.1% $243 26.2% 25.4% 25.4% 25.5% 24.2% $192 $175 $118 $80 2019 2020 2021 2022 2023 2024 2019 2020 2021 2022 2023 2024 37
Slide 38: Capital Structure Established to Support Strong Loan Growth
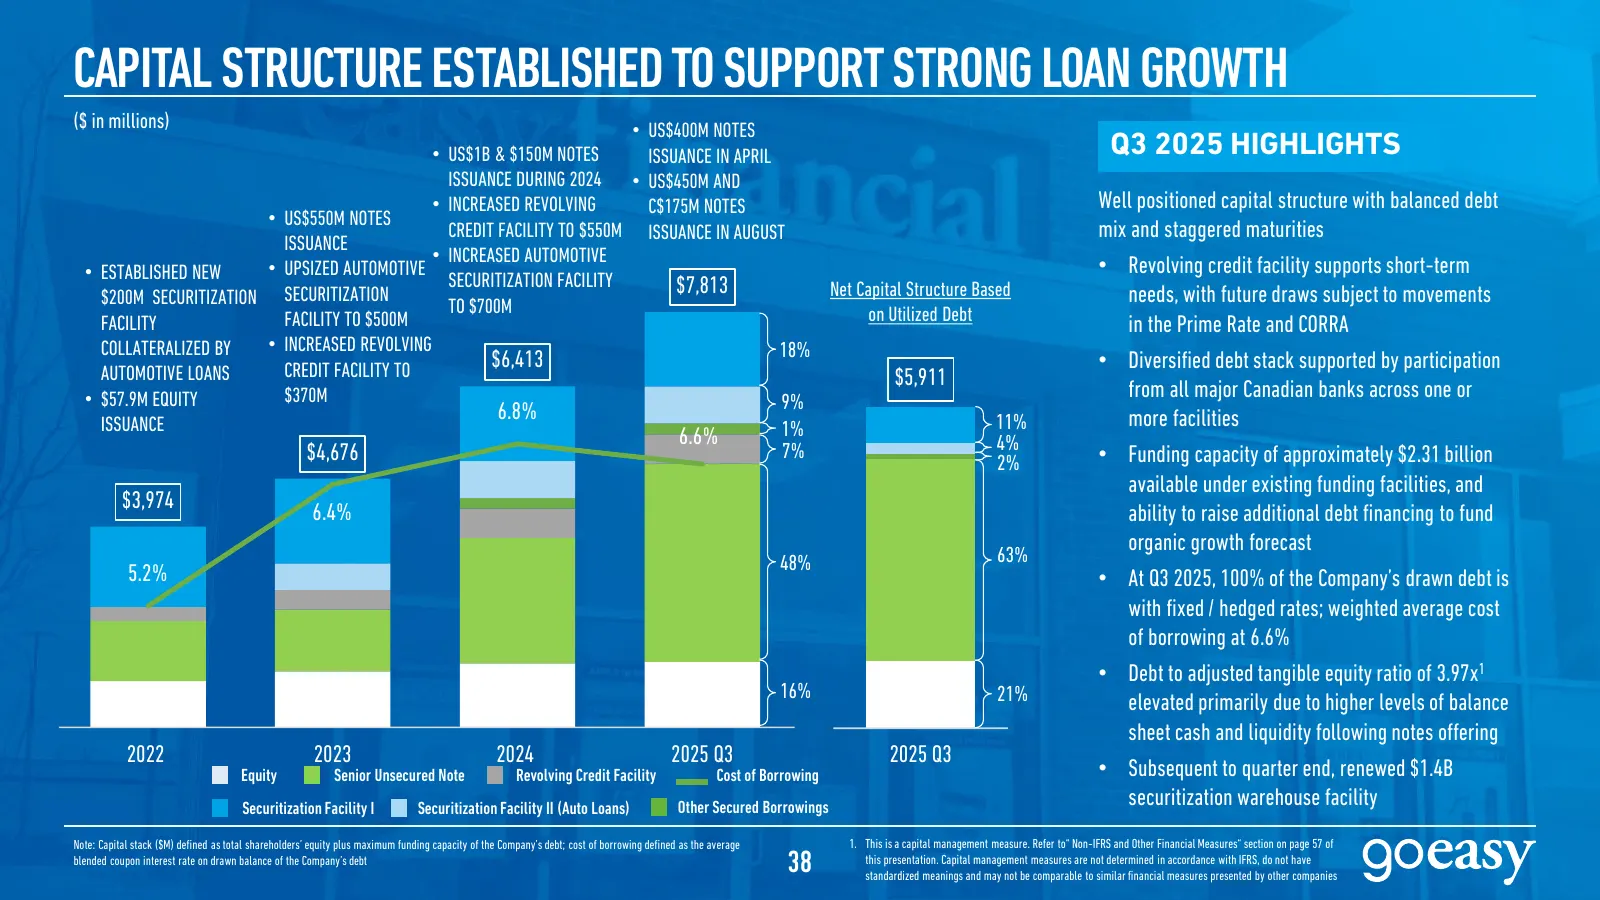
CAPITAL STRUCTURE ESTABLISHED TO SUPPORT STRONG LOAN GROWTH ($ in millions) • US$400M NOTES • US$1B & $150M NOTES ISSUANCE IN APRIL Q3 2025 HIGHLIGHTS ISSUANCE DURING 2024 • US$450M AND • INCREASED REVOLVING C$175M NOTES Well positioned capital structure with balanced debt • US$550M NOTES CREDIT FAC
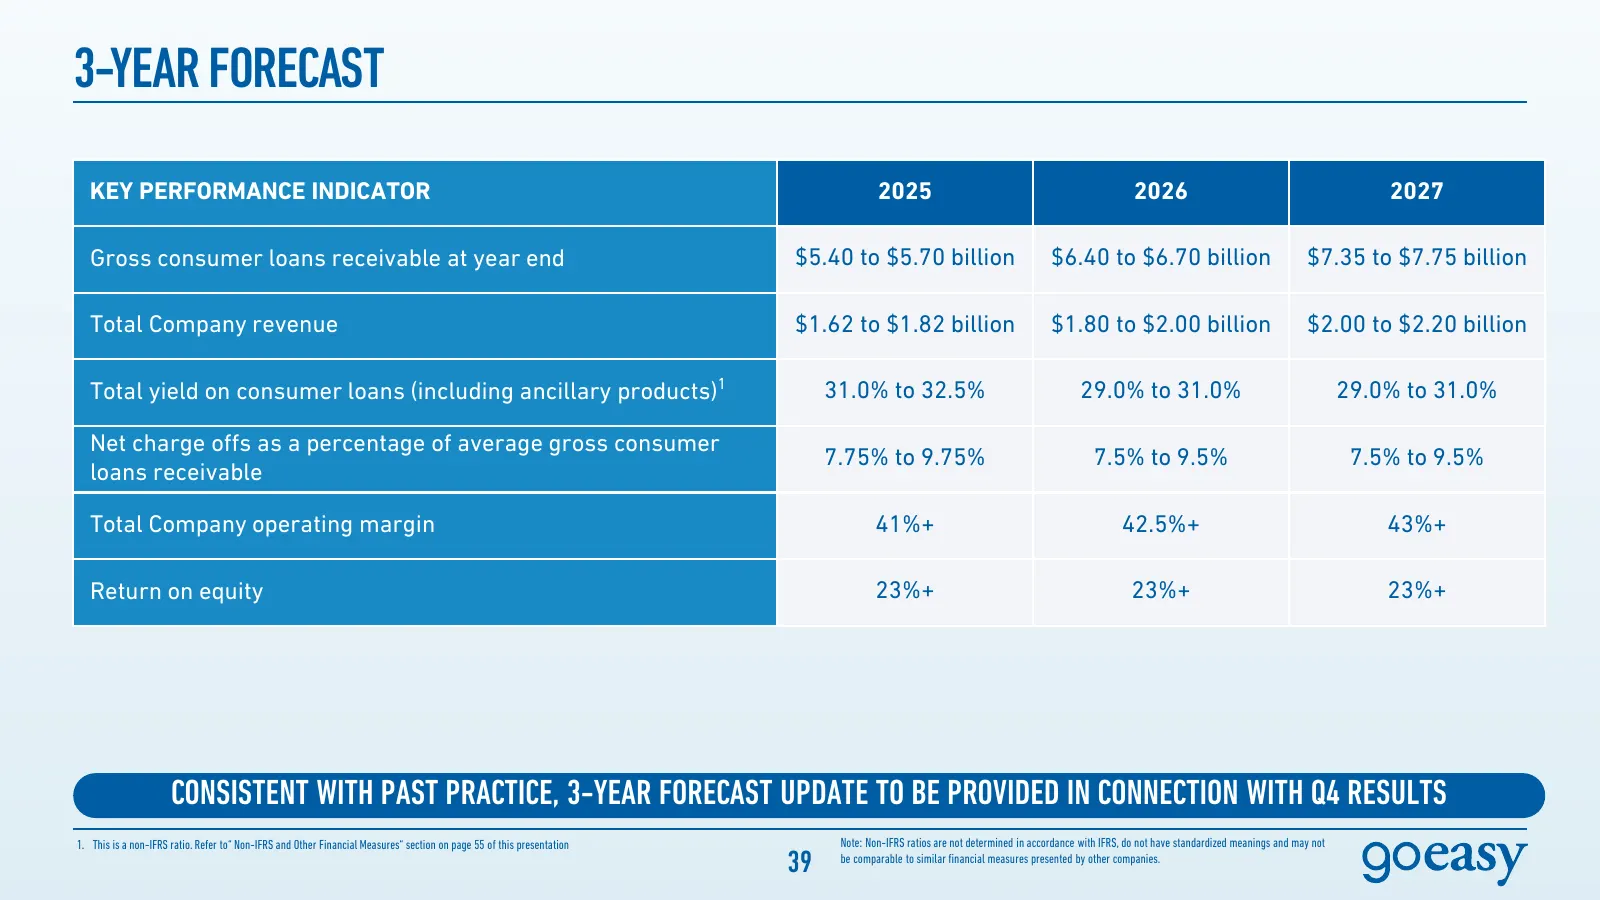
Slide 39: 3-Year Forecast
3-YEAR FORECAST KEY PERFORMANCE INDICATOR 2025 2026 2027 Gross consumer loans receivable at year end $5.40 to $5.70 billion $6.40 to $6.70 billion $7.35 to $7.75 billion Total Company revenue $1.62 to $1.82 billion $1.80 to $2.00 billion $2.00 to $2.20 billion Total yield on consumer loans (includin

Slide 40: ESG Overview
goeasy ESG OVERVIEW | :
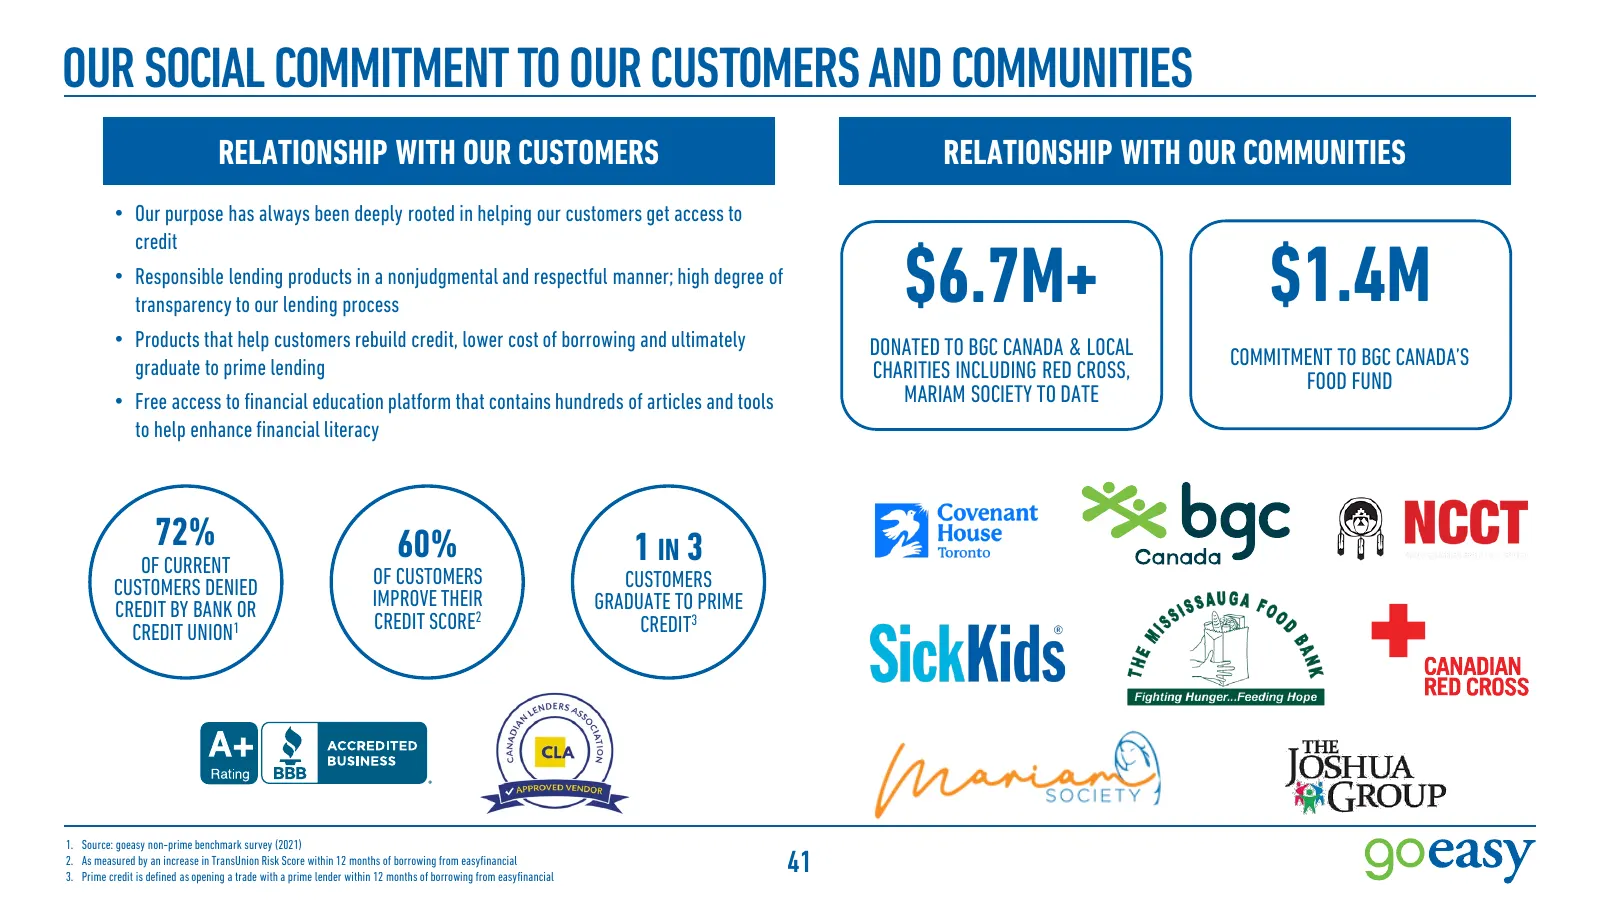
Slide 41: Our Social Commitment to Our Customers and Communities
OUR SOCIAL COMMITMENT TO OUR CUSTOMERS AND COMMUNITIES RELATIONSHIP WITH OUR CUSTOMERS RELATIONSHIP WITH OUR COMMUNITIES • Our purpose has always been deeply rooted in helping our customers get access to credit • Responsible lending products in a nonjudgmental and respectful manner; high degree of t
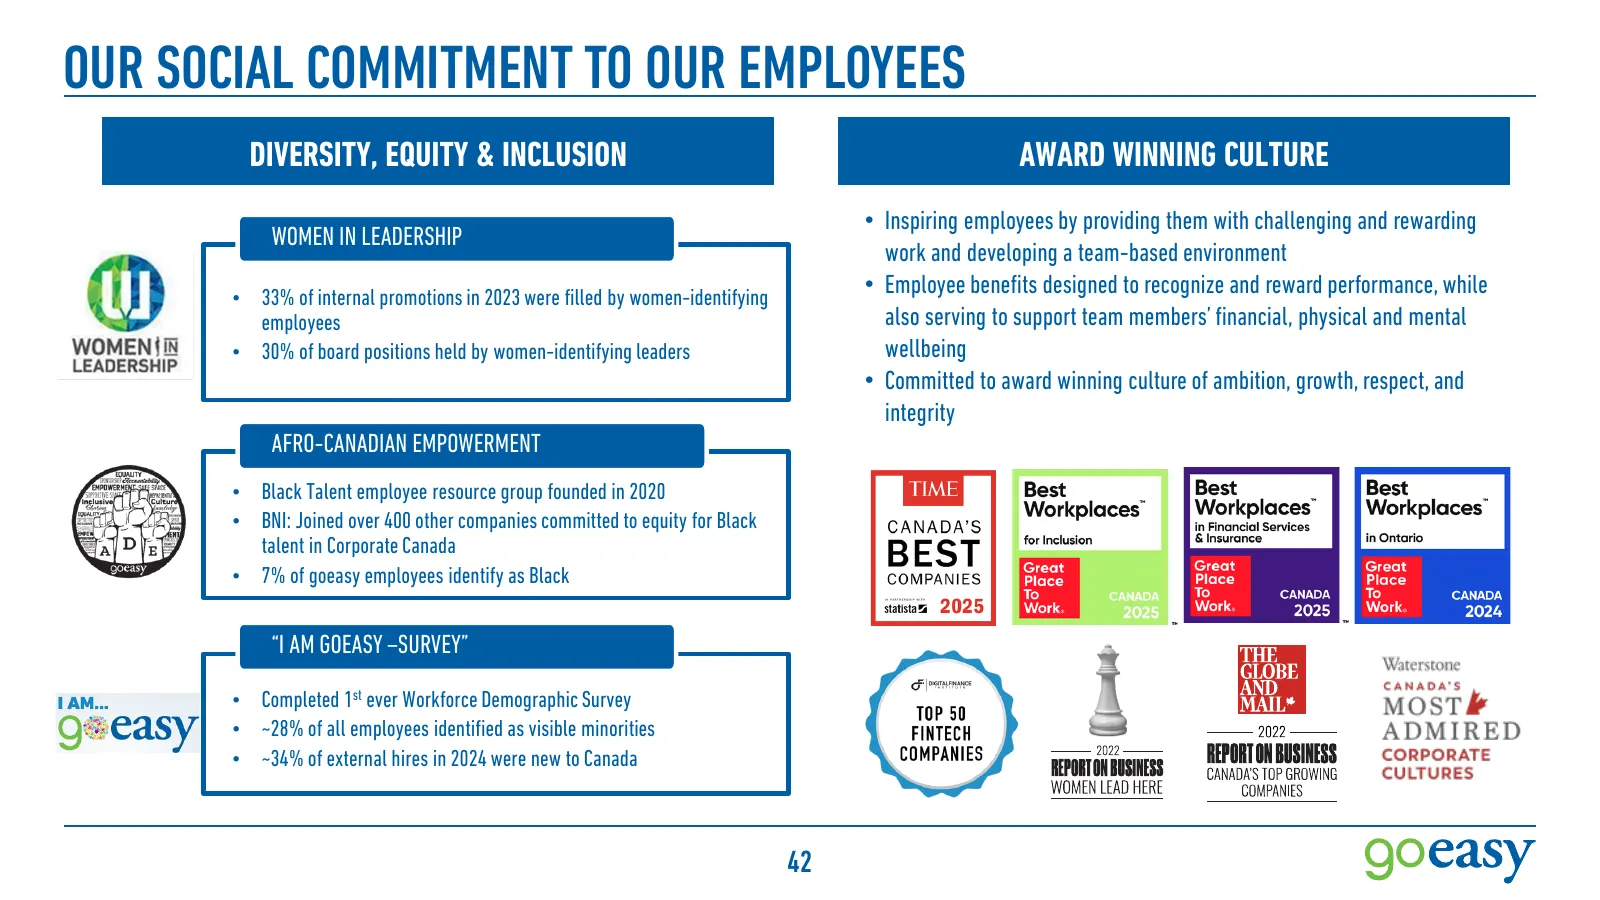
Slide 42: Our Social Commitment to Our Employees
OUR SOCIAL COMMITMENT TO OUR EMPLOYEES DIVERSITY, EQUITY & INCLUSION AWARD WINNING CULTURE • Inspiring employees by providing them with challenging and rewarding WOMEN IN LEADERSHIP work and developing a team-based environment • 33% of internal promotions in 2023 were filled by women-identifying • E
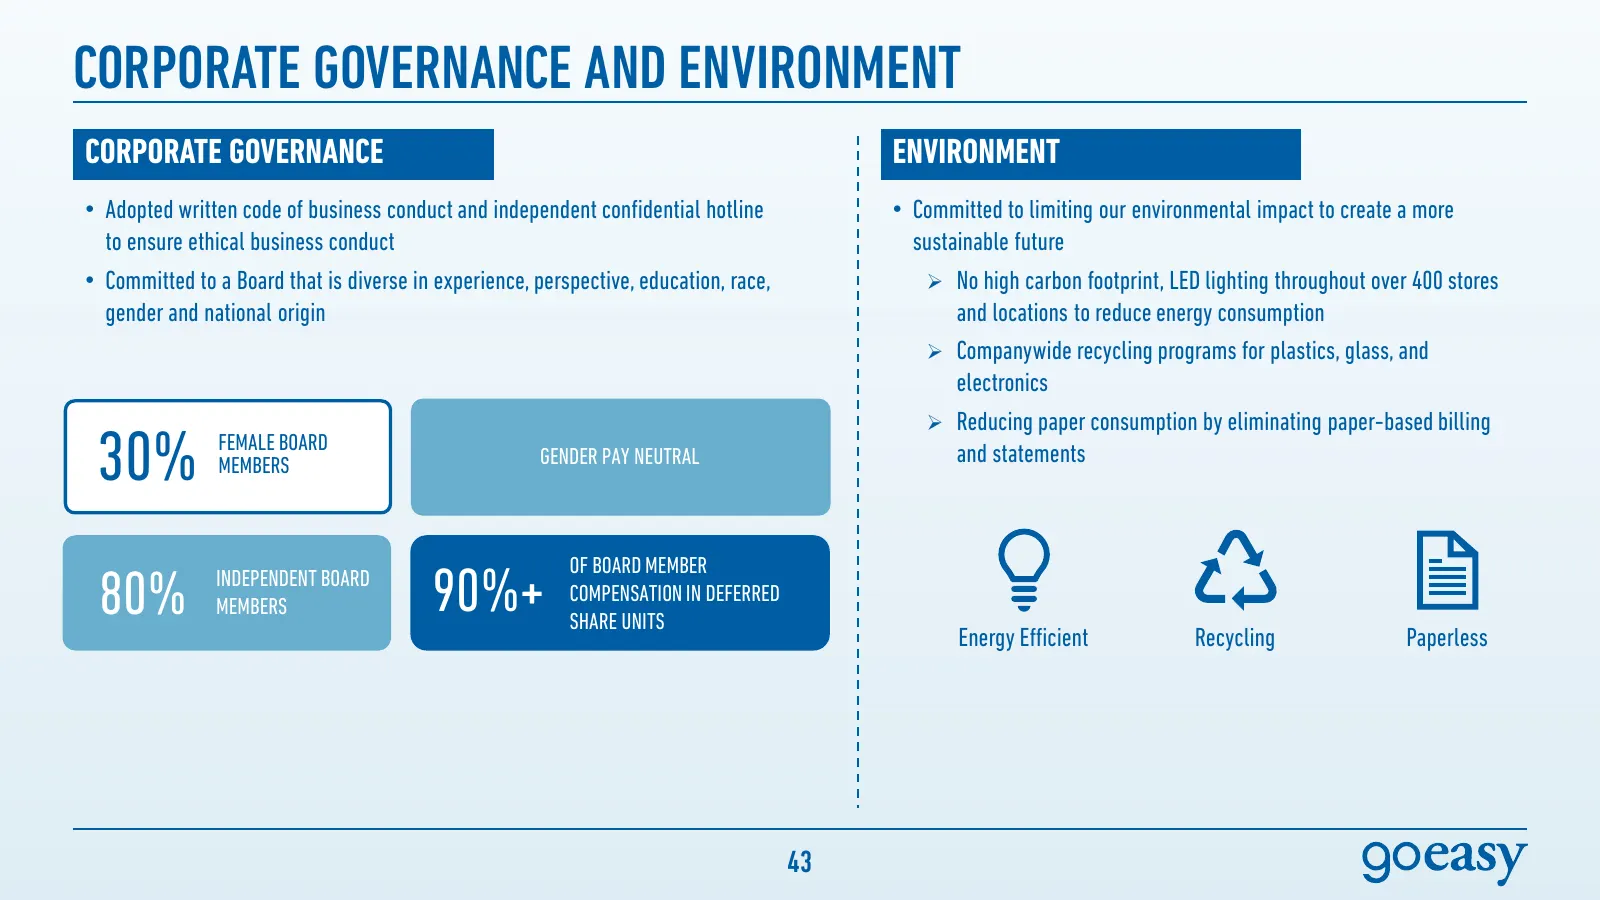
Slide 43: Corporate Governance and Environment
CORPORATE GOVERNANCE AND ENVIRONMENT CORPORATE GOVERNANCE ENVIRONMENT • Adopted written code of business conduct and independent confidential hotline • Committed to limiting our environmental impact to create a more to ensure ethical business conduct sustainable future • Committed to a Board that is

Slide 44: Appendix
APPENDIX
Slide 45: Non-Prime Lending Model Most Stable During Economic Shocks
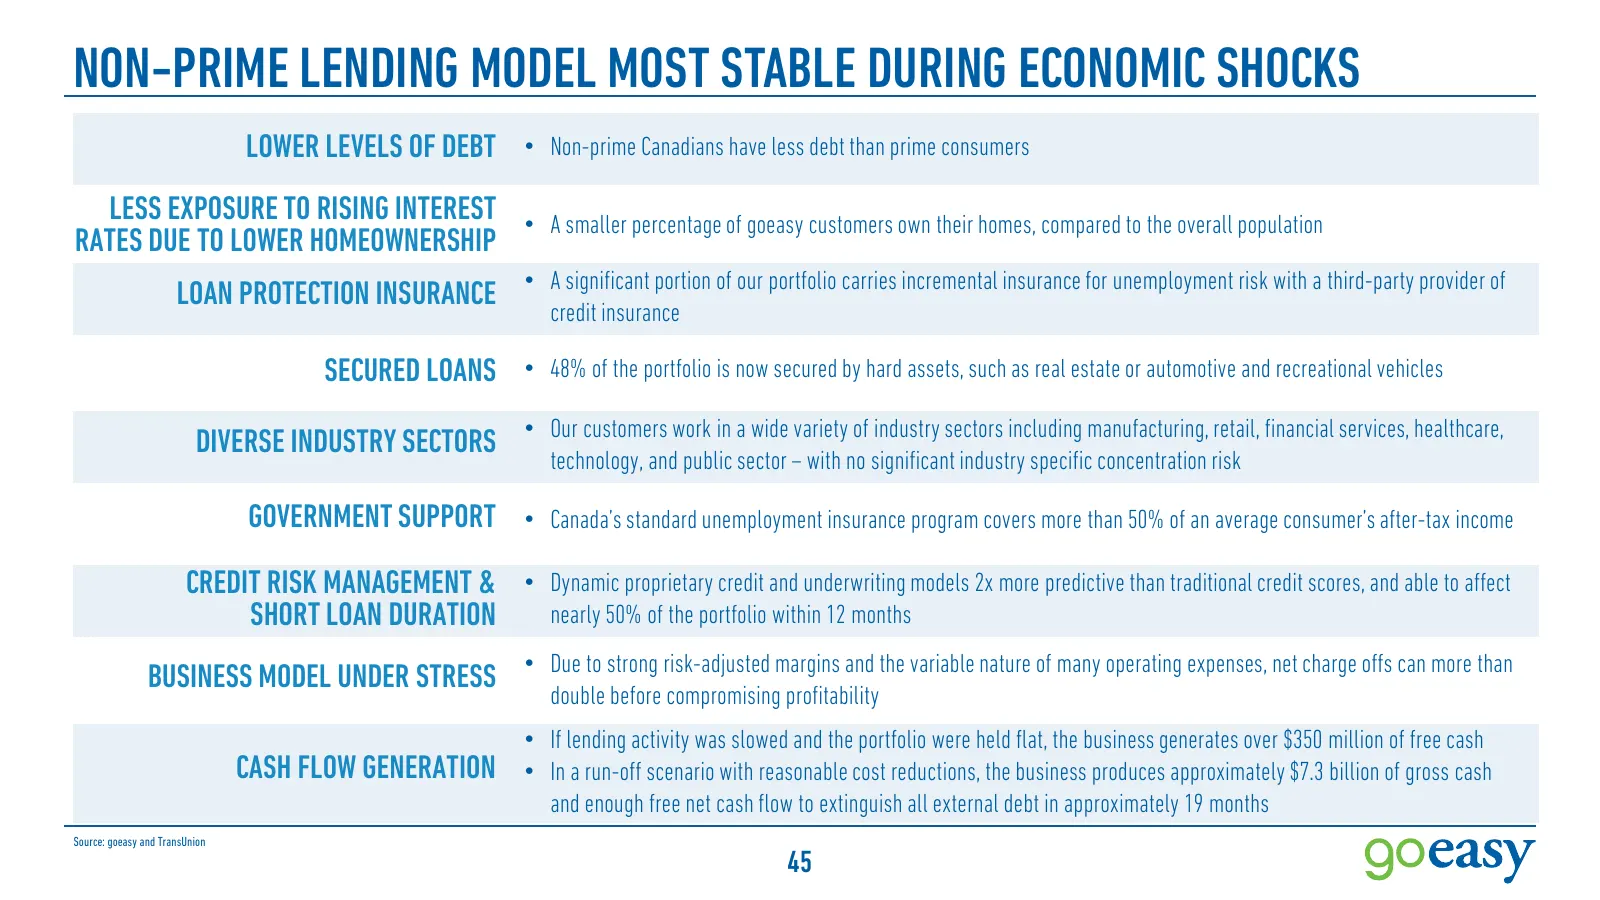
NON-PRIME LENDING MODEL MOST STABLE DURING ECONOMIC SHOCKS LOWER LEVELS OF DEBT • Non-prime Canadians have less debt than prime consumers LESS EXPOSURE TO RISING INTEREST • A smaller percentage of goeasy customers own their homes, compared to the overall population RATES DUE TO LOWER HOMEOWNERSHIP •
Slide 46: Non-Prime Segment Most Stable During Economic Shocks
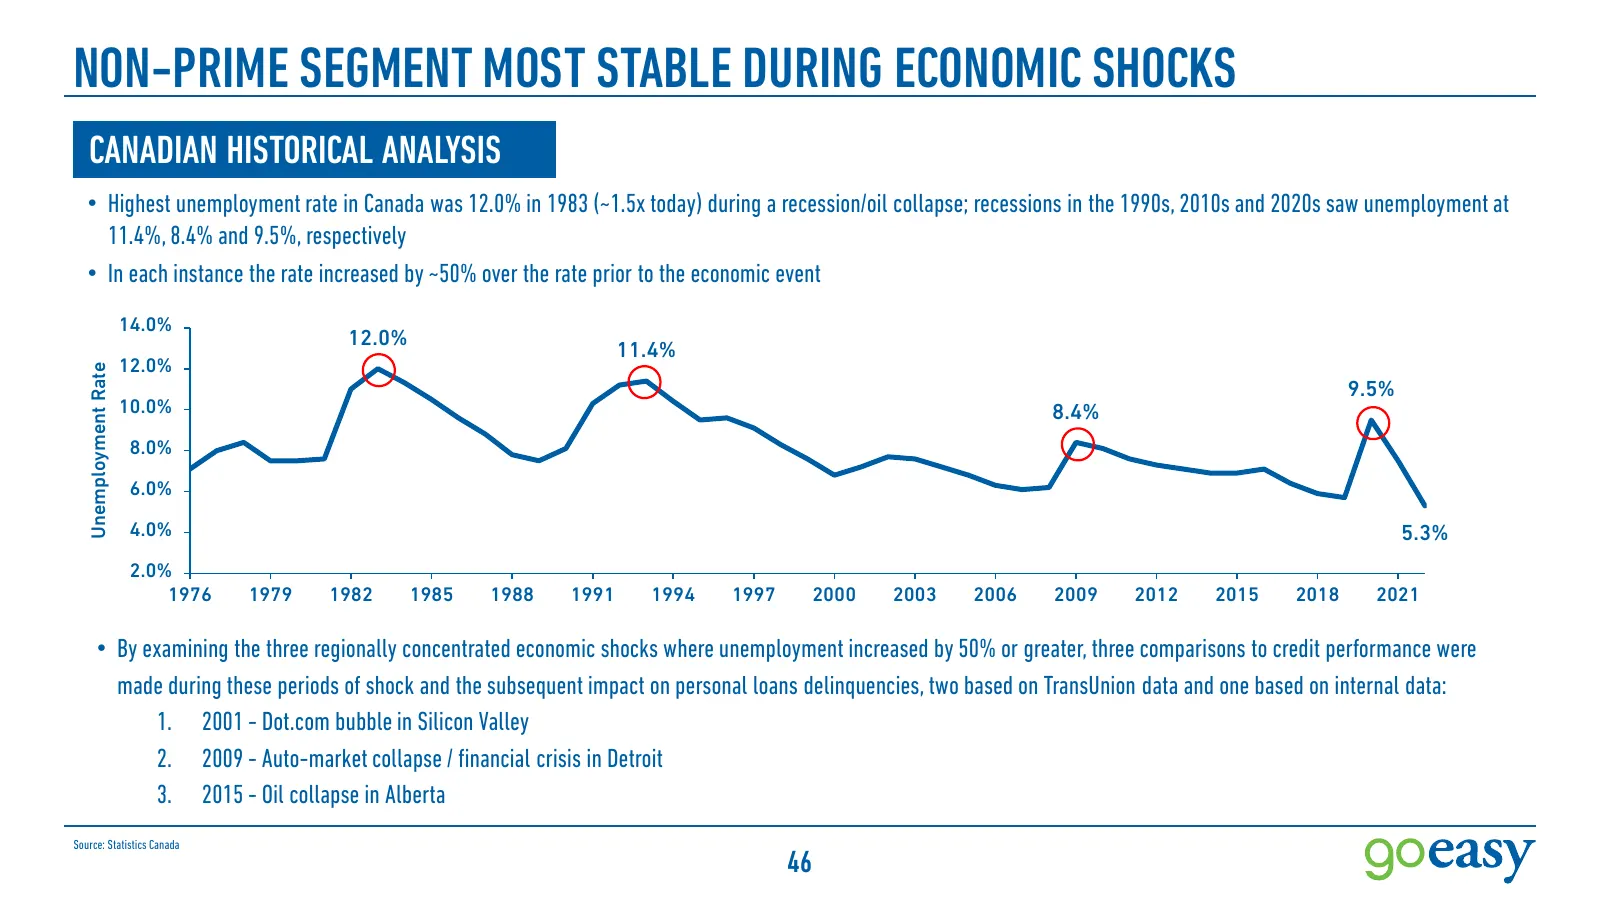
NON-PRIME SEGMENT MOST STABLE DURING ECONOMIC SHOCKS CANADIAN HISTORICAL ANALYSIS • Highest unemployment rate in Canada was 12.0% in 1983 (~1.5x today) during a recession/oil collapse; recessions in the 1990s, 2010s and 2020s saw unemployment at 11.4%, 8.4% and 9.5%, respectively • In each instance
Slide 47: 2001 – Dot.com Bubble in Silicon Valley
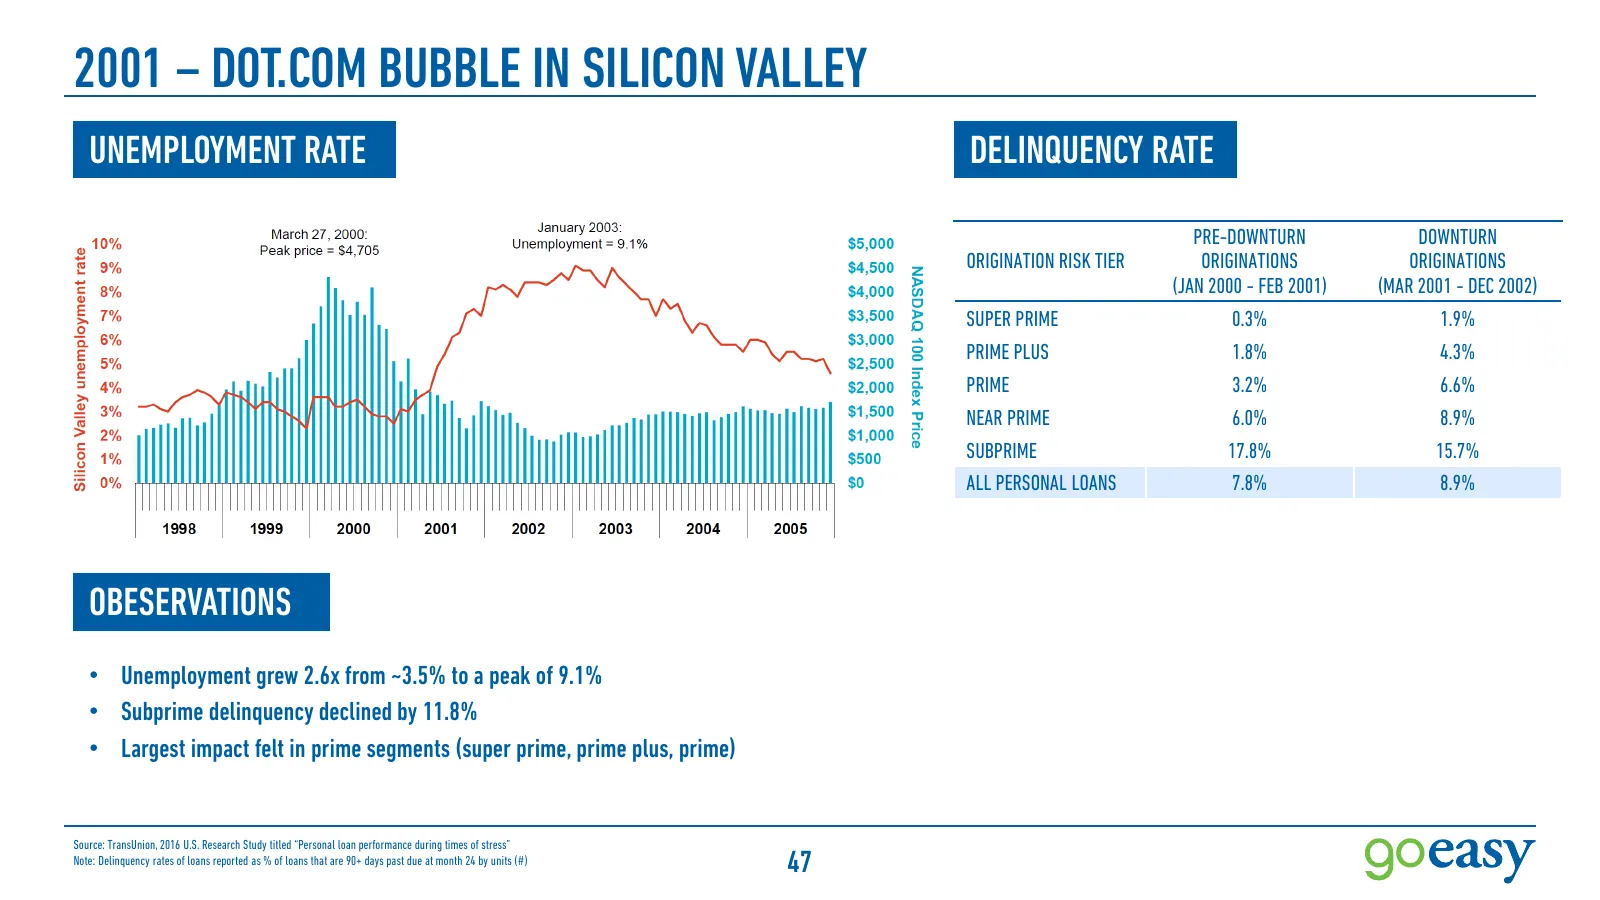
2001 – DOT.COM BUBBLE IN SILICON VALLEY UNEMPLOYMENT RATE DELINQUENCY RATE PRE-DOWNTURN DOWNTURN ORIGINATION RISK TIER ORIGINATIONS ORIGINATIONS (JAN 2000 - FEB 2001) (MAR 2001 - DEC 2002) SUPER PRIME 0.3% 1.9% PRIME PLUS 1.8% 4.3% PRIME 3.2% 6.6% NEAR PRIME 6.0% 8.9% SUBPRIME 17.8% 15.7% ALL PERSON
Slide 48: 2009 - Auto-Market Collapse / Financial Crisis in Detroit
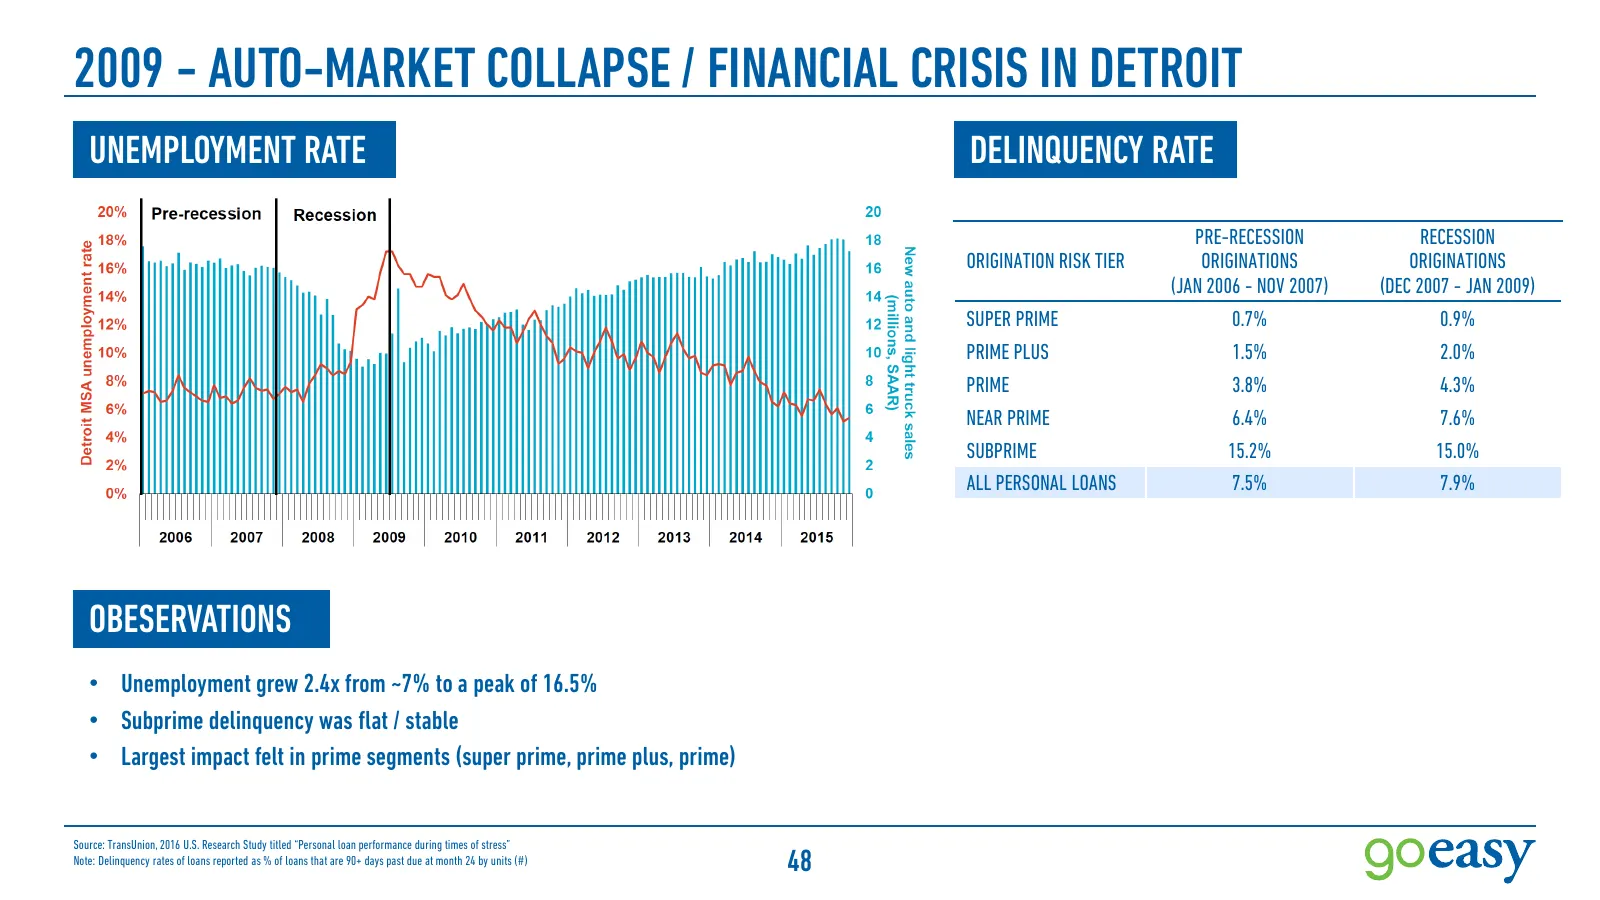
2009 - AUTO-MARKET COLLAPSE / FINANCIAL CRISIS IN DETROIT UNEMPLOYMENT RATE DELINQUENCY RATE PRE-RECESSION RECESSION ORIGINATION RISK TIER ORIGINATIONS ORIGINATIONS (JAN 2006 - NOV 2007) (DEC 2007 - JAN 2009) SUPER PRIME 0.7% 0.9% PRIME PLUS 1.5% 2.0% PRIME 3.8% 4.3% NEAR PRIME 6.4% 7.6% SUBPRIME 15
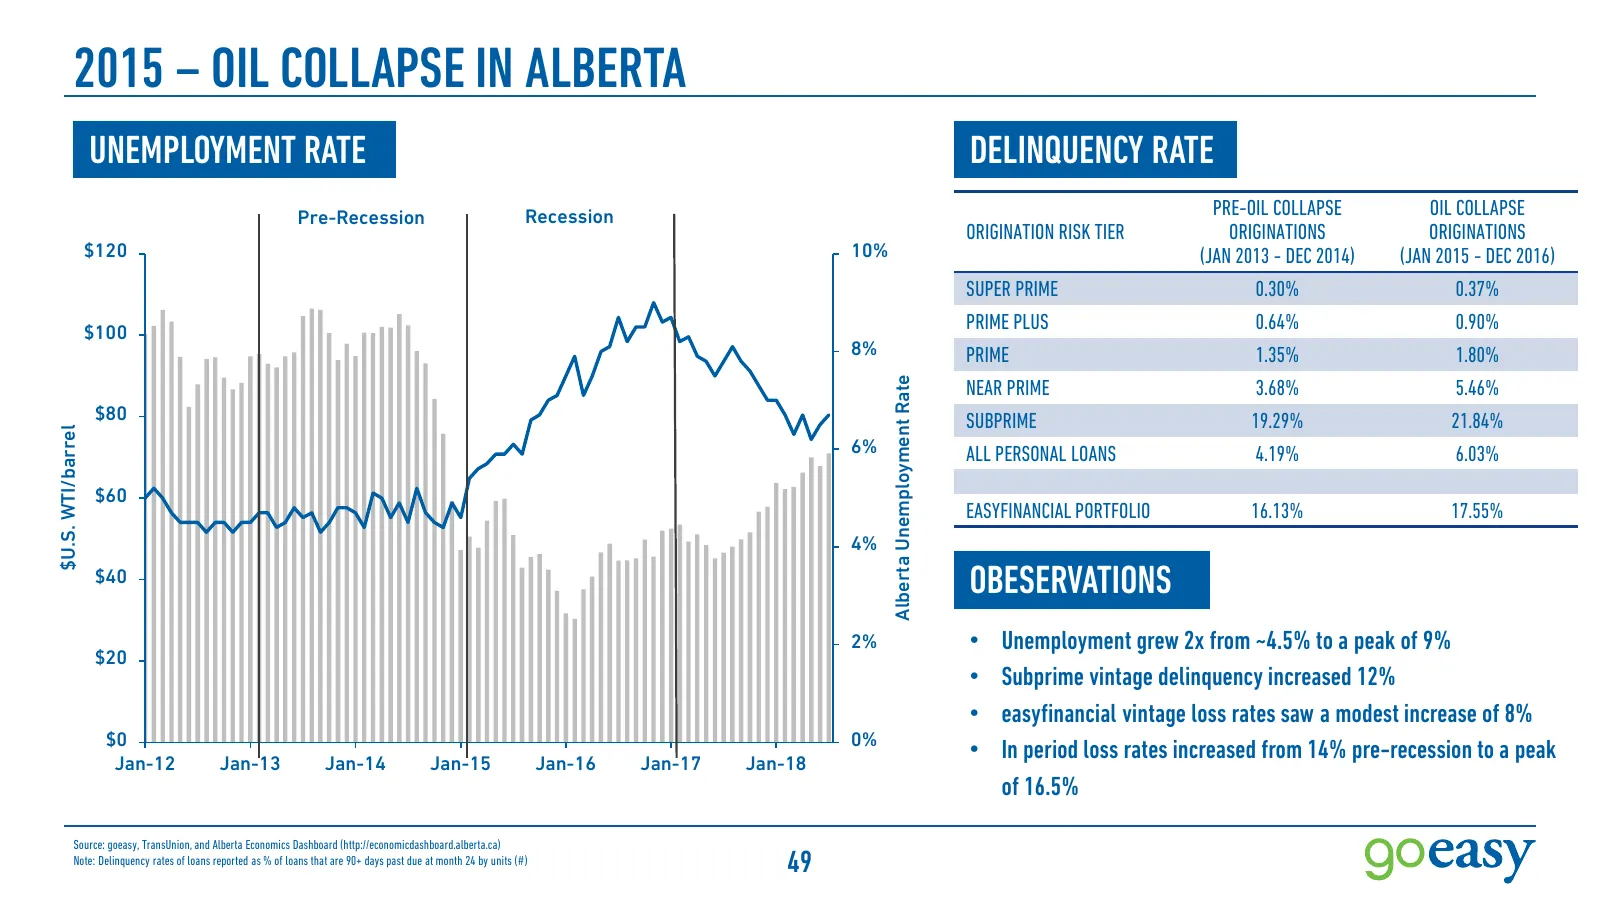
Slide 49: 2015 – Oil Collapse in Alberta
2015 – OIL COLLAPSE IN ALBERTA UNEMPLOYMENT RATE DELINQUENCY RATE Pre-Recession Recession PRE-OIL COLLAPSE OIL COLLAPSE ORIGINATION RISK TIER ORIGINATIONS ORIGINATIONS $120 10% (JAN 2013 - DEC 2014) (JAN 2015 - DEC 2016) SUPER PRIME 0.30% 0.37% $100 PRIME PLUS 0.64% 0.90% 8% PRIME 1.35% 1.80% Albert
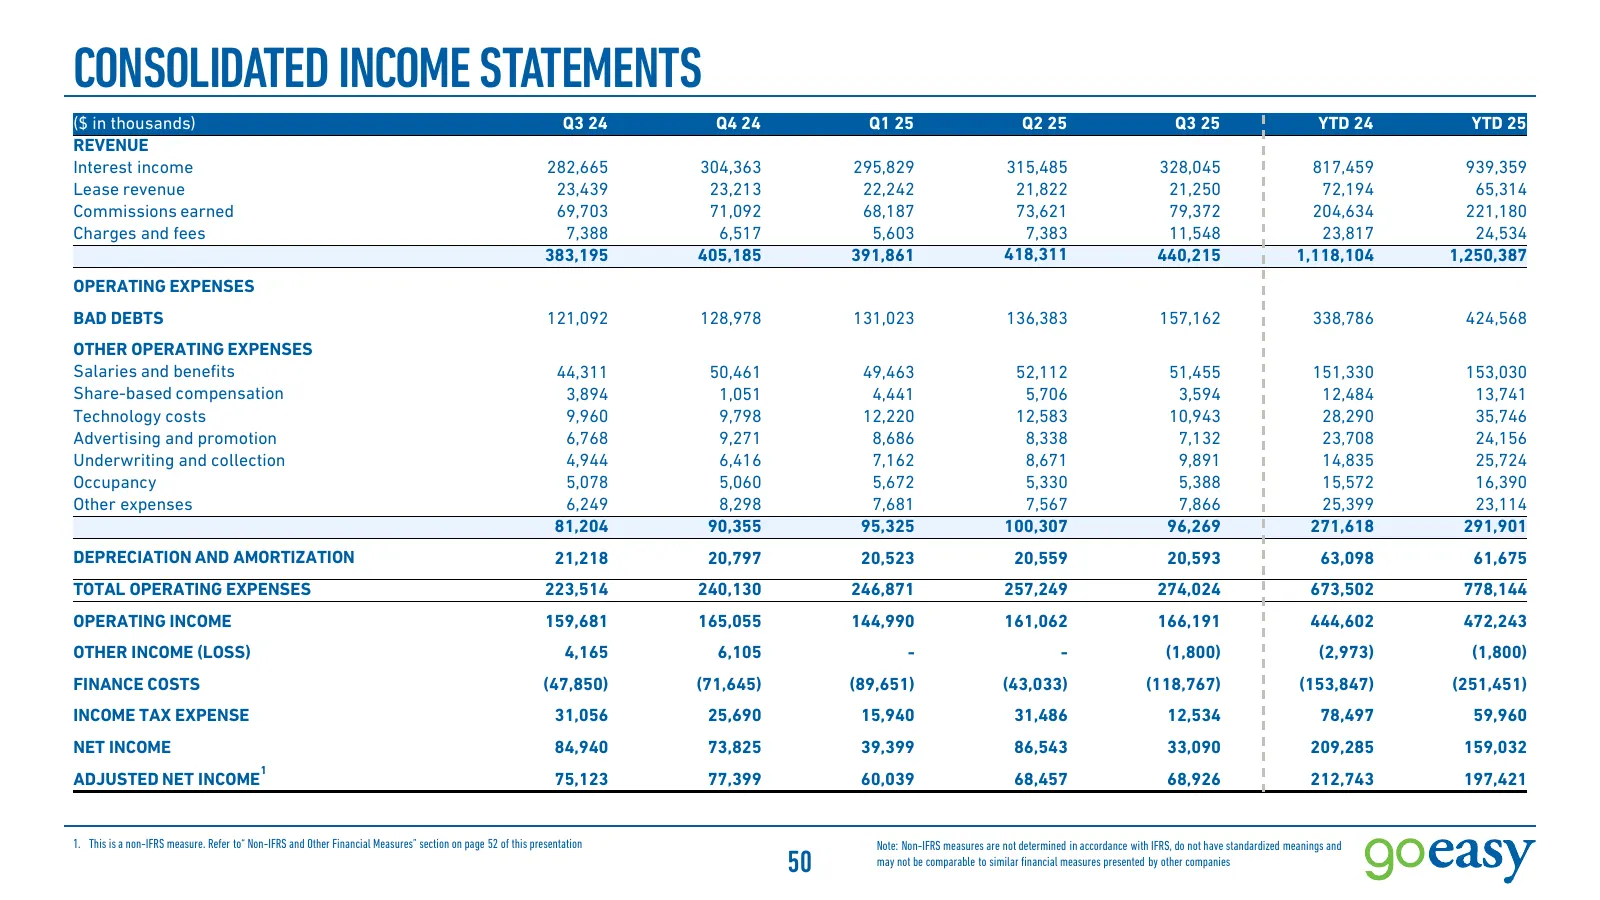
Slide 50: Consolidated Income Statements
CONSOLIDATED INCOME STATEMENTS ($ in thousands) Q3 24 Q4 24 Q1 25 Q2 25 Q3 25 YTD 24 YTD 25 REVENUE Interest income 282,665 304,363 295,829 315,485 328,045 817,459 939,359 Lease revenue 23,439 23,213 22,242 21,822 21,250 72,194 65,314 Commissions earned 69,703 71,092 68,187 73,621 79,372 204,634 221
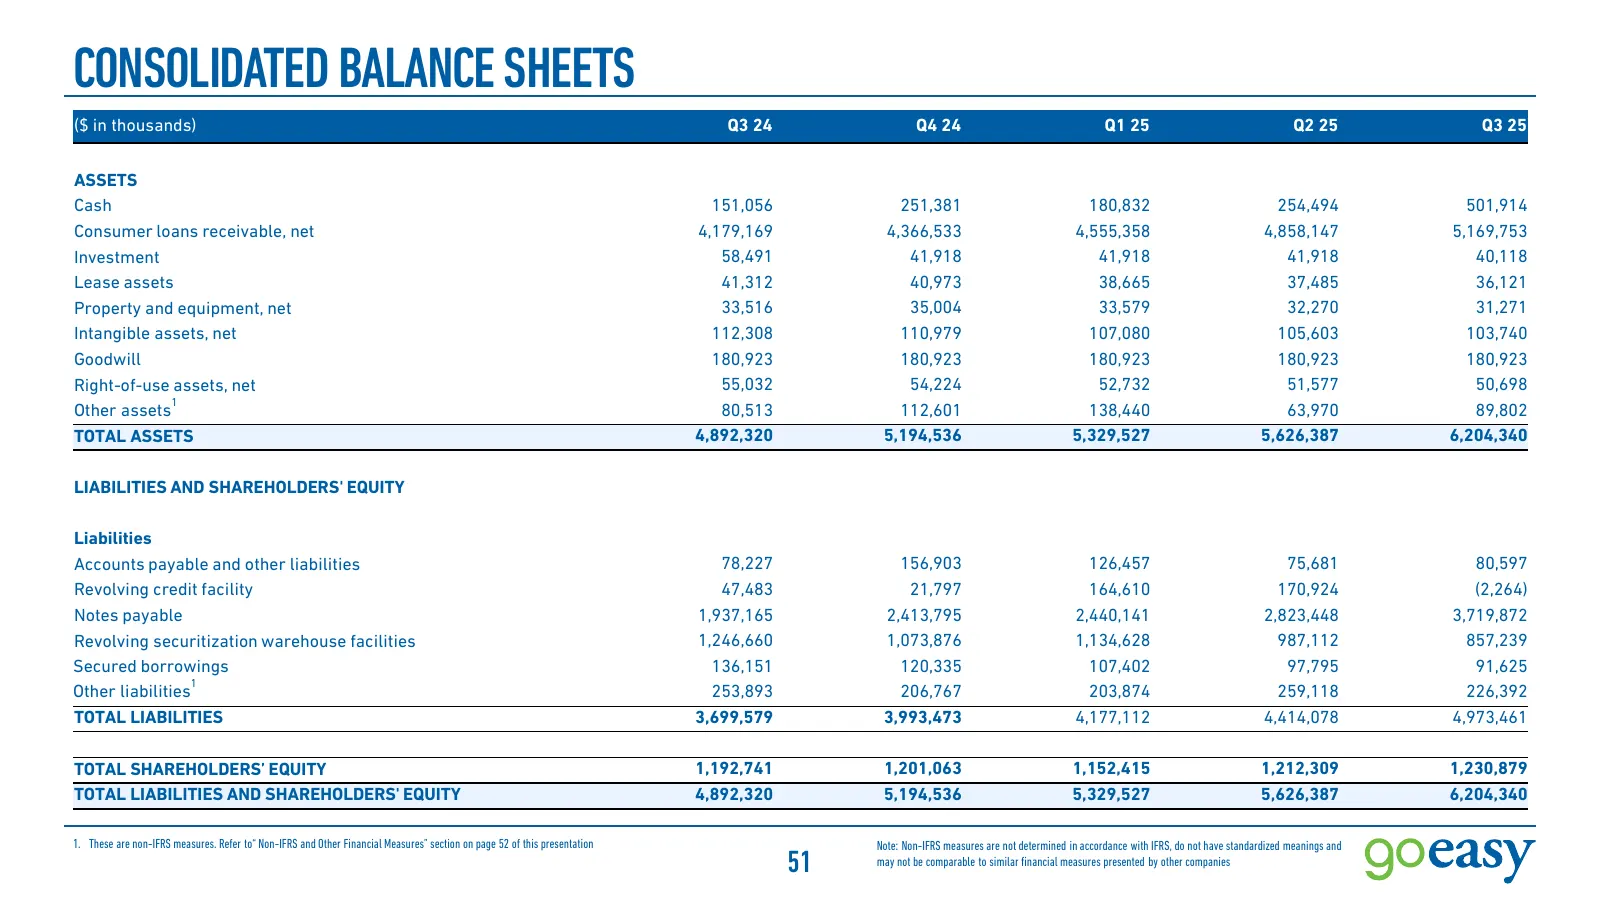
Slide 51: Consolidated Balance Sheets
CONSOLIDATED BALANCE SHEETS ($ in thousands) Q3 24 Q4 24 Q1 25 Q2 25 Q3 25 ASSETS Cash 151,056 251,381 180,832 254,494 501,914 Consumer loans receivable, net 4,179,169 4,366,533 4,555,358 4,858,147 5,169,753 Investment 58,491 41,918 41,918 41,918 40,118 Lease assets 41,312 40,973 38,665 37,485 36,12
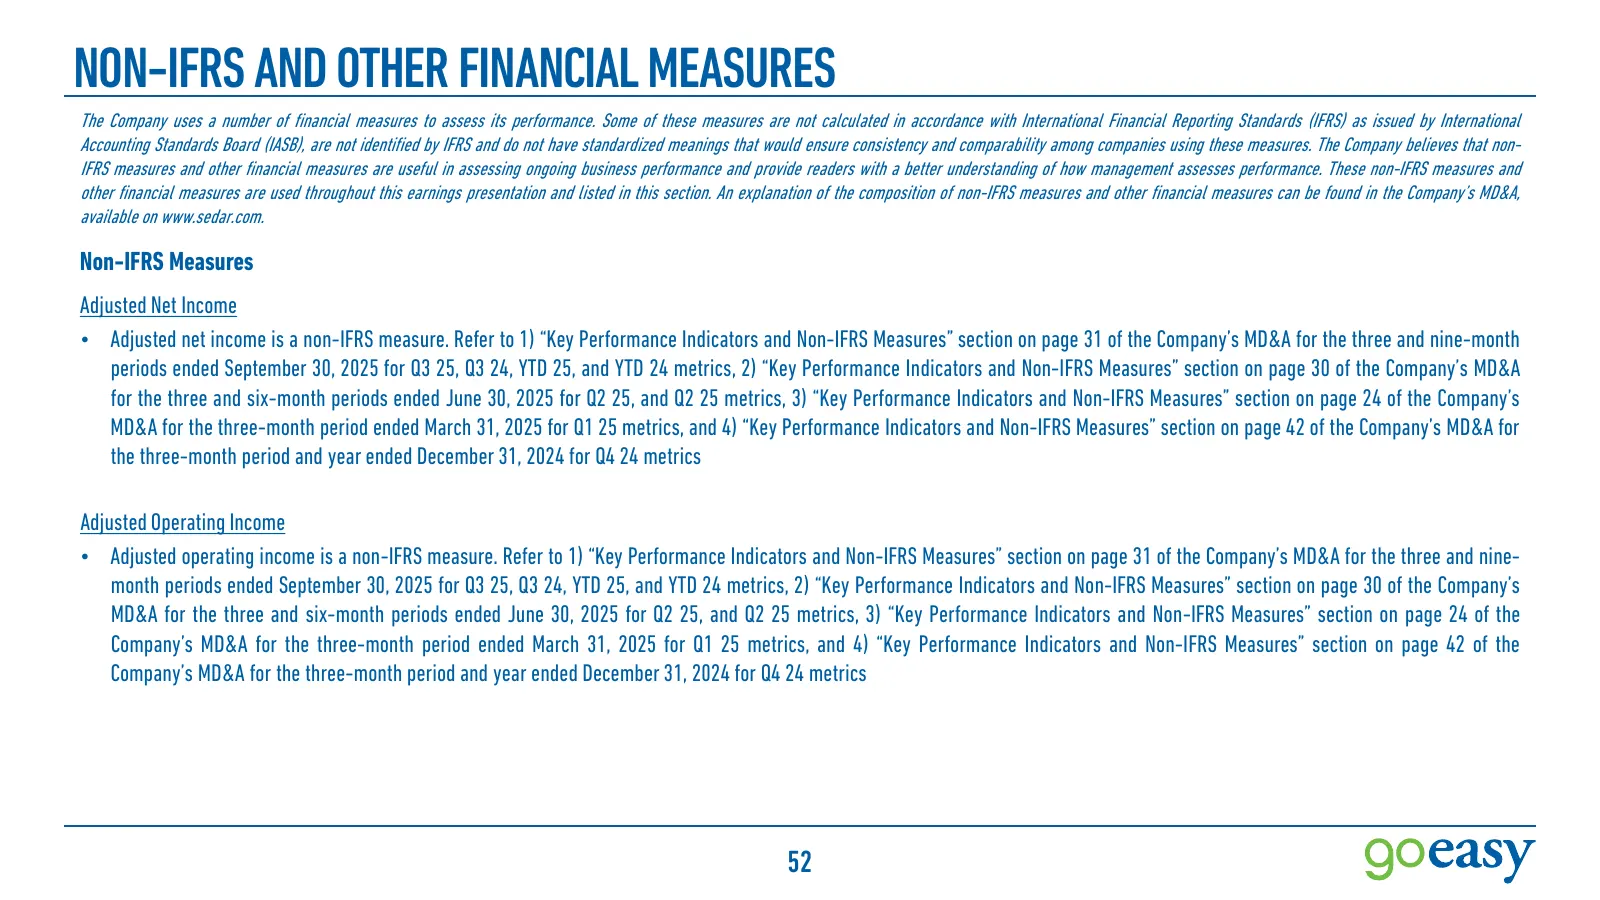
Slide 52: Non-IFRS and Other Financial Measures
NON-IFRS AND OTHER FINANCIAL MEASURES The Company uses a number of financial measures to assess its performance. Some of these measures are not calculated in accordance with International Financial Reporting Standards (IFRS) as issued by International Accounting Standards Board (IASB), are not ident
Slide 53: Non-IFRS and Other Financial Measures (Cont.)
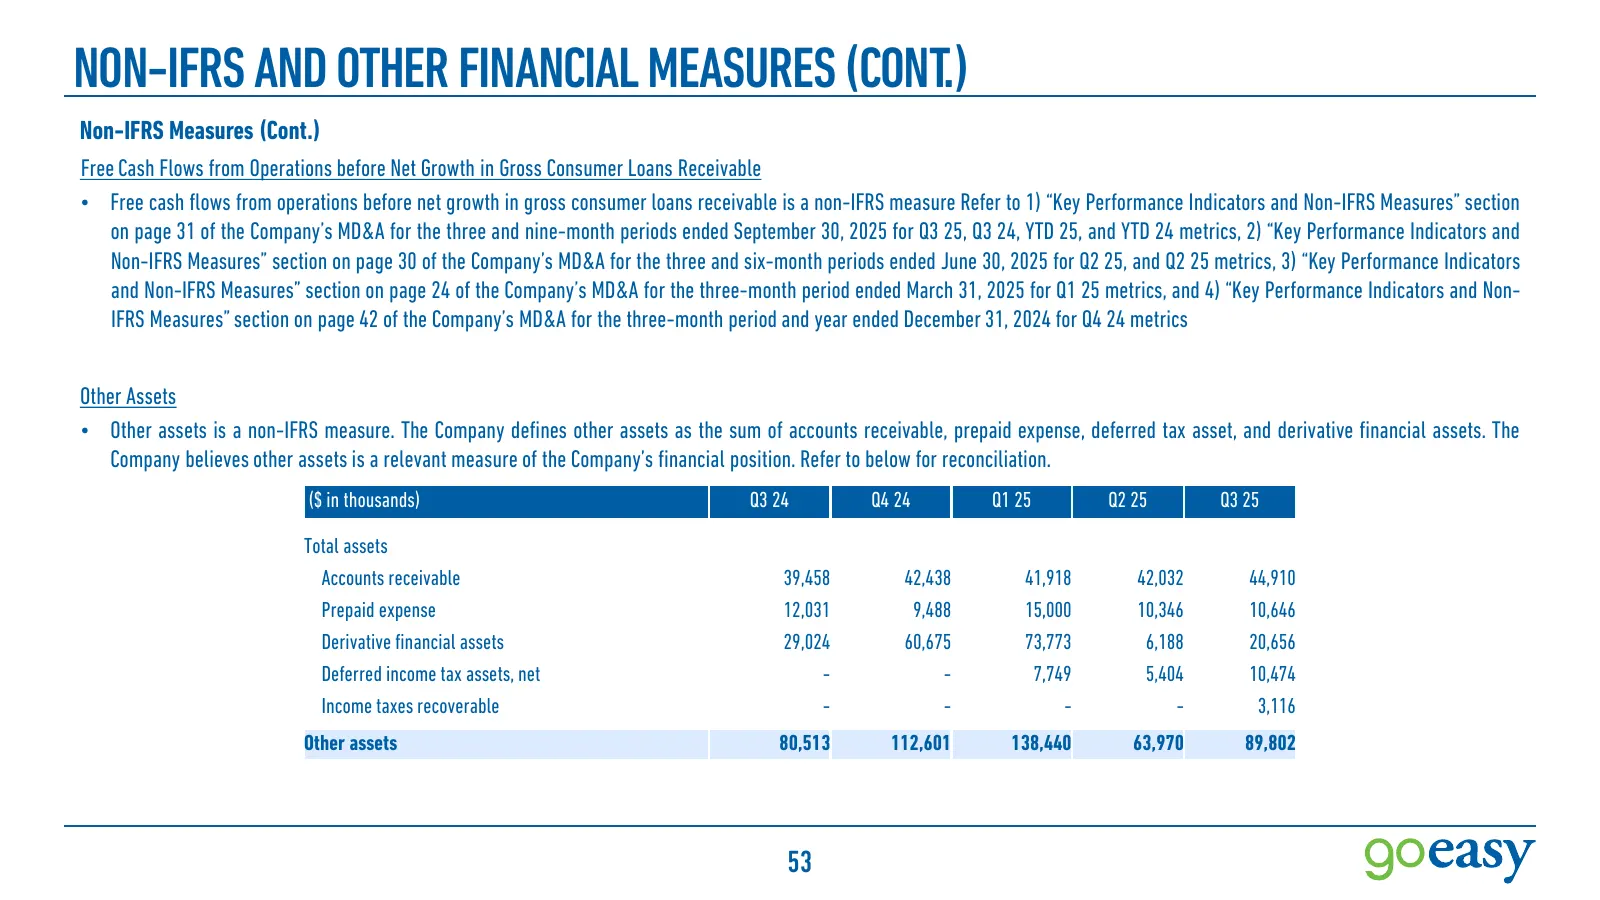
NON-IFRS AND OTHER FINANCIAL MEASURES (CONT.) Non-IFRS Measures (Cont.) Free Cash Flows from Operations before Net Growth in Gross Consumer Loans Receivable • Free cash flows from operations before net growth in gross consumer loans receivable is a non-IFRS measure Refer to 1) “Key Performance Indic
Slide 54: Non-IFRS and Other Financial Measures (Cont.)
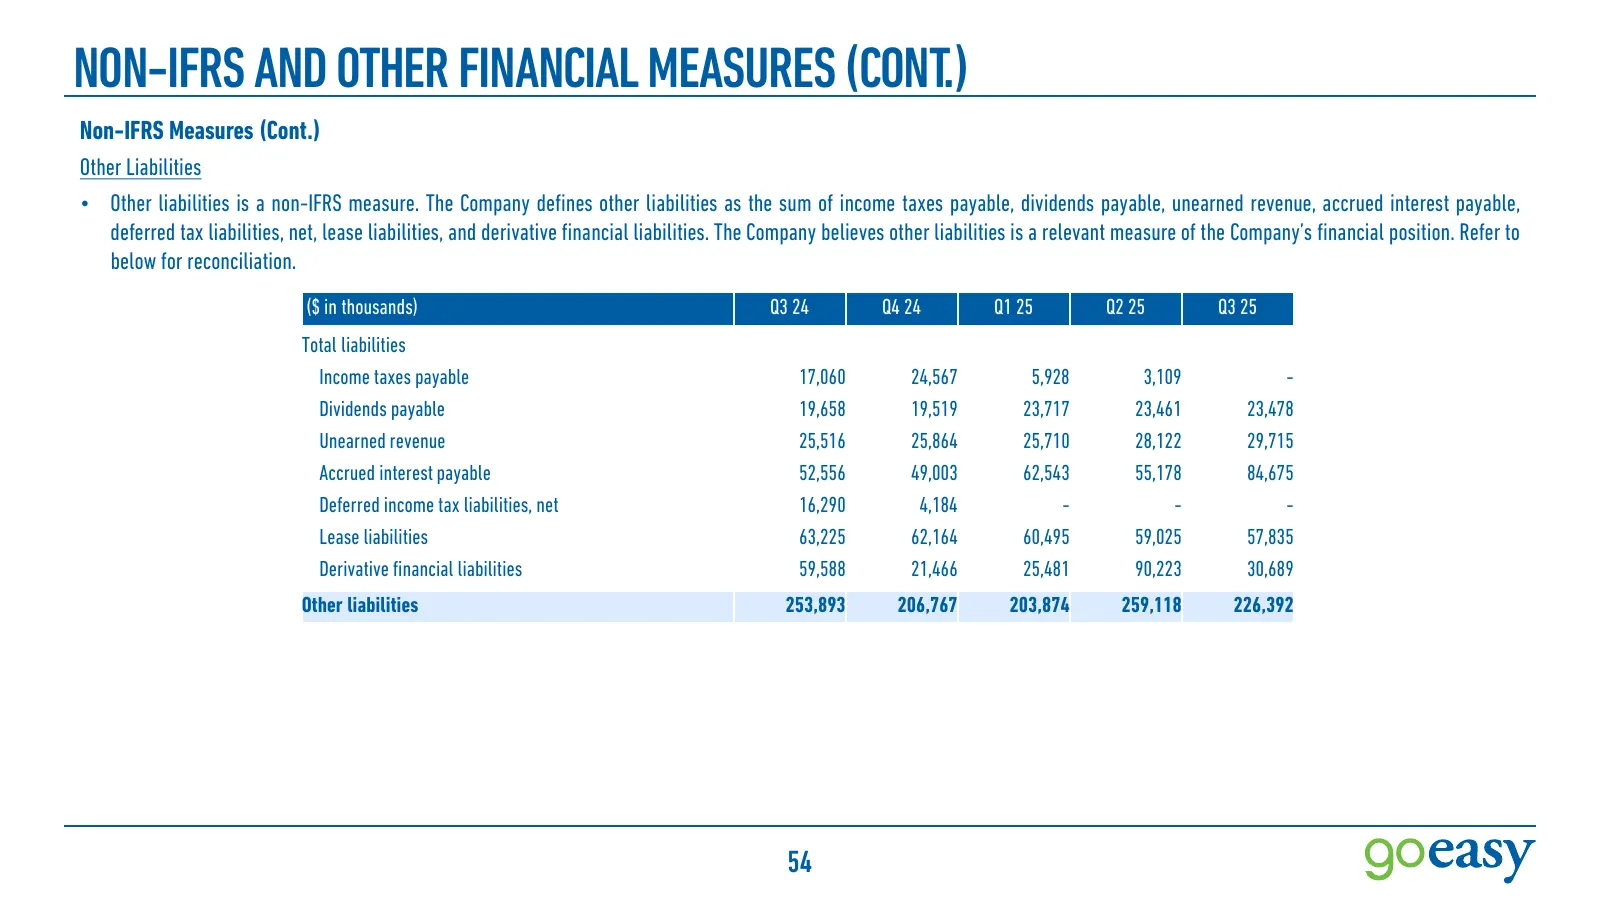
NON-IFRS AND OTHER FINANCIAL MEASURES (CONT.) Non-IFRS Measures (Cont.) Other Liabilities • Other liabilities is a non-IFRS measure. The Company defines other liabilities as the sum of income taxes payable, dividends payable, unearned revenue, accrued interest payable, deferred tax liabilities, net,
Slide 55: Non-IFRS and Other Financial Measures (Cont.)
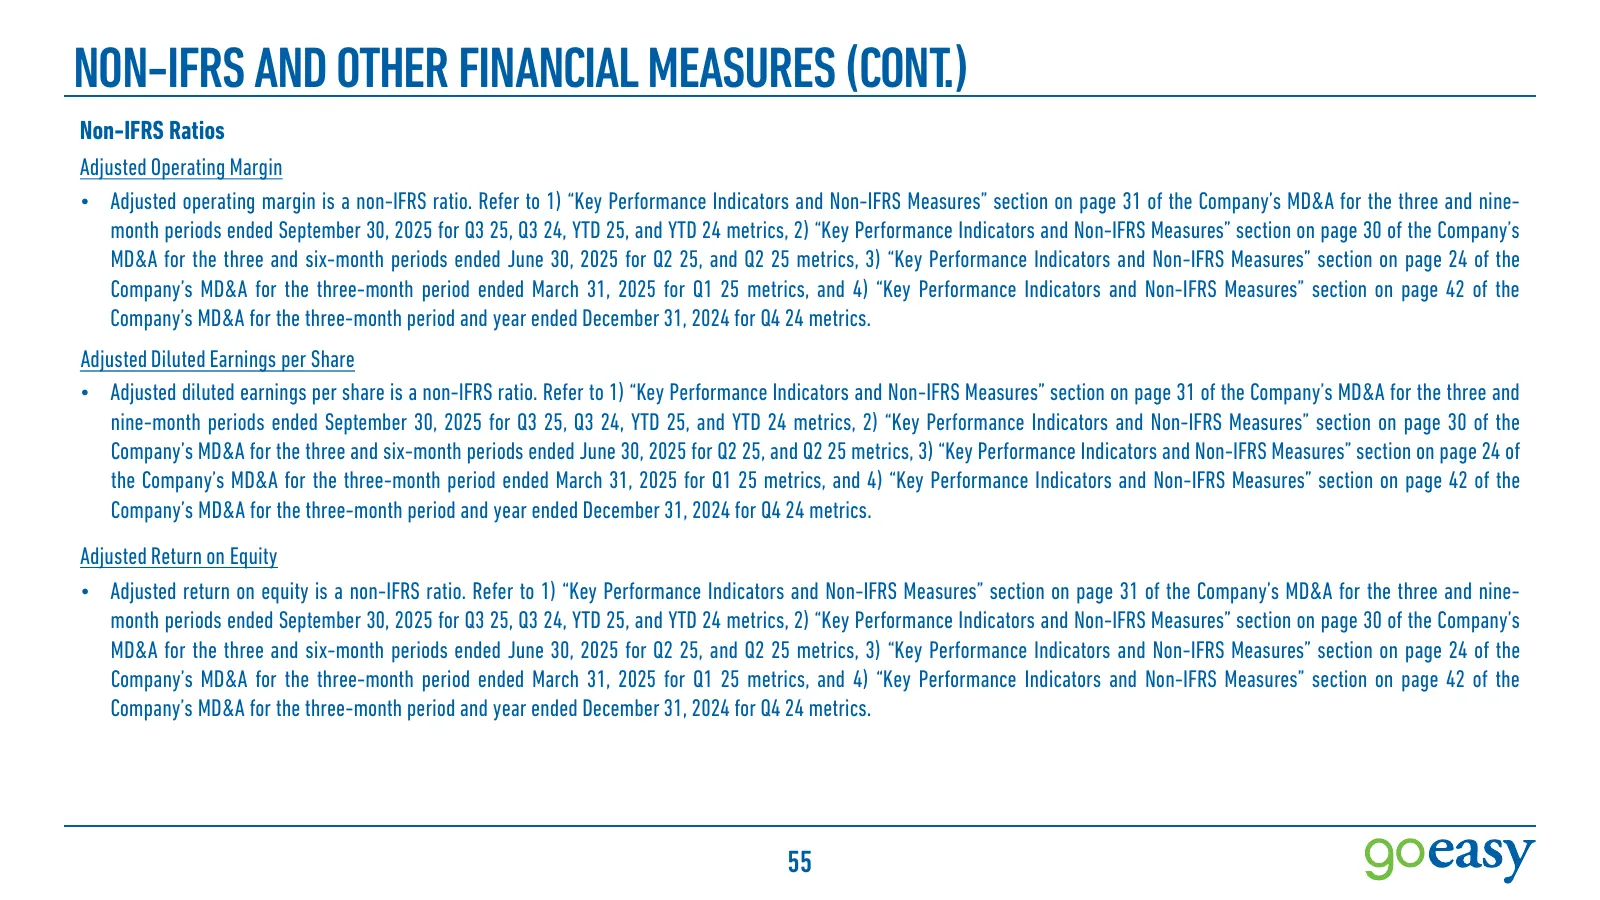
NON-IFRS AND OTHER FINANCIAL MEASURES (CONT.) Non-IFRS Ratios Adjusted Operating Margin • Adjusted operating margin is a non-IFRS ratio. Refer to 1) “Key Performance Indicators and Non-IFRS Measures” section on page 31 of the Company’s MD&A for the three and nine- month periods ended September 30, 2
Slide 56: Non-IFRS and Other Financial Measures (Cont.)
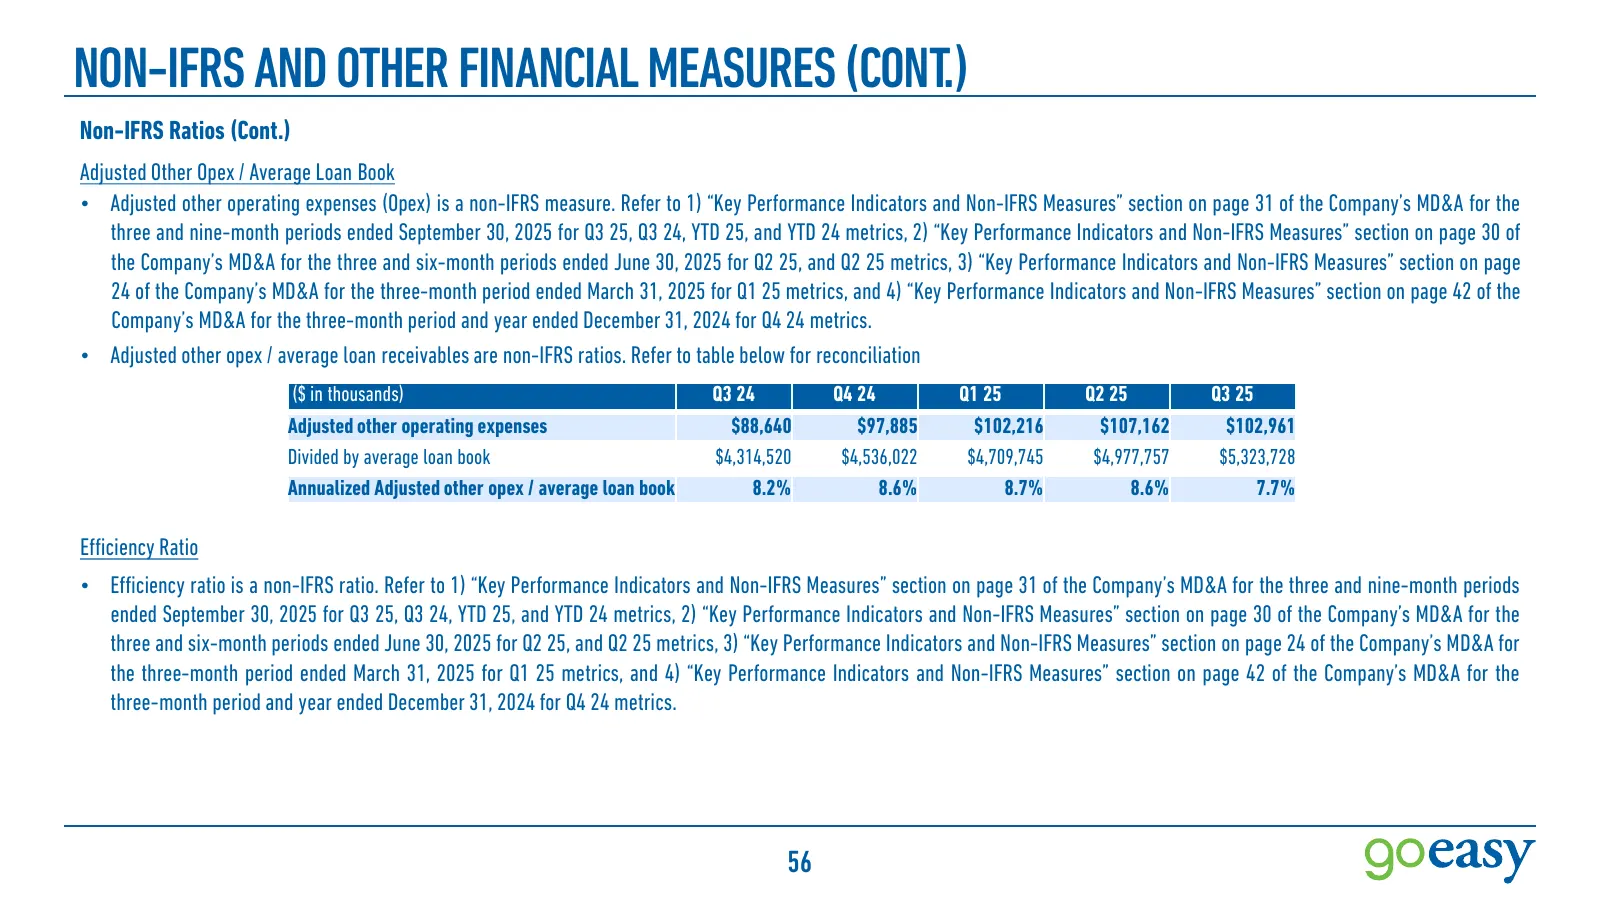
NON-IFRS AND OTHER FINANCIAL MEASURES (CONT.) Non-IFRS Ratios (Cont.) Adjusted Other Opex / Average Loan Book • Adjusted other operating expenses (Opex) is a non-IFRS measure. Refer to 1) “Key Performance Indicators and Non-IFRS Measures” section on page 31 of the Company’s MD&A for the three and ni
Slide 57: Non-IFRS and Other Financial Measures (Cont.)
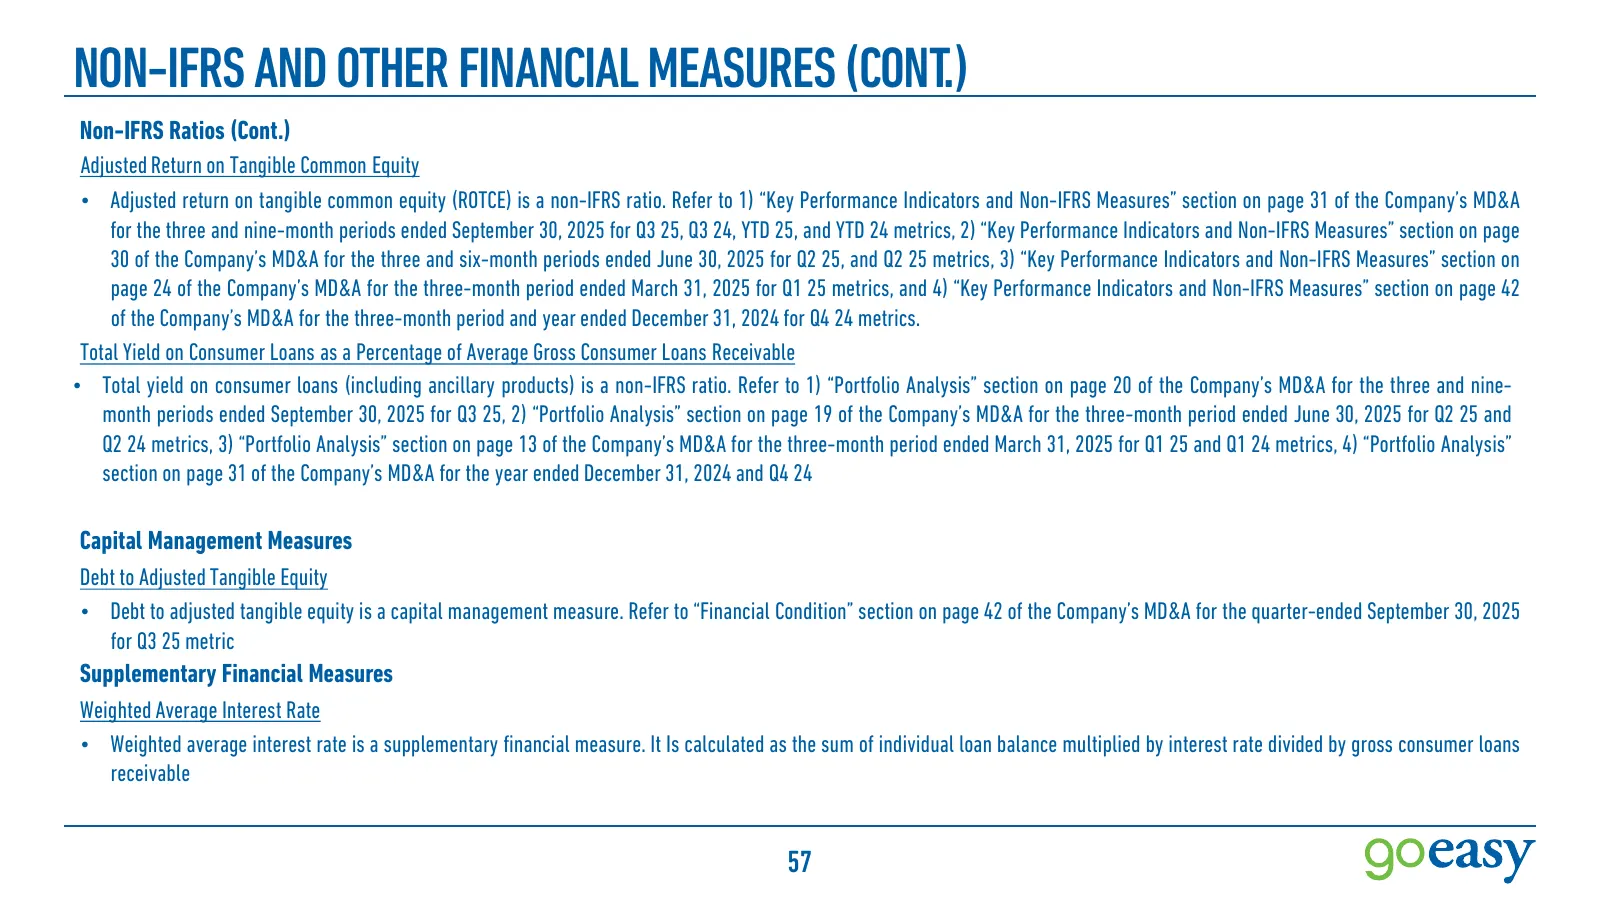
NON-IFRS AND OTHER FINANCIAL MEASURES (CONT.) Non-IFRS Ratios (Cont.) Adjusted Return on Tangible Common Equity • Adjusted return on tangible common equity (ROTCE) is a non-IFRS ratio. Refer to 1) “Key Performance Indicators and Non-IFRS Measures” section on page 31 of the Company’s MD&A for the thr
Source: Internet Archive copy of assets.ctfassets.net