Enghouse Systems Limited · TSX:ENGH
Enghouse Systems — Investor Presentation (July 2013)
24 slides from Enghouse Systems's investor presentation, July 2013
Slide 1: Corporate Overview
Corporate Overview July, 2013
Slide 2: Forward-Looking Statements Disclaimer
Forward-Looking Statements Disclaimer Certain statements made in this presentation and the related materials may contain forward-looking statements, which are not historical facts, but are based on certain assumptions and reflect Enghouse’s current expectations. These forward-looking statements are
Slide 3: Snapshot
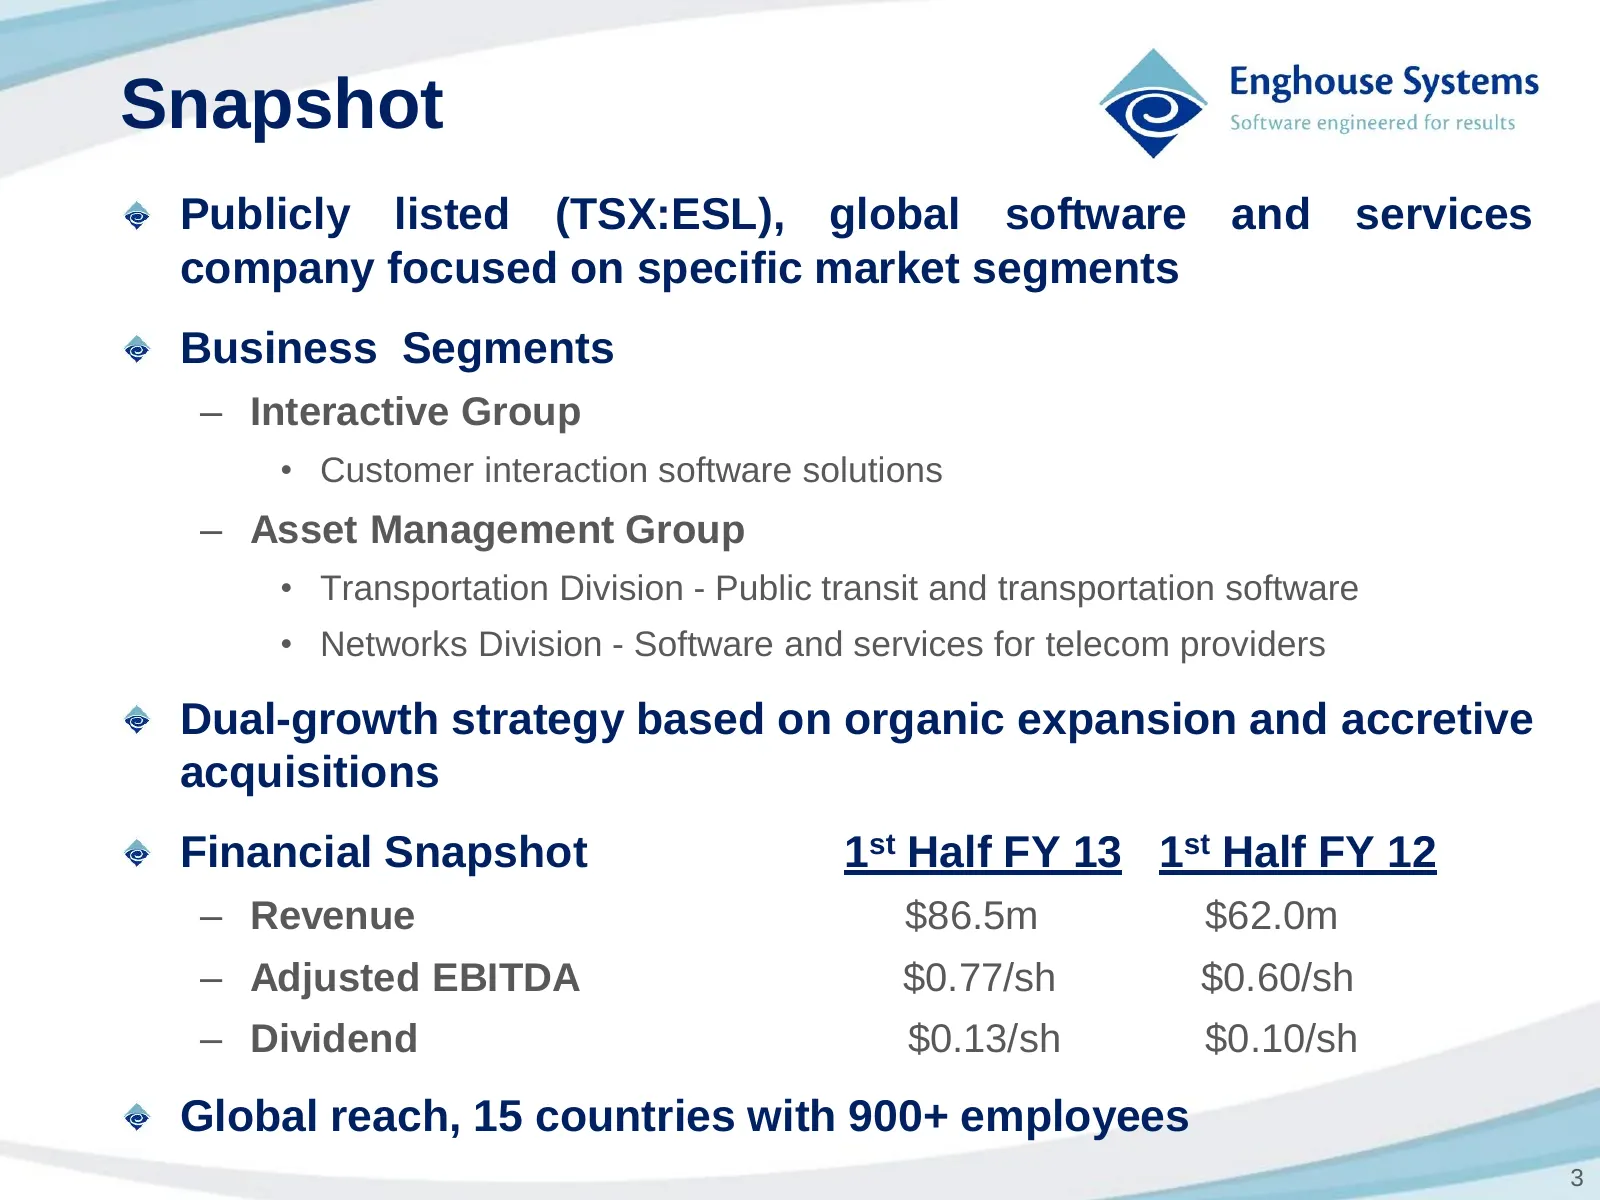
Snapshot Publicly listed (TSX:ESL), global software and services company focused on specific market segments Business Segments – Interactive Group • Customer interaction software solutions – Asset Management Group • Transportation Division - Public transit and transportation software • Networks Divi
Slide 4: Strategy
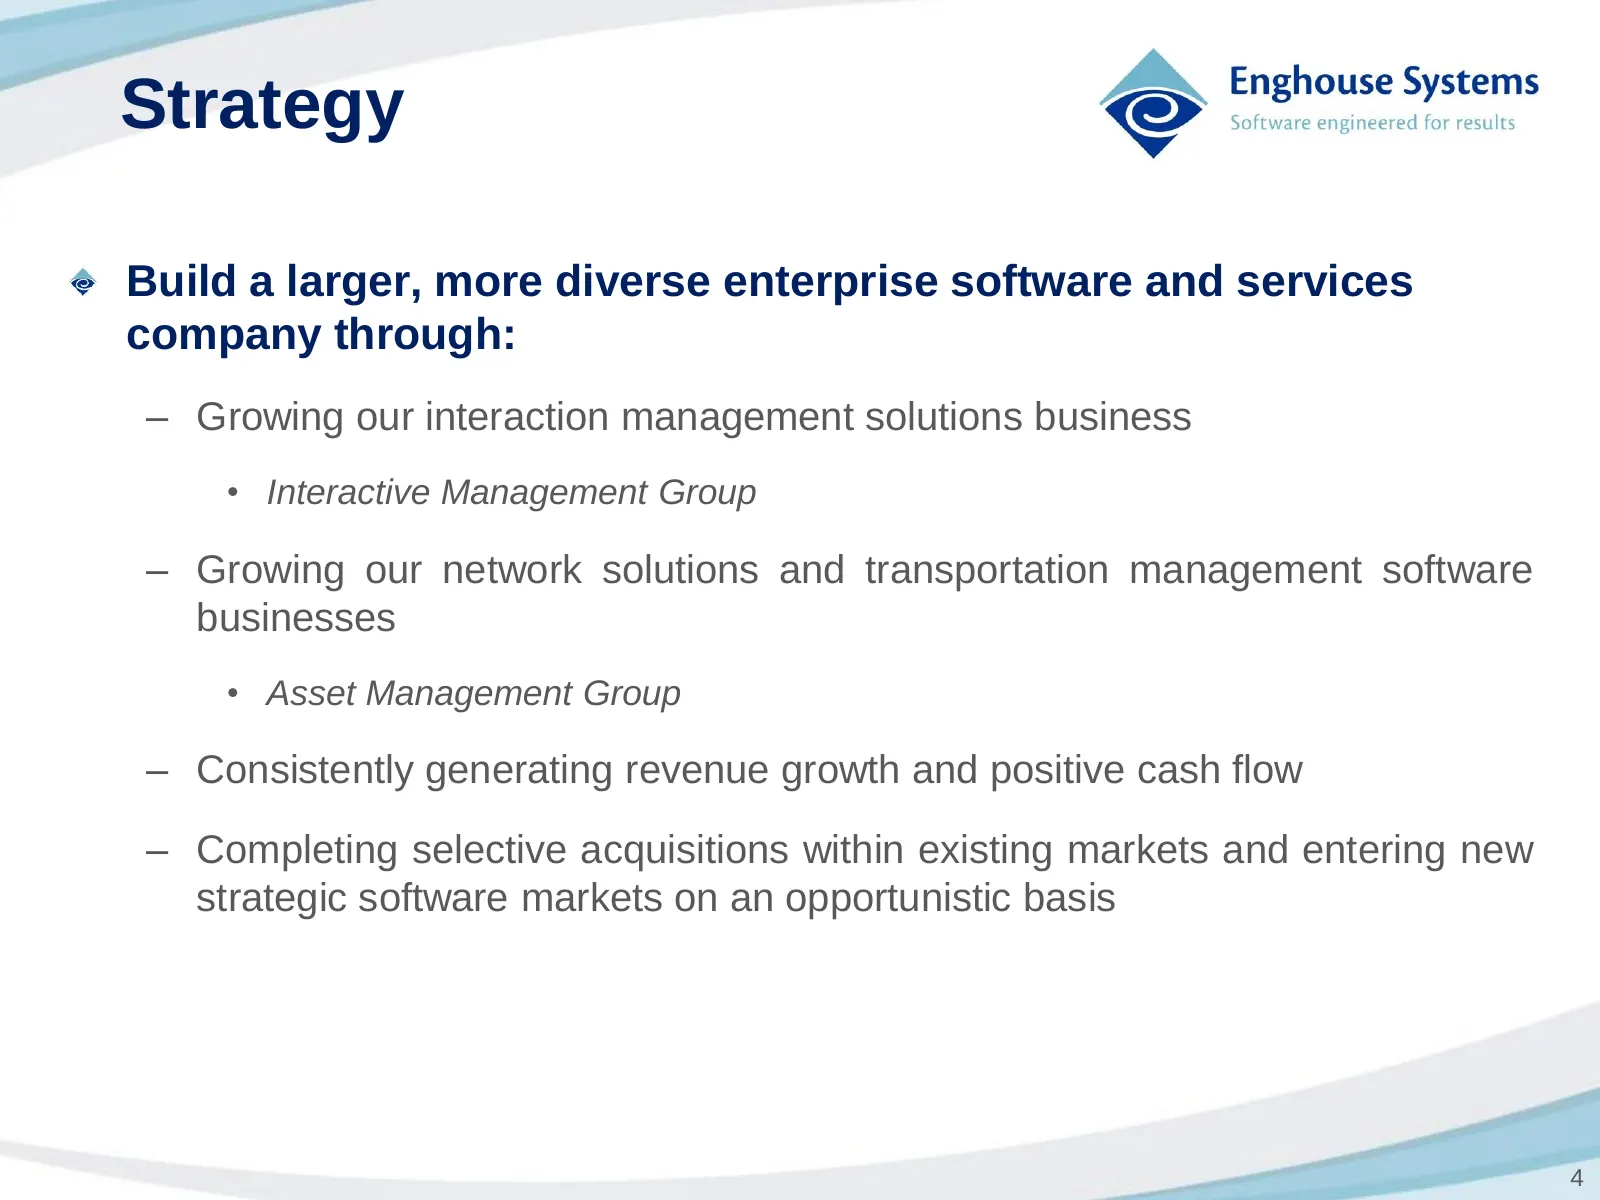
Strategy Build a larger, more diverse enterprise software and services company through: – Growing our interaction management solutions business • Interactive Management Group – Growing our network solutions and transportation management software businesses • Asset Management Group – Consistently gen
Slide 5: Interactive - Sector Dynamics
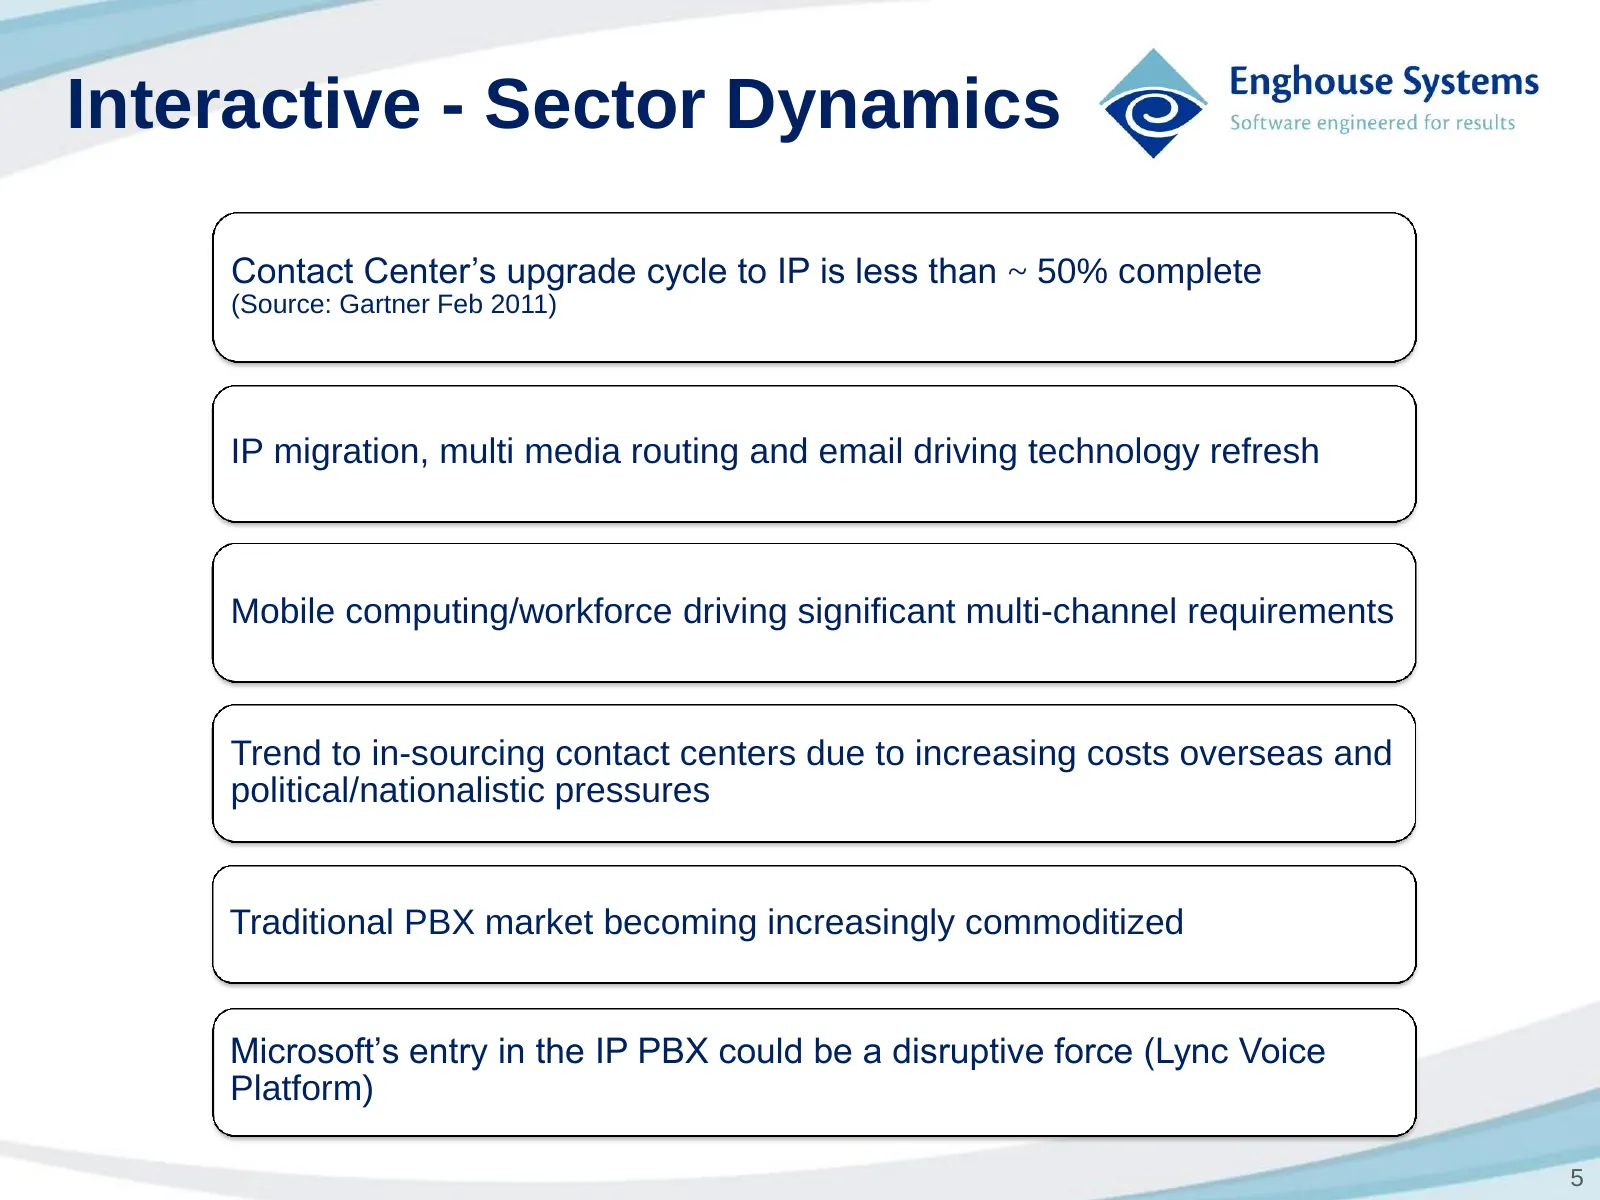
Interactive - Sector Dynamics Contact Center’s upgrade cycle to IP is less than ~ 50% complete (Source: Gartner Feb 2011) IP migration, multi media routing and email driving technology refresh Mobile computing/workforce driving significant multi-channel requirements Trend to in-sourcing contact cent
Slide 6: Interactive Portfolio
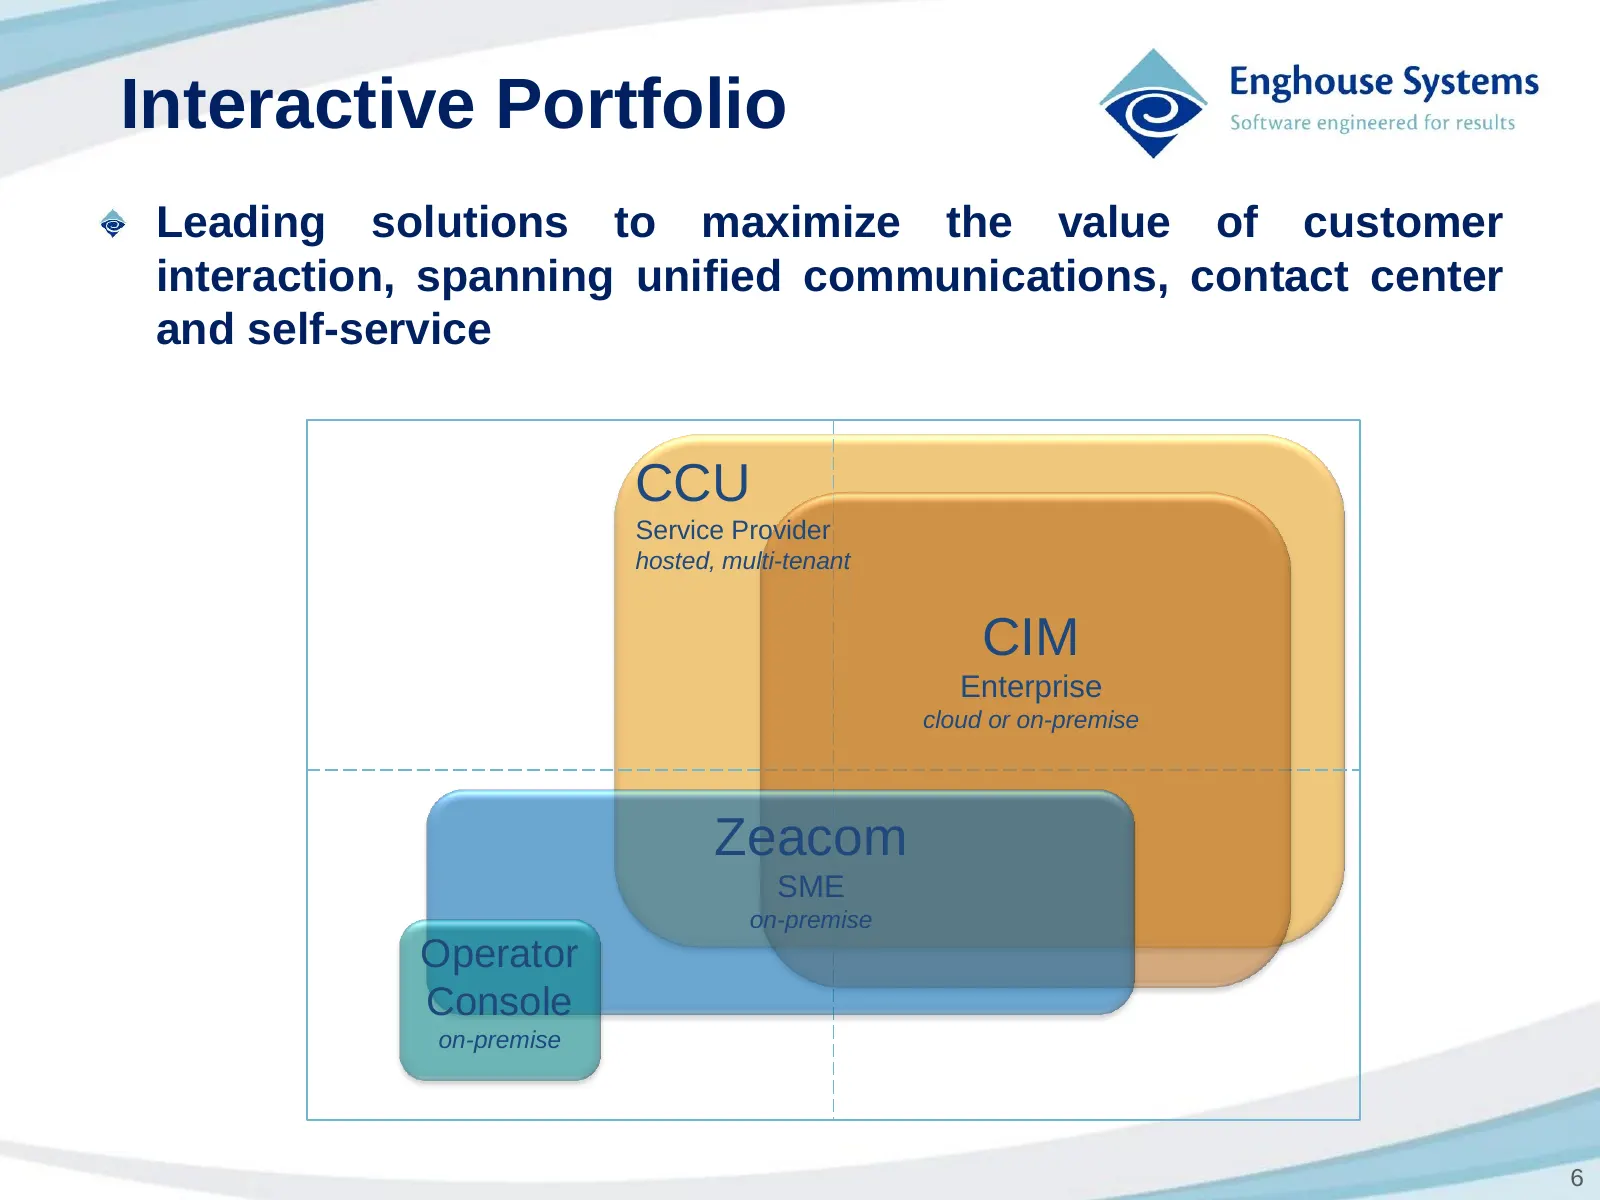
Interactive Portfolio Leading solutions to maximize the value of customer interaction, spanning unified communications, contact center and self-service CCU Service Provider hosted, multi-tenant CIM Enterprise cloud or on-premise Zeacom SME on-premise Operator Console on-premise 6
Slide 7: Transportation - Sector Dynamics
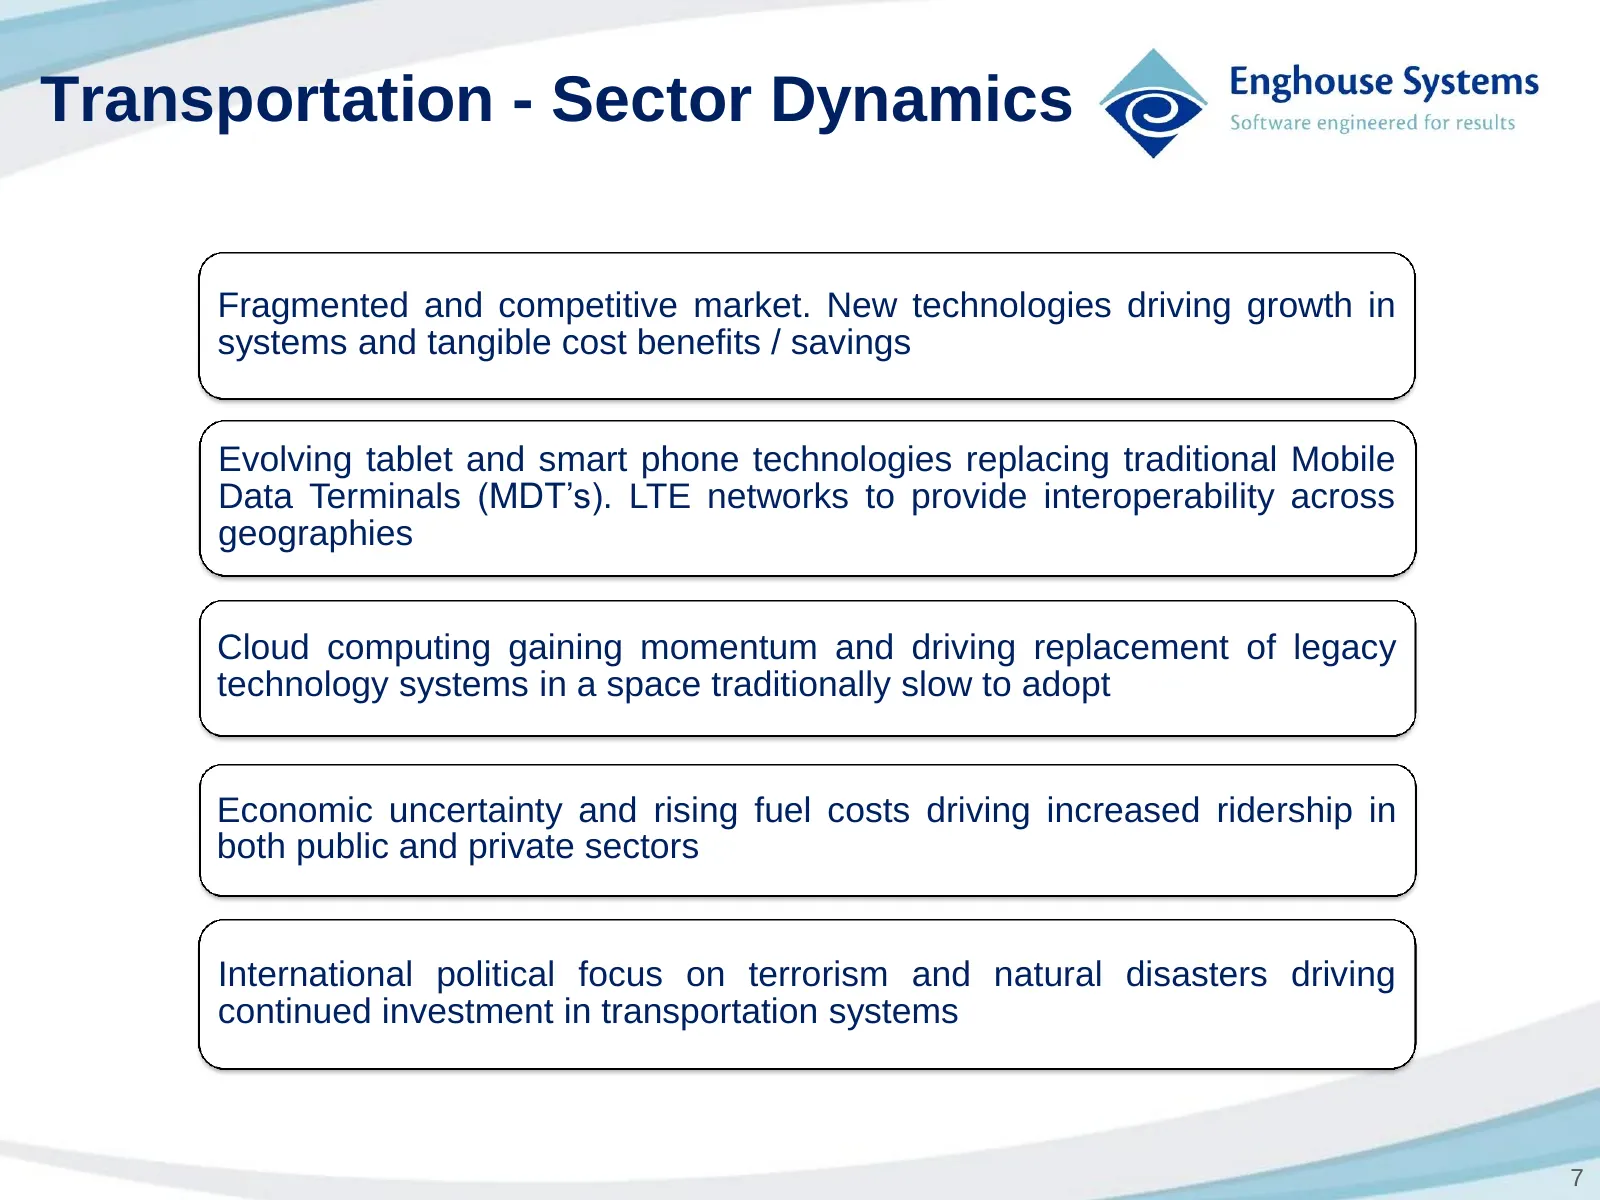
Transportation - Sector Dynamics Fragmented and competitive market. New technologies driving growth in systems and tangible cost benefits / savings Evolving tablet and smart phone technologies replacing traditional Mobile Data Terminals (MDT’s). LTE networks to provide interoperability across geogra
Slide 8: Transportation Portfolio
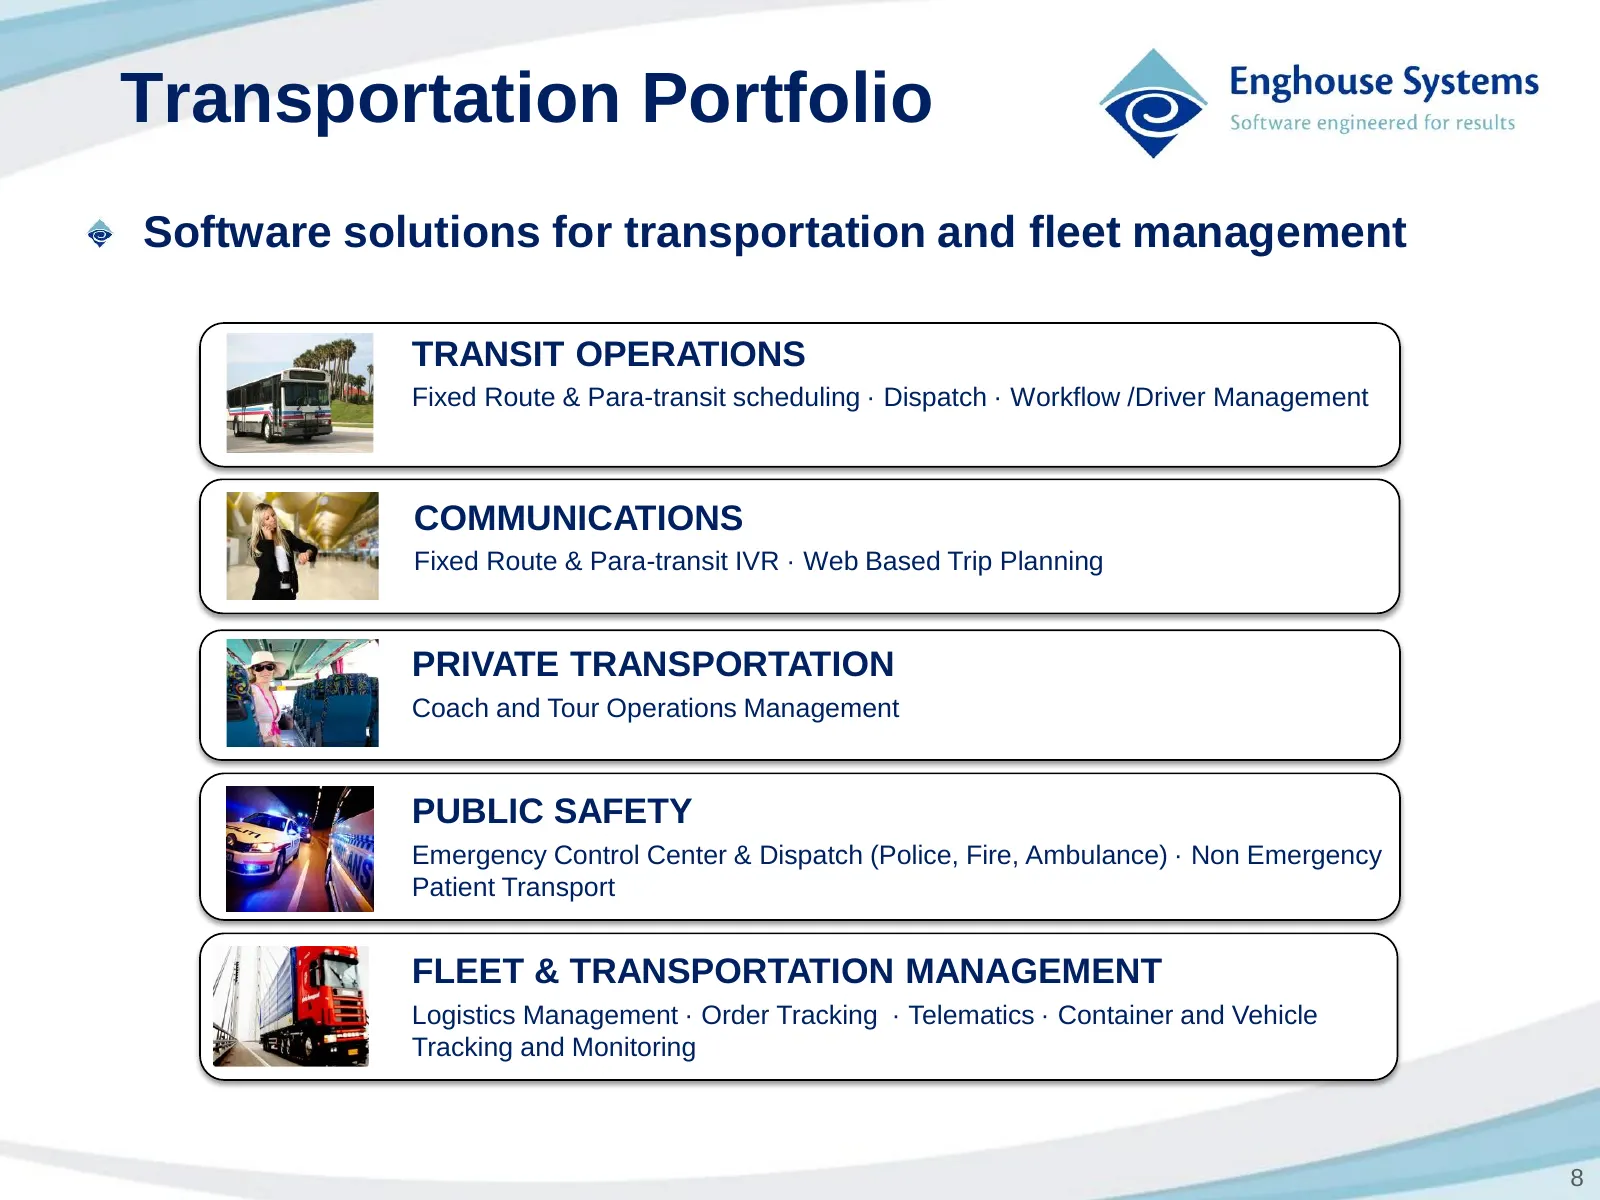
Transportation Portfolio Software solutions for transportation and fleet management TRANSIT OPERATIONS Fixed Route & Para-transit scheduling · Dispatch · Workflow /Driver Management COMMUNICATIONS Fixed Route & Para-transit IVR · Web Based Trip Planning PRIVATE TRANSPORTATION Coach and Tour Operatio
Slide 9: Networks - Sector Dynamics
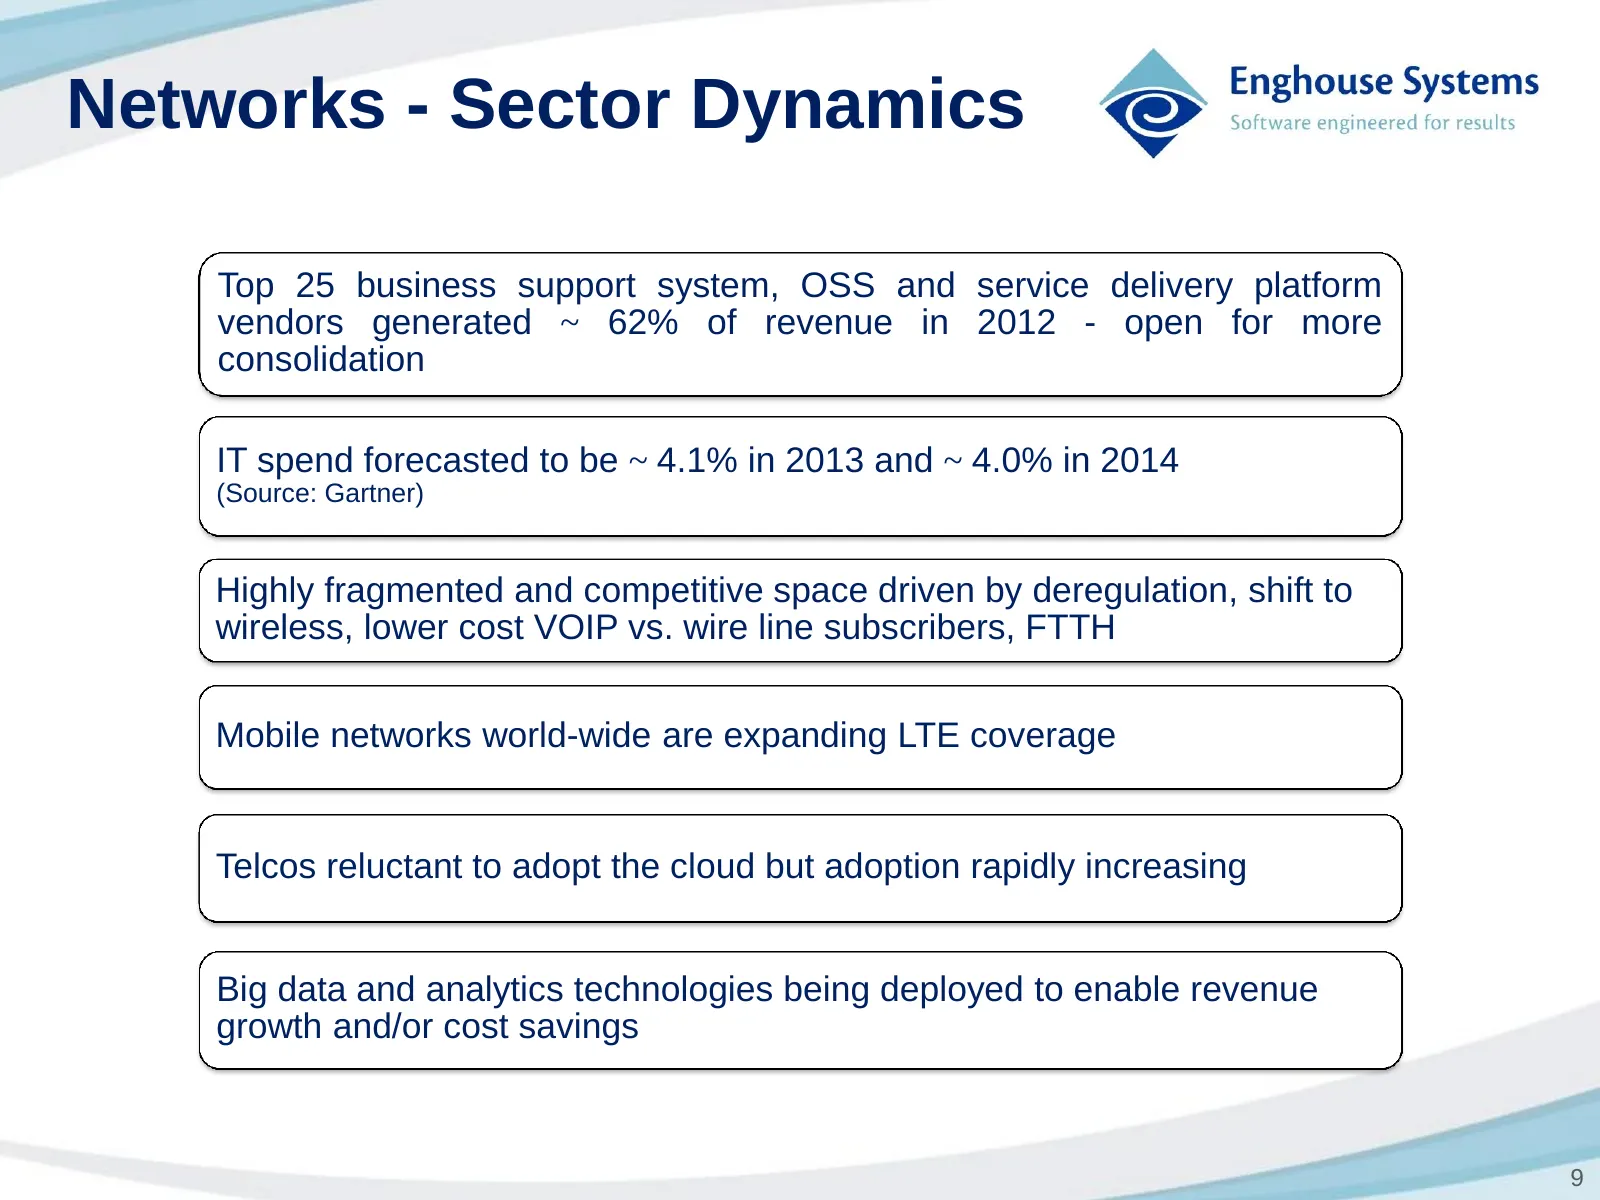
Networks - Sector Dynamics Top 25 business support system, OSS and service delivery platform vendors generated ~ 62% of revenue in 2012 - open for more consolidation IT spend forecasted to be ~ 4.1% in 2013 and ~ 4.0% in 2014 (Source: Gartner) Highly fragmented and competitive space driven by deregu
Slide 10: Networks Portfolio
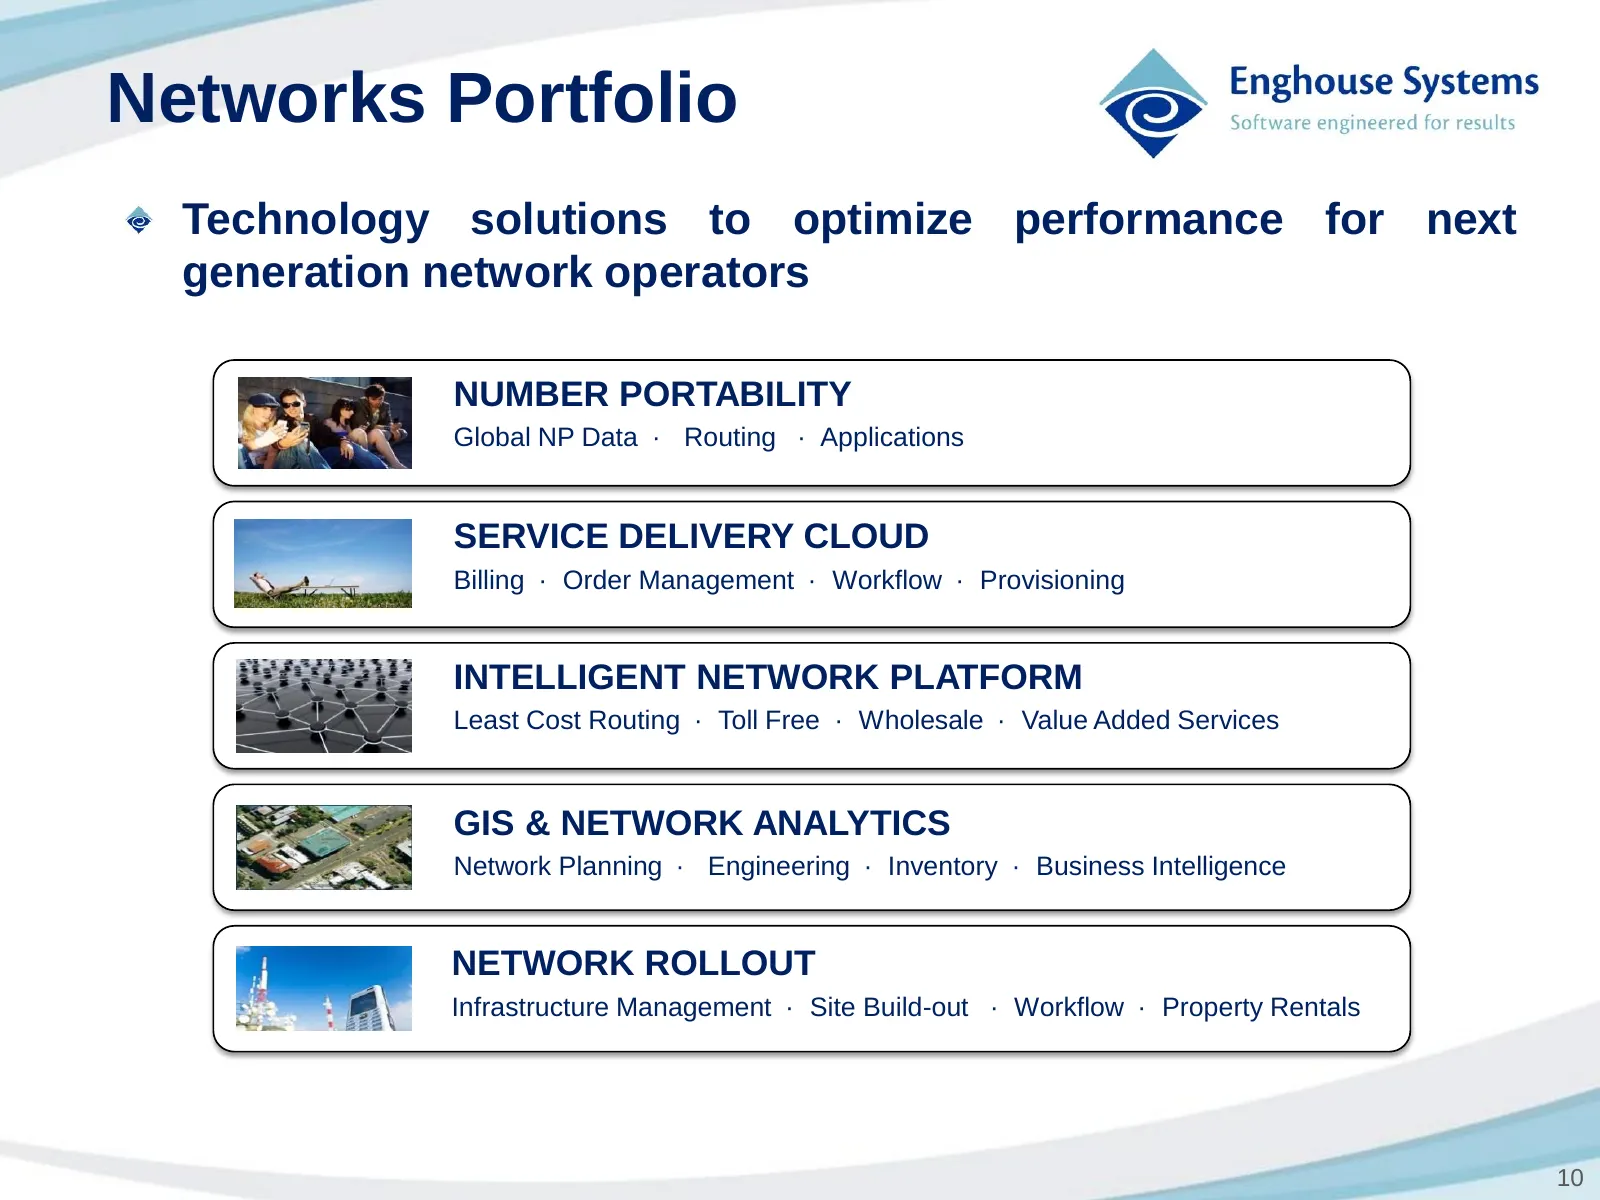
Networks Portfolio Technology solutions to optimize performance for next generation network operators NUMBER PORTABILITY Global NP Data · Routing · Applications SERVICE DELIVERY CLOUD Billing · Order Management · Workflow · Provisioning INTELLIGENT NETWORK PLATFORM Least Cost Routing · Toll Free · W
Slide 11: Annual Results
= 2& Enghouse Systems © Software engineered for results ANNUAL RESULTS
Slide 12: FY 12 Highlights
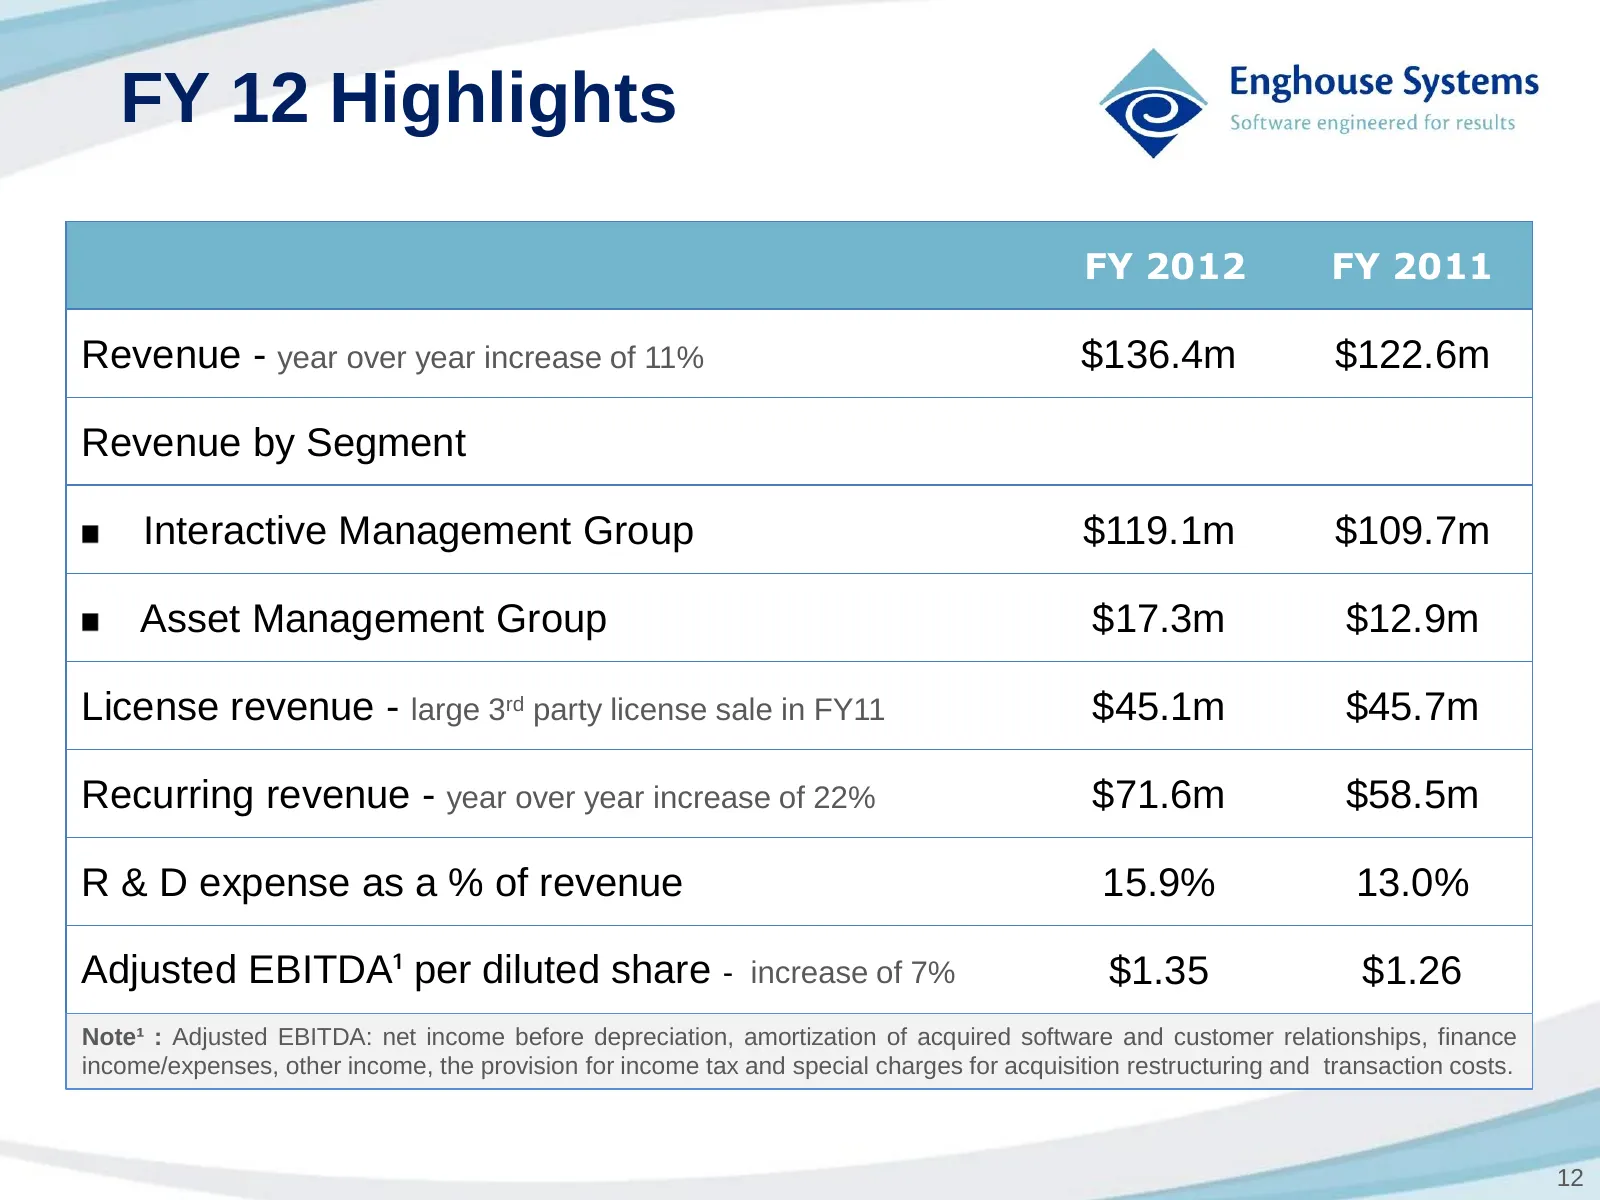
FY 12 Highlights FY 2012 FY 2011 Revenue - year over year increase of 11% $136.4m $122.6m Revenue by Segment Interactive Management Group $119.1m $109.7m Asset Management Group $17.3m $12.9m License revenue - large 3rd party license sale in FY11 $45.1m $45.7m Recurring revenue - year over year incre
Slide 13: FY 12 Highlights
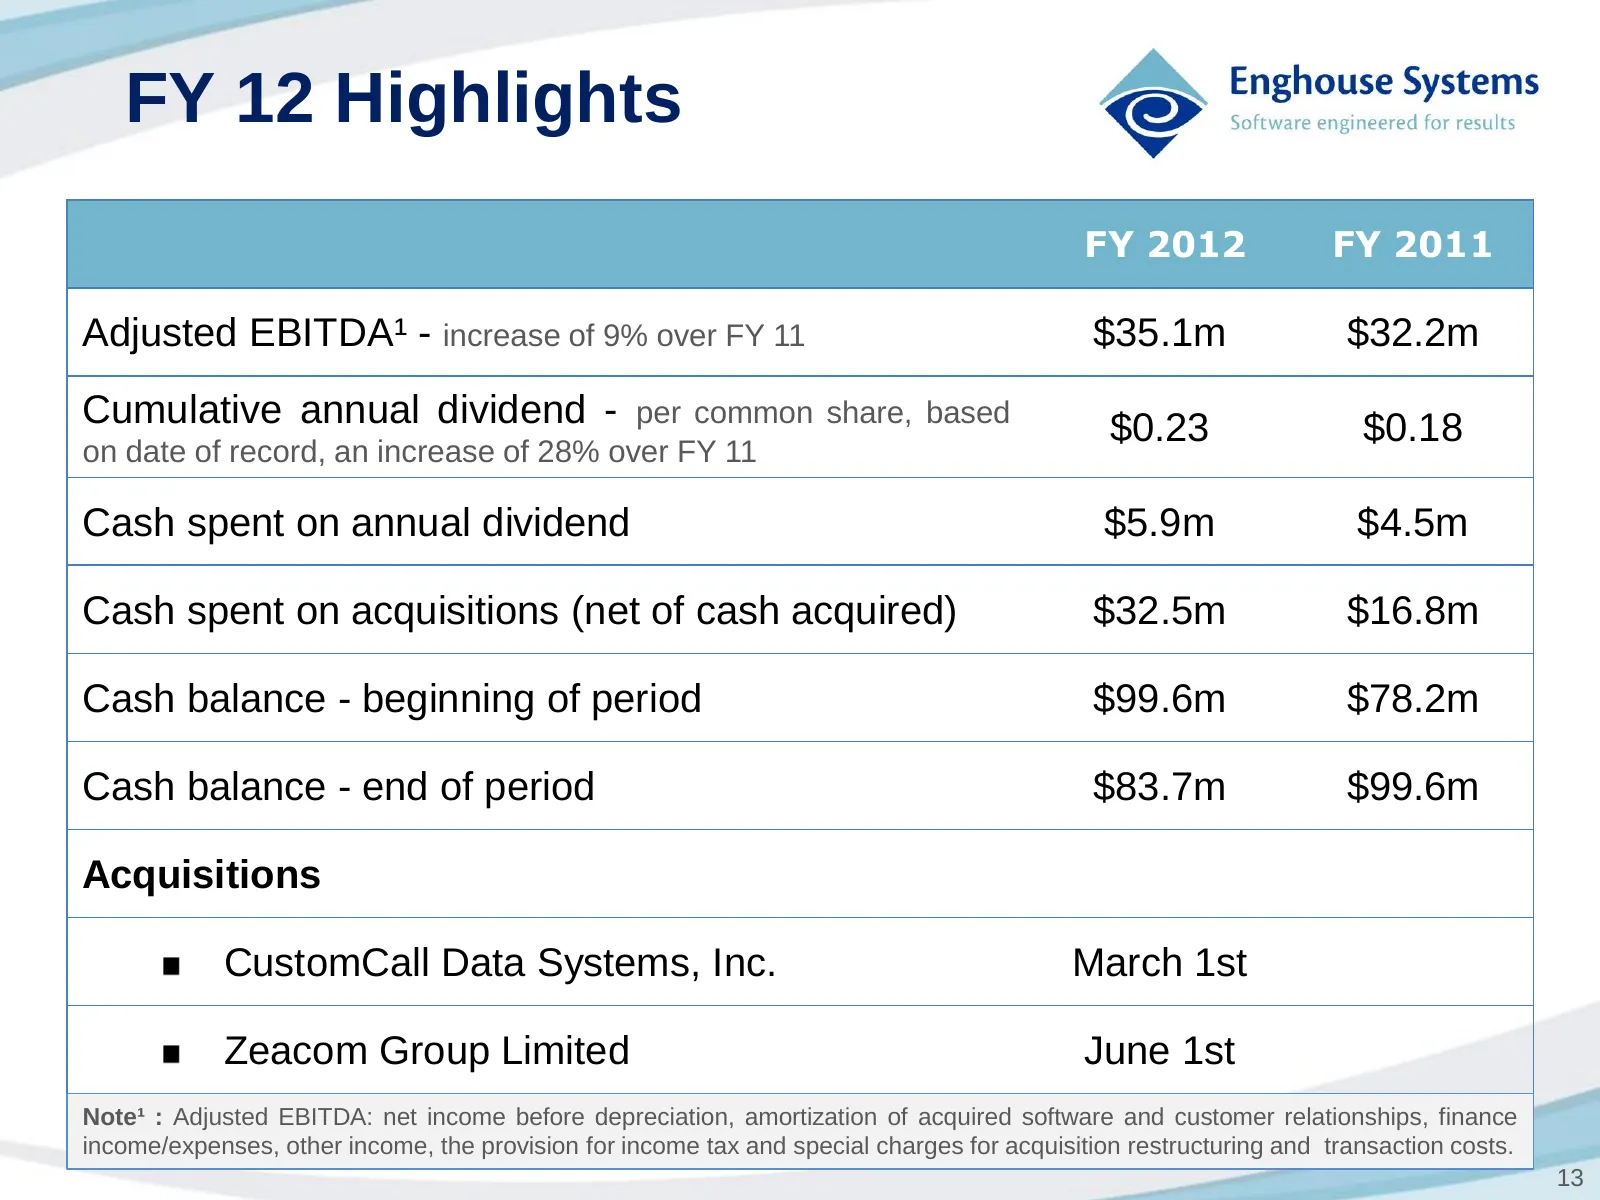
FY 12 Highlights FY 2012 FY 2011 Adjusted EBITDA¹ - increase of 9% over FY 11 $35.1m $32.2m Cumulative annual dividend - per common share, based $0.23 $0.18 on date of record, an increase of 28% over FY 11 Cash spent on annual dividend $5.9m $4.5m Cash spent on acquisitions (net of cash acquired) $3
Slide 14: Revenue Distribution
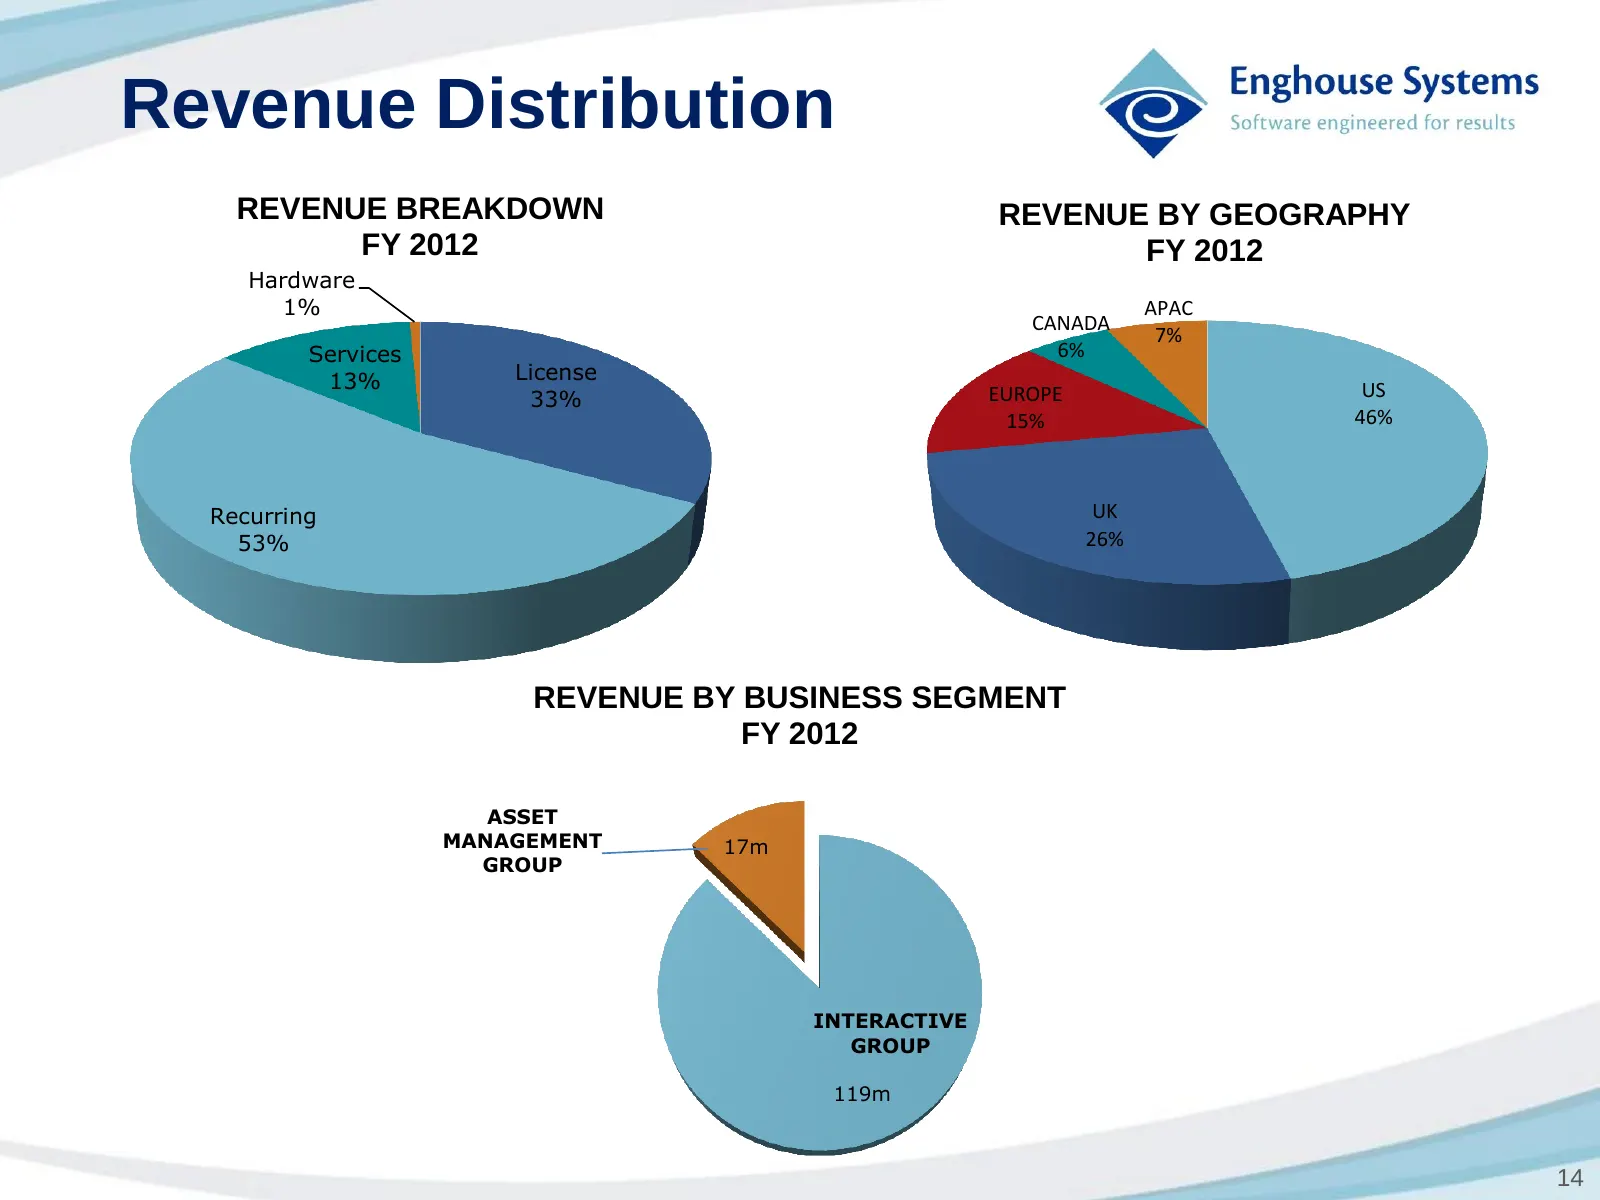
Revenue Distribution REVENUE BREAKDOWN REVENUE BY GEOGRAPHY FY 2012 FY 2012 Hardware 1% APAC CANADA 7% Services 6% 13% License 33% EUROPE US 15% 46% Recurring UK 53% 26% REVENUE BY BUSINESS SEGMENT FY 2012 ASSET MANAGEMENT 17m GROUP INTERACTIVE GROUP 119m 14
Slide 15: Fiscal Year Results
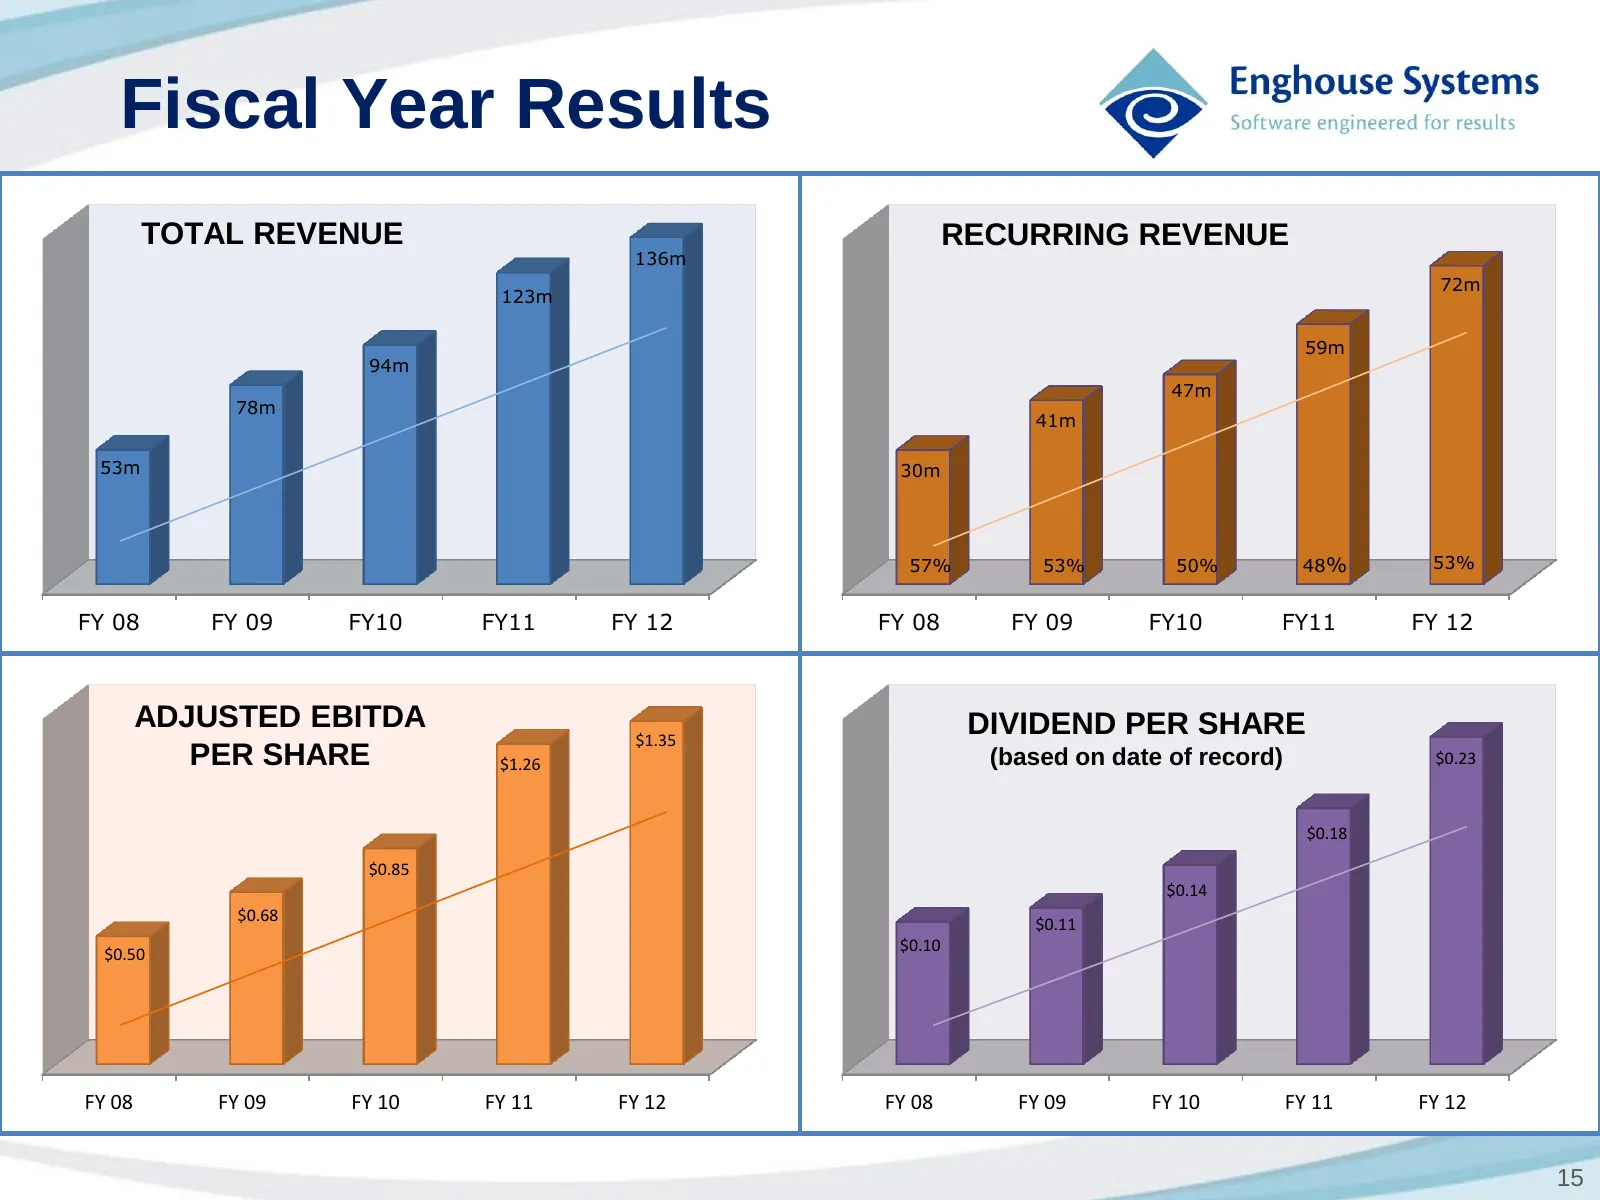
Fiscal Year Results TOTAL REVENUE RECURRING REVENUE 136m 72m 123m 59m 94m 47m 78m 41m 53m 30m 57% 53% 50% 48% 53% FY 08 FY 09 FY10 FY11 FY 12 FY 08 FY 09 FY10 FY11 FY 12 ADJUSTED EBITDA DIVIDEND PER SHARE $1.35 PER SHARE $1.26 (based on date of record) $0.23 $0.18 $0.85 $0.14 $0.68 $0.11 $0.10 $0.50
Slide 16: 1st Half Results
= 2& Enghouse Systems © Software engineered for results 15' HALF RESULTS
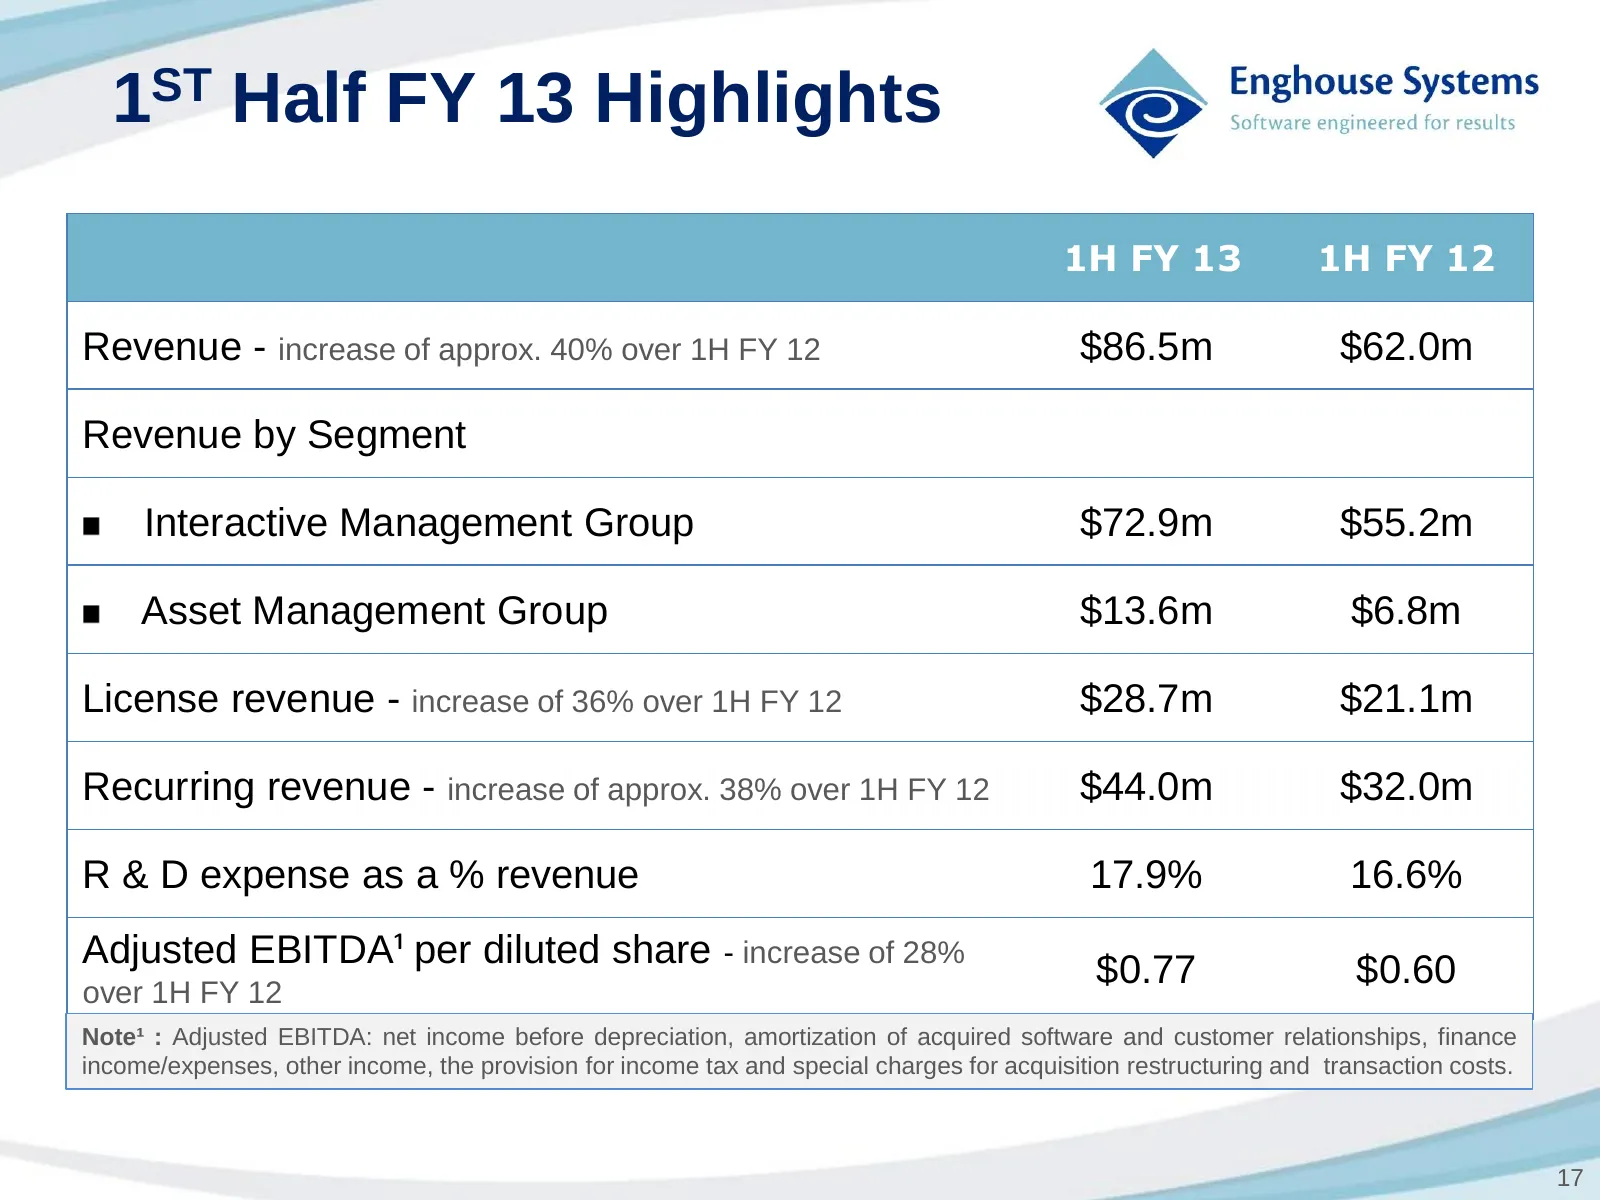
Slide 17: 1st Half FY 13 Highlights
1ST Half FY 13 Highlights 1H FY 13 1H FY 12 Revenue - increase of approx. 40% over 1H FY 12 $86.5m $62.0m Revenue by Segment Interactive Management Group $72.9m $55.2m Asset Management Group $13.6m $6.8m License revenue - increase of 36% over 1H FY 12 $28.7m $21.1m Recurring revenue - increase of ap
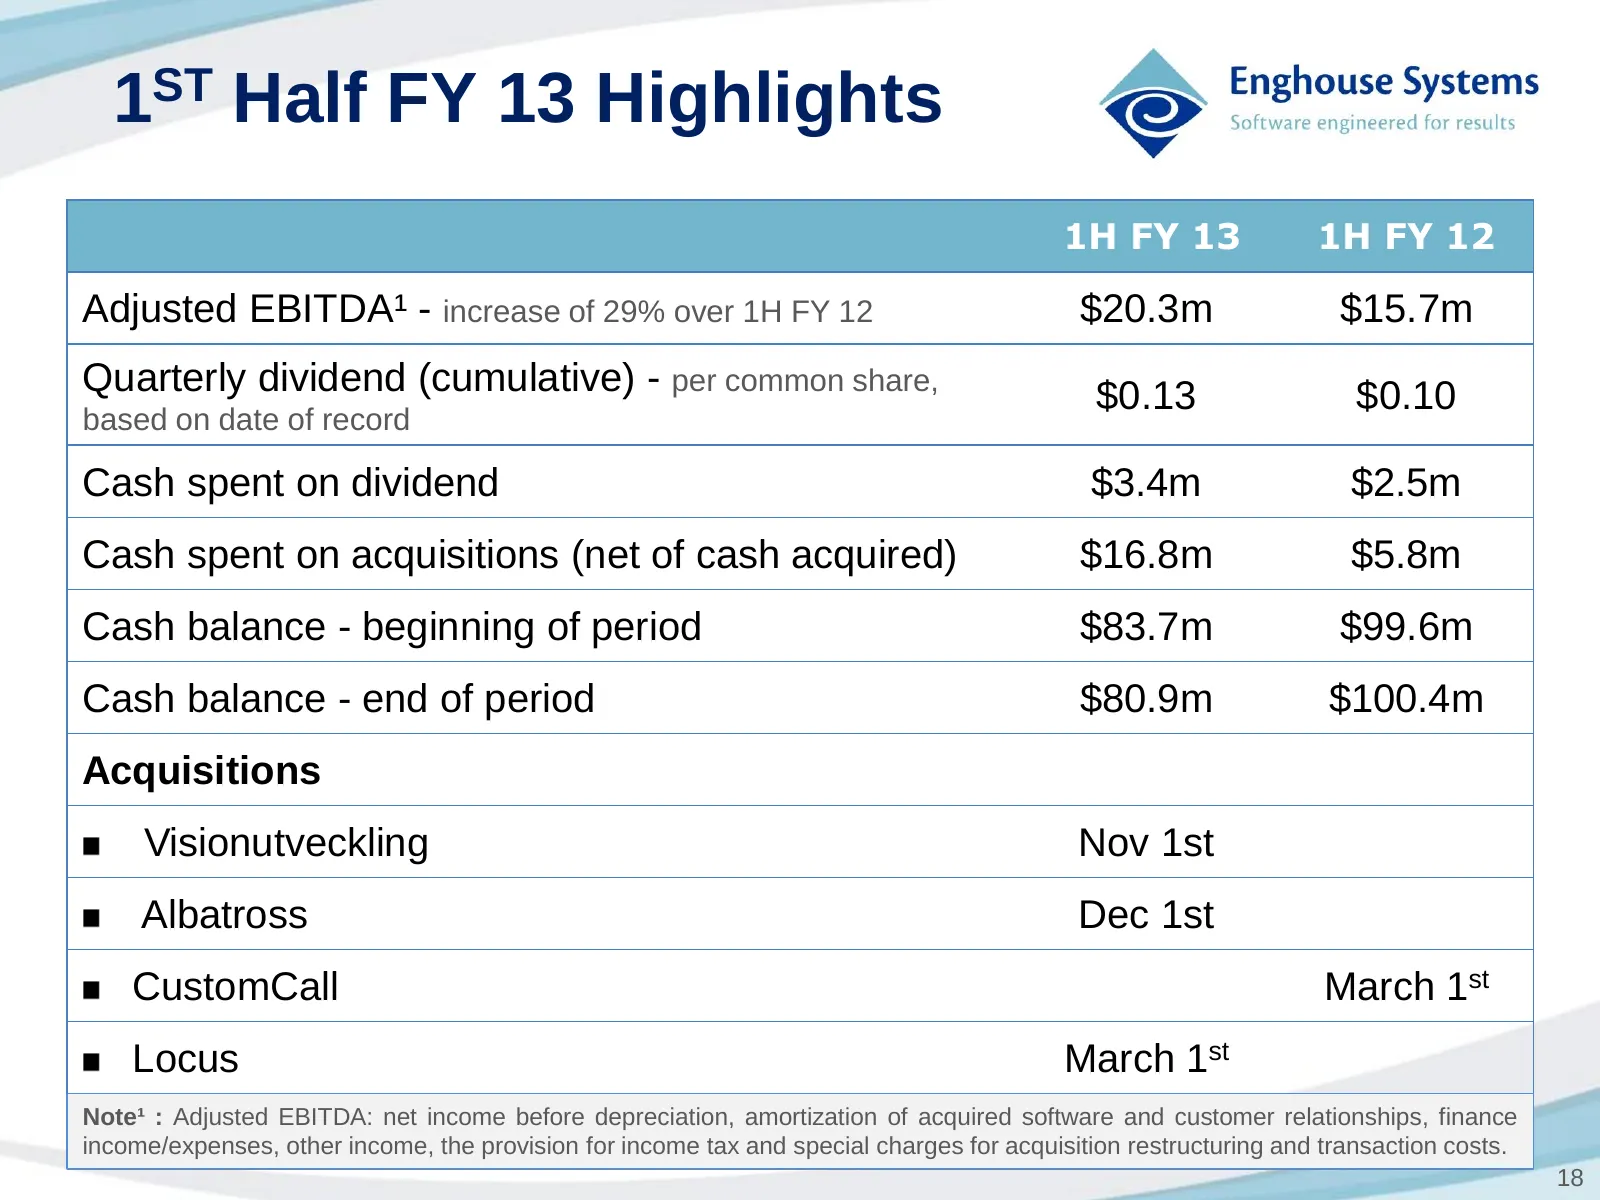
Slide 18: 1st Half FY 13 Highlights
1ST Half FY 13 Highlights 1H FY 13 1H FY 12 Adjusted EBITDA¹ - increase of 29% over 1H FY 12 $20.3m $15.7m Quarterly dividend (cumulative) - per common share, $0.13 $0.10 based on date of record Cash spent on dividend $3.4m $2.5m Cash spent on acquisitions (net of cash acquired) $16.8m $5.8m Cash ba
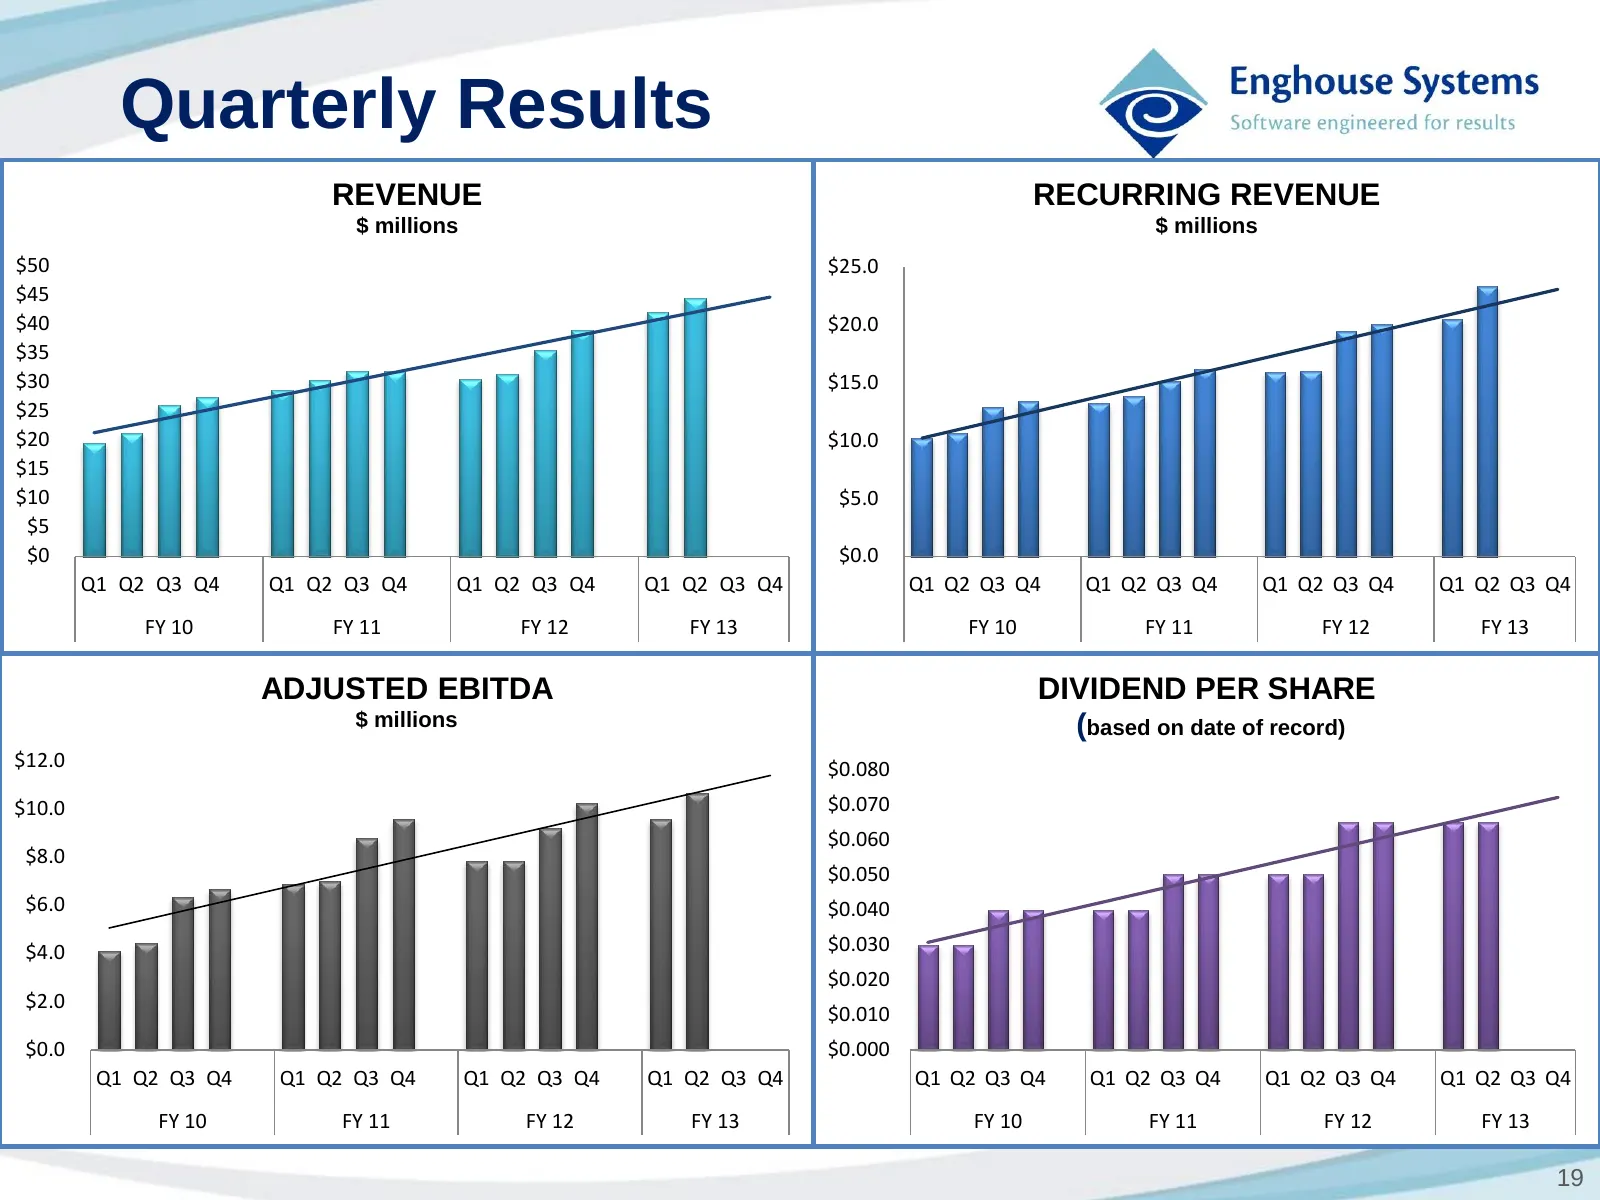
Slide 19: Quarterly Results
Quarterly Results REVENUE RECURRING REVENUE $ millions $ millions $50 $25.0 $45 $40 $20.0 $35 $30 $15.0 $25 $20 $10.0 $15 $10 $5.0 $5 $0 $0.0 Q1 Q2 Q3 Q4 Q1 Q2 Q3 Q4 Q1 Q2 Q3 Q4 Q1 Q2 Q3 Q4 Q1 Q2 Q3 Q4 Q1 Q2 Q3 Q4 Q1 Q2 Q3 Q4 Q1 Q2 Q3 Q4 FY 10 FY 11 FY 12 FY 13 FY 10 FY 11 FY 12 FY 13 ADJUSTED EBITD
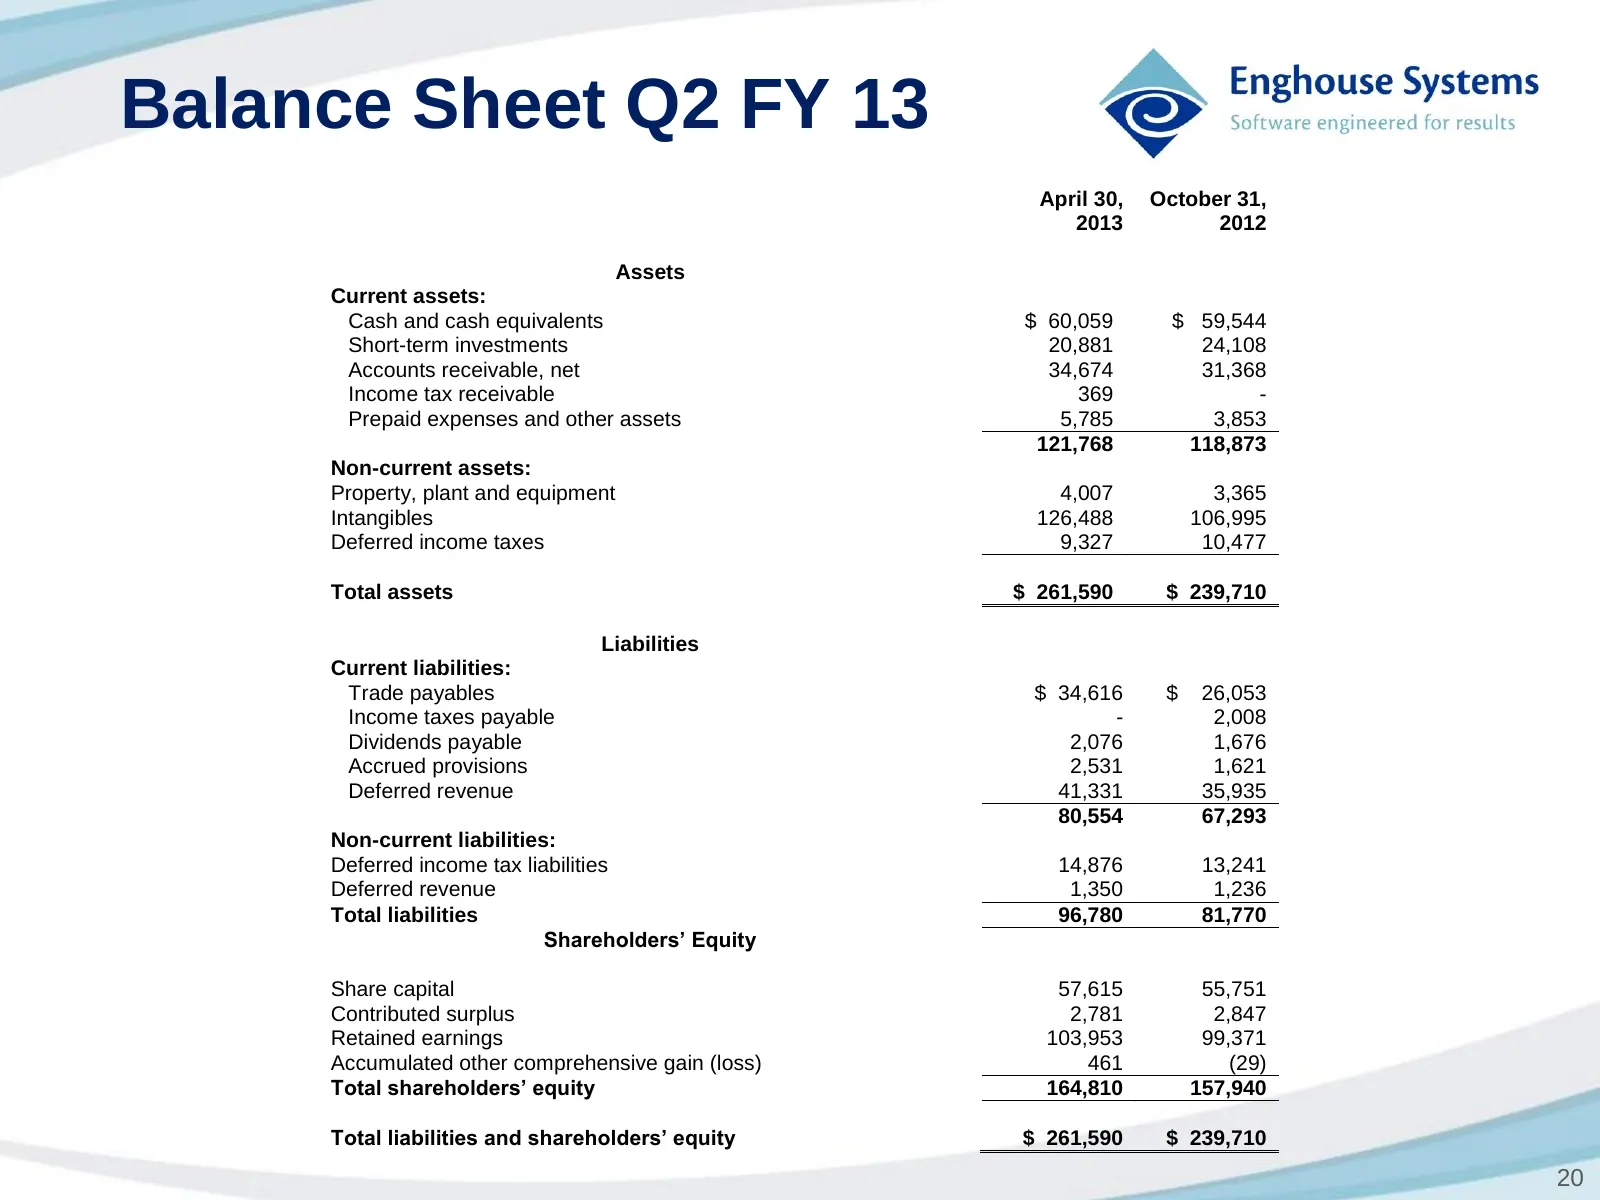
Slide 20: Balance Sheet Q2 FY 13
Balance Sheet Q2 FY 13 April 30, October 31, 2013 2012 Assets Current assets: Cash and cash equivalents $ 60,059 $ 59,544 Short-term investments 20,881 24,108 Accounts receivable, net 34,674 31,368 Income tax receivable 369 - Prepaid expenses and other assets 5,785 3,853 121,768 118,873 Non-current
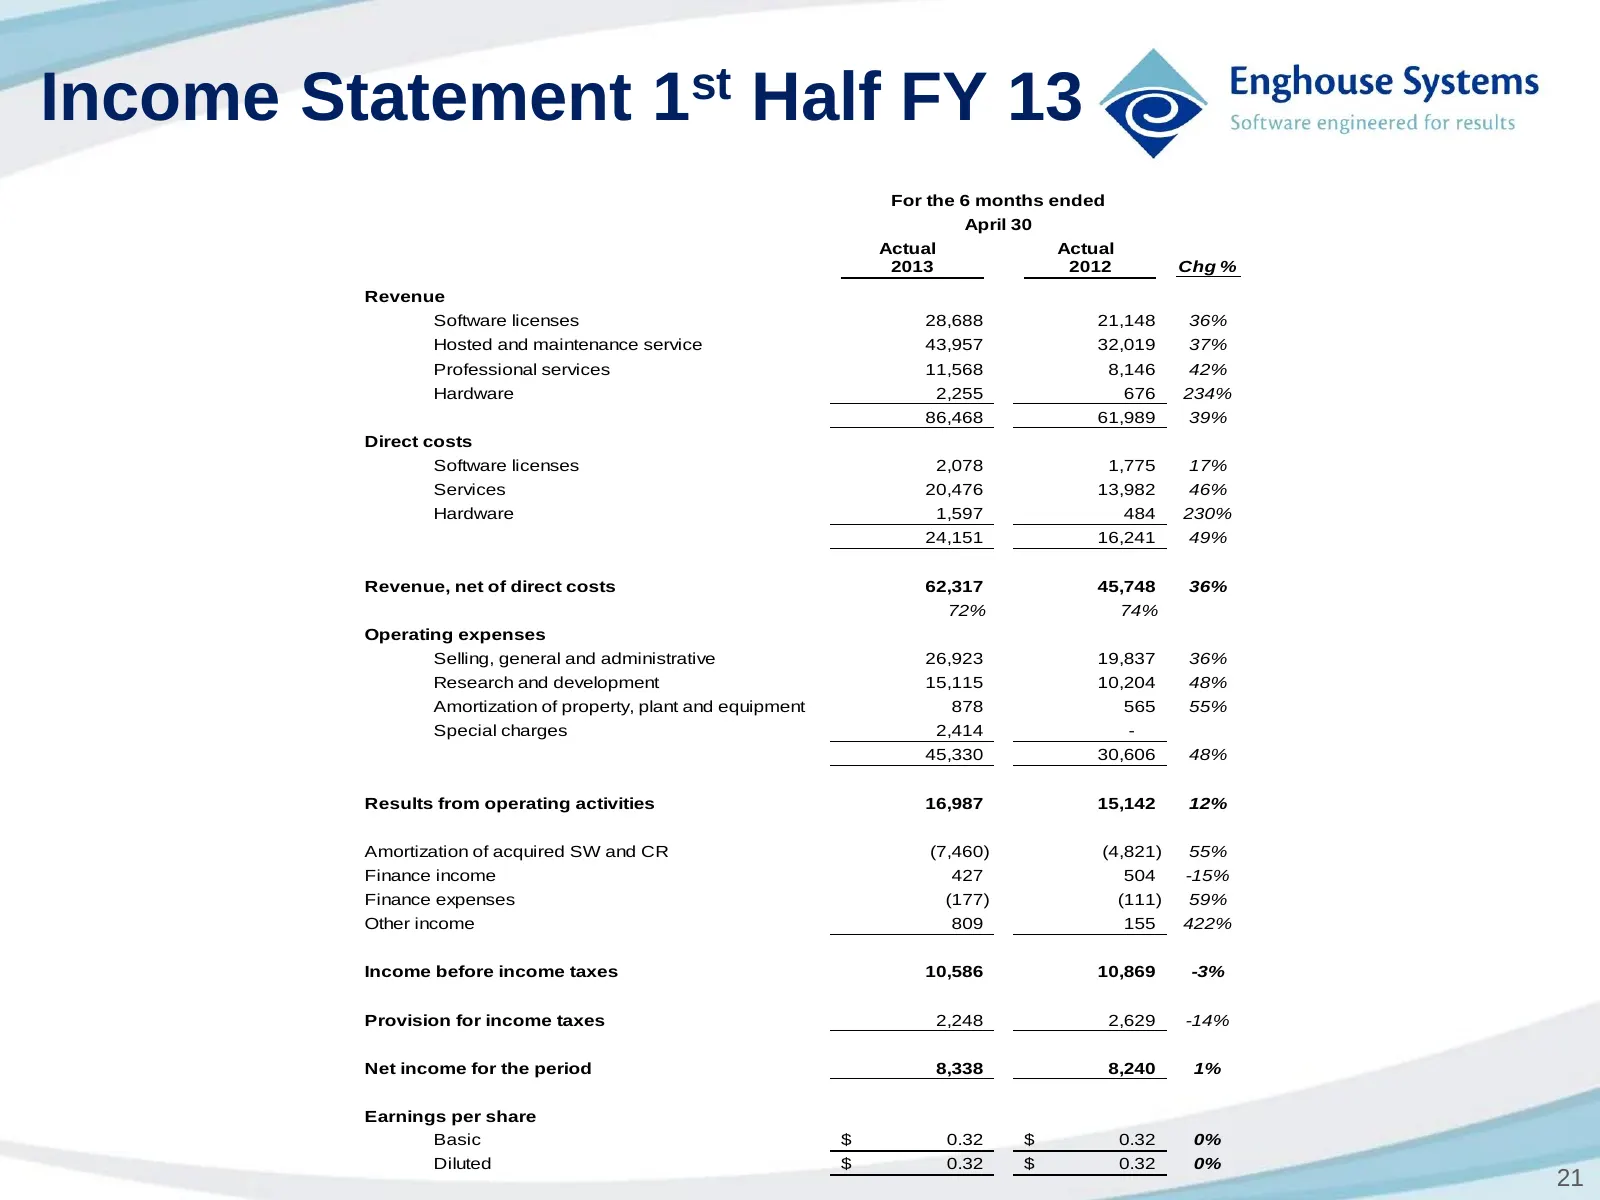
Slide 21: Income Statement 1st Half FY 13
Income Statement 1st Half FY 13 For the 6 months ended April 30 Actual Actual 2013 2012 Chg % Revenue Software licenses 28,688 21,148 36% Hosted and maintenance service 43,957 32,019 37% Professional services 11,568 8,146 42% Hardware 2,255 676 234% 86,468 61,989 39% Direct costs Software licenses 2
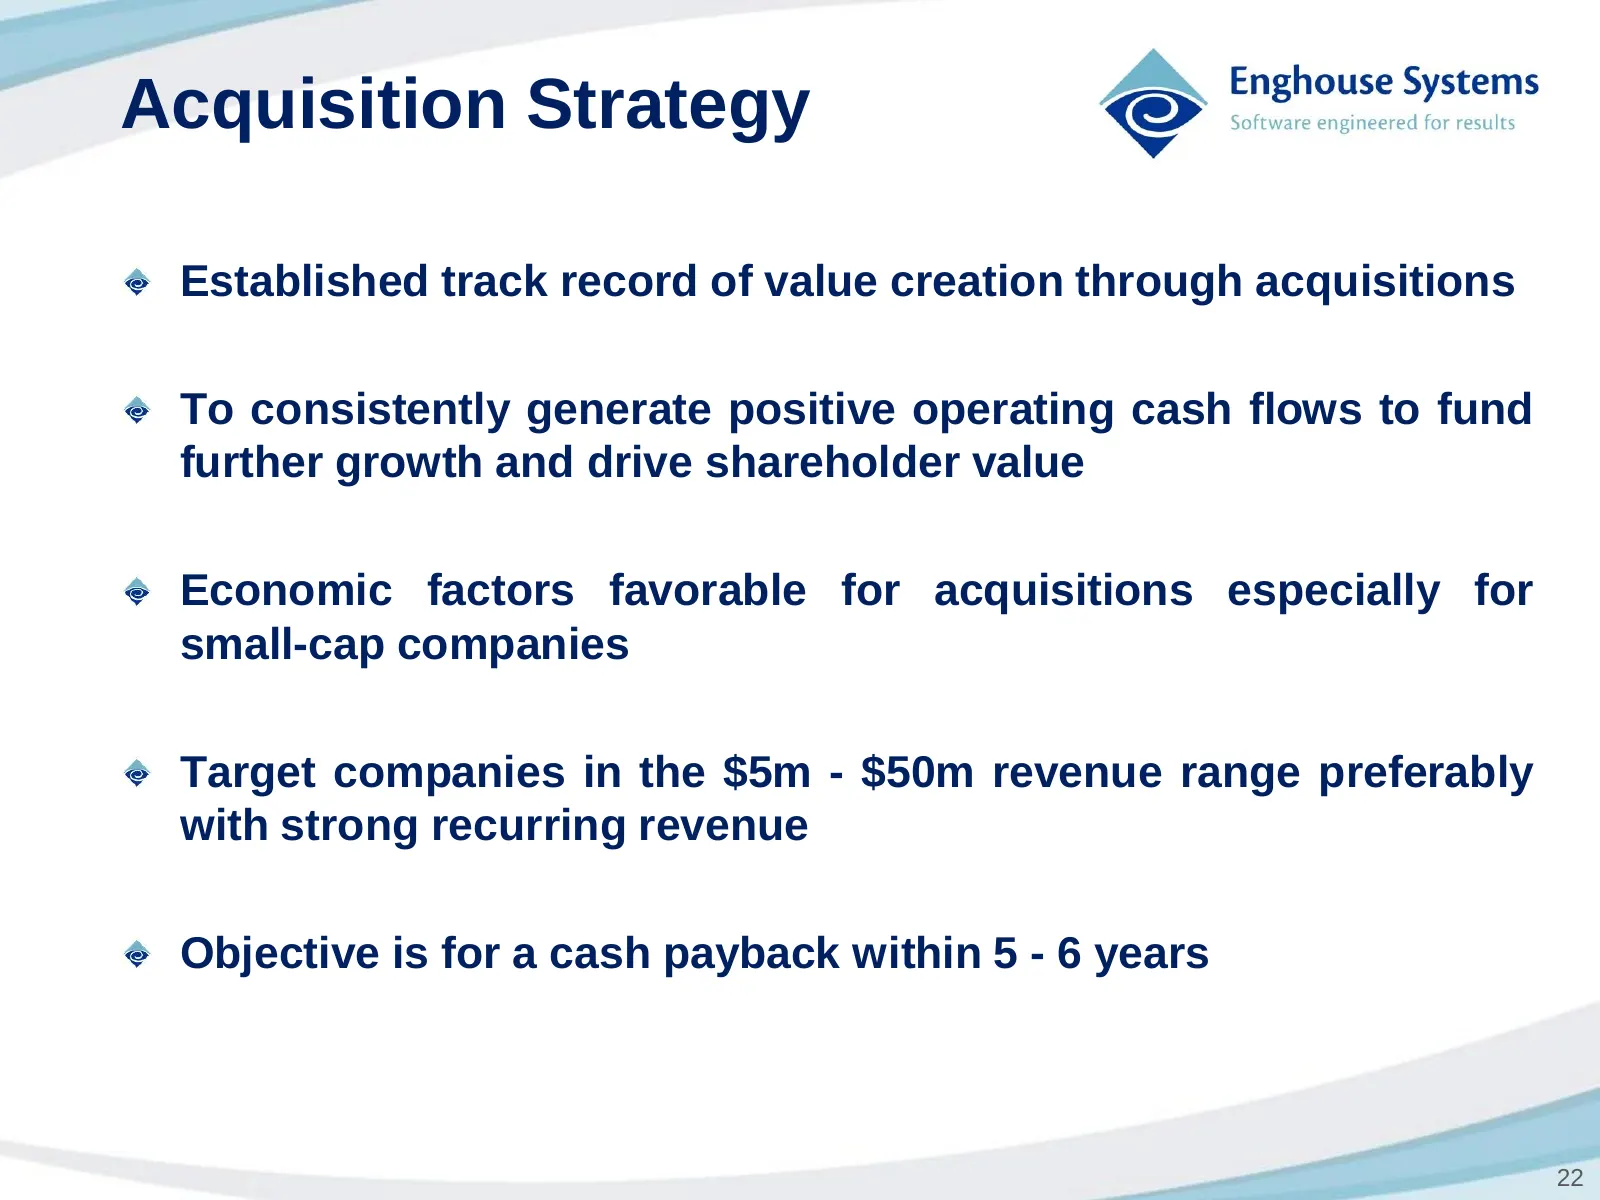
Slide 22: Acquisition Strategy
Acquisition Strategy Established track record of value creation through acquisitions To consistently generate positive operating cash flows to fund further growth and drive shareholder value Economic factors favorable for acquisitions especially for small-cap companies Target companies in the $5m -
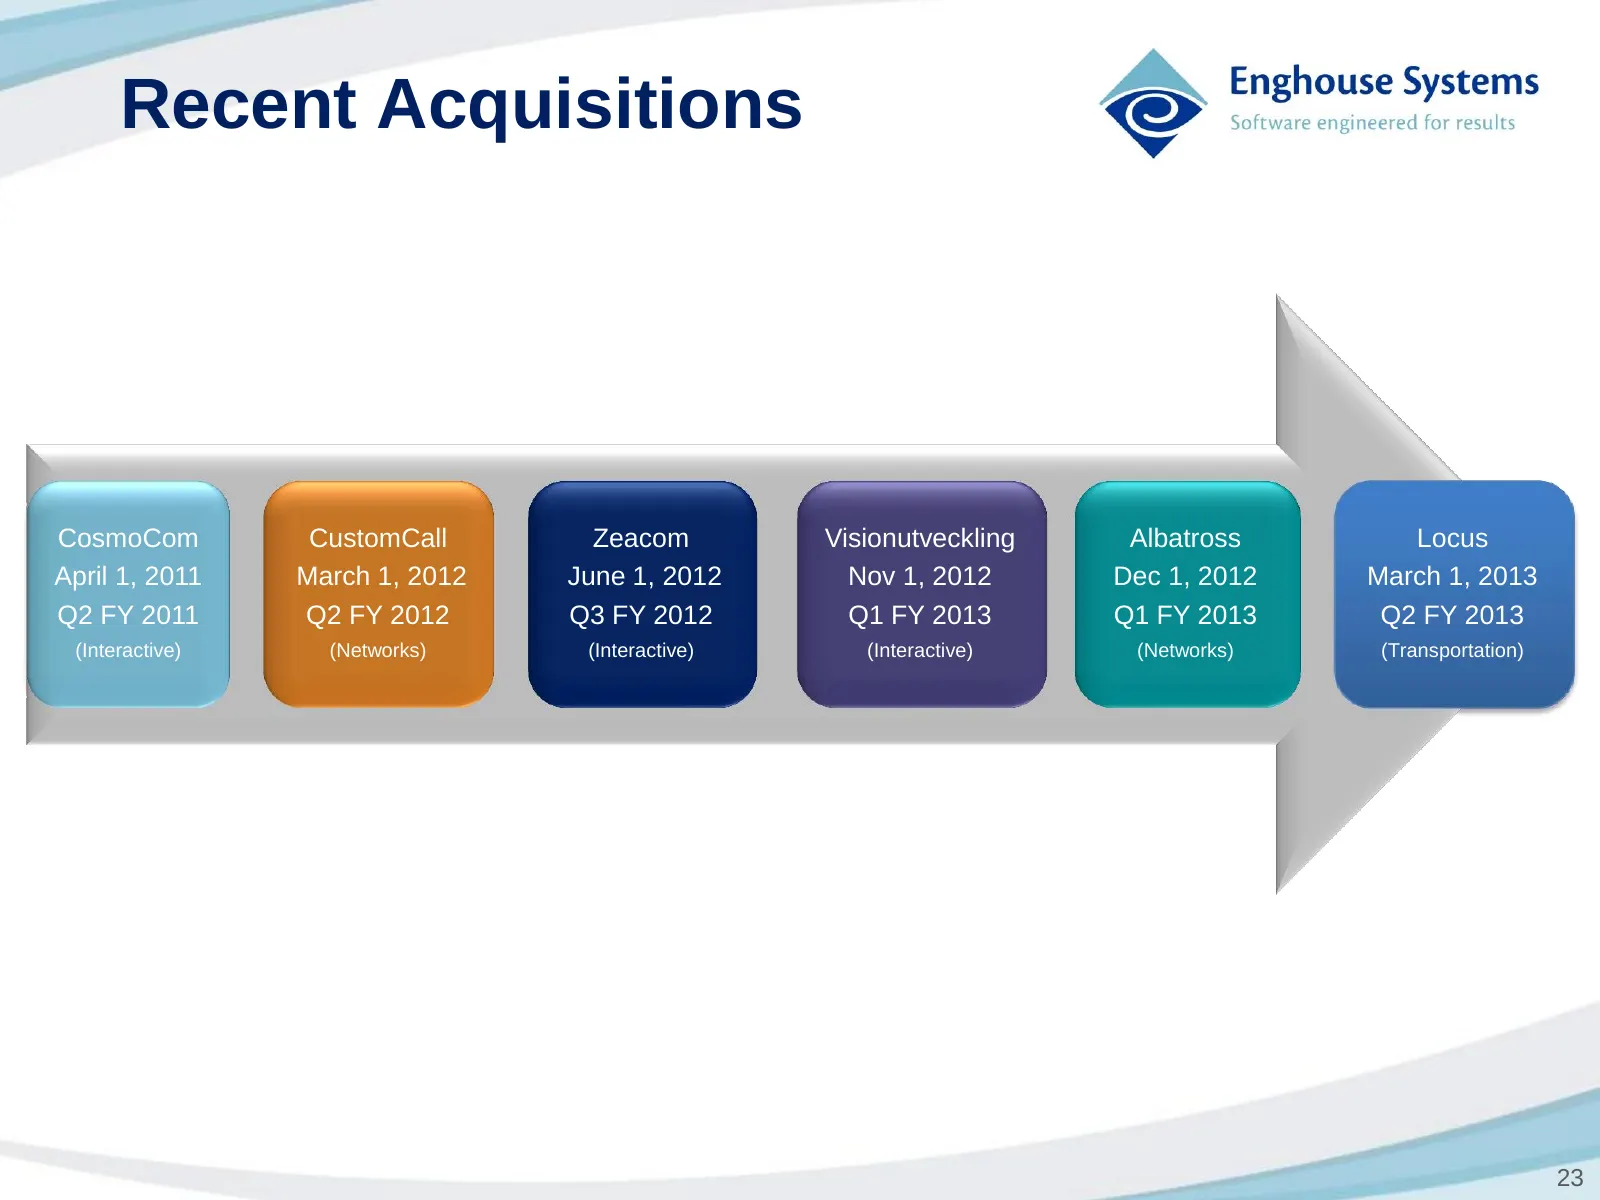
Slide 23: Recent Acquisitions
Recent Acquisitions Q1 FY 2013 CosmoCom CustomCall Zeacom Visionutveckling Albatross Locus April 1, 2011 March 1, 2012 June 1, 2012 Nov 1, 2012 Dec 1, 2012 March 1, 2013 Q2 FY 2011 Q2 FY 2012 Q3 FY 2012 Q1 FY 2013 Q1 FY 2013 Q2 FY 2013 (Interactive) (Networks) (Interactive) (Interactive) (Networks)
Slide 24: Thank You!
Enghouse Systems © Software engineered for results THANK You!
Source: Internet Archive copy of enghouse.com
More decks from Enghouse Systems Limited
 Q3 FY2026 Earnings Presentation16 slides · Sep 11, 2026
 Q1 2026 Earnings Presentation16 slides · Mar 13, 2026
 Q1 2025 Earnings Presentation16 slides · Mar 11, 2025
 Q3 2024 Earnings Presentation16 slides · Sep 6, 2024
 Q1 2024 Earnings Presentation15 slides · Mar 14, 2024
 Q4 FY2023 Earnings Presentation15 slides · Dec 15, 2023