Miller Energy Resources — Investor Presentation (April 2013)
16 slides from Miller Energy Resources's investor presentation, Apr 15, 2013
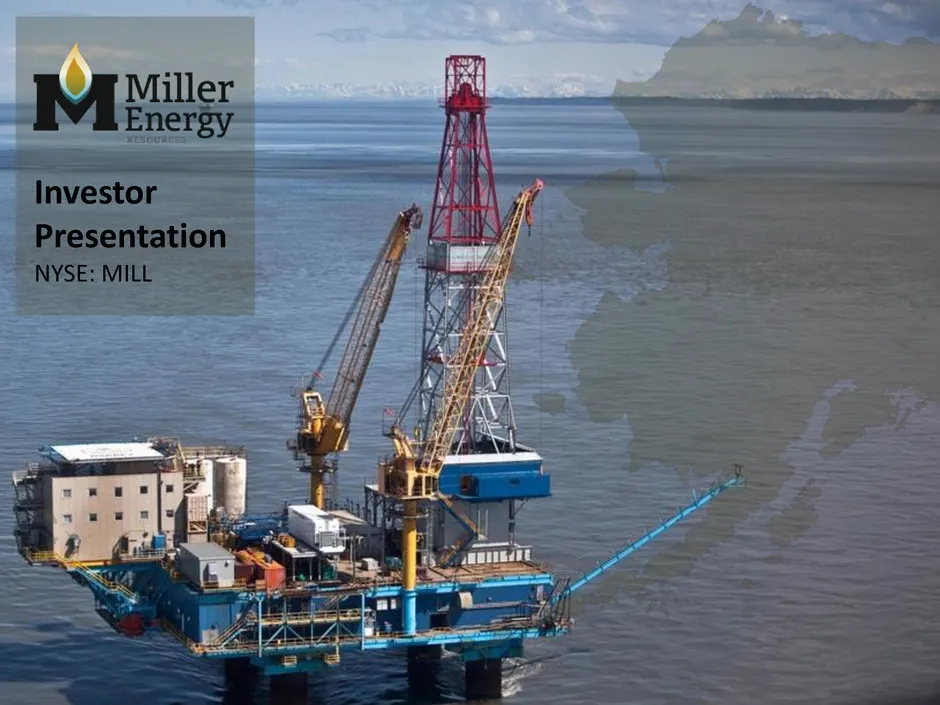
Slide 1: Miller Energy Resources Investor Presentation
Miller Energy Resources – NYSE: MILL Investor Presentation – January 2013 millerenergyresources.com Investor Presentation NYSE: MILL
Slide 2: Forward Looking Statements
Forward Looking Statements Certain statements in this presentation and elsewhere by Miller Energy Resources¸ Inc. are "forward-looking statements" within the meaning of the Private Securities Litigation Reform Act of 1995. These forward-looking statements involve the implied assessment that the reso
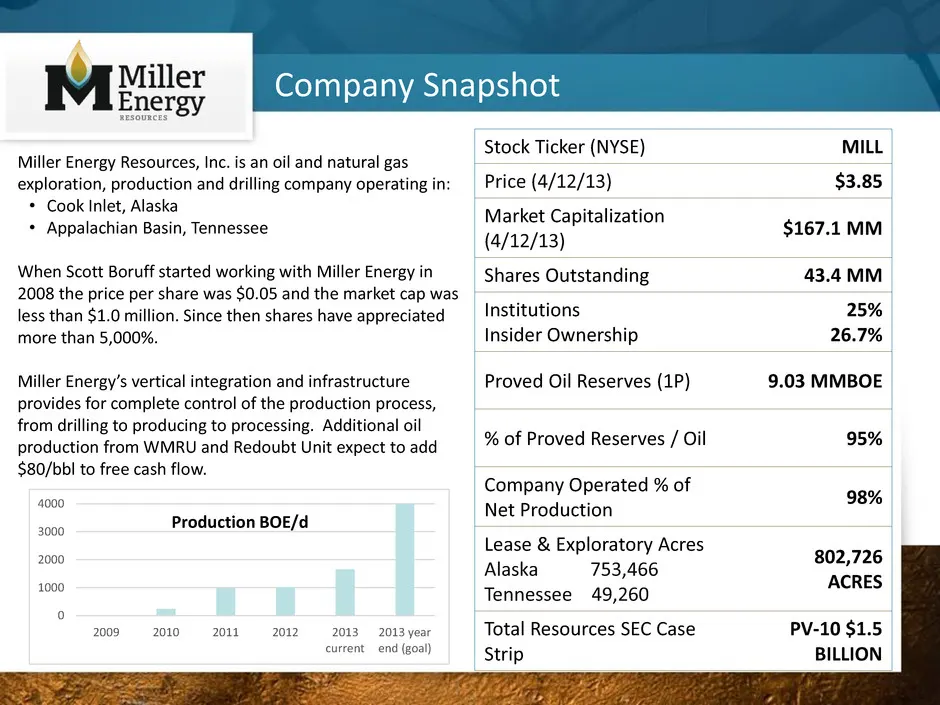
Slide 3: Company Snapshot
Company Snapshot Stock Ticker (NYSE) MILL Price (4/12/13) $3.85 Market Capitalization (4/12/13) $167.1 MM Shares Outstanding 43.4 MM Institutions Insider Ownership 25% 26.7% Proved Oil Reserves (1P) 9.03 MMBOE % of Proved Reserves / Oil 95% Company Operated % of Net Production 98% Lease & Explorator
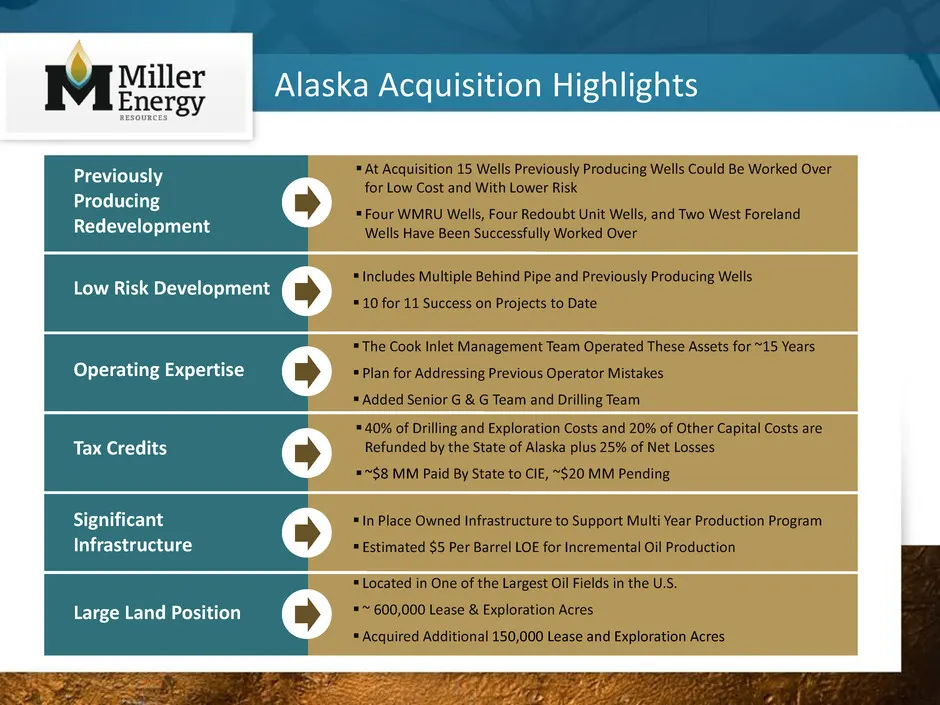
Slide 4: Low Risk Redevelopment and Tax Credits
Includes Multiple Behind Pipe and Previously Producing Wells 10 for 11 Success on Projects to Date Previously Producing Redevelopment Low Risk Development Operating Expertise At Acquisition 15 Wells Previously Producing Wells Could Be Worked Over for Low Cost and With Lower Risk Four WMRU Well
Slide 5: Rework History To Date
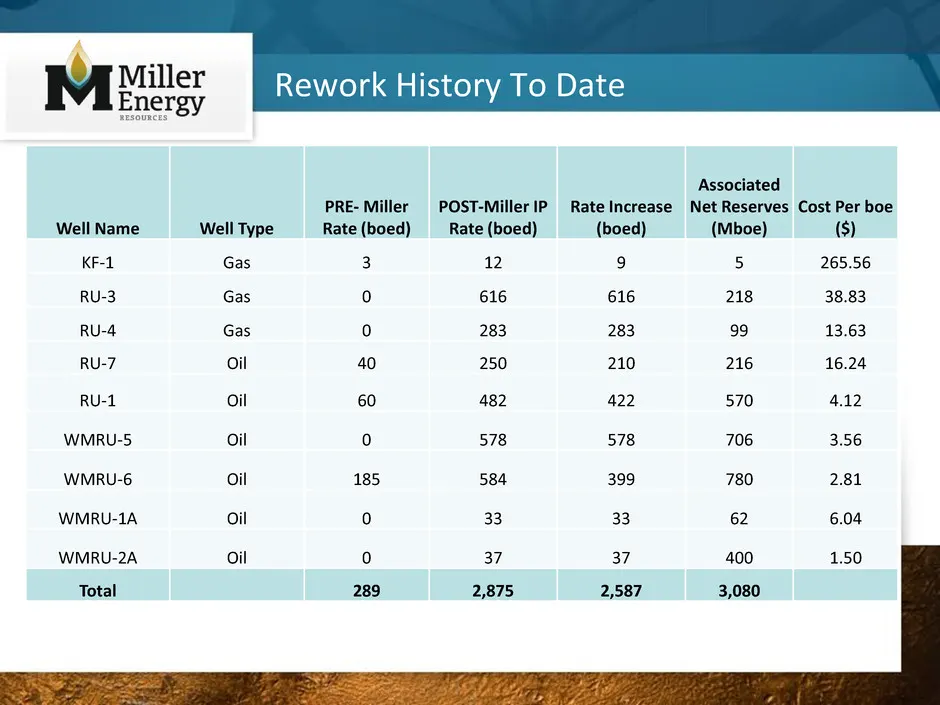
Well Name Well Type PRE- Miller Rate (boed) POST-Miller IP Rate (boed) Rate Increase (boed) Associated Net Reserves (Mboe) Cost Per boe ($) KF-1 Gas 3 12 9 5 265.56 RU-3 Gas 0 616 616 218 38.83 RU-4 Gas 0 283 283 99 13.63 RU-7 Oil 40 250 210 216 16.24 RU-1 Oil 60 482 422 570 4.12 WMRU-5 Oil 0 578 57
Slide 6: Cook Inlet Basin Opportunity
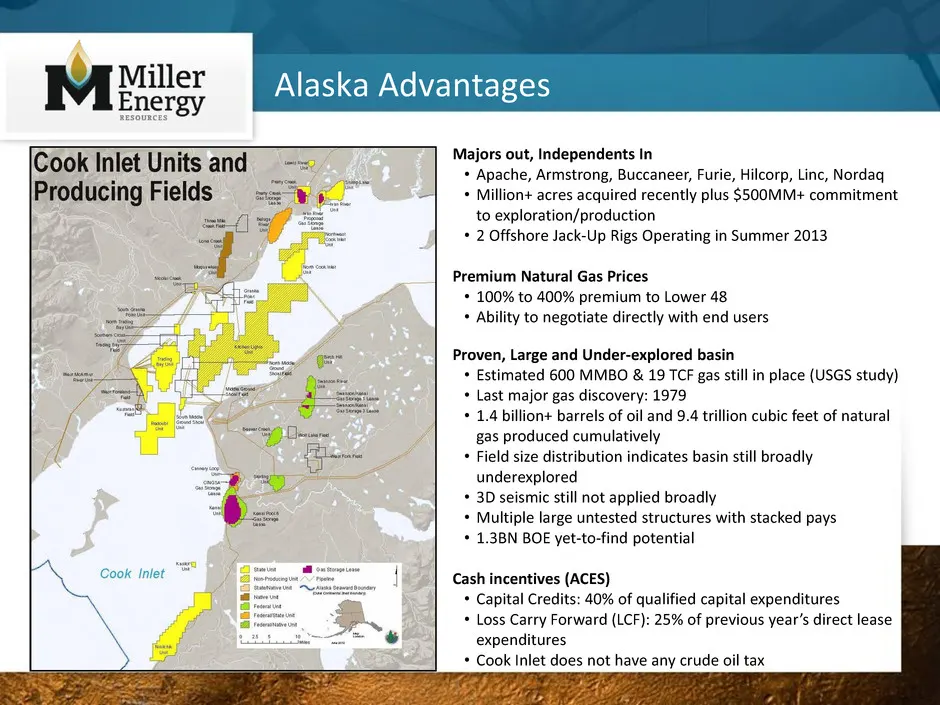
Majors out, Independents In • Apache, Armstrong, Buccaneer, Furie, Hilcorp, Linc, Nordaq • Million+ acres acquired recently plus $500MM+ commitment to exploration/production • 2 Offshore Jack-Up Rigs Operating in Summer 2013 Premium Natural Gas Prices • 100% to 400% premium to Lower 48 • Ability to
Slide 7: Cook Inlet Field(s) Comparison
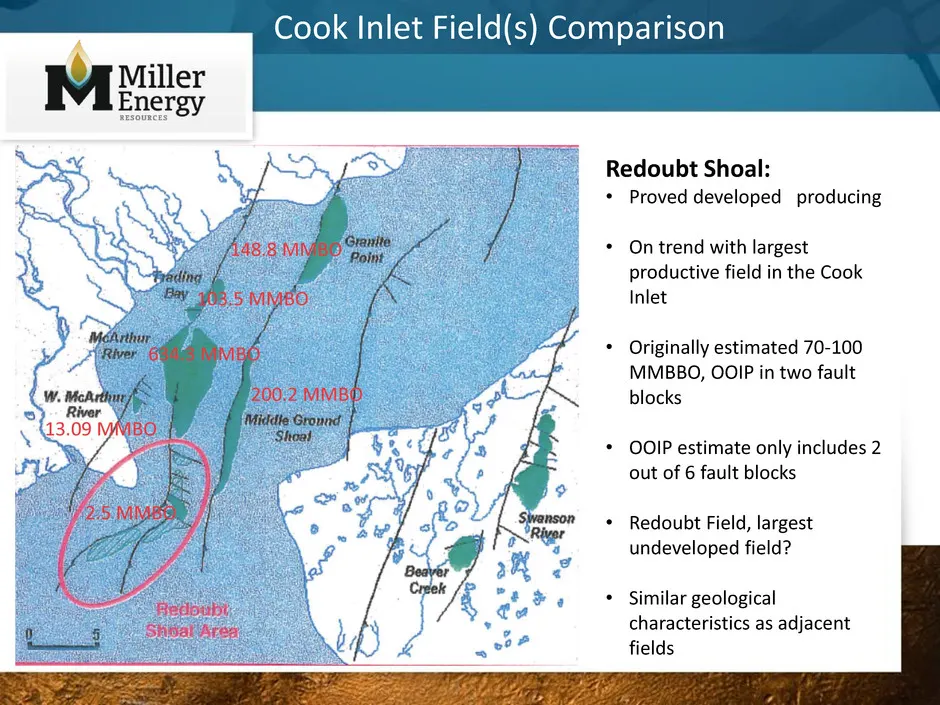
Redoubt Shoal: • Proved developed producing • On trend with largest productive field in the Cook Inlet • Originally estimated 70-100 MMBBO, OOIP in two fault blocks • OOIP estimate only includes 2 out of 6 fault blocks • Redoubt Field, largest undeveloped field? • Similar geological characteristics
Slide 8: Alaska – Redoubt Unit Field (Osprey)
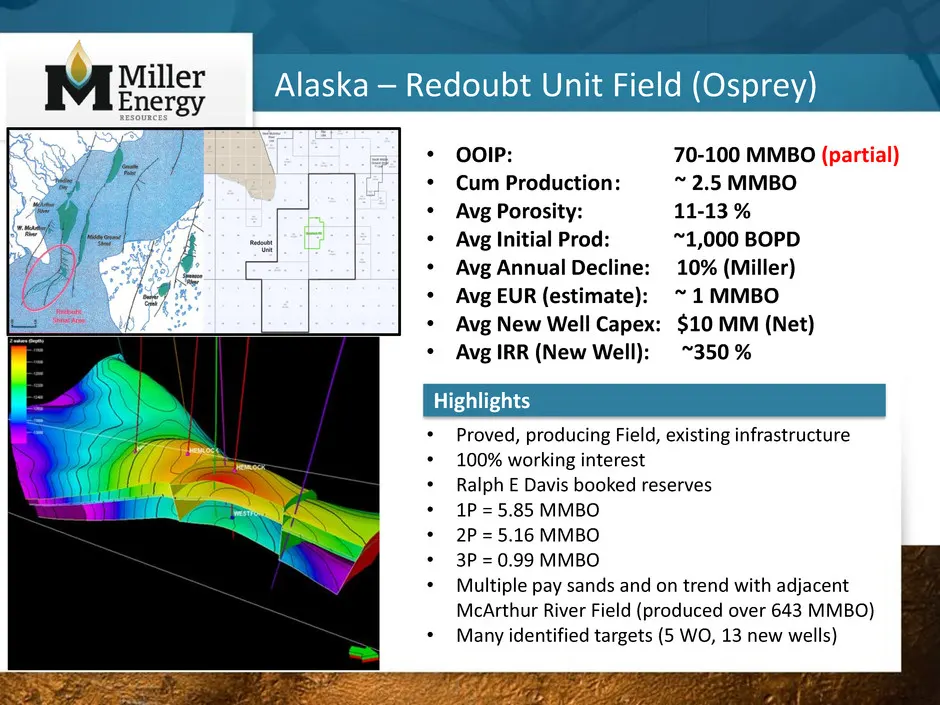
• Proved, producing Field, existing infrastructure • 100% working interest • Ralph E Davis booked reserves • 1P = 5.85 MMBO • 2P = 5.16 MMBO • 3P = 0.99 MMBO • Multiple pay sands and on trend with adjacent McArthur River Field (produced over 643 MMBO) • Many identified targets (5 WO, 13 new wells) A
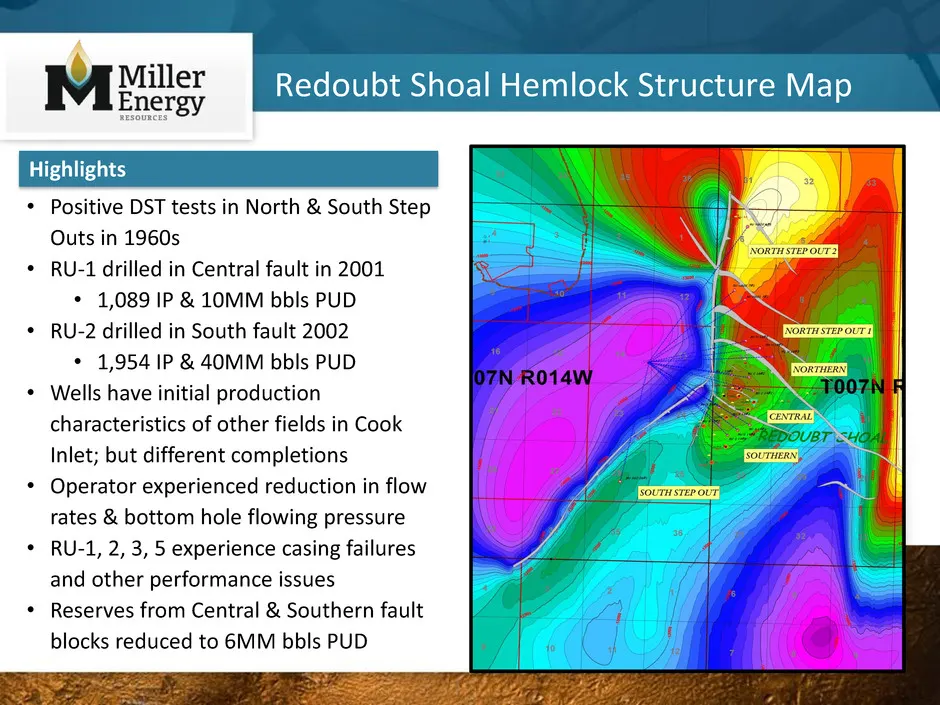
Slide 9: Redoubt Shoal Hemlock Structure Map Highlights
• Positive DST tests in North & South Step Outs in 1960s • RU-1 drilled in Central fault in 2001 • 1,089 IP & 10MM bbls PUD • RU-2 drilled in South fault 2002 • 1,954 IP & 40MM bbls PUD • Wells have initial production characteristics of other fields in Cook Inlet; but different completions • Operato
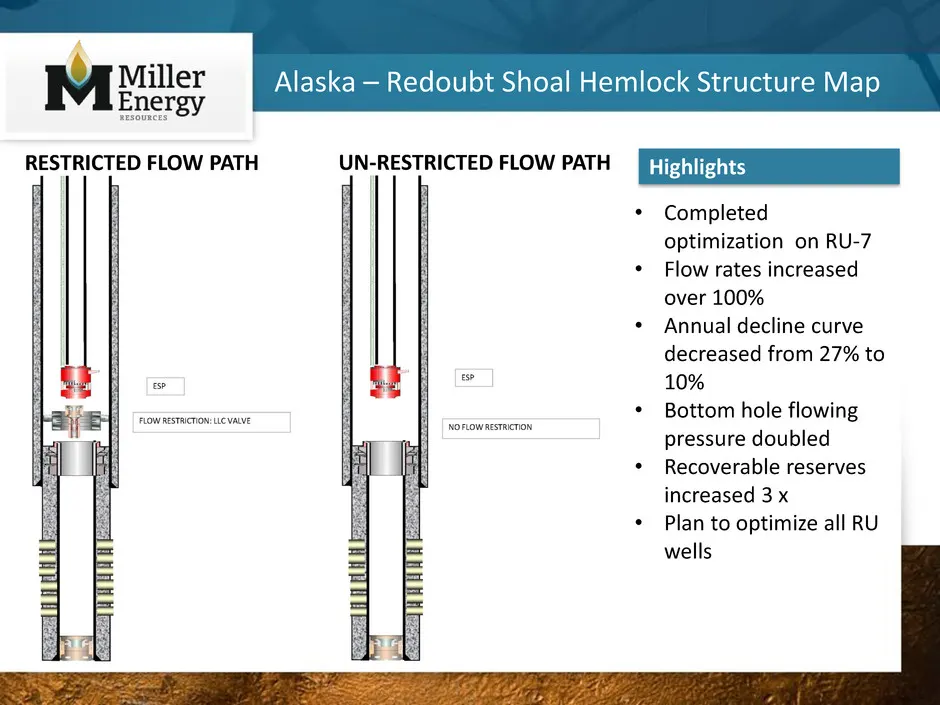
Slide 10: Alaska – Redoubt Shoal Hemlock Structure Map
Alaska – Redoubt Shoal Hemlock Structure Map RESTRICTED FLOW PATH UN-RESTRICTED FLOW PATH • Completed optimization on RU-7 • Flow rates increased over 100% • Annual decline curve decreased from 27% to 10% • Bottom hole flowing pressure doubled • Recoverable reserves increased 3 x • Plan to optimize
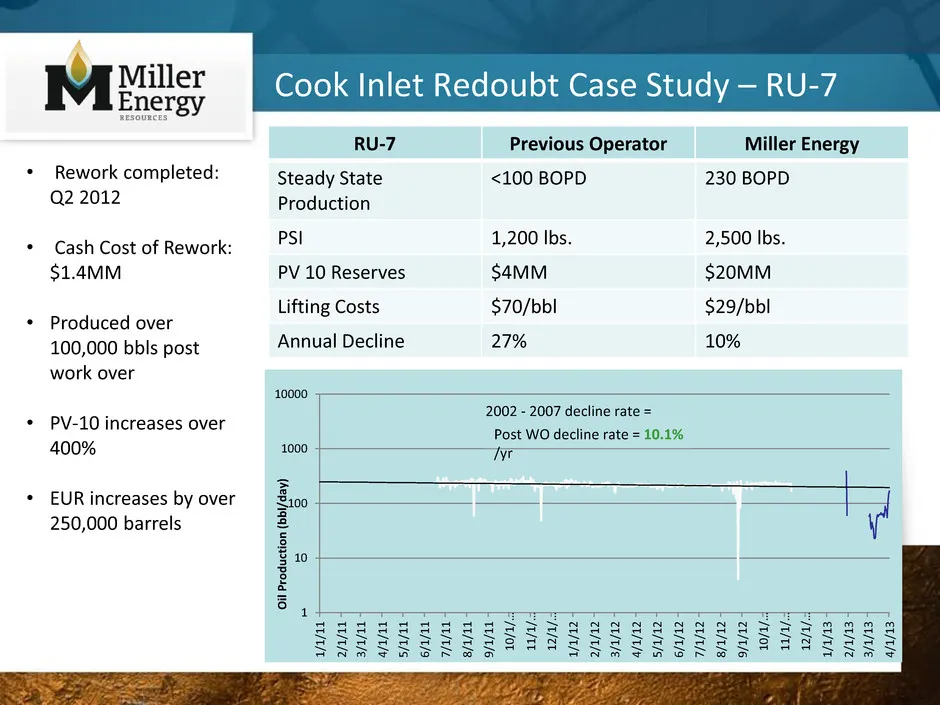
Slide 11: Cook Inlet Redoubt Case Study – RU-7
Cook Inlet Redoubt Case Study – RU-7 RU-7 Previous Operator Miller Energy Steady State Production <100 BOPD 230 BOPD PSI 1,200 lbs. 2,500 lbs. PV 10 Reserves $4MM $20MM Lifting Costs $70/bbl $29/bbl Annual Decline 27% 10% • Rework completed: Q2 2012 • Cash Cost of Rework: $1.4MM • Produced over 100,
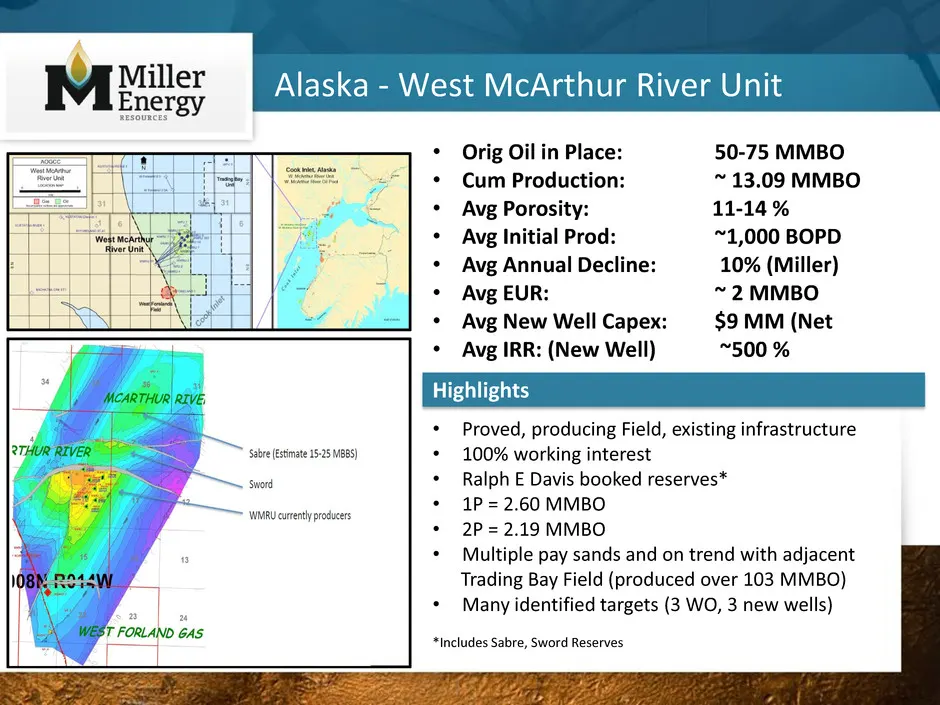
Slide 12: Alaska - West McArthur River Unit
• Orig Oil in Place: 50-75 MMBO • Cum Production: ~ 13.09 MMBO • Avg Porosity: 11-14 % • Avg Initial Prod: ~1,000 BOPD • Avg Annual Decline: 10% (Miller) • Avg EUR: ~ 2 MMBO • Avg New Well Capex: $9 MM (Net • Avg IRR: (New Well) ~500 % • Proved, producing Field, existing infrastructure • 100% workin
Slide 13: Production Scenario Matrix
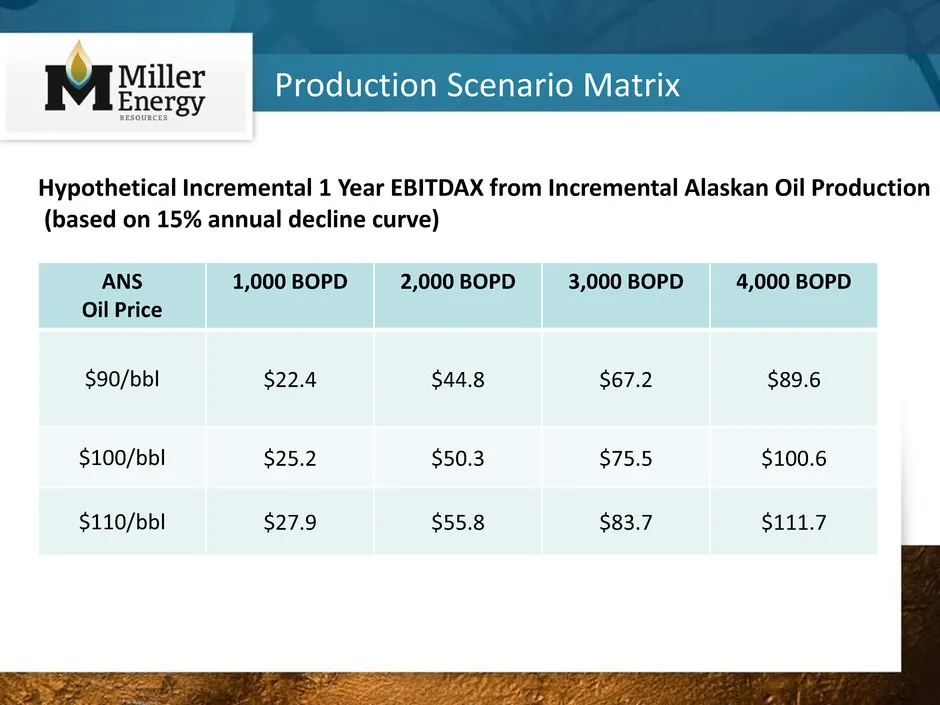
Production Scenario Matrix ANS Oil Price 1,000 BOPD 2,000 BOPD 3,000 BOPD 4,000 BOPD $90/bbl $22.4 $44.8 $67.2 $89.6 $100/bbl $25.2 $50.3 $75.5 $100.6 $110/bbl $27.9 $55.8 $83.7 $111.7 Hypothetical Incremental 1 Year EBITDAX from Incremental Alaskan Oil Production (based on 15% annual decline curve)
Slide 14: Undervalued Stock
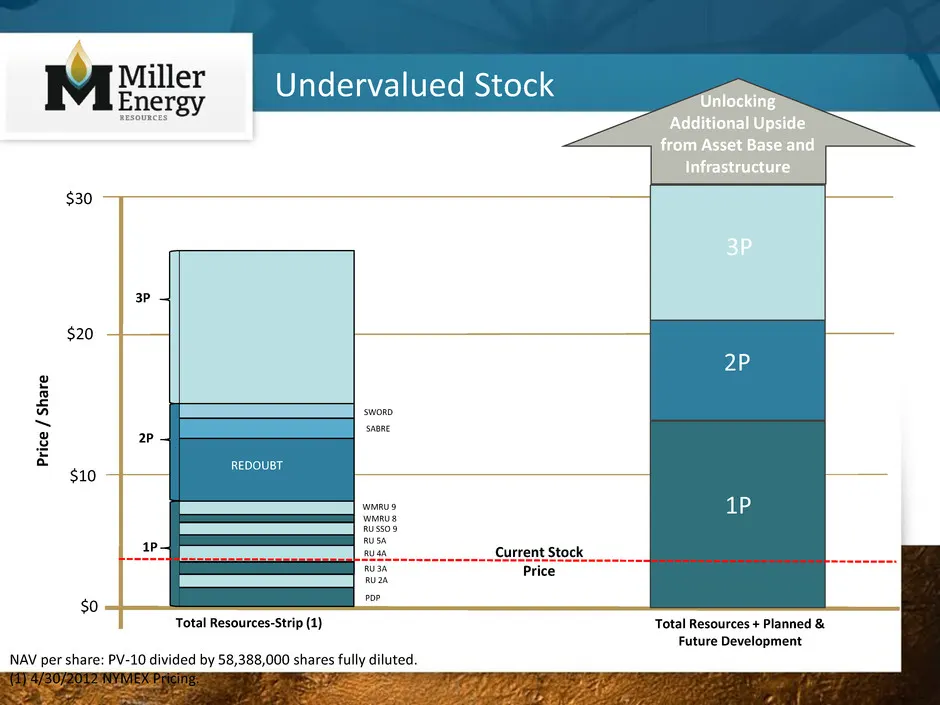
Undervalued Stock NAV per share: PV-10 divided by 58,388,000 shares fully diluted. (1) 4/30/2012 NYMEX Pricing. Current Stock Price $0 $10 $20 P ri ce / Sha re Total Resources-Strip (1) Total Resources + Planned & Future Development 3P $30 SABRE 1P 2P 1P 2P PDP RU 2A RU 3A RU 5A RU SSO 9 WMRU 8 REDO
Slide 15: Strengthening Capital Position
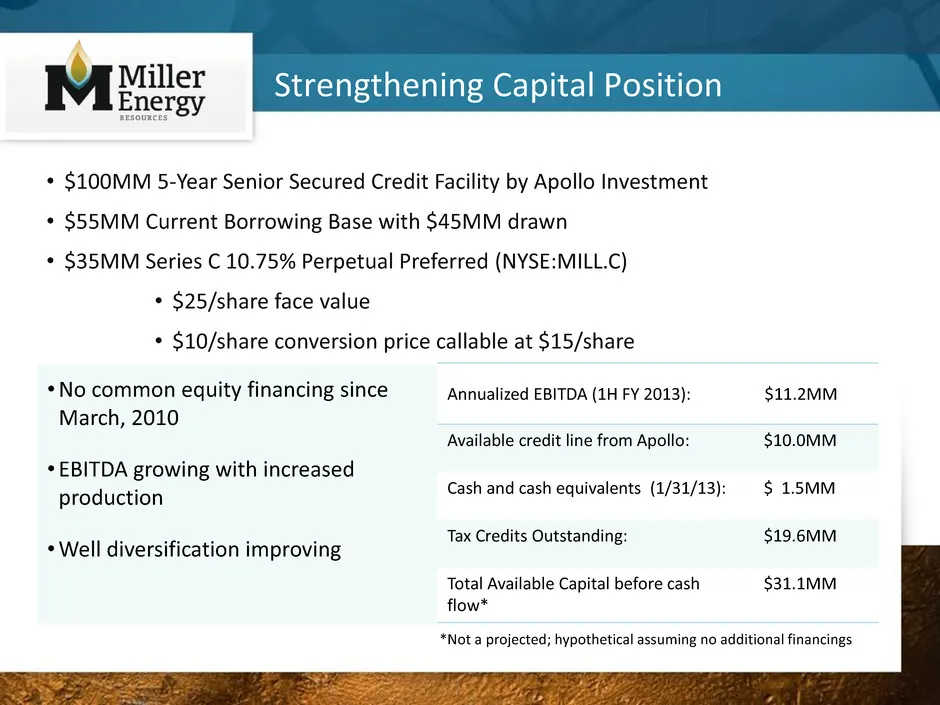
Strengthening Capital Position •No common equity financing since March, 2010 • EBITDA growing with increased production •Well diversification improving Annualized EBITDA (1H FY 2013): $11.2MM Available credit line from Apollo: $10.0MM Cash and cash equivalents (1/31/13): $ 1.5MM Tax Credits Outstand
Slide 16: Investment Summary
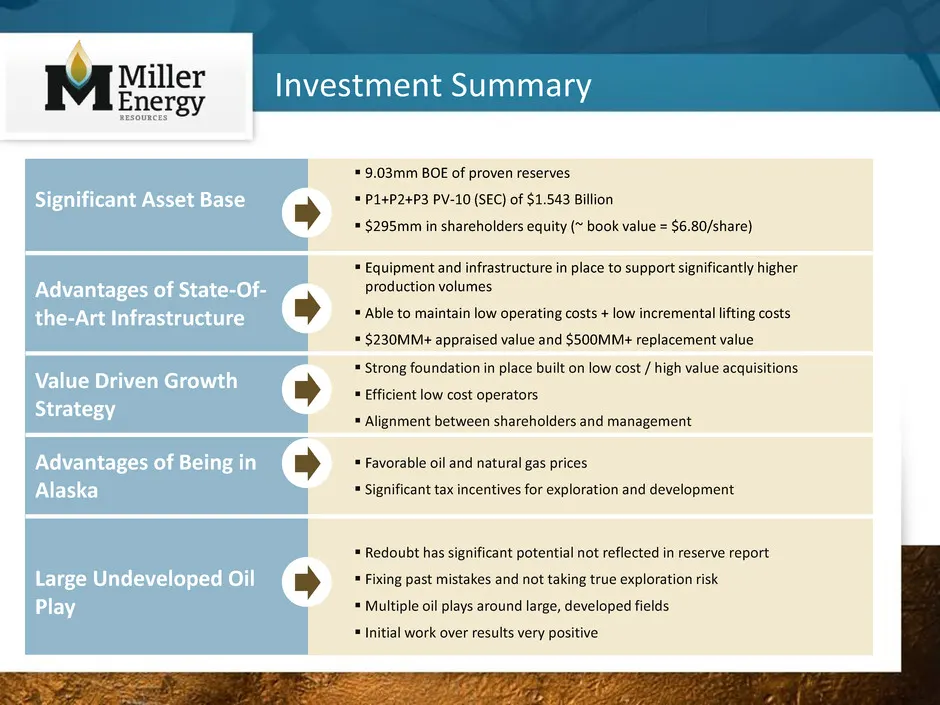
Investment Summary Significant Asset Base 9.03mm BOE of proven reserves P1+P2+P3 PV-10 (SEC) of $1.543 Billion $295mm in shareholders equity (~ book value = $6.80/share) Advantages of State-Of- the-Art Infrastructure Equipment and infrastructure in place to support significantly higher produ
Source: SEC EDGAR · 8-K filed Apr 15, 2013
More decks from Miller Energy Resources Inc
 Investor Presentation (March 2015)31 slides · Mar 19, 2015
 IPAA OGIS Florida 201519 slides · Feb 3, 2015
 Investor Presentation (December 2014)25 slides · Dec 19, 2014
 Investor Presentation (December 2014)23 slides · Dec 16, 2014
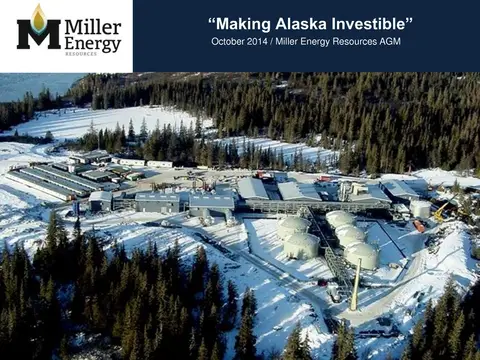 Shareholder Meeting (October 2014)21 slides · Oct 30, 2014
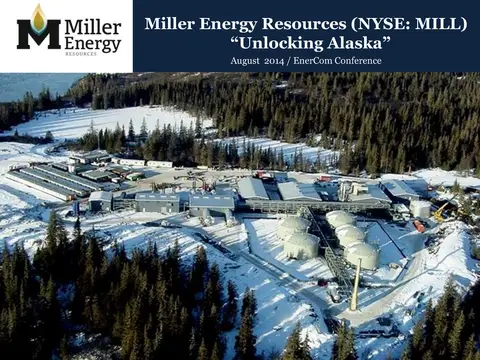 EnerCom Conference 201426 slides · Aug 20, 2014