INX — Q1 2009 Earnings Presentation
25 slides from INX's earnings presentation, May 4, 2009
Slide 1: Preliminary Financial Results, Quarter Ended March 31, 2009
Preliminary Financial Results 1 st Quarter Ended March 31, 2009 INX Inc. Nasdaq: INXI www.INXI.com May 4, 2009 Investor Call 1. Brian Fontana: Financial results 2. Mark Hilz: Operations update, vision and strategy 3. Jim Long: Business trends and outlook 4. Take questions Agenda:
Slide 2: GAAP Reconciliation and Forward-Looking Statements Safe Harbor
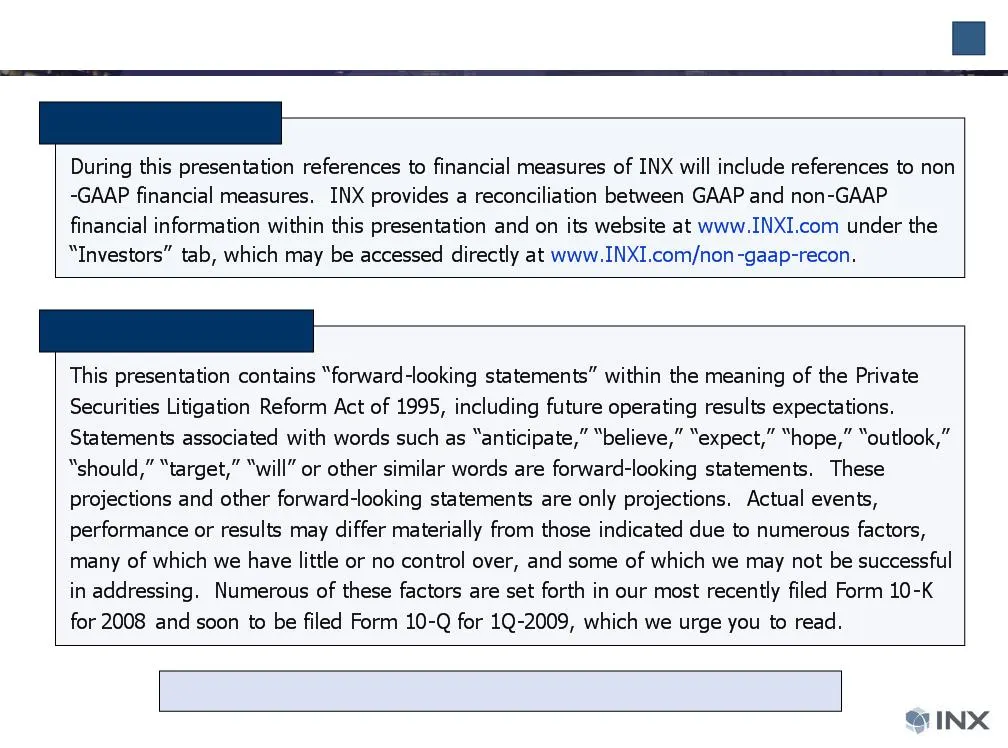
2 GAAP Reconciliation Safe Harbor Statement GAAP Reconciliation and Forward-Looking Statements All financial results shown are for continuing operations unless otherwise noted
Slide 3: Q1 Accomplishments
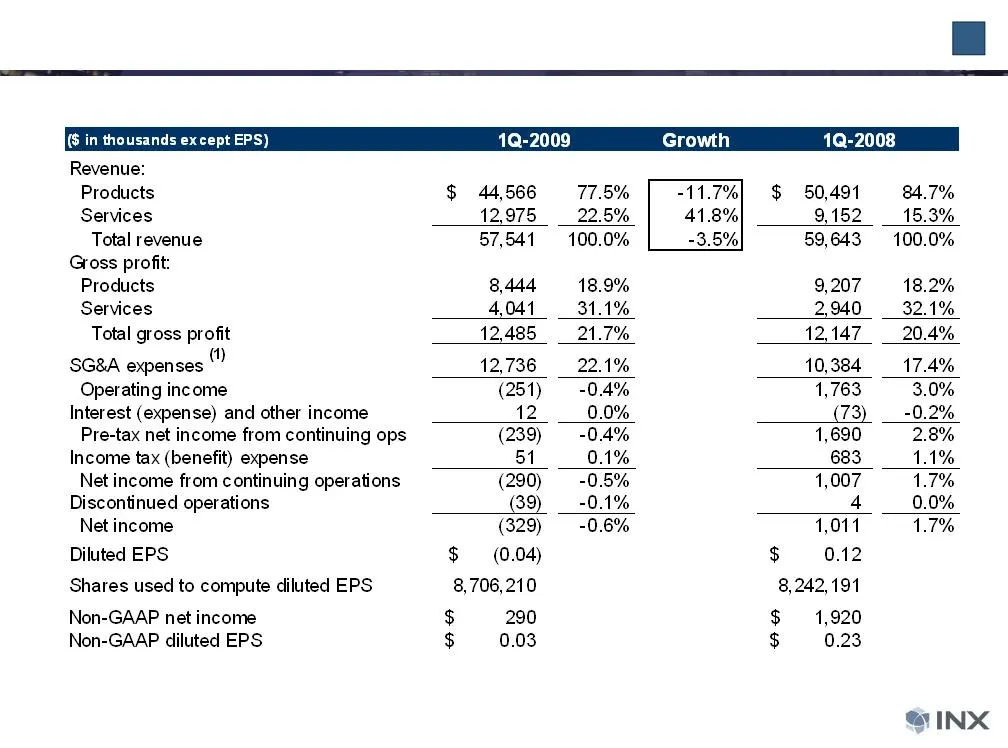
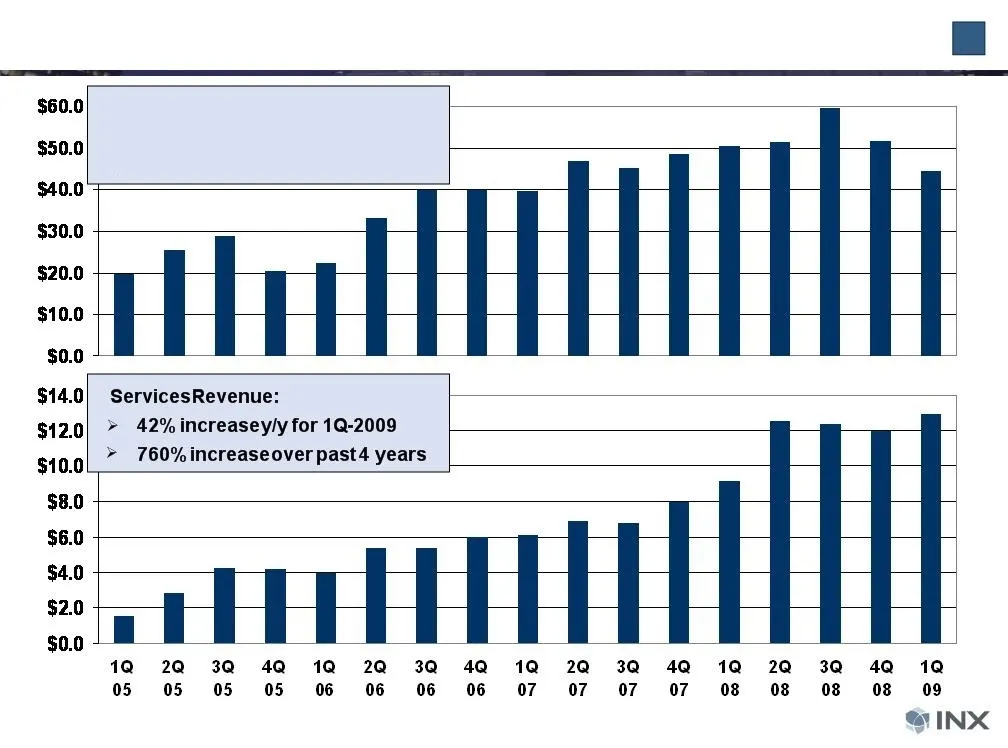
3 Q1 Accomplishments Achieved revenue slightly above the mid-point of our range of guidance Service revenue grew 42% y/y to record quarterly level: Professional services growth: 44% y/y Managed services growth: 30% y/y Gross profit margin percentage rose to record 21.7% Gross profit dollars rose 3%

Slide 4: Brian Fontana, Vice President & CFO
Brian Fontana Vice President & CFO
Slide 5: First Quarter Operating Results
5 First Quarter Operating Results
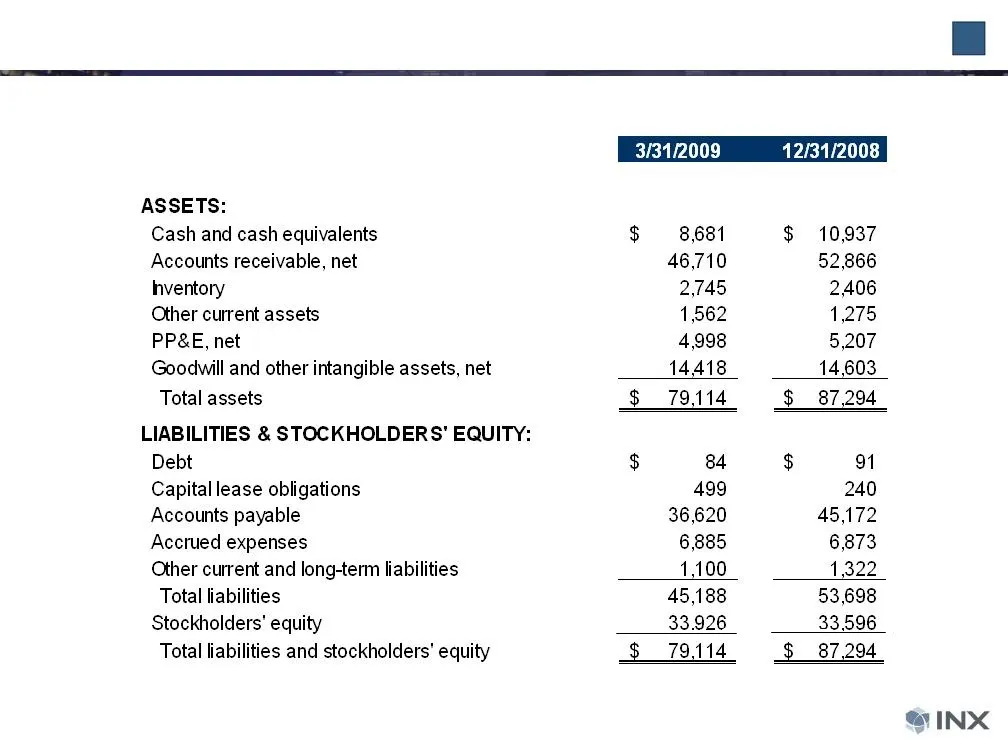
Slide 6: Balance Sheet Data
6 Balance Sheet Data (dollars in thousands)
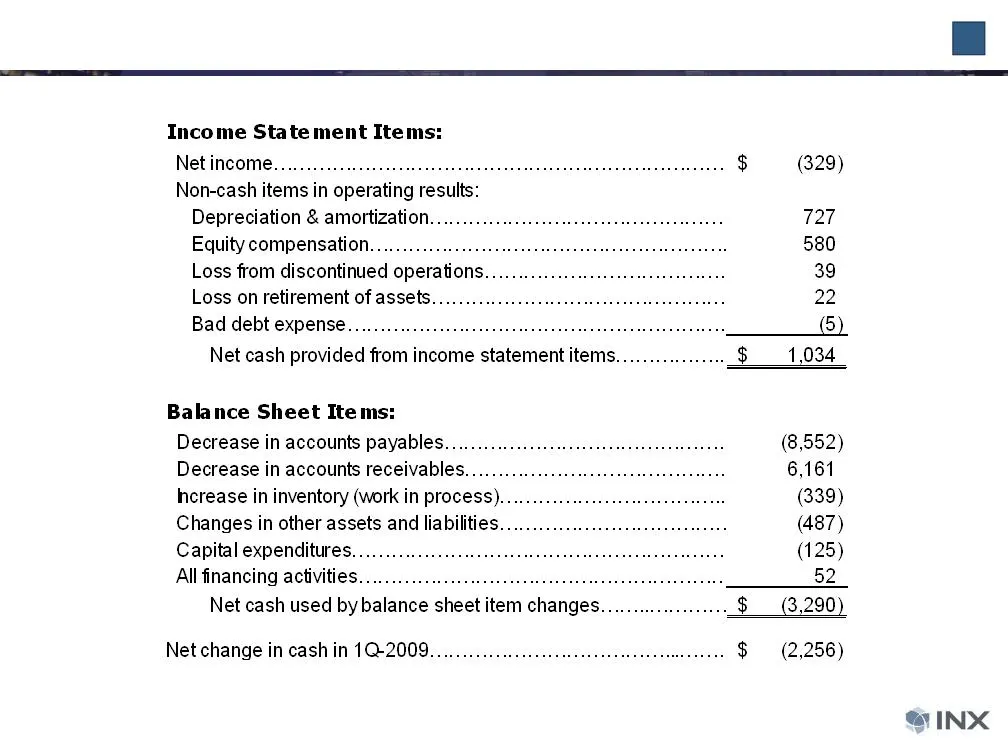
Slide 7: Summary of Change in Net Cash in 1Q-2009
7 Summary Of Change In Net Cash In 1Q-2009 (dollars in thousands)
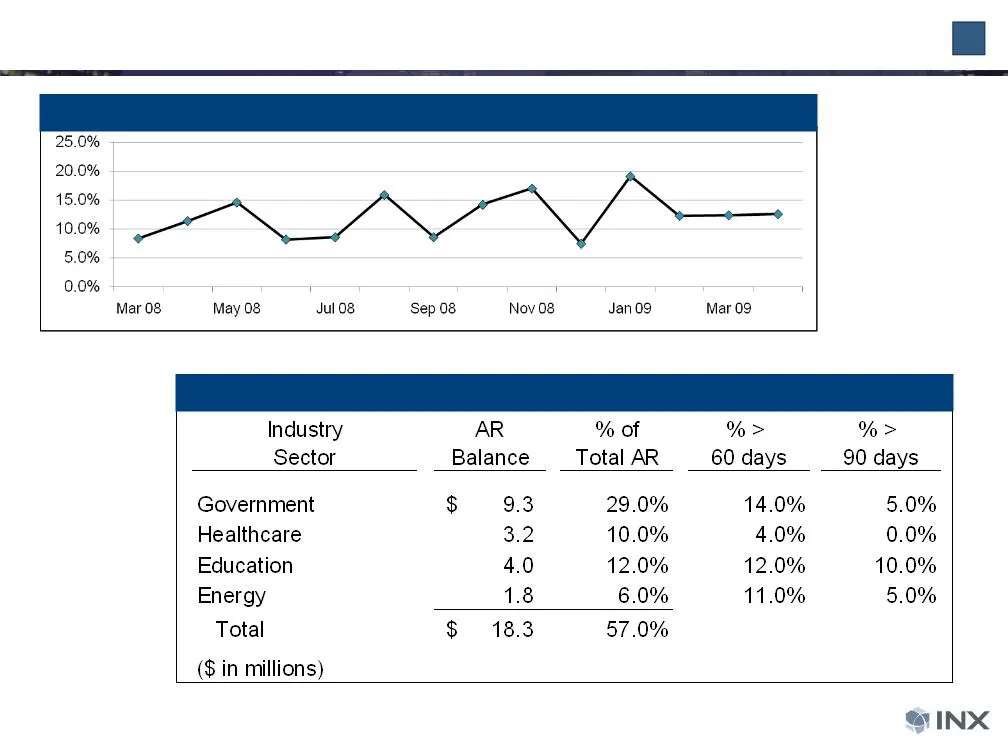
Slide 8: Accounts Receivable Quality
8 % of Total A/R Aged Over 60 Days At Month End Through April 2009 Primary Industry Sector A/R Accounts Receivable Quality

Slide 9: Mark Hilz, President & COO
Mark Hilz President & COO
Slide 10: INX Operations Update
10 INX Operations Update Aggressively managed costs during Q1 and will continue to do so as the economy improves Continuing to enhance our voice practice with the upcoming expansion of capabilities in our enterprise call center practice Focused on enhancing our security practice especially in our fe
Slide 11: Cloud Computing: The Coming Transformation in the Enterprise Data Center
11 “Cloud Computing” The Coming Transformation In The Enterprise Data Center VMware creates software that allows the creation of virtual servers in a data center rather than all servers being physical servers. This technology enables huge advantages for flexibility and cost efficiency in the data ce
Slide 12: The Total Market and INX's Position Within It
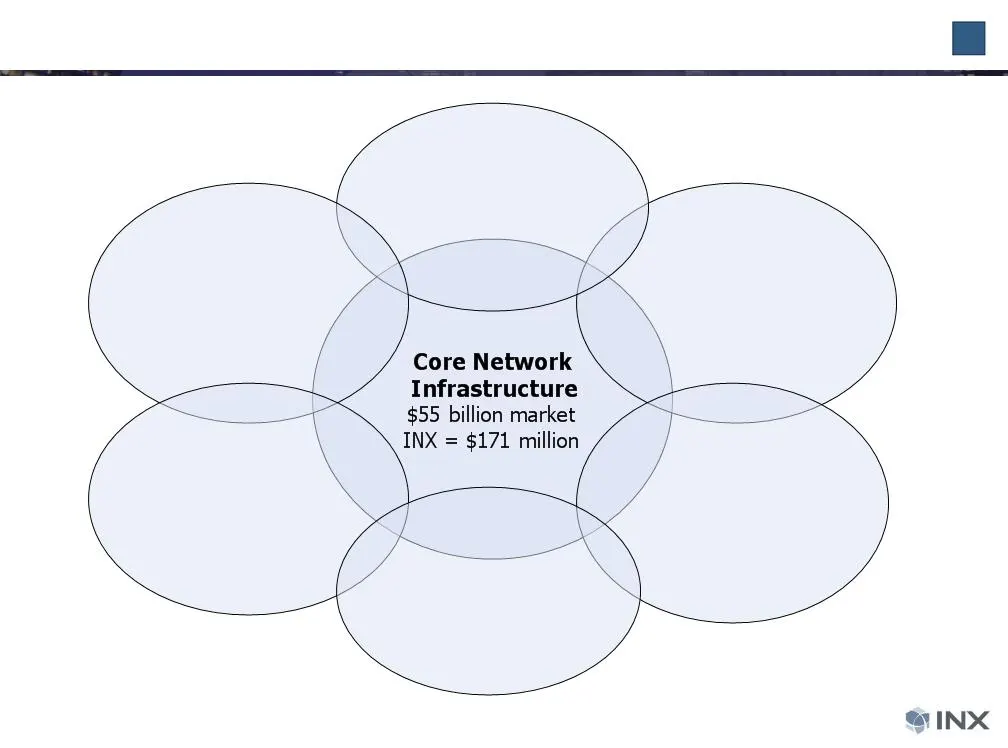
12 The Total Market And INX’s Position Within It Wireless Networking $3 billion market INX = $13 million Unified Communications $9 billion market INX = $43 million Security $8 billion market INX = $17 million Virtualization $2 billion market INX = $3 million Data Center Servers $50 billion market IN
Slide 13: INX Is Focused on Key Areas of Enterprise Technology
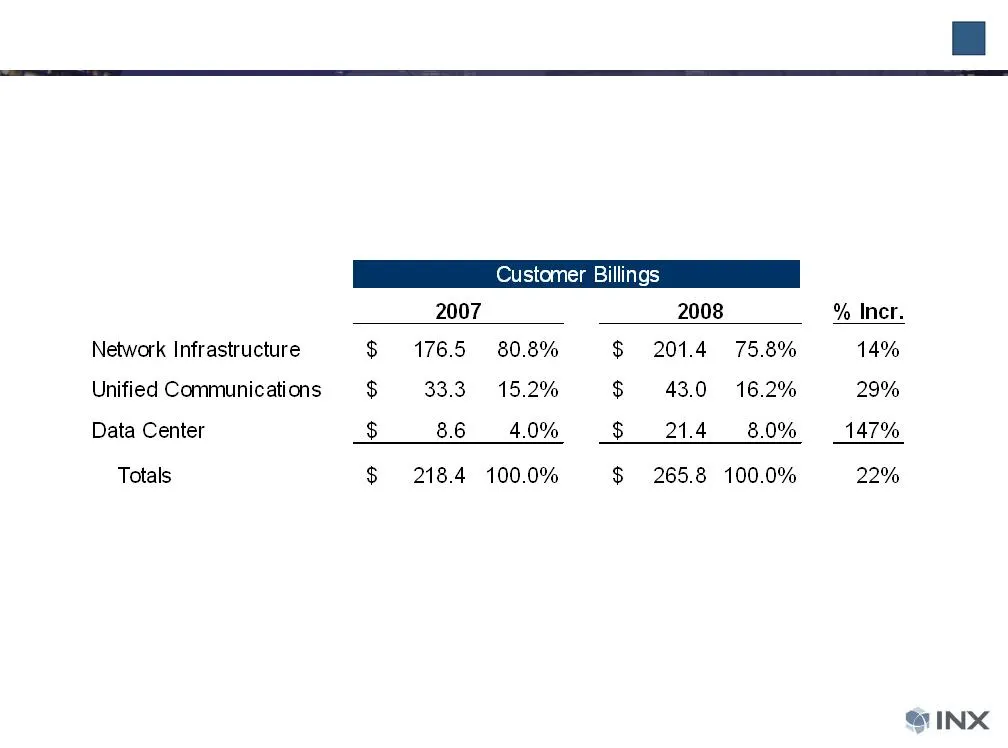
13 INX Is Focused On 3 Key Areas Of Enterprise Technology (dollars in millions) Today INX is a provider of “enterprise technology infrastructure solutions” with offerings in three key interrelated areas of enterprise technology:
Slide 14: Capacity to Grow Newer Technology Offerings
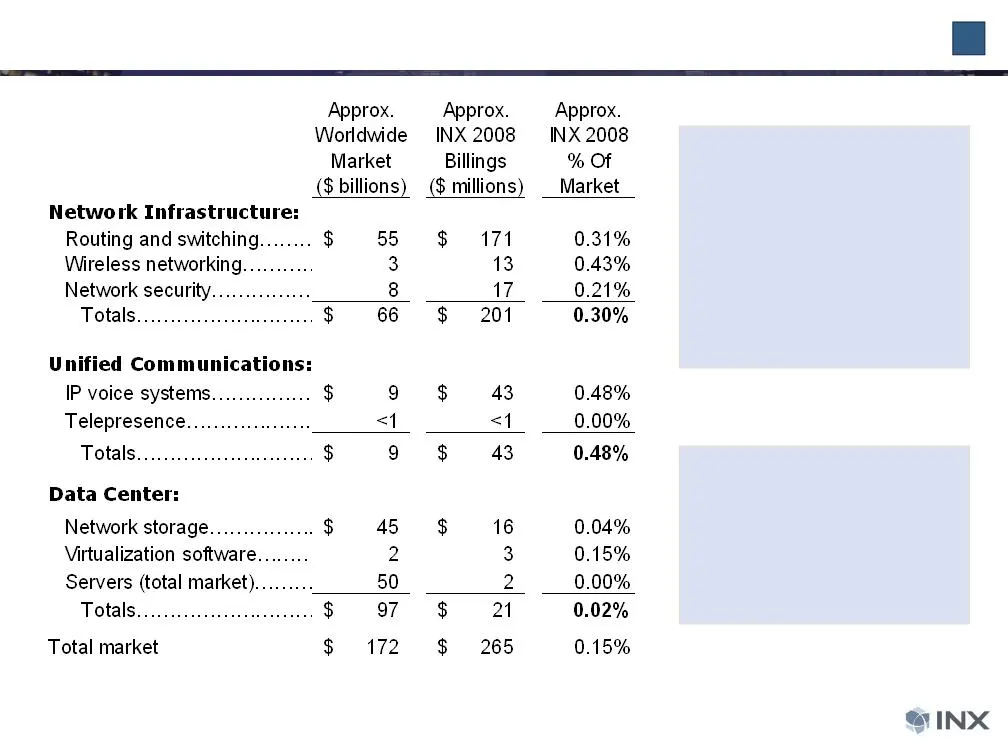
14 Capacity To Grow Newer Technology Offerings Market size source: IDC; VMware, based on end-user product revenues only, excluding services; INX billings is products only Because video systems and data center solutions are more recent additions to INX’s offerings, there is better growth potential fo
Slide 15: INX's Opportunity Around Cloud Computing
15 INX’s opportunity around Cloud Computing The new enterprise data center will require solutions integrators to be able to architect a complete data center with a cloud computing strategy in mind. This means the solutions integrator must be capable of designing all elements of the data center, incl

Slide 16: Jim Long, Chairman & CEO
Jim Long Chairman & CEO
Slide 17: Total Revenue
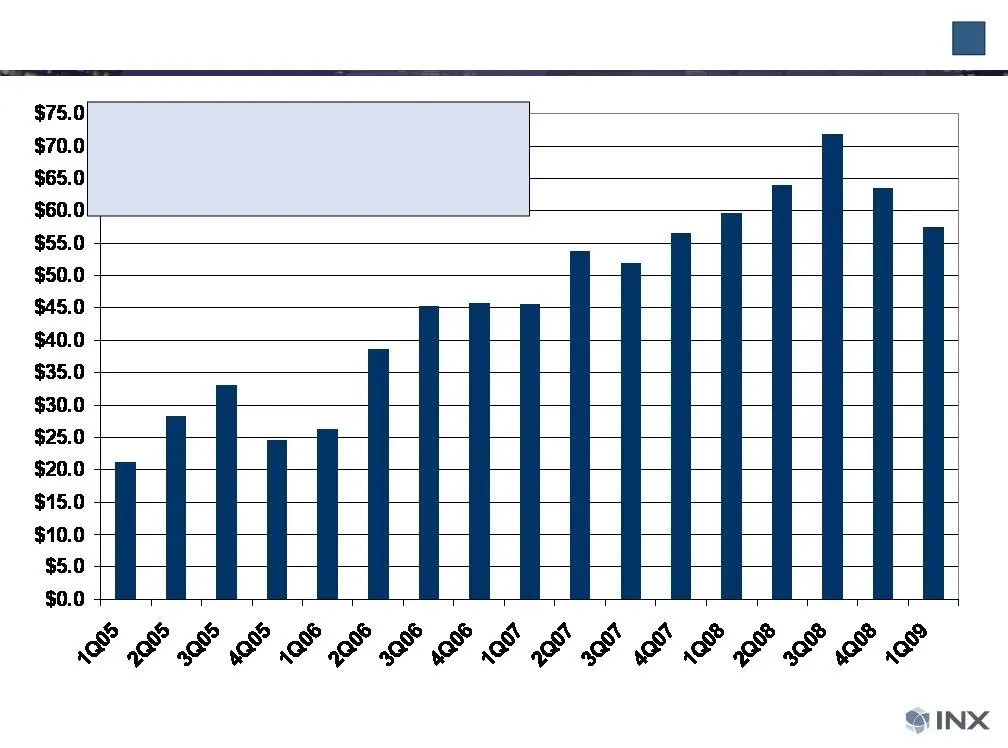
17 Total Revenue (Dollars in millions) Ø 20% decrease from 3Q-2008 peak Ø 3.5% decrease y/y Ø 170% increase over past 4 years
Slide 18: Services Revenue Outperformance
18 Services Revenue Outperformance (Dollars in millions) Product Revenue: Ø 12% decrease y/y for 1Q-2009 Ø 125% increase over past 4 years
Slide 19: Services Revenue Outperformance Results in Improving Gross Margin
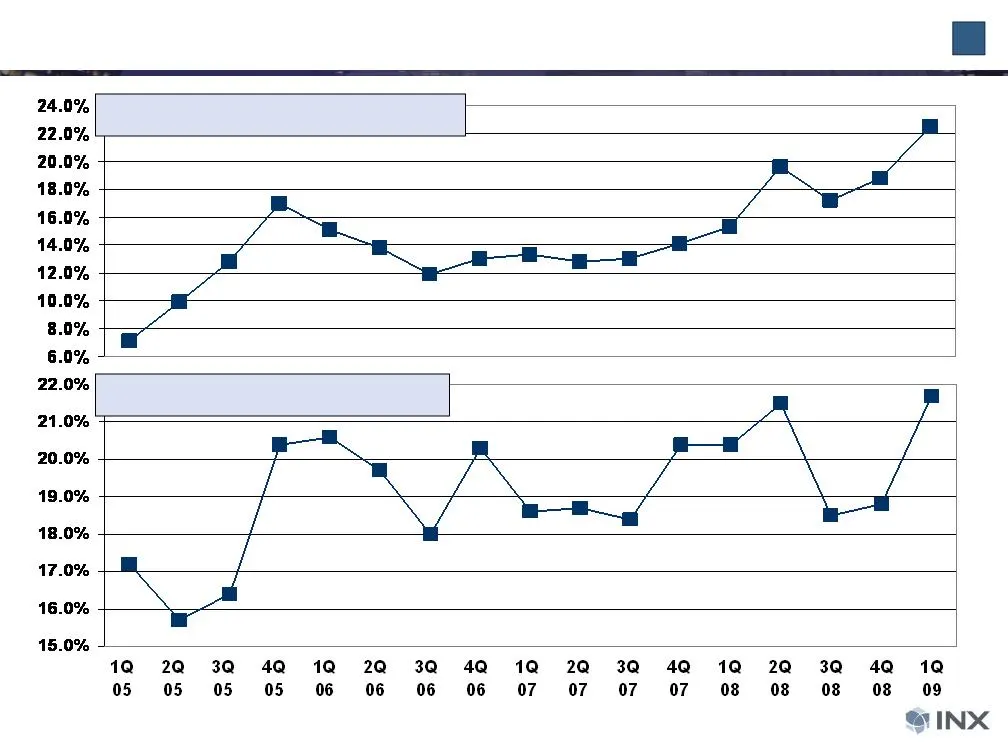
19 Services Revenue Outperformance Results In Improving Gross Margin (Dollars in millions) Gross Margin On Total Revenue Service Revenue % of Total Revenue
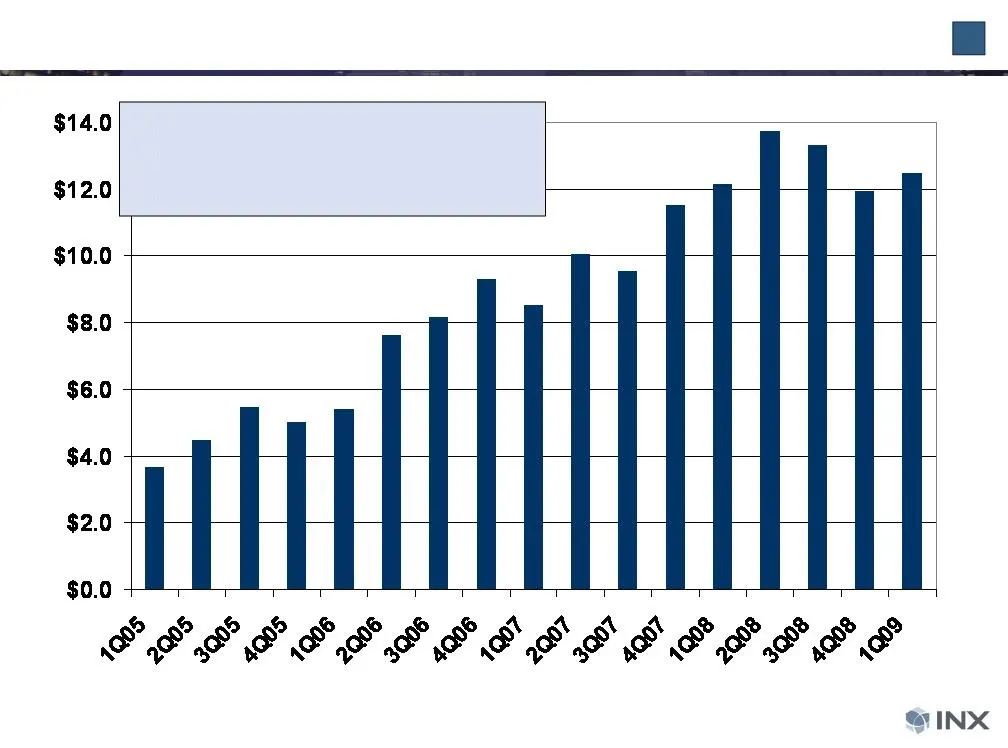
Slide 20: Gross Profit on Total Revenue
20 Gross Profit On Total Revenue (Dollars in millions) Ø 9% decrease from 3Q-2008 peak Ø 3% increase y/y Ø 240% increase over past 4 years
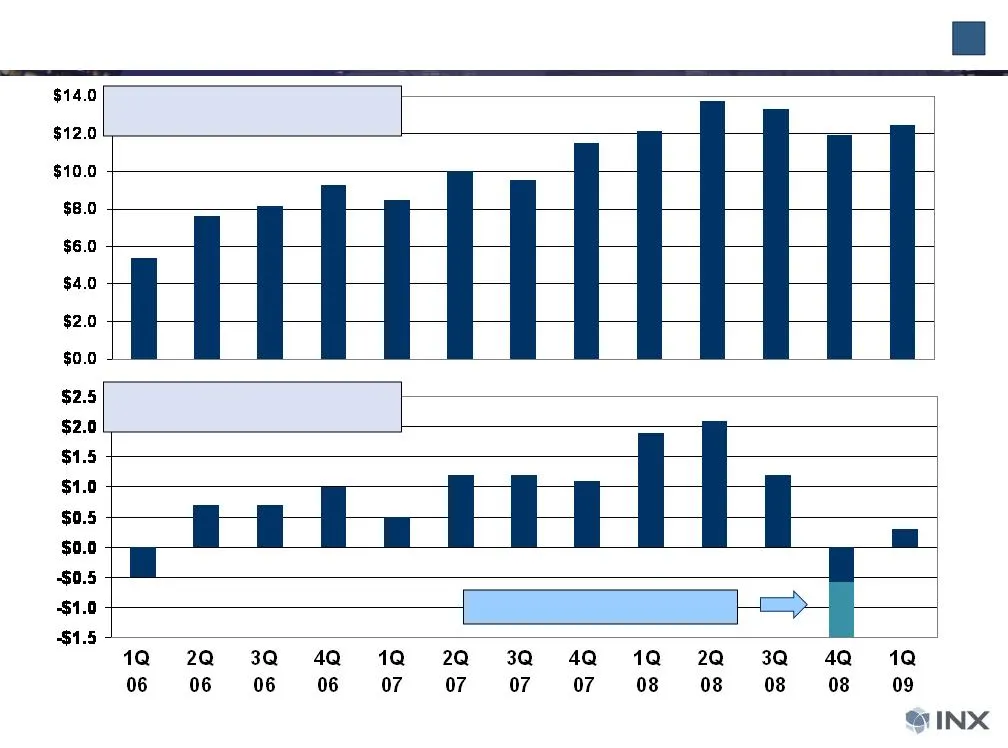
Slide 21: Gross Profit & Non-GAAP Net Income
21 Gross Profit & Non-GAAP Net Income (Dollars in millions) Gross Profit Non-GAAP Net Income $0.9 million of unusual expenses
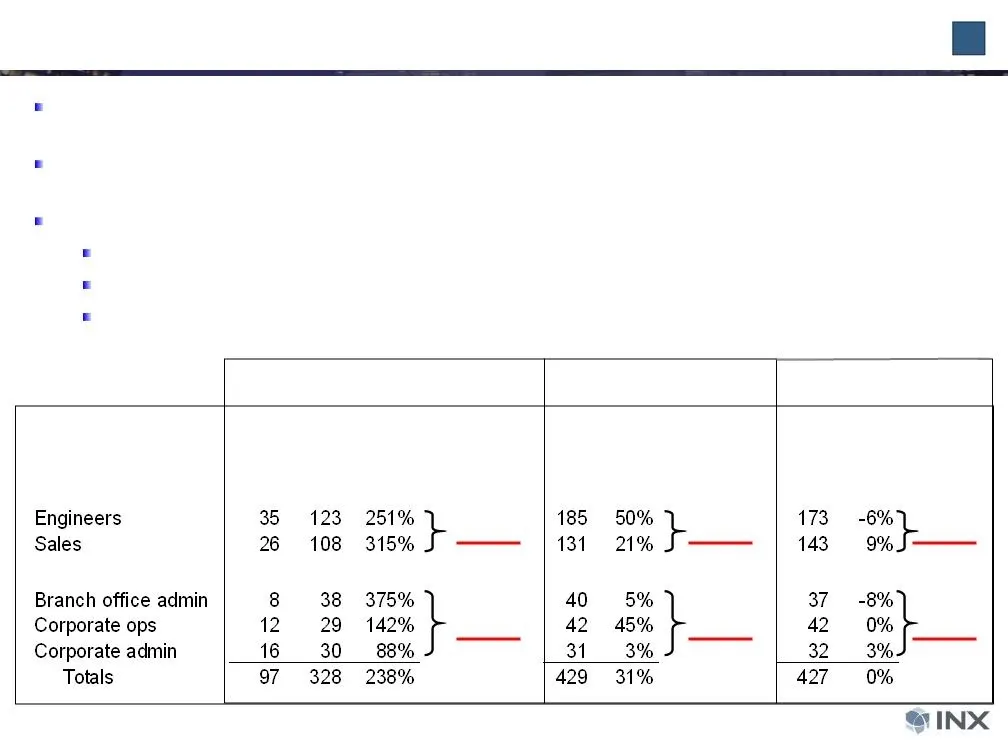
Slide 22: Staffing Trends - Key to Both Growth and Improving Margins
22 Staffing Trends - Key To Both Growth and Improving Margins Dec 31, 2004 +169% +279% % Incr. Dec 31, 2008 +16% +37% Q1-2009 Direct employee costs were 68% and 70% of total operating expenses for 2007 and 2008, so leveraging employee costs is key to improving operating profit margin Sales staff and
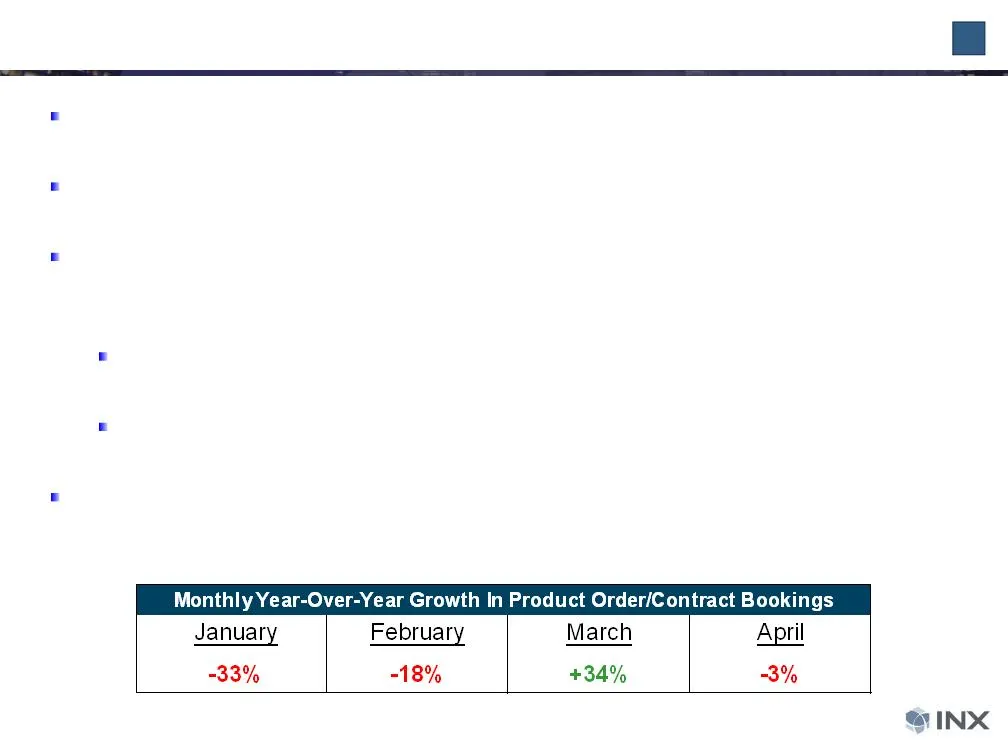
Slide 23: Outlook - General Market Conditions
23 Outlook - - General Market Conditions For the past 18 months enterprise customers have been facing a weak and uncertain economy + difficult credit markets for funding capital expenditures Projects with better ROI have been receiving more attention and many customers are downsizing some of the pro
Slide 24: Outlook - Expectations for 2Q-2009
24 Outlook - - Expectations For 2Q-2009 We are continuing to provide the same guidance we have for the past several years - a range of expected revenue for the current quarter For 2Q-2009 we expect: Ø Total revenue in the range of $56-$60 million compared to prior year period total revenue of $64.0
Slide 25: Summary / Highlights
25 Summary / Highlights Revenue decreased only 3.5% for the quarter in spite of very difficult market conditions, exceeding growth of benchmark technology industry companies 1 st quarter revenue was within our expected range, gross margins were within our target range, and GAAP and Non-GAAP earnings
Source: SEC EDGAR · 8-K filed May 4, 2009
More decks from INX Inc
 Merger or Acquisition (November 2011)10 slides · Nov 1, 2011
 Rodman & Renshaw Global Investment Conference 201120 slides · Sep 13, 2011
 Shareholder Meeting (July 2011)15 slides · Jul 19, 2011
 Q1 2011 Earnings Presentation15 slides · Jul 13, 2011
 FY2010 Earnings Presentation28 slides · Jun 6, 2011
 Corporate Update (November 2010)24 slides · Nov 10, 2010