Western Union Company (the) · NYSE:WU
Western Union Company (the) — The Western Union Company — Q1 2019 Earnings Presentation
26 slides from Western Union Company (the)'s earnings presentation, May 7, 2019

Slide 1: Earnings Webcast & Conference Call
Earnings Webcast & Conference Call May 7, 2019

Slide 2: Mike Salop, SVP Investor Relations
Mike Salop Senior Vice President, Investor Relations 2
Slide 3: Safe Harbor
Safe Harbor This presentation contains certain statements that are forward-looking within the meaning of the Private Securities Litigation Reform Act of 1995. These statements are not guarantees of future performance and involve certain risks, uncertainties and assumptions that are difficult to pred

Slide 4: Hikmet Ersek, President & CEO
Hikmet Ersek President & Chief Executive Officer 4
Slide 5: Overview: First quarter results
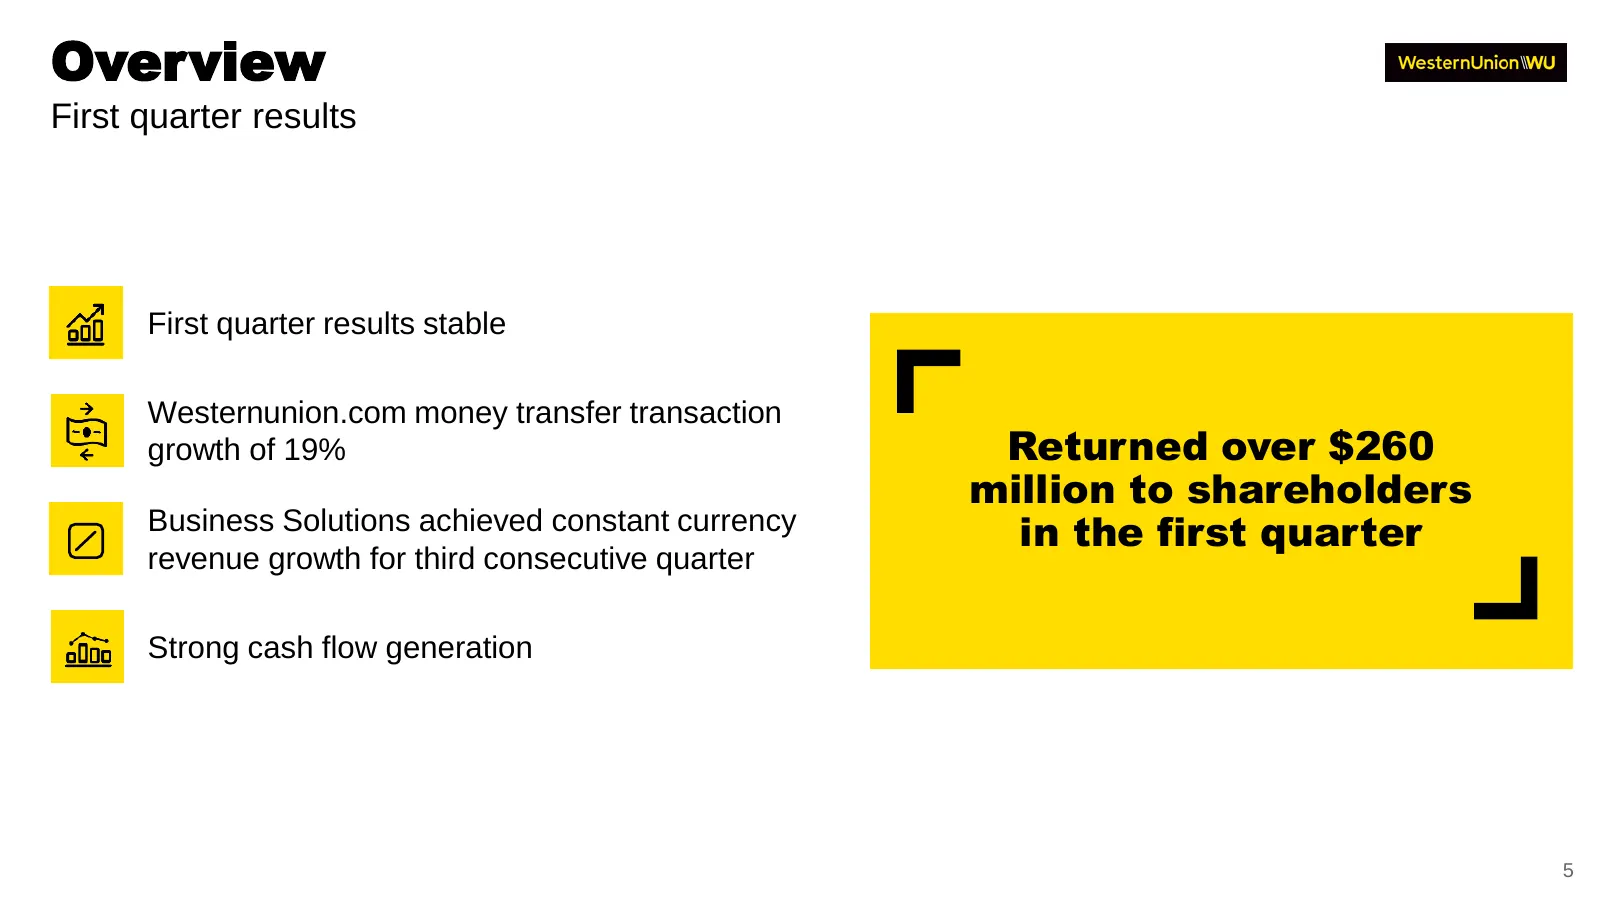
Overview First quarter results First quarter results stable Westernunion.com money transfer transaction growth of 19% Returned over $260 million to shareholders Business Solutions achieved constant currency in the first quarter revenue growth for third consecutive quarter Strong cash flow generation
Slide 6: 2019 Strategic Priorities
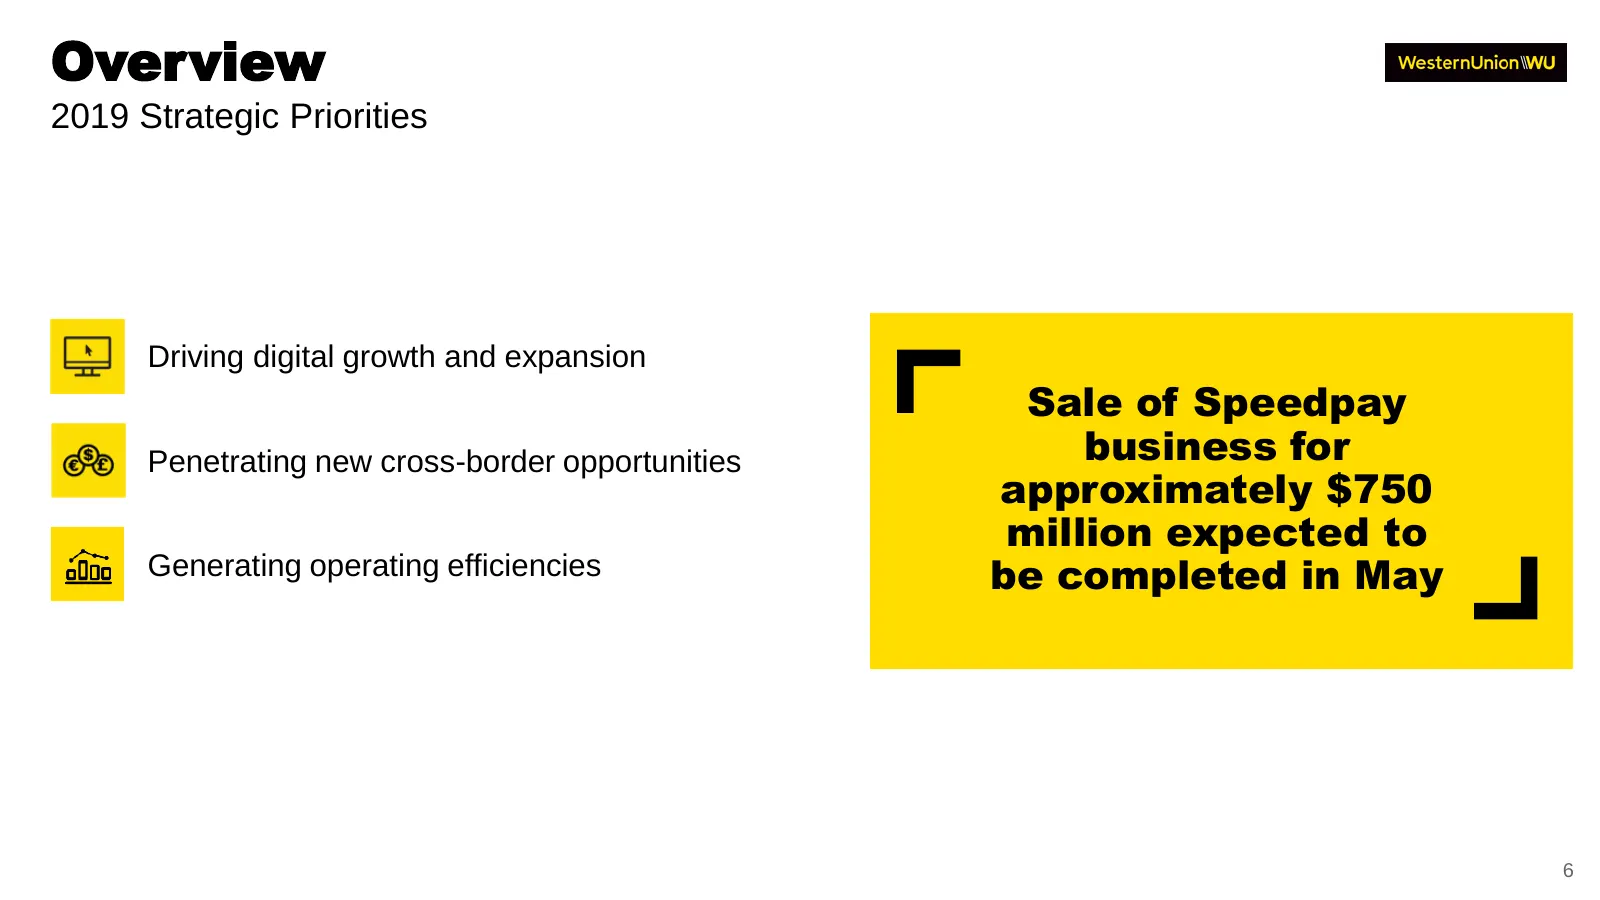
Overview 2019 Strategic Priorities Driving digital growth and expansion Sale of Speedpay Penetrating new cross-border opportunities business for approximately $750 million expected to Generating operating efficiencies be completed in May 6

Slide 7: Raj Agrawal, EVP & Chief Financial Officer
Raj Agrawal Executive Vice President & Chief Financial Officer 7
Slide 8: Revenue Q1
Revenue Q1 Consolidated revenues of $1.3 billion declined 4%, or increased 2% constant currency*, compared to the prior year period *Note: See appendix for reconciliation of Non-GAAP to GAAP financial measures. 8
Slide 9: Consumer-to-Consumer Q1
Consumer-to-Consumer Q1 ▪ 79% of Company revenue ▪ Revenues declined 3%, or were flat constant currency* ▪ Transactions increased 2% ▪ Cross-border principal increased 1%, or 5% constant currency* *Note: See appendix for reconciliation of Non-GAAP to GAAP financial measures. 9
Slide 10: Consumer-to-Consumer by Region Q1 2019
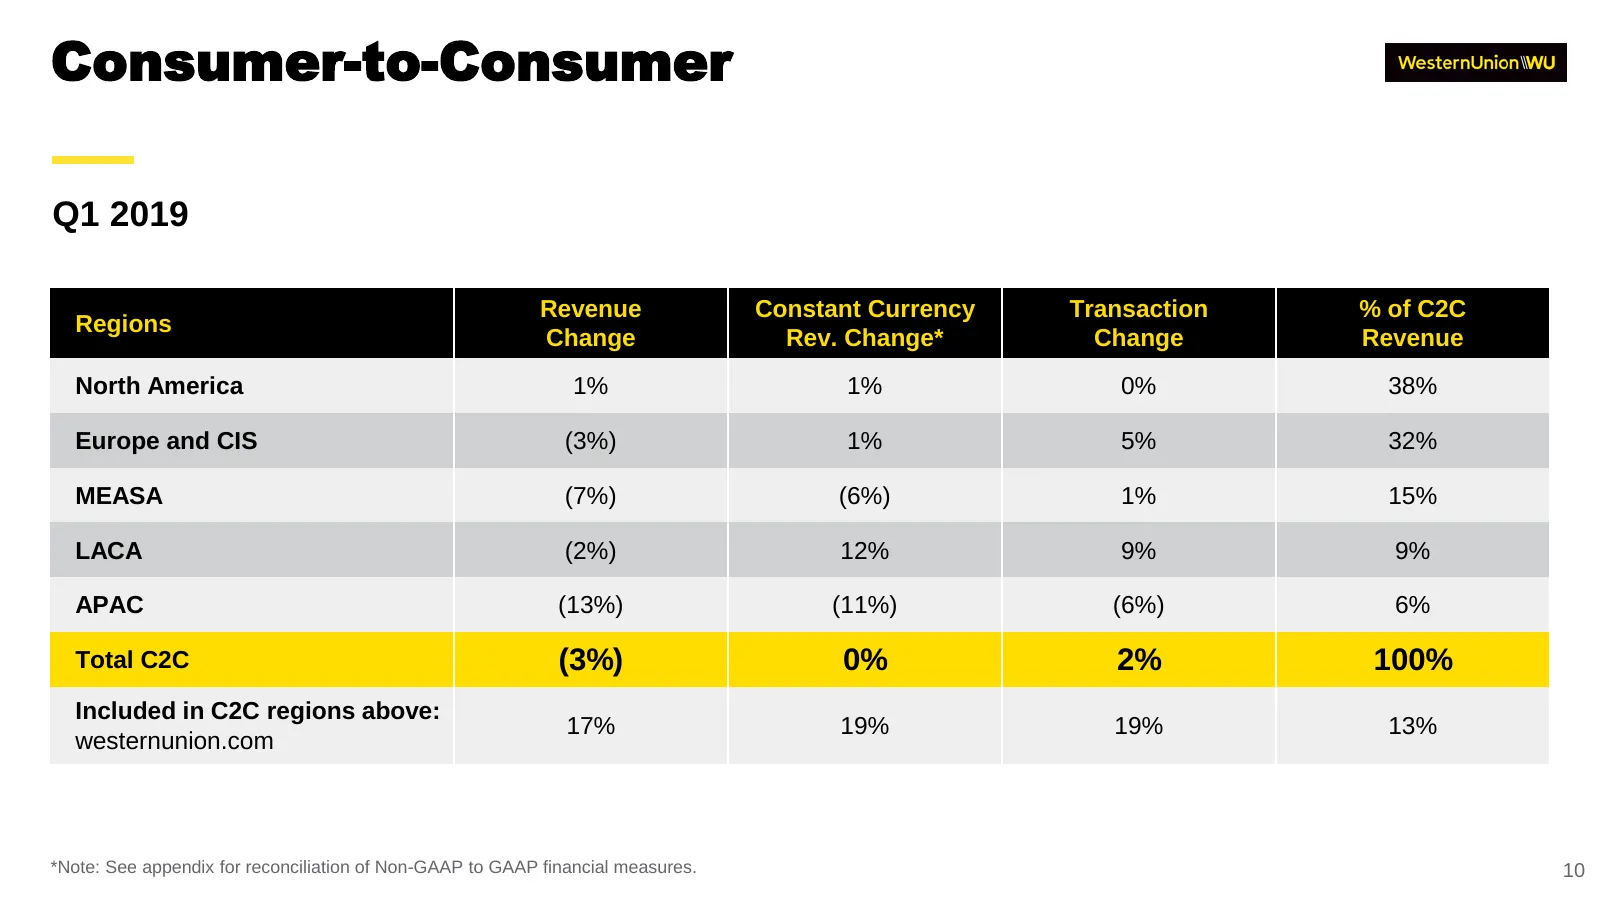
Consumer-to-Consumer Q1 2019 Revenue Constant Currency Transaction % of C2C Regions Change Rev. Change* Change Revenue North America 1% 1% 0% 38% Europe and CIS (3%) 1% 5% 32% MEASA (7%) (6%) 1% 15% LACA (2%) 12% 9% 9% APAC (13%) (11%) (6%) 6% Total C2C (3%) 0% 2% 100% Included in C2C regions above:
Slide 11: Business Solutions and Other Q1
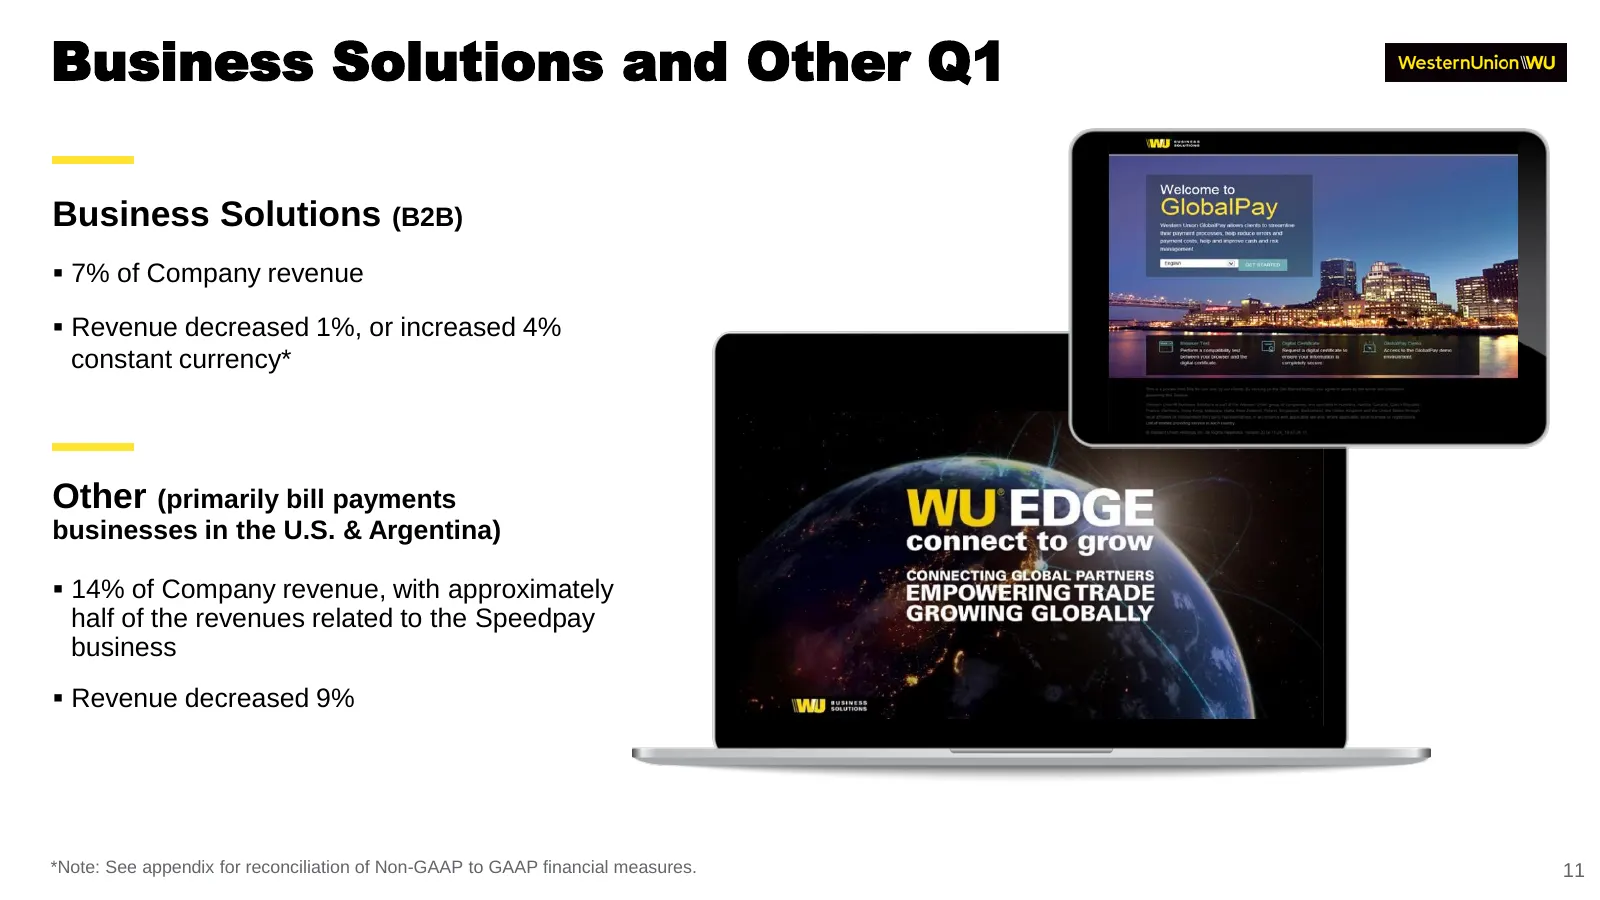
Business Solutions and Other Q1 Business Solutions (B2B) ▪ 7% of Company revenue ▪ Revenue decreased 1%, or increased 4% constant currency* Other (primarily bill payments businesses in the U.S. & Argentina) ▪ 14% of Company revenue, with approximately half of the revenues related to the Speedpay bus
Slide 12: Operating Margin Q1
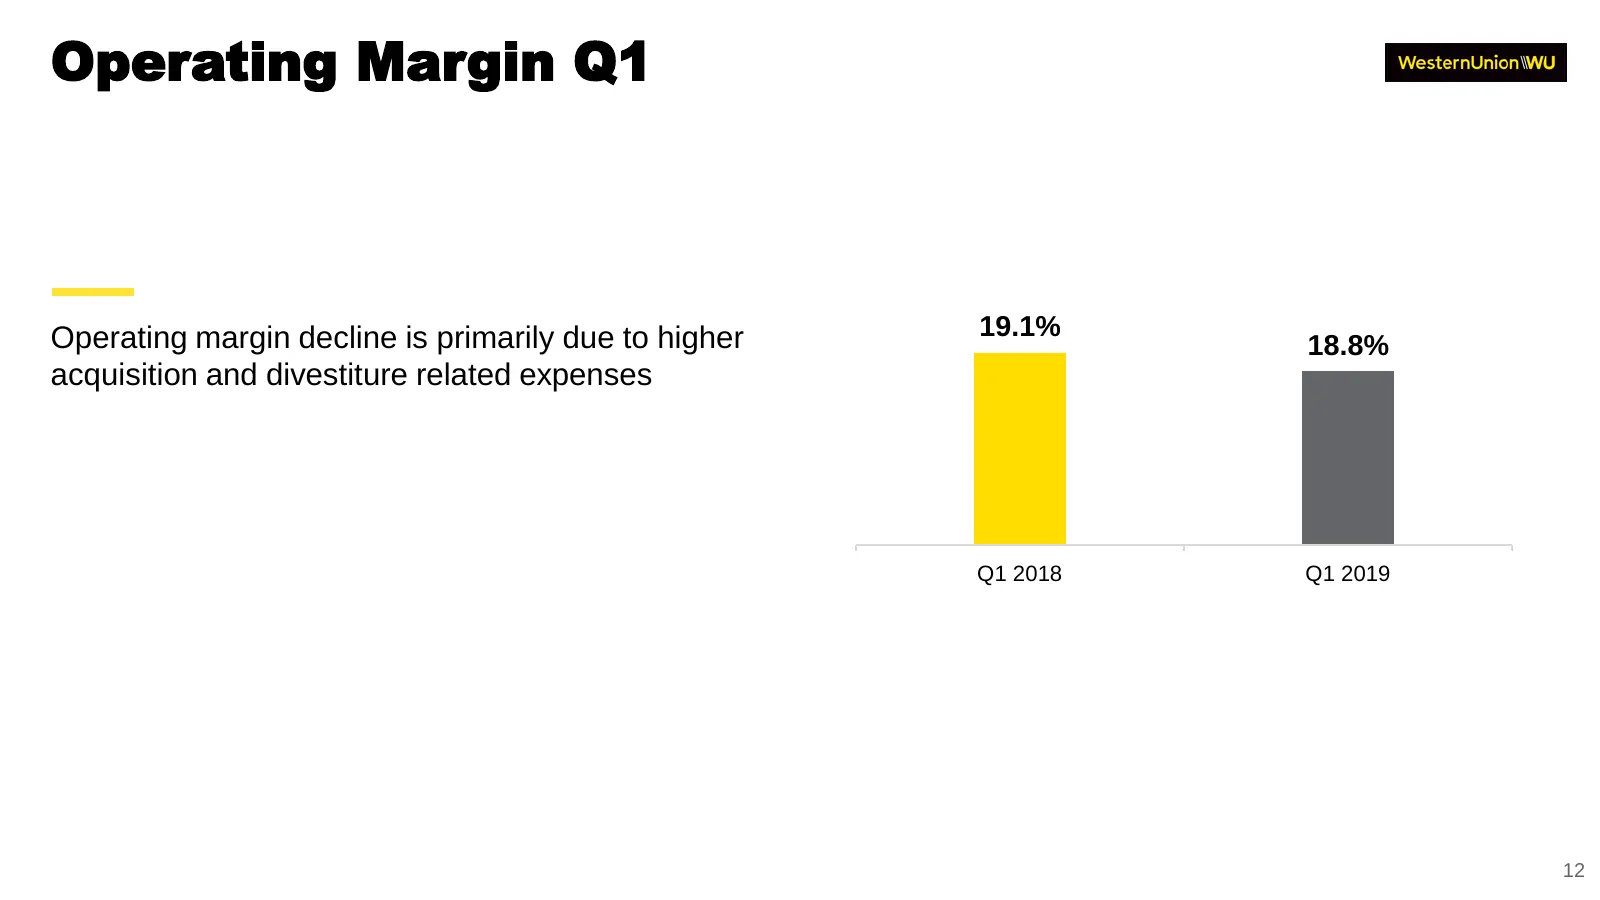
Operating Margin Q1 Operating margin decline is primarily due to higher 19.1% 18.8% acquisition and divestiture related expenses Q1 2018 Q1 2019 12
Slide 13: Other Financial Highlights
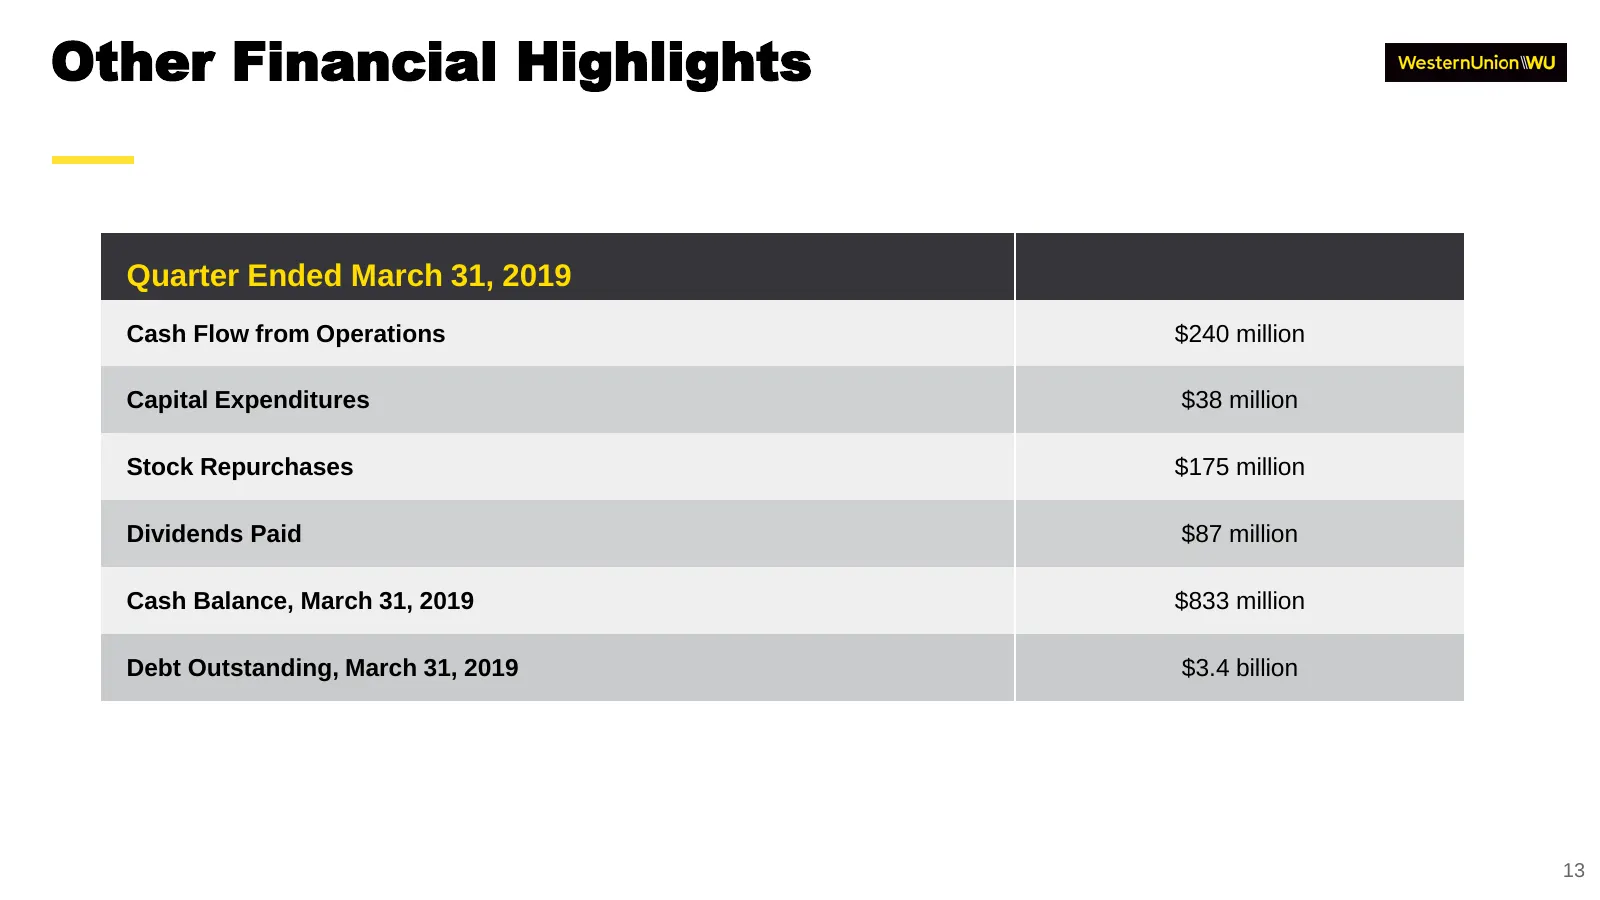
Other Financial Highlights Quarter Ended March 31, 2019 Cash Flow from Operations $240 million Capital Expenditures $38 million Stock Repurchases $175 million Dividends Paid $87 million Cash Balance, March 31, 2019 $833 million Debt Outstanding, March 31, 2019 $3.4 billion 13
Slide 14: Speedpay Transaction
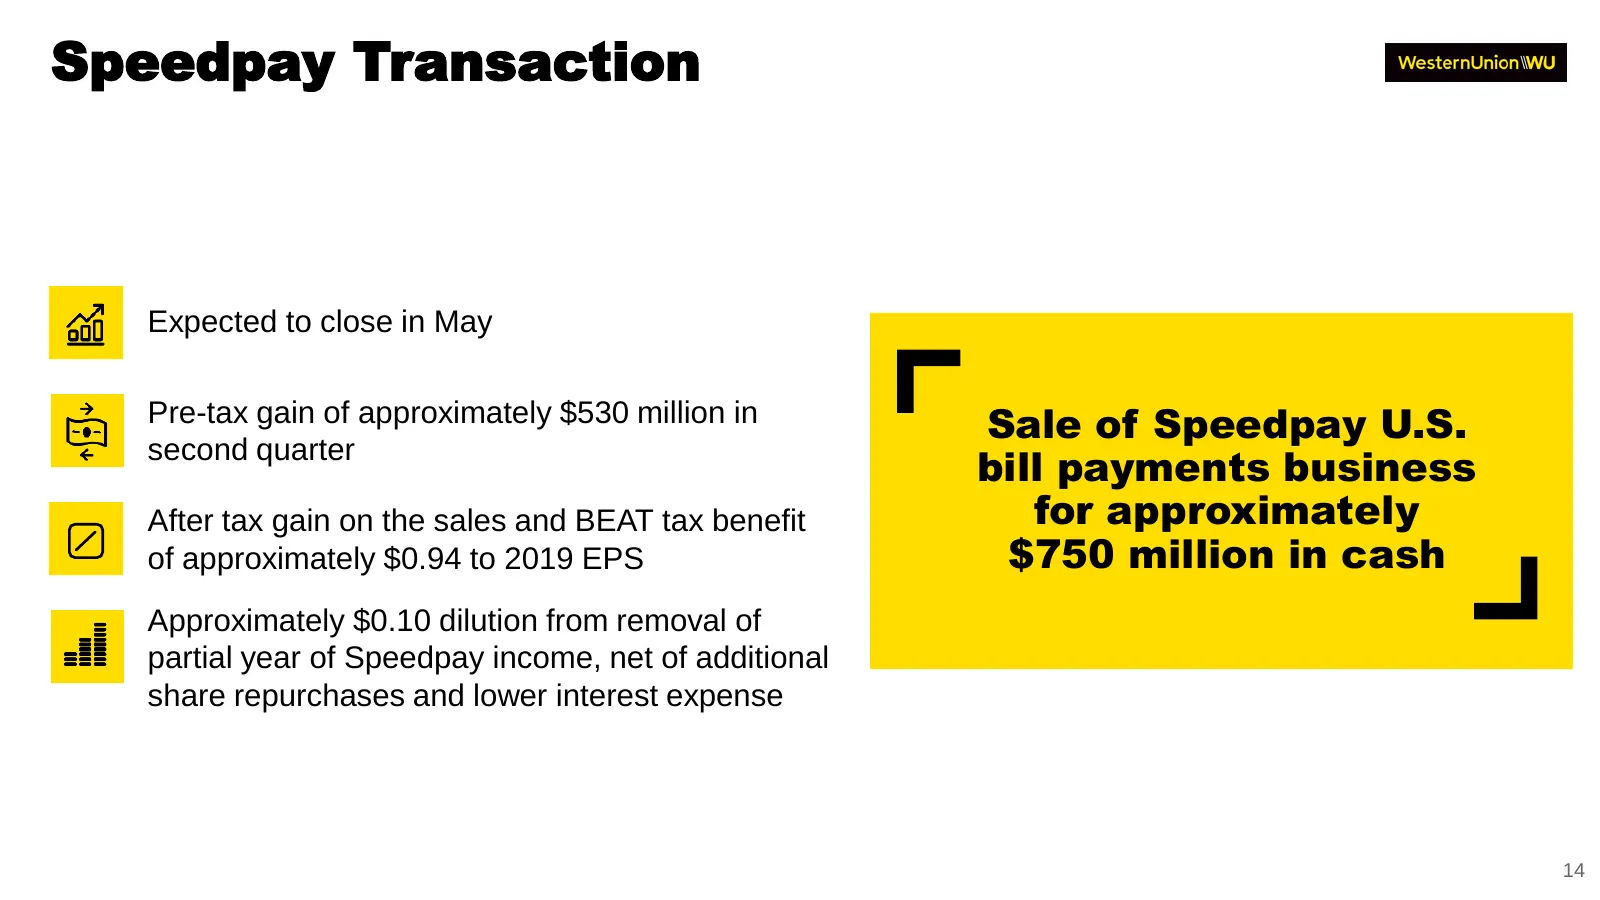
Speedpay Transaction Expected to close in May Pre-tax gain of approximately $530 million in Sale of Speedpay U.S. bill payments business second quarter After tax gain on the sales and BEAT tax benefit for approximately of approximately $0.94 to 2019 EPS $750 million in cash Approximately $0.10 dilut
Slide 15: 2019 Outlook
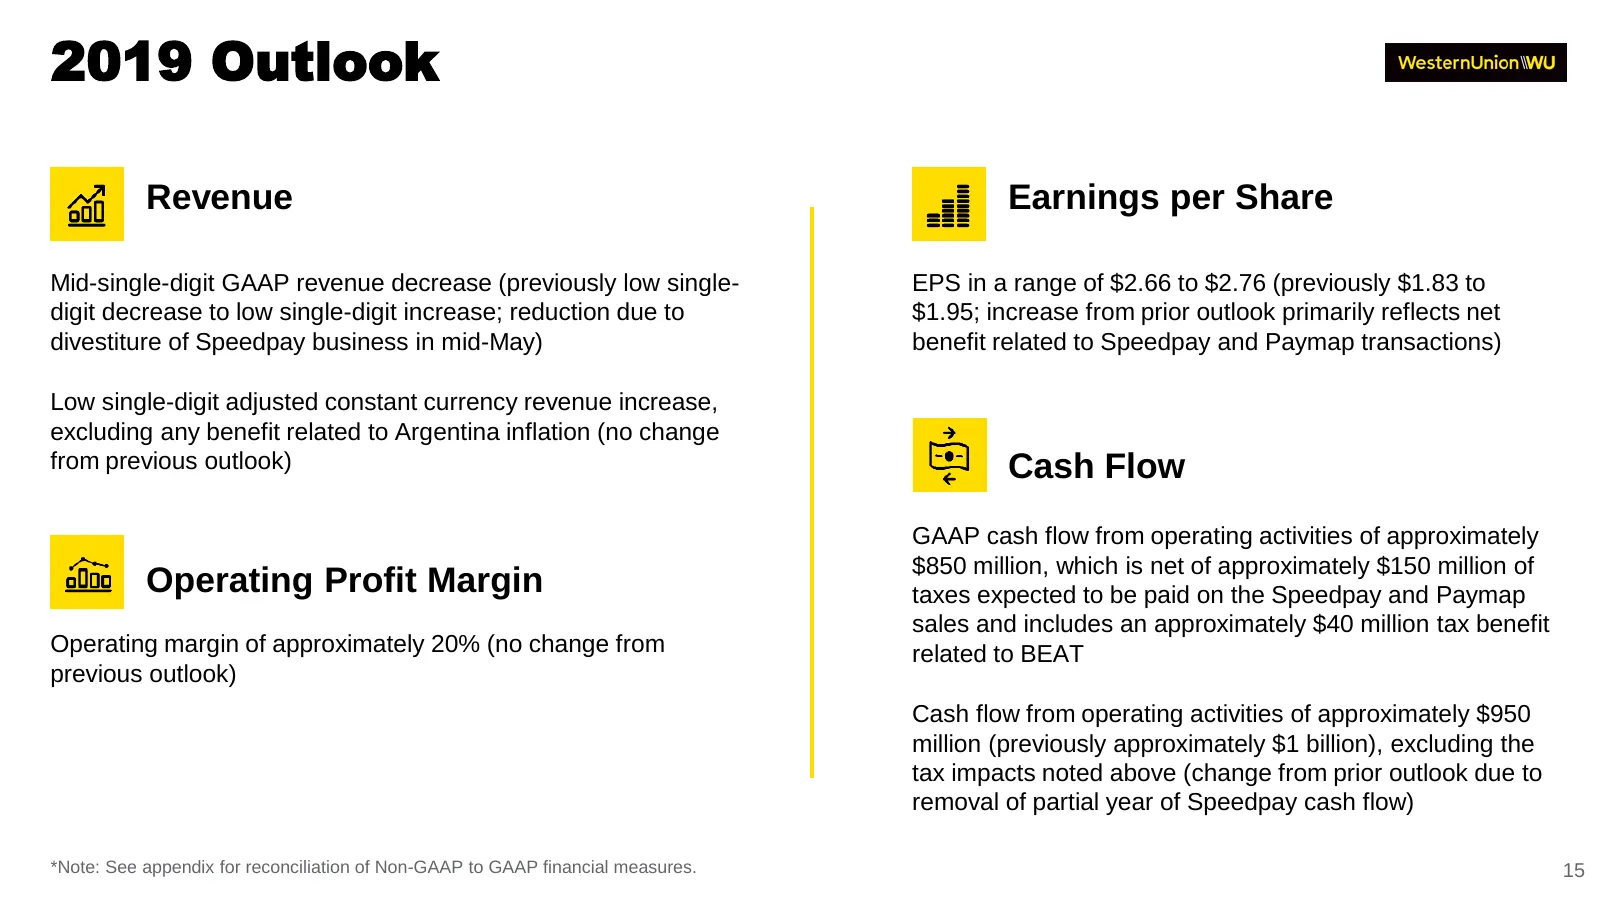
2019 Outlook Revenue Earnings per Share Mid-single-digit GAAP revenue decrease (previously low single- EPS in a range of $2.66 to $2.76 (previously $1.83 to digit decrease to low single-digit increase; reduction due to $1.95; increase from prior outlook primarily reflects net divestiture of Speedpay
Slide 16: Questions and Answers
Questions and Answers 16

Slide 17: Appendix
Appendix First Quarter 2019 Earnings Webcast & Conference Call 17 17
Slide 18: Non-GAAP Measures
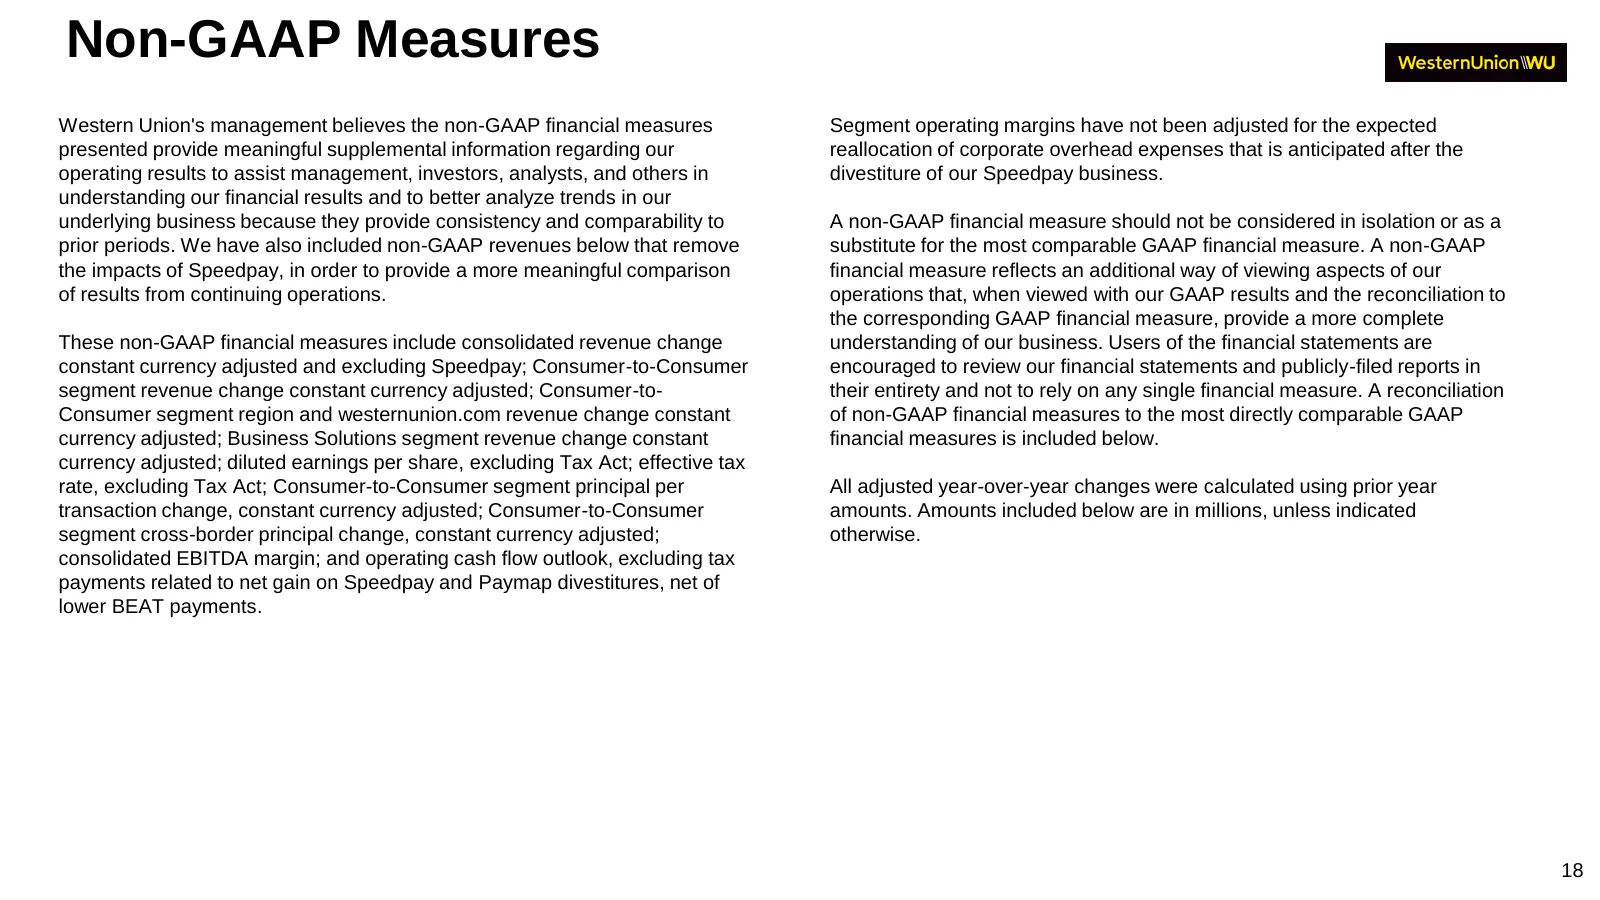
Non-GAAP Measures Western Union's management believes the non-GAAP financial measures Segment operating margins have not been adjusted for the expected presented provide meaningful supplemental information regarding our reallocation of corporate overhead expenses that is anticipated after the operat
Slide 19: Reconciliation of Non-GAAP Measures
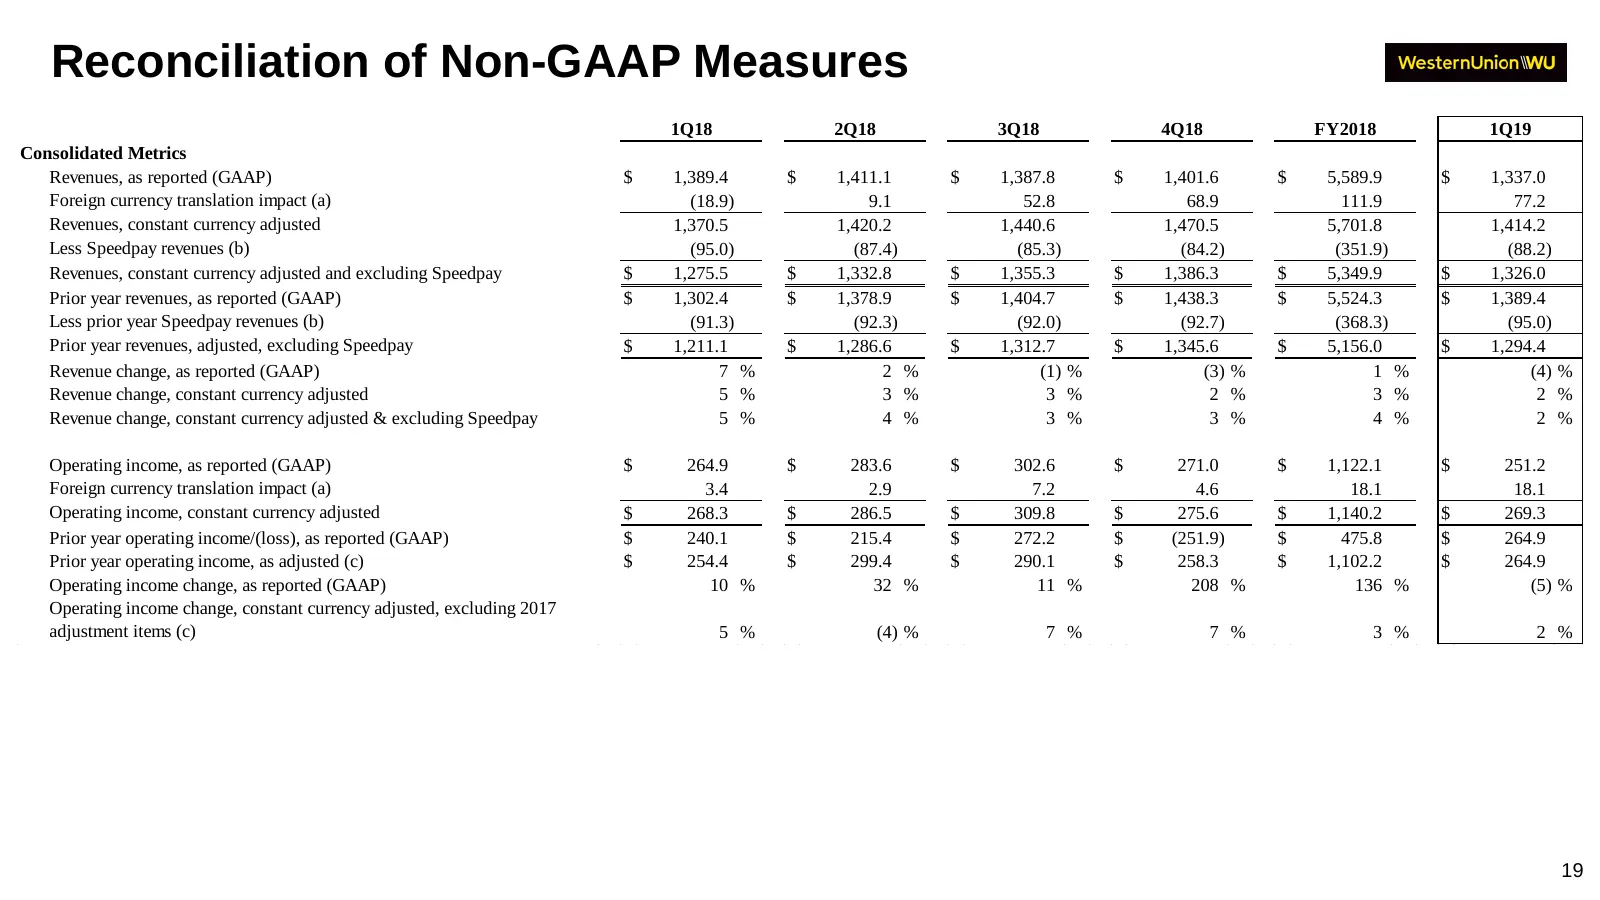
Reconciliation of Non-GAAP Measures 1Q18 2Q18 3Q18 4Q18 FY2018 1Q19 Consolidated Metrics Revenues, as reported (GAAP) $ 1,389.4 $ 1,411.1 $ 1,387.8 $ 1,401.6 $ 5,589.9 $ 1,337.0 Foreign currency translation impact (a) (18.9) 9.1 52.8 68.9 111.9 77.2 Revenues, constant currency adjusted 1,370.5 1,420
Slide 20: Reconciliation of Non-GAAP Measures
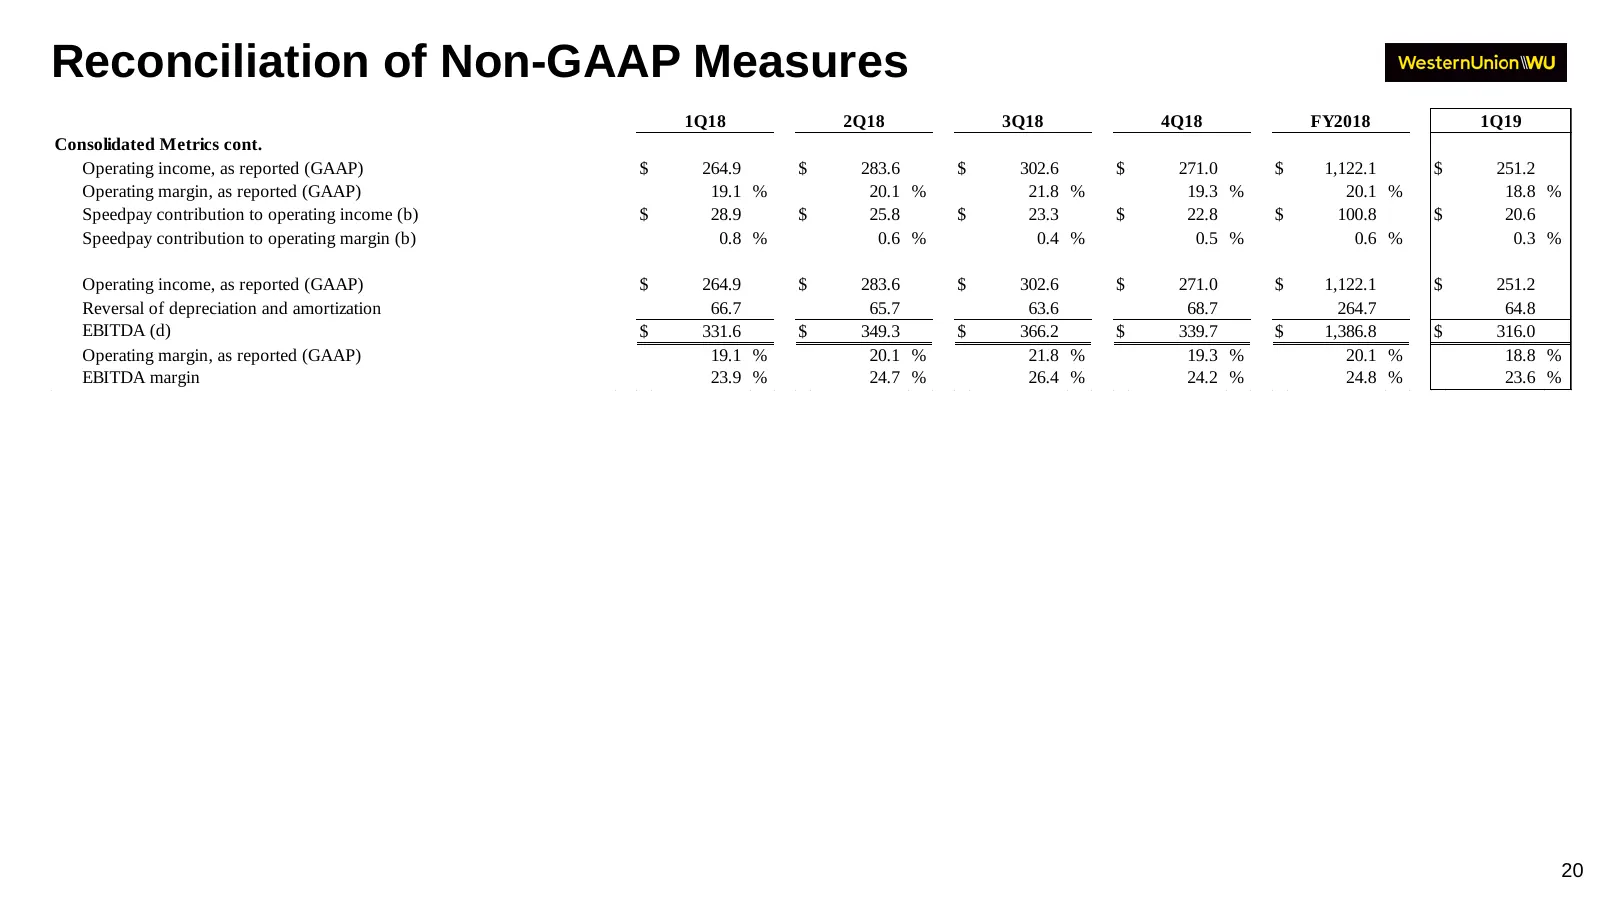
Reconciliation of Non-GAAP Measures 1Q18 2Q18 3Q18 4Q18 FY2018 1Q19 Consolidated Metrics cont. Operating income, as reported (GAAP) $ 264.9 $ 283.6 $ 302.6 $ 271.0 $ 1,122.1 $ 251.2 Operating margin, as reported (GAAP) 19.1 % 20.1 % 21.8 % 19.3 % 20.1 % 18.8 % Speedpay contribution to operating inco
Slide 21: Reconciliation of Non-GAAP Measures
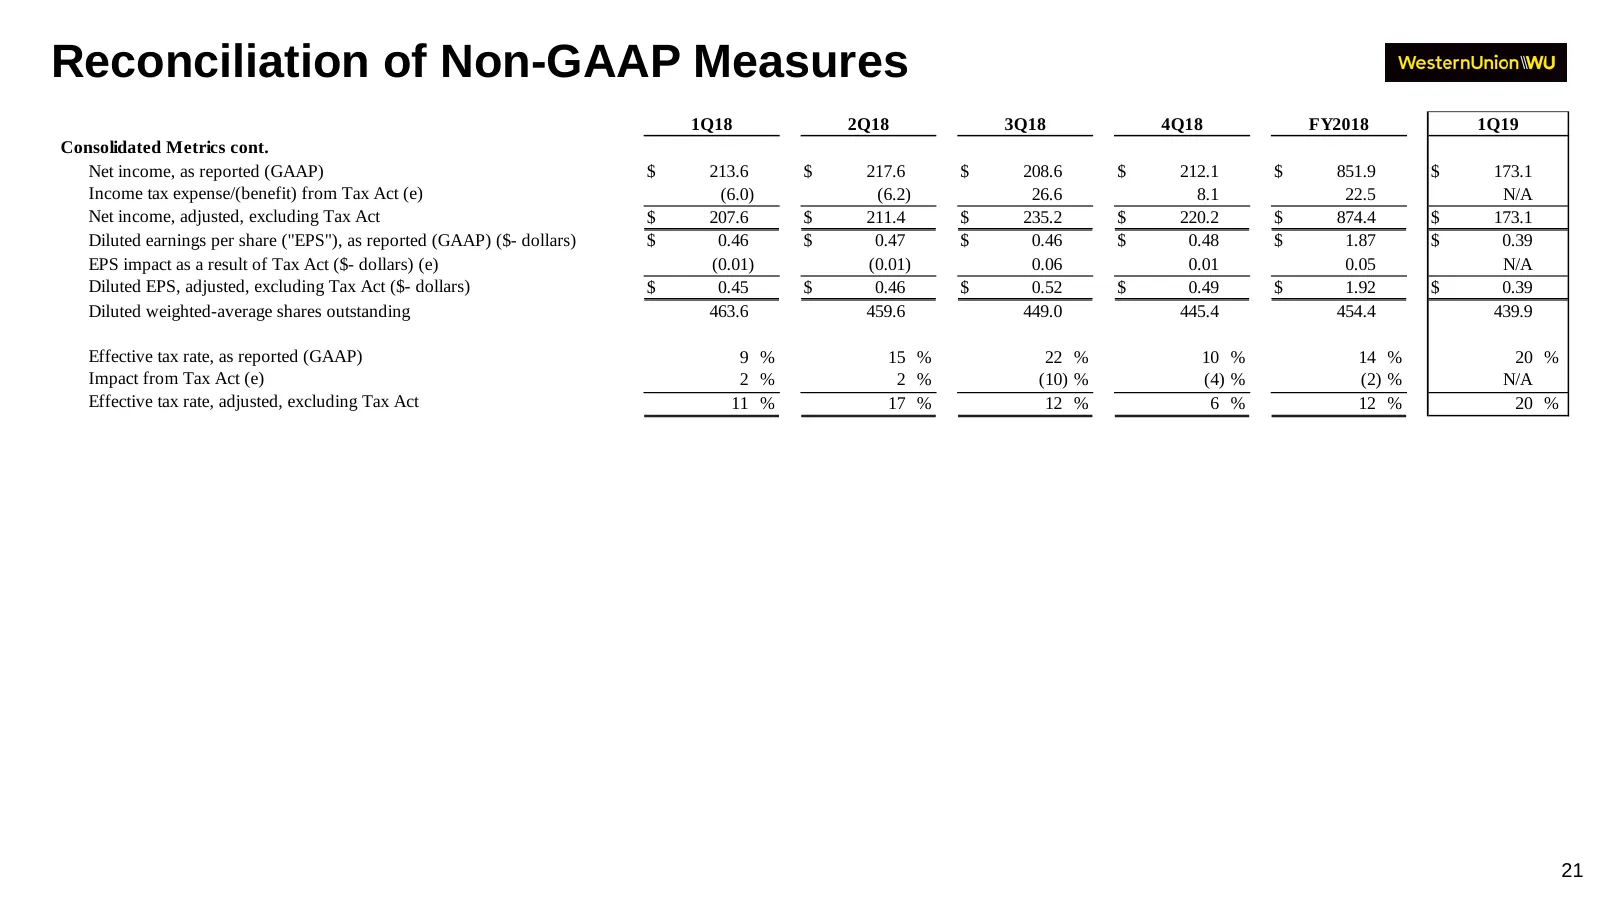
Reconciliation of Non-GAAP Measures 1Q18 2Q18 3Q18 4Q18 FY2018 1Q19 Consolidated Metrics cont. Net income, as reported (GAAP) $ 213.6 $ 217.6 $ 208.6 $ 212.1 $ 851.9 $ 173.1 Income tax expense/(benefit) from Tax Act (e) (6.0) (6.2) 26.6 8.1 22.5 N/A Net income, adjusted, excluding Tax Act $ 207.6 $
Slide 22: Reconciliation of Non-GAAP Measures
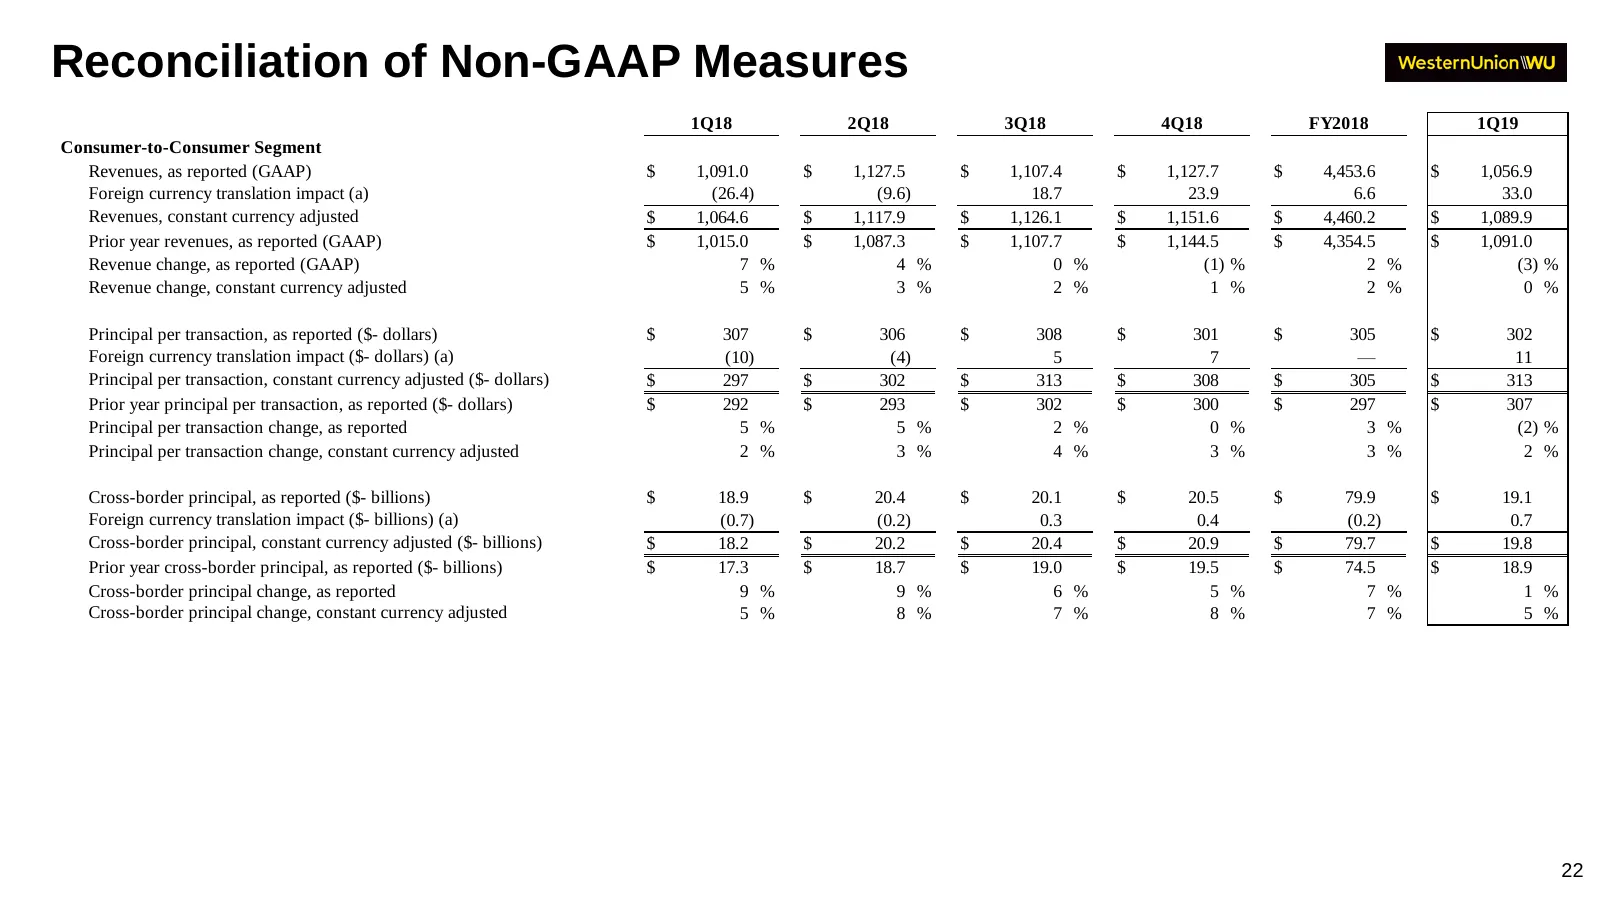
Reconciliation of Non-GAAP Measures 1Q18 2Q18 3Q18 4Q18 FY2018 1Q19 Consumer-to-Consumer Segment Revenues, as reported (GAAP) $ 1,091.0 $ 1,127.5 $ 1,107.4 $ 1,127.7 $ 4,453.6 $ 1,056.9 Foreign currency translation impact (a) (26.4) (9.6) 18.7 23.9 6.6 33.0 Revenues, constant currency adjusted $ 1,0
Slide 23: Reconciliation of Non-GAAP Measures
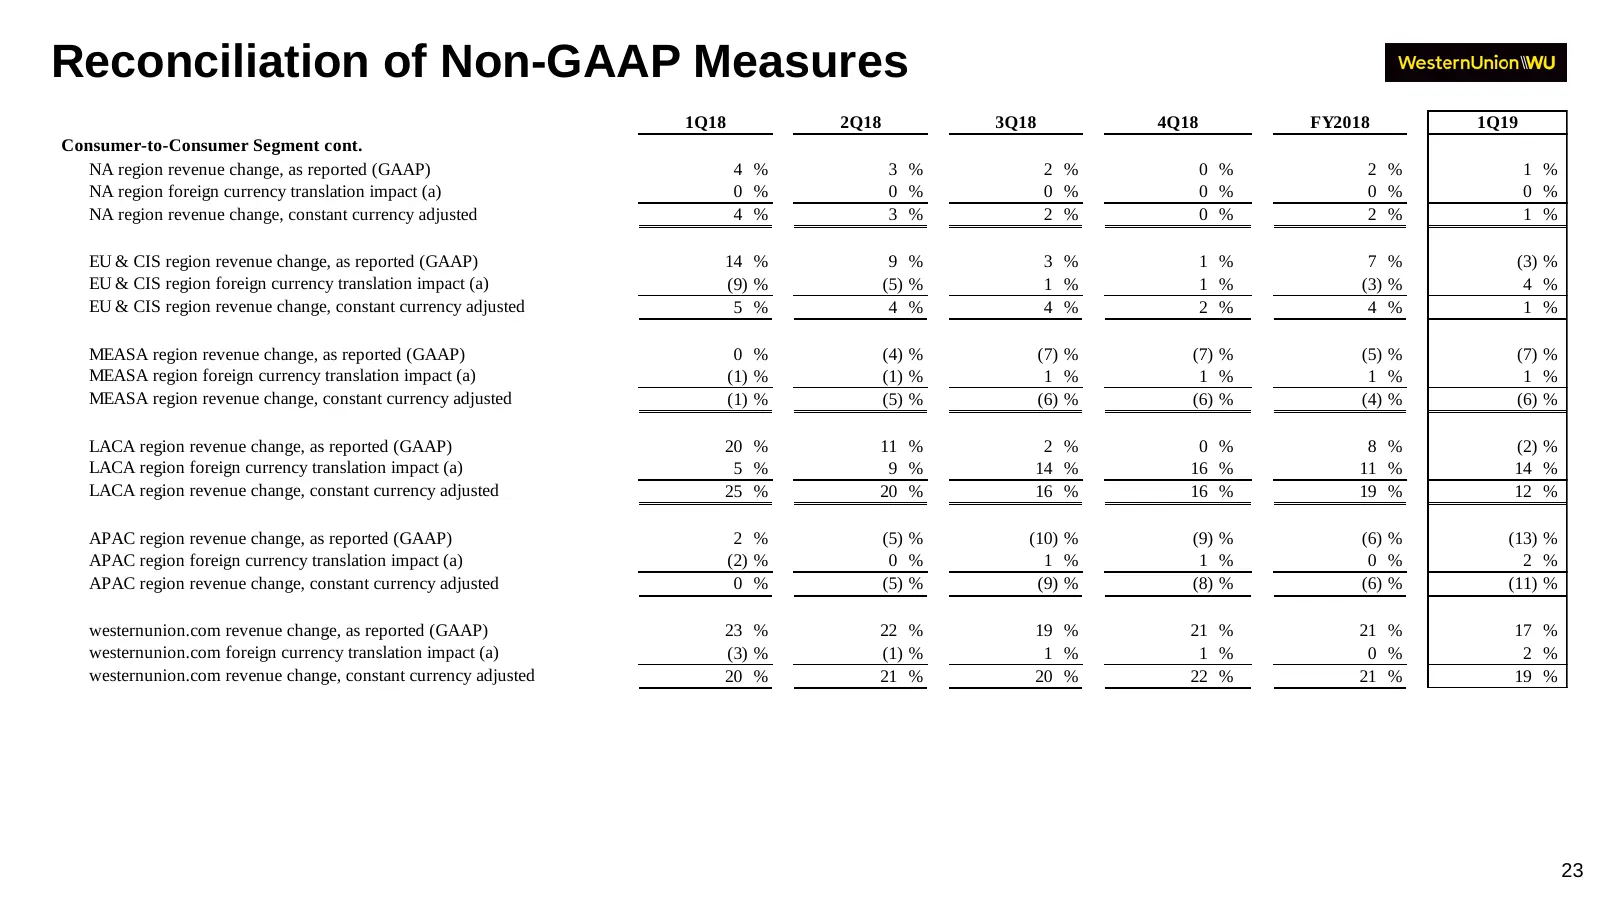
Reconciliation of Non-GAAP Measures 1Q18 2Q18 3Q18 4Q18 FY2018 1Q19 Consumer-to-Consumer Segment cont. NA region revenue change, as reported (GAAP) 4 % 3 % 2 % 0 % 2 % 1 % NA region foreign currency translation impact (a) 0 % 0 % 0 % 0 % 0 % 0 % NA region revenue change, constant currency adjusted 4
Slide 24: Reconciliation of Non-GAAP Measures
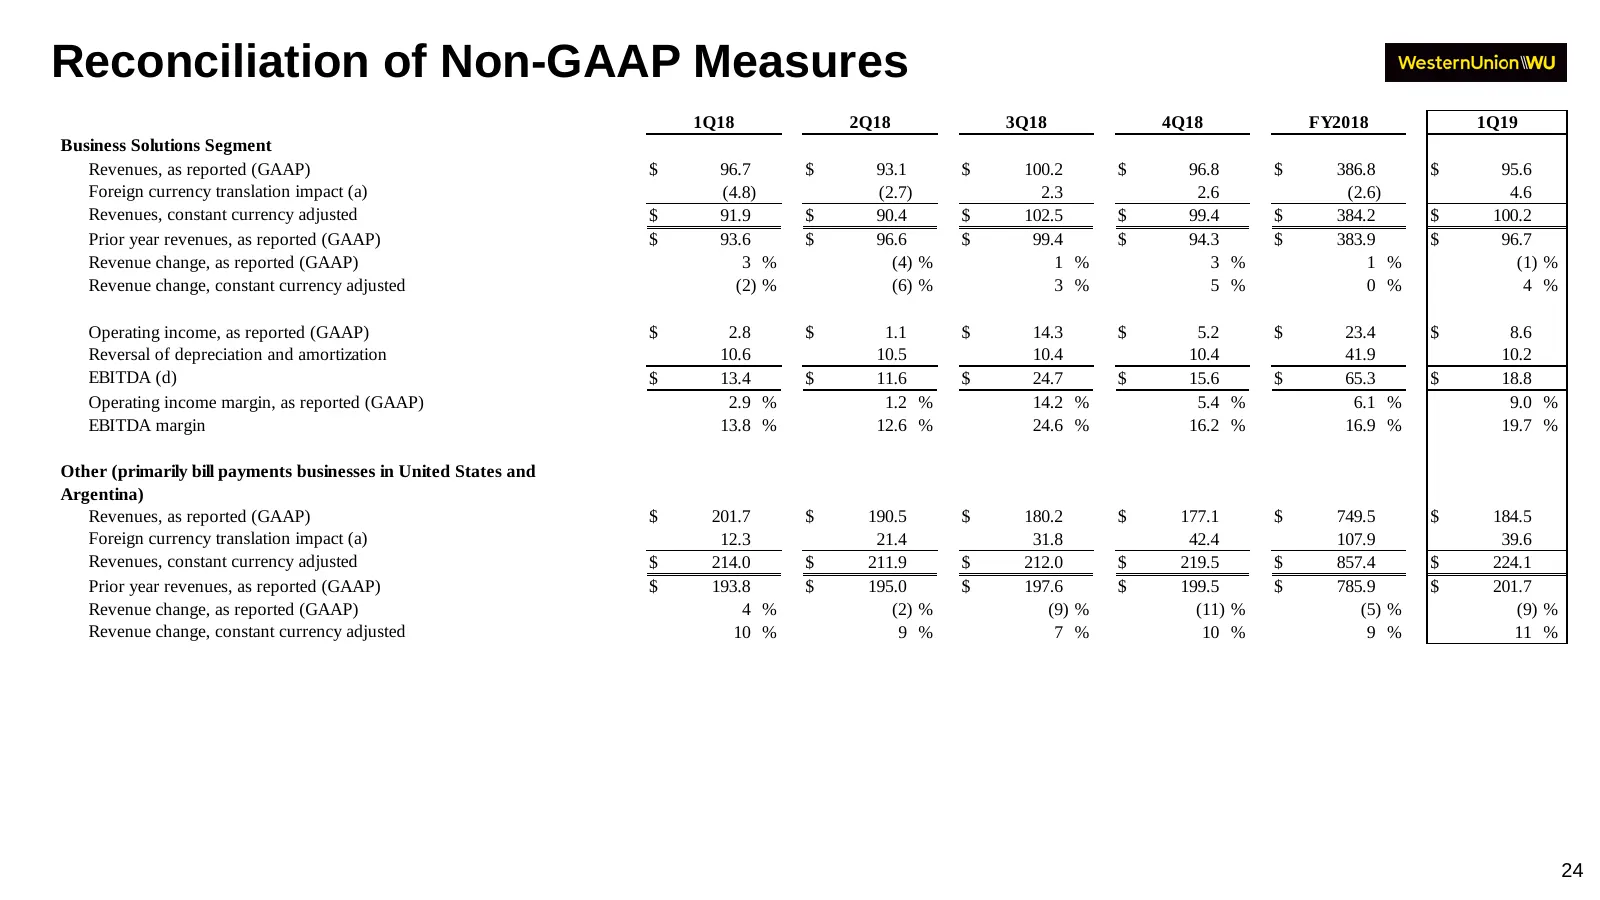
Reconciliation of Non-GAAP Measures 1Q18 2Q18 3Q18 4Q18 FY2018 1Q19 Business Solutions Segment Revenues, as reported (GAAP) $ 96.7 $ 93.1 $ 100.2 $ 96.8 $ 386.8 $ 95.6 Foreign currency translation impact (a) (4.8) (2.7) 2.3 2.6 (2.6) 4.6 Revenues, constant currency adjusted $ 91.9 $ 90.4 $ 102.5 $ 9
Slide 25: Reconciliation of Non-GAAP Measures
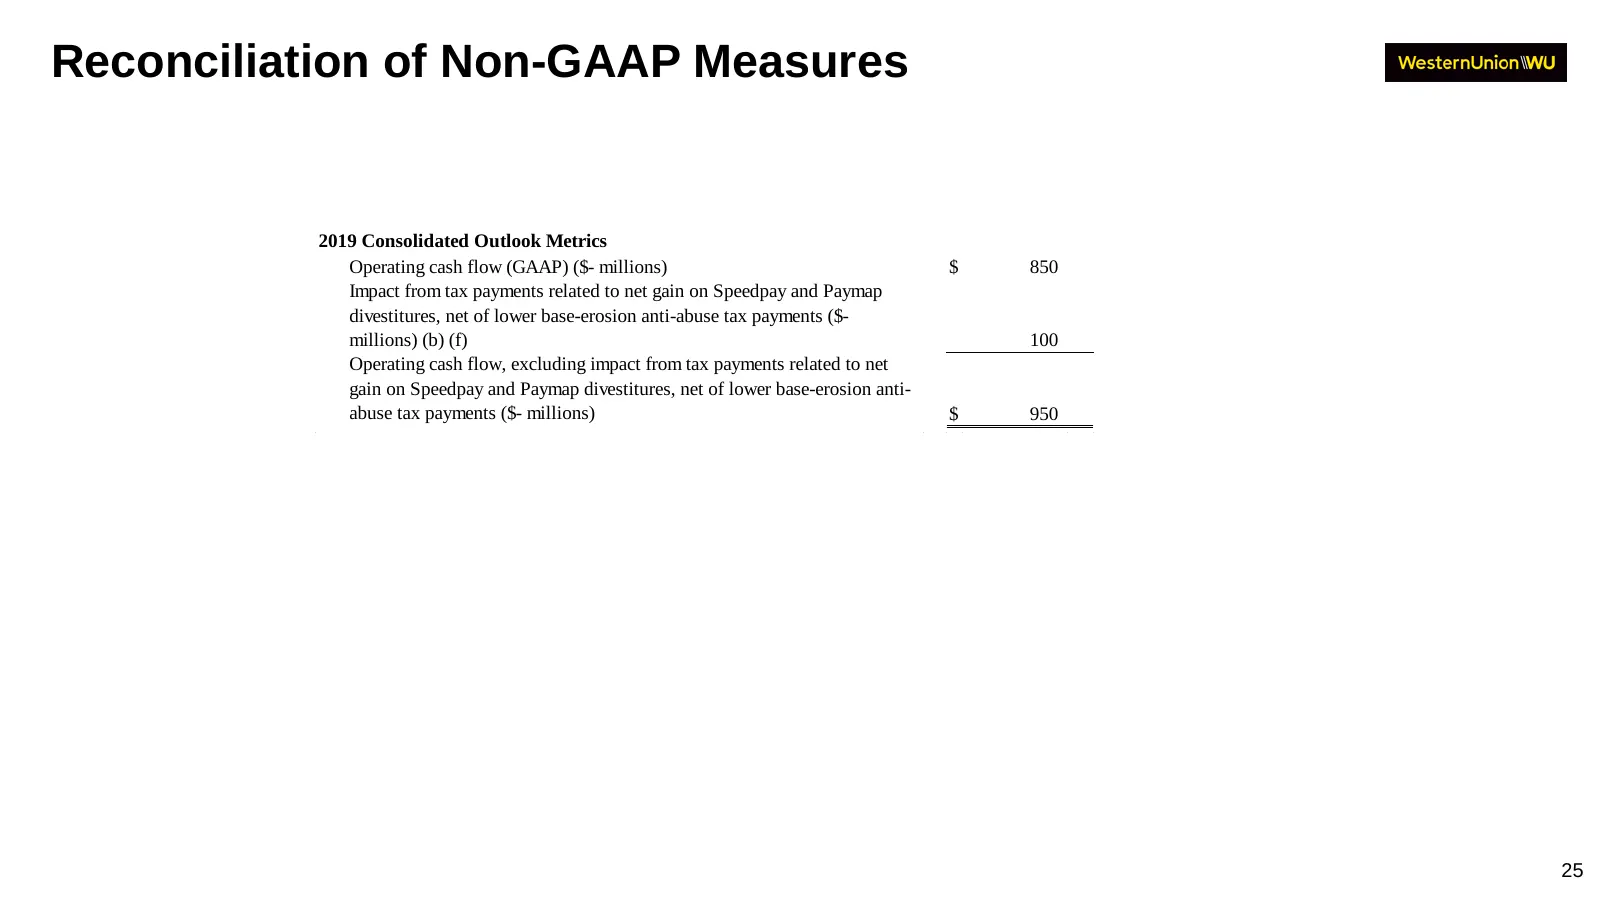
Reconciliation of Non-GAAP Measures 2019 Consolidated Outlook Metrics Operating cash flow (GAAP) ($- millions) $ 850 Impact from tax payments related to net gain on Speedpay and Paymap divestitures, net of lower base-erosion anti-abuse tax payments ($- millions) (b) (f) 100 Operating cash flow, excl
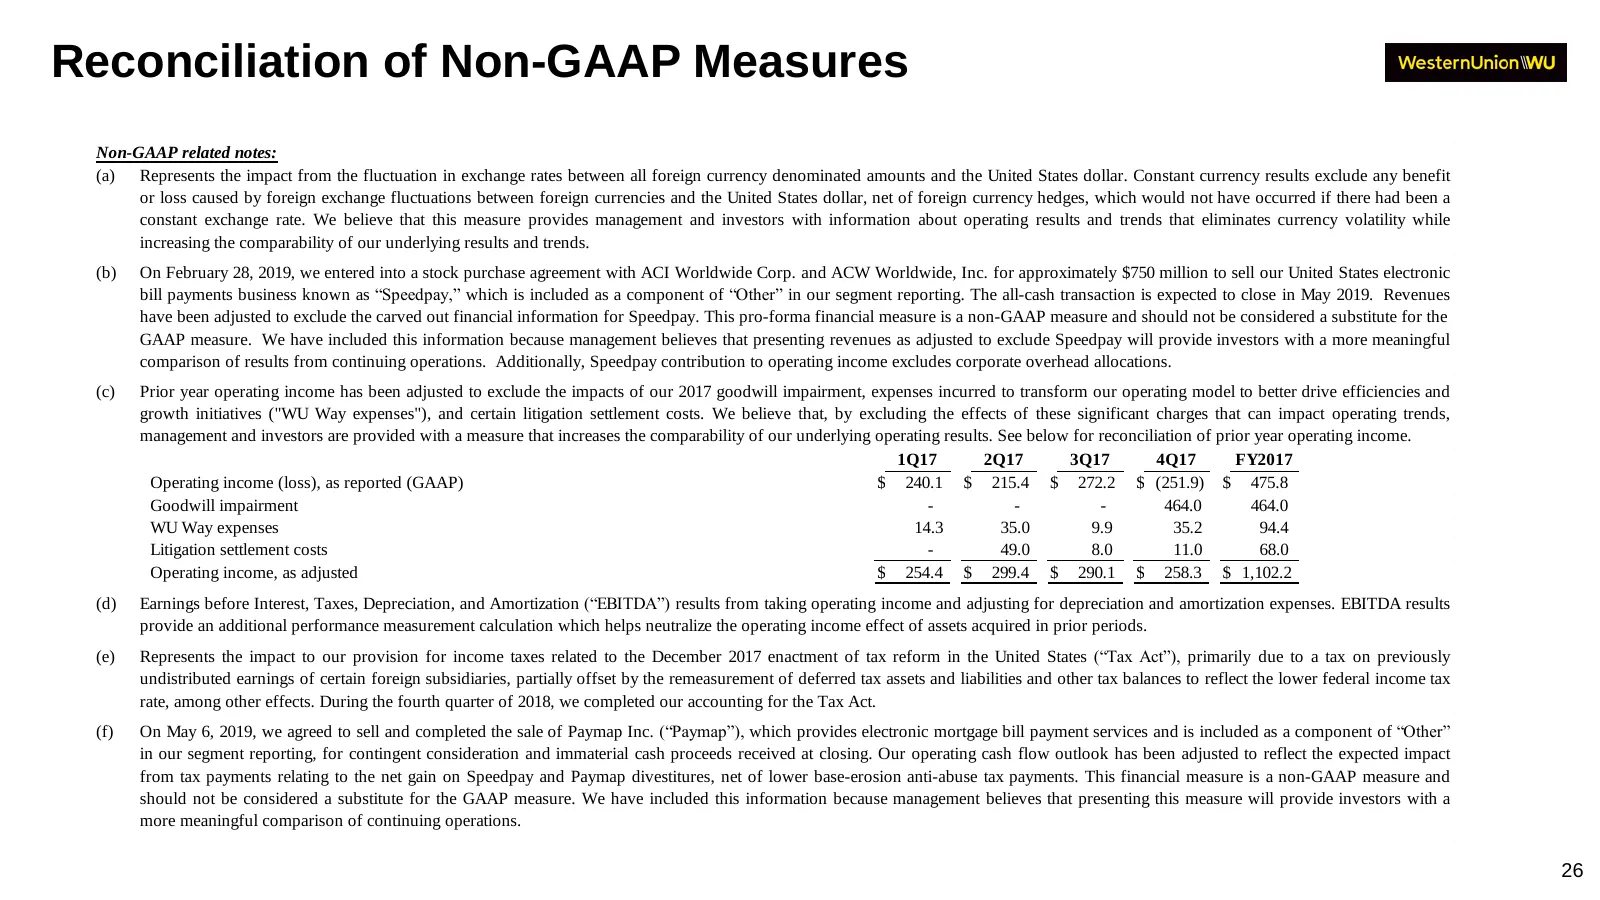
Slide 26: Reconciliation of Non-GAAP Measures
Reconciliation of Non-GAAP Measures Non-GAAP related notes: (a) Represents the impact from the fluctuation in exchange rates between all foreign currency denominated amounts and the United States dollar. Constant currency results exclude any benefit or loss caused by foreign exchange fluctuations be
Source: company website
More decks from Western Union Company (the)
 Q3 2026 Earnings Presentation33 slides · Nov 4, 2026
 Shareholder Meeting (April 2026)20 slides · Apr 28, 2026
 Q1 2026 Earnings Presentation38 slides · Apr 24, 2026
 Q4 2025 Earnings Presentation41 slides · Feb 20, 2026
 Investor Day (November 2025)135 slides · Nov 6, 2025
 Investor Day (November 2025)134 slides · Nov 6, 2025