Cognyte Software Ltd. · NASDAQ:CGNT
Cognyte Software — Q2 FYE22 Earnings Presentation
26 slides from Cognyte Software's earnings presentation, Sep 20, 2021

Slide 1: Q2 FYE22 Conference Call
Q2 FYE22 Conference Call September 20, 2021 1
Slide 2: Disclaimers
Disclaimers Forward Looking Statements This presentation contains "forward-looking statements," including statements regarding expectations, predictions, views, opportunities, plans, strategies, beliefs, and statements of similar effect relating to Cognyte Software Ltd. These forward-looking stateme
Slide 3: Strong H1 as a pure play security analytics company
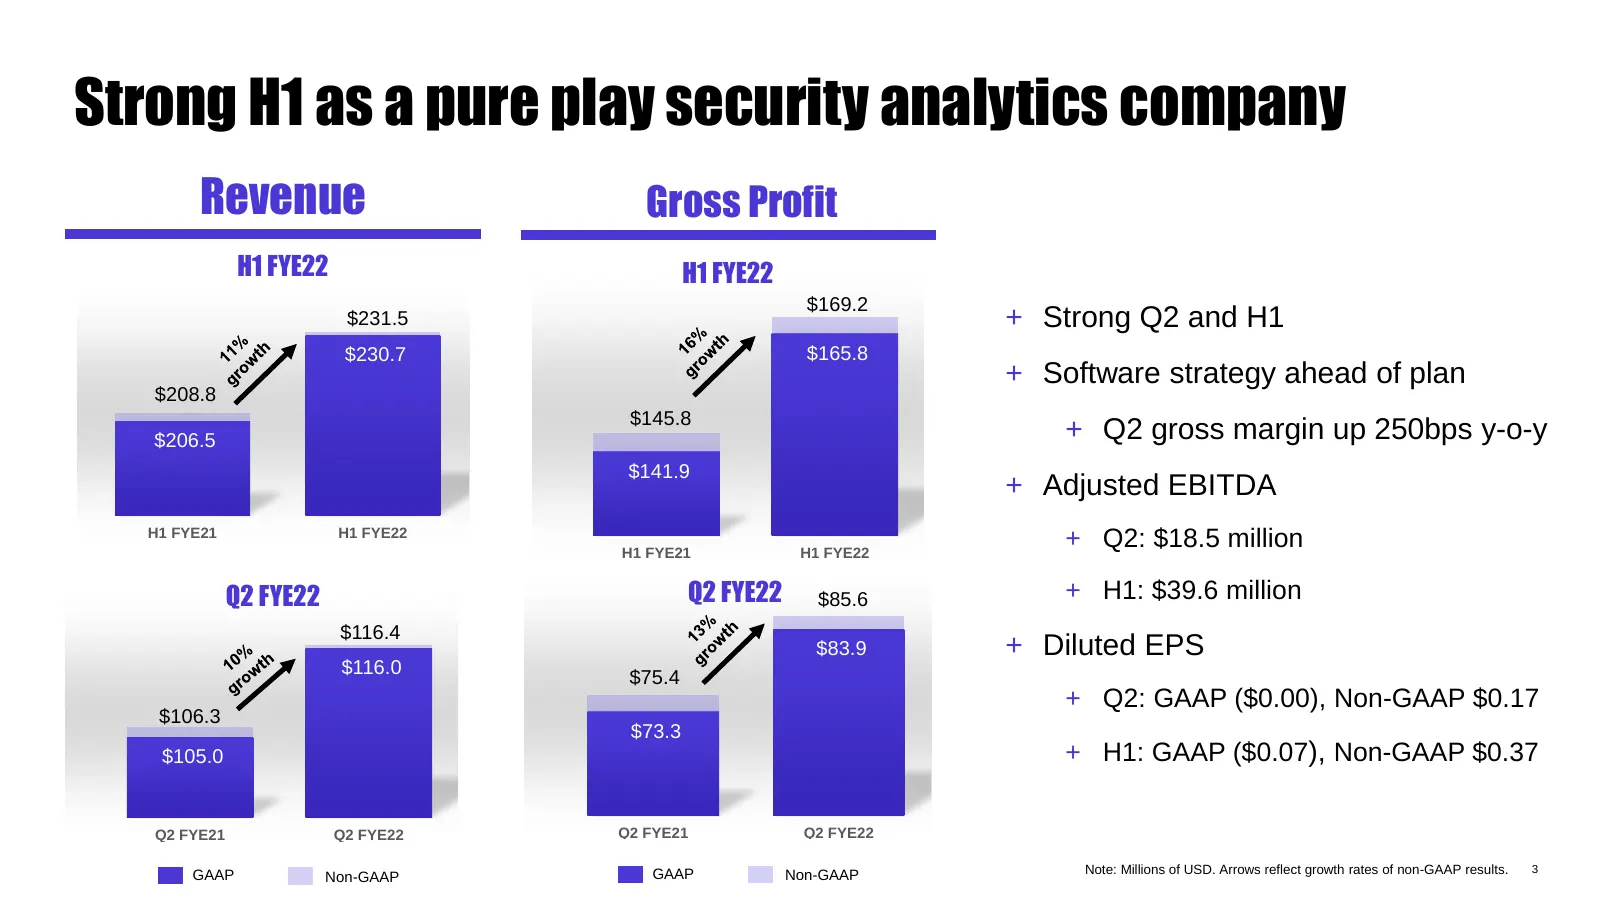
Strong H1 as a pure play security analytics company Revenue Gross Profit H1 FYE22 H1 FYE22 $169.2 $231.5 + Strong Q2 and H1 $230.7 $165.8 + Software strategy ahead of plan $208.8 $145.8 $206.5 + Q2 gross margin up 250bps y-o-y $141.9 + Adjusted EBITDA H1 FYE21 H1 FYE22 H1 FYE21 H1 FYE22 + Q2: $18.5
Slide 4: Our opportunity – address a large TAM
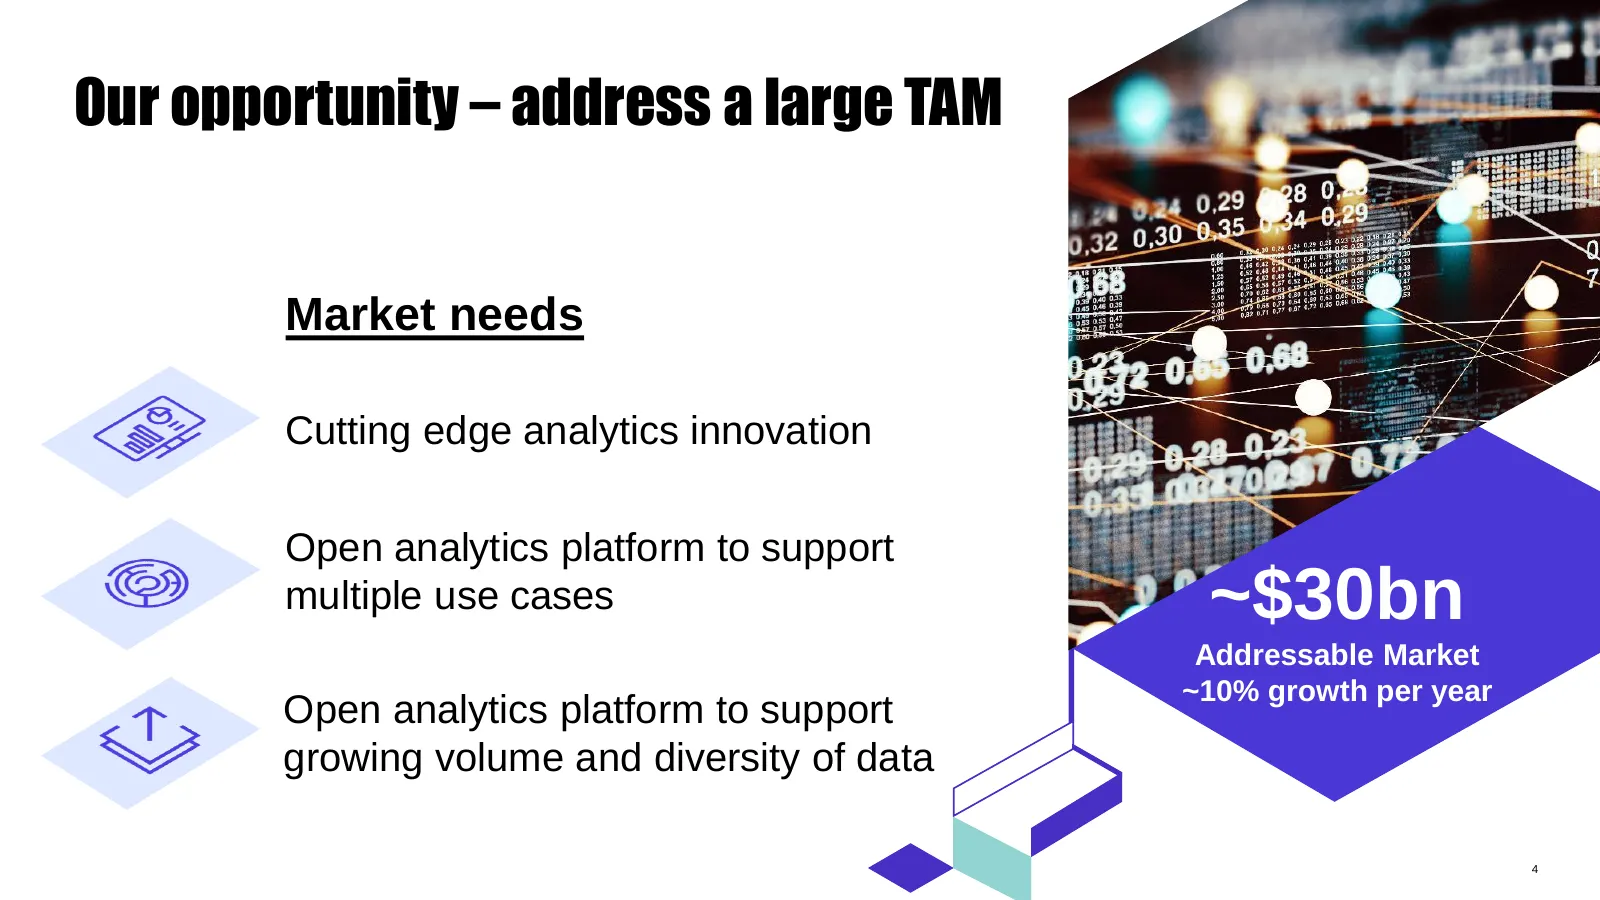
Our opportunity – address a large TAM Market needs Cutting edge analytics innovation Open analytics platform to support multiple use cases ~$30bn Addressable Market ~10% growth per year Open analytics platform to support growing volume and diversity of data 4
Slide 5: Winning large orders – Q2 customer examples
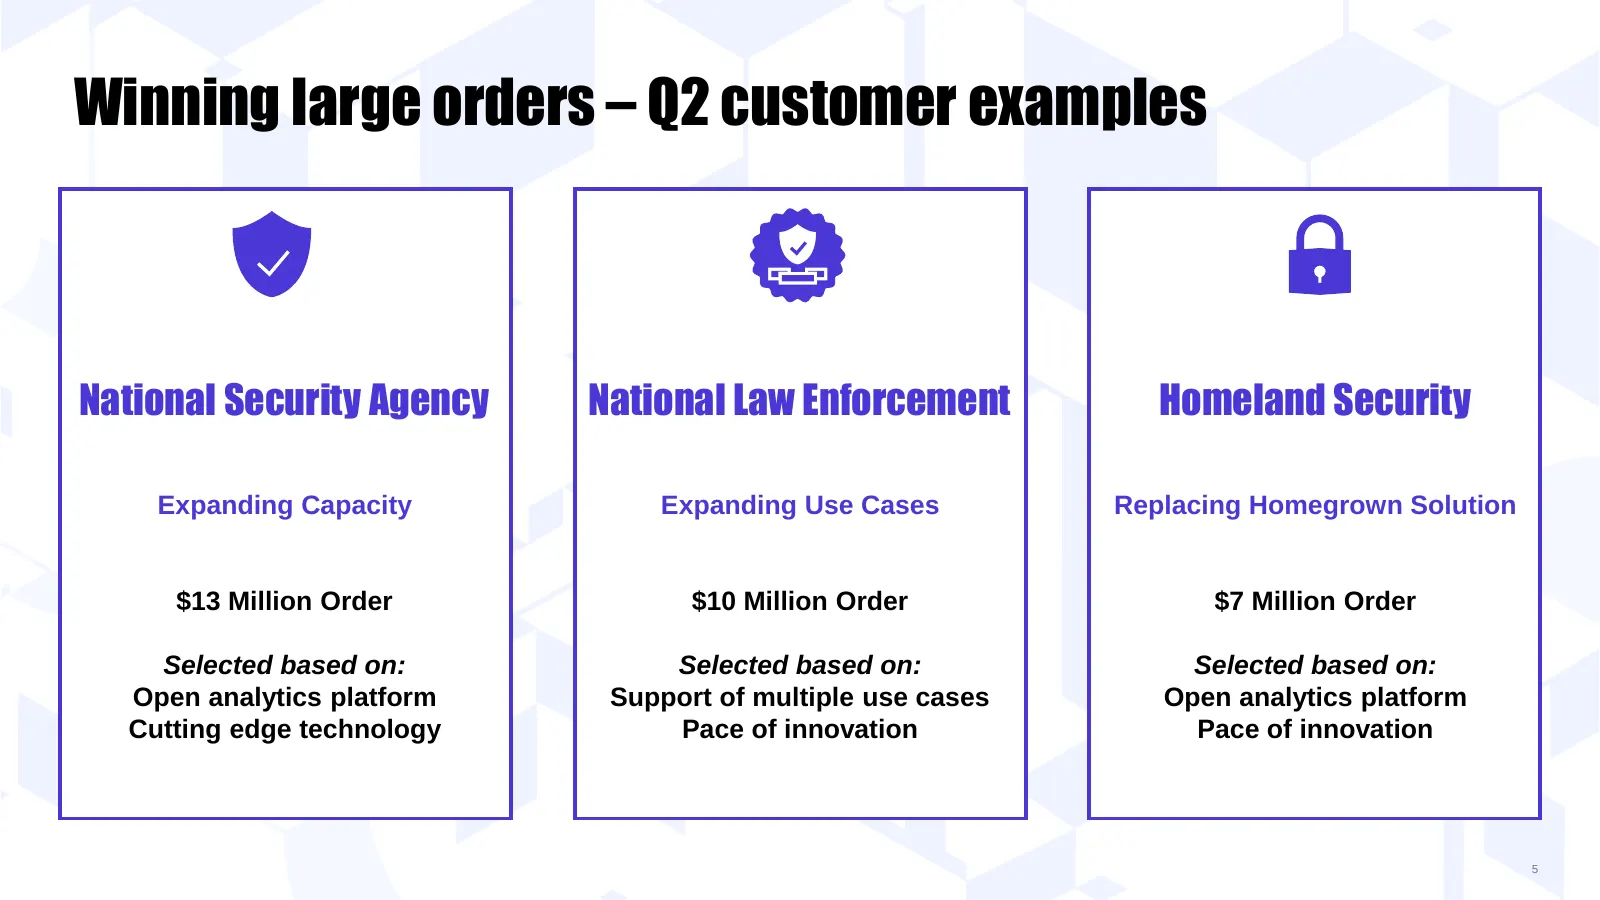
Winning large orders – Q2 customer examples National Security Agency National Law Enforcement Homeland Security Expanding Capacity Expanding Use Cases Replacing Homegrown Solution $13 Million Order $10 Million Order $7 Million Order Selected based on: Selected based on: Selected based on: Open analy
Slide 6: Cybercrime use case
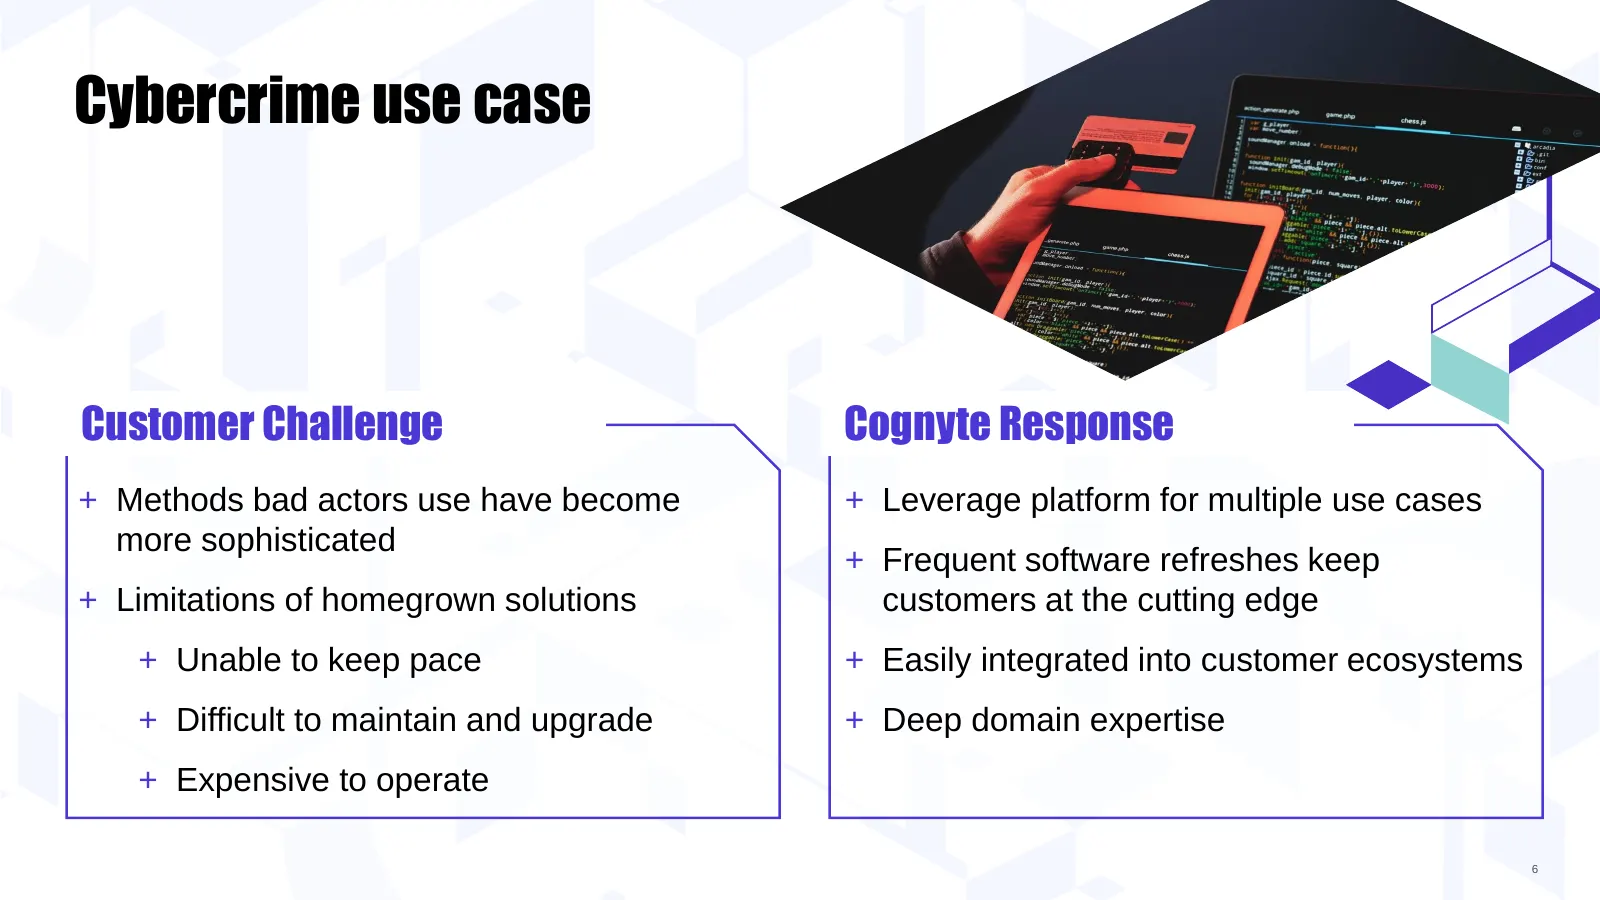
Cybercrime use case Customer Challenge Cognyte Response + Methods bad actors use have become + Leverage platform for multiple use cases more sophisticated + Frequent software refreshes keep + Limitations of homegrown solutions customers at the cutting edge + Unable to keep pace + Easily integrated i
Slide 7: Pure-play security analytics company
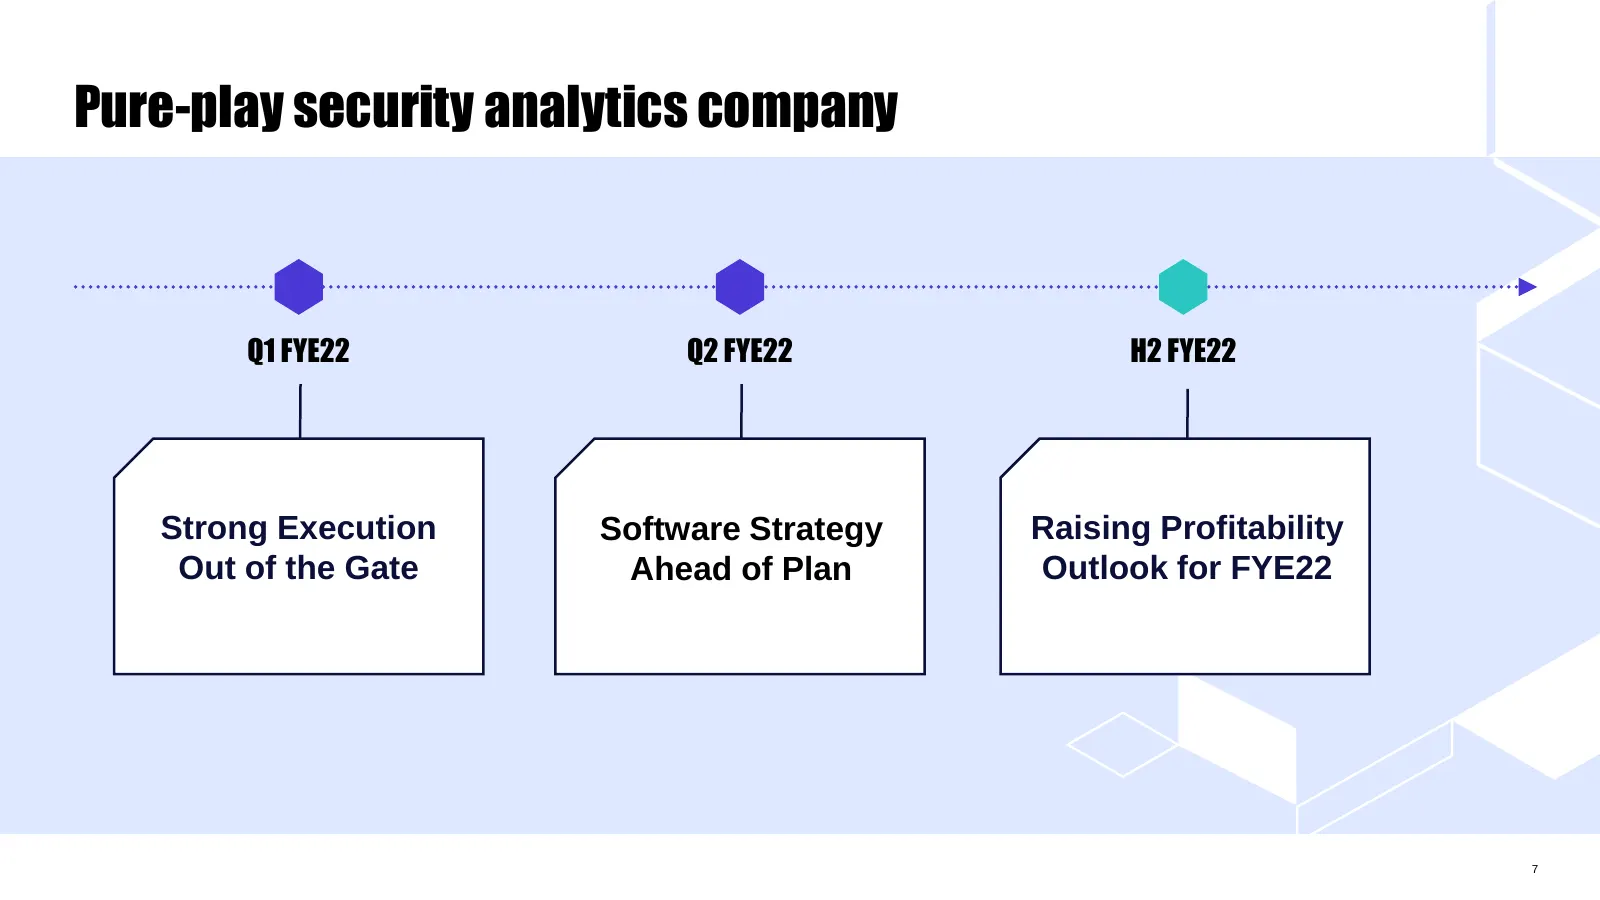
Pure-play security analytics company Q1 FYE22 Q2 FYE22 H2 FYE22 Strong Execution Software Strategy Raising Profitability Out of the Gate Ahead of Plan Outlook for FYE22 7

Slide 8: Financial Summary
Financial Summary 88
Slide 9: Q2 FYE22 Recap
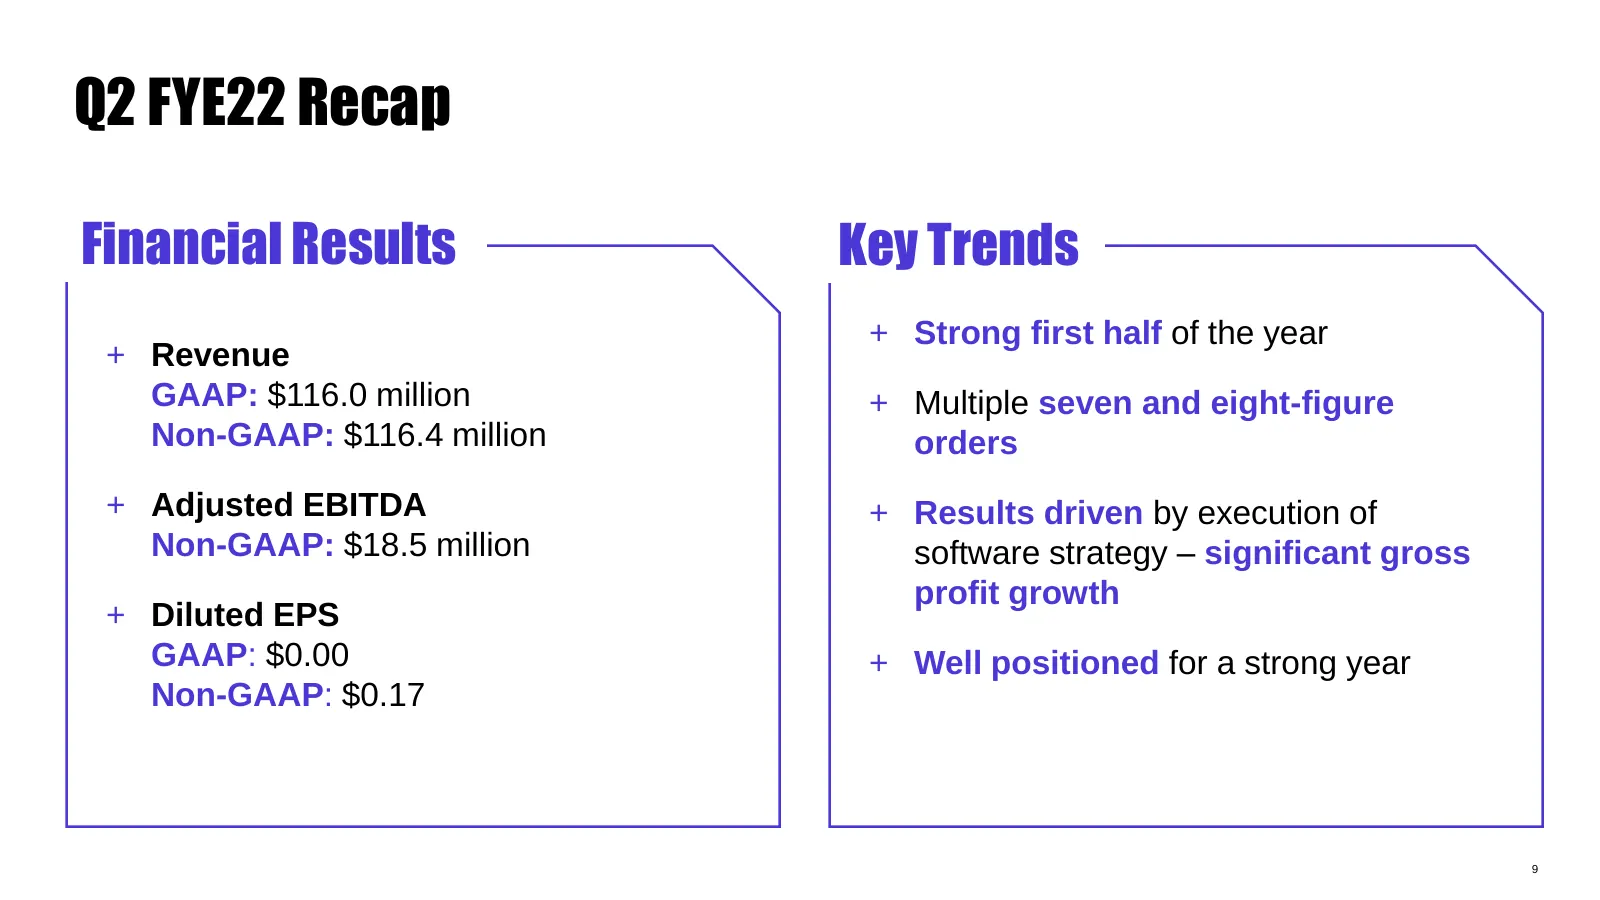
Q2 FYE22 Recap Financial Results Key Trends + Strong first half of the year + Revenue GAAP: $116.0 million + Multiple seven and eight-figure Non-GAAP: $116.4 million orders + Adjusted EBITDA + Results driven by execution of Non-GAAP: $18.5 million software strategy – significant gross profit growth
Slide 10: Mix shift – positive impact to financial model
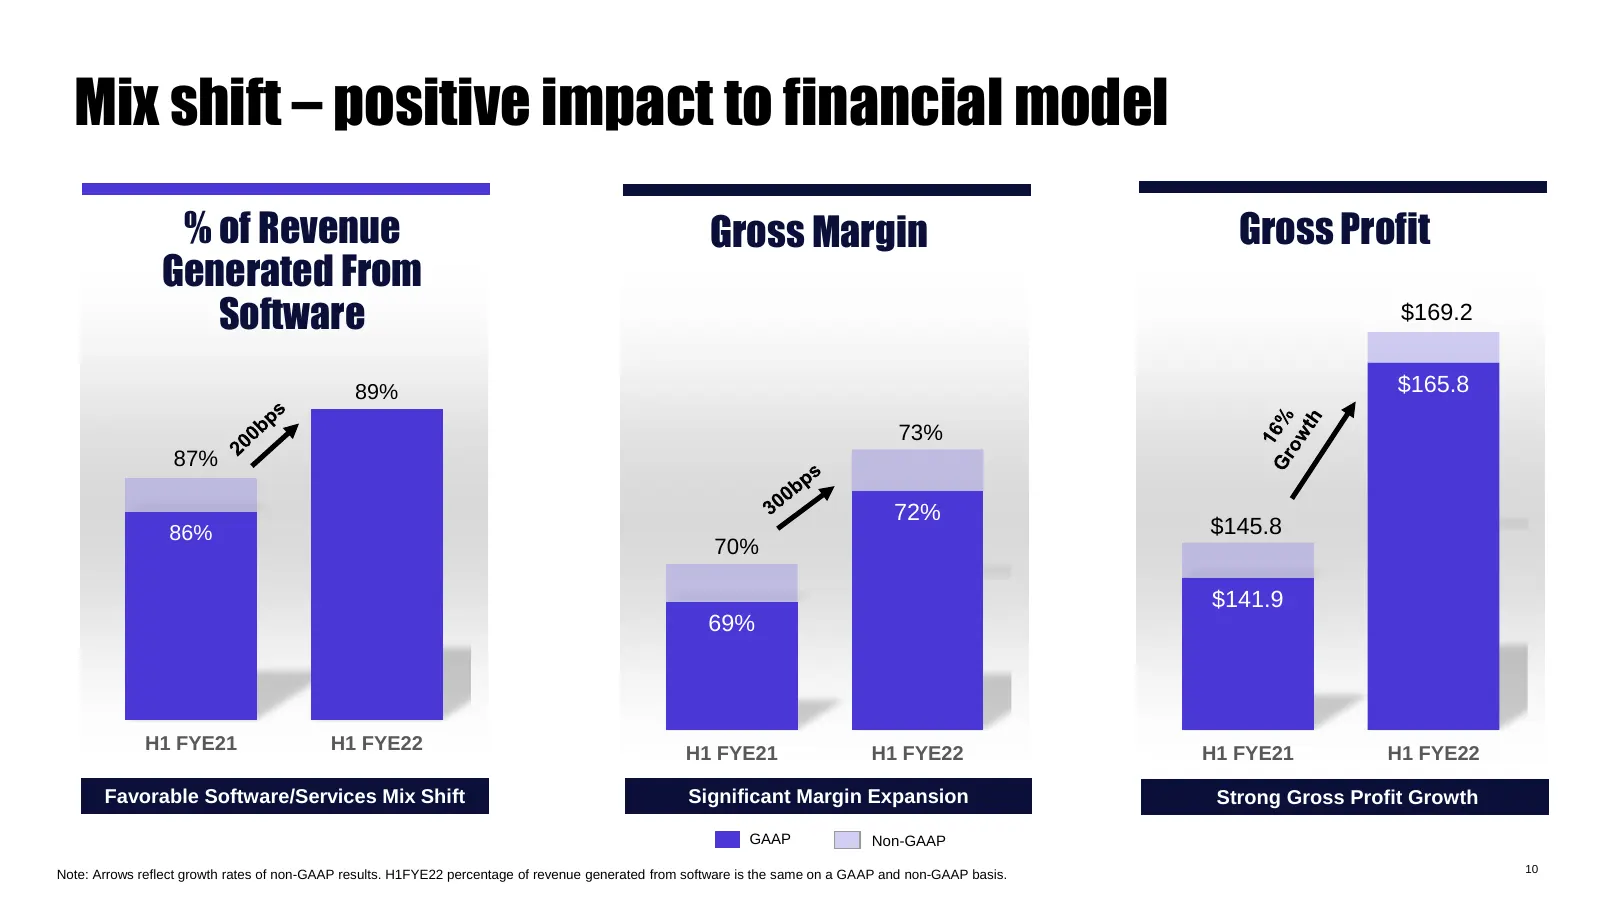
Mix shift – positive impact to financial model % of Revenue Gross Margin Gross Profit Generated From Software $169.2 89% $165.8 73% 87% 72% 86% $145.8 70% $141.9 69% H1 FYE21 H1 FYE22 H1 FYE21 H1 FYE22 H1 FYE21 H1 FYE22 Favorable Software/Services Mix Shift Significant Margin Expansion Strong Gross
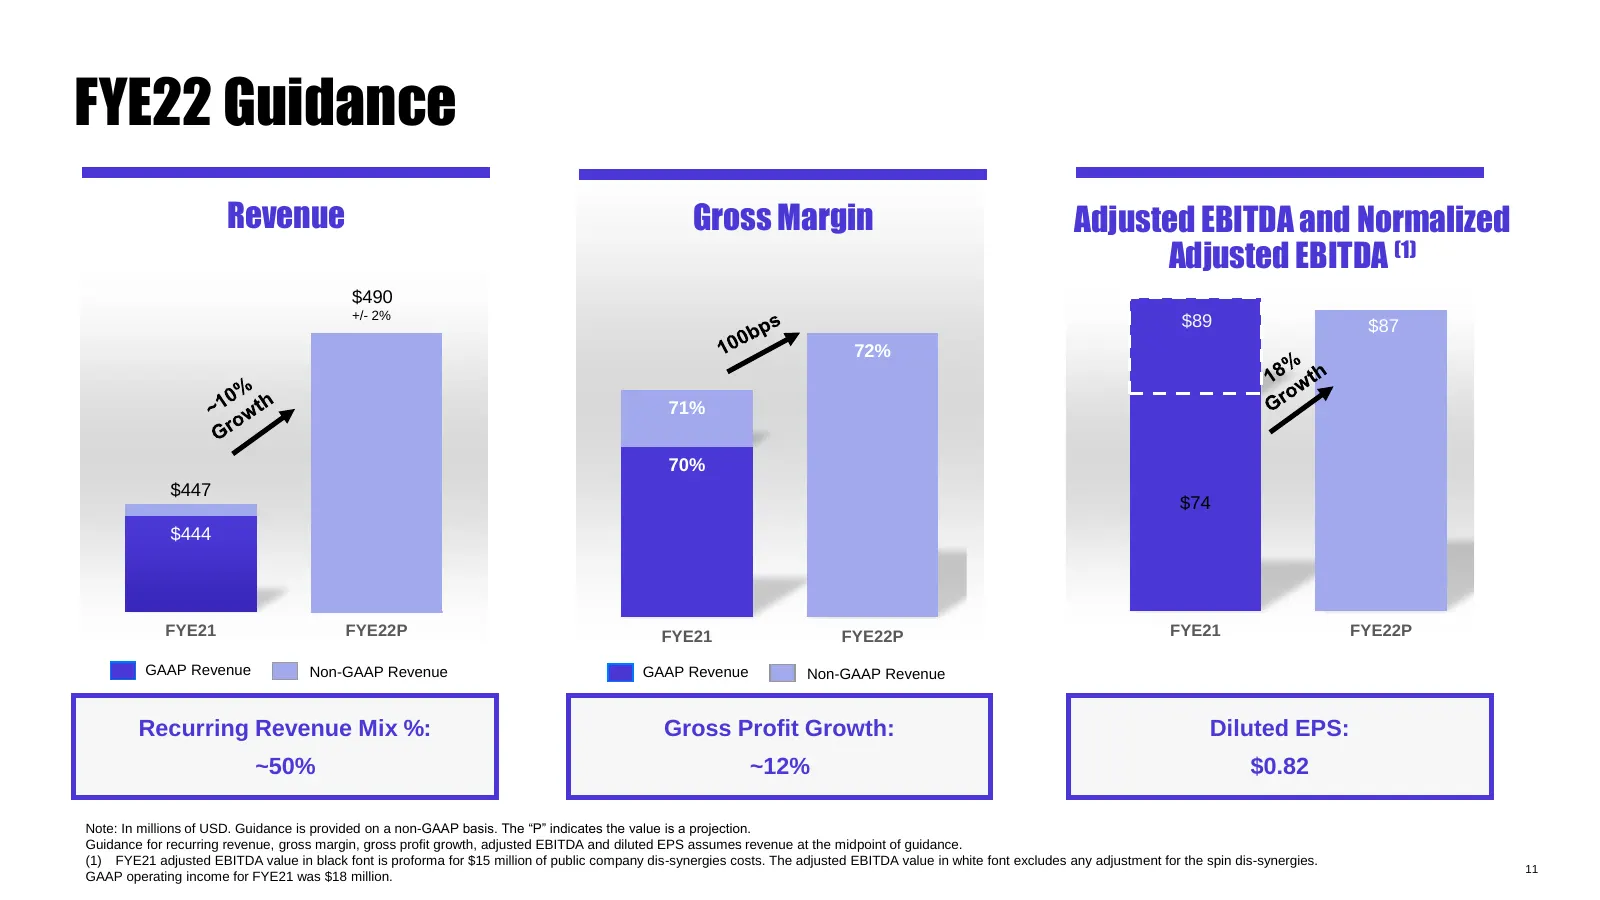
Slide 11: FYE22 Guidance
FYE22 Guidance Revenue Gross Margin Adjusted EBITDA and Normalized Adjusted EBITDA (1) $490 +/- 2% $89 $87 72% 71% 70% $447 $74 $444 FYE21 FYE22P FYE21 FYE22P FYE21 FYE22P GAAP Revenue Non-GAAP Revenue GAAP Revenue Non-GAAP Revenue Recurring Revenue Mix %: Gross Profit Growth: Diluted EPS: ~50% ~12%

Slide 12: Thank you
Thank you cognyte.com 12

Slide 13: Appendix
Appendix 13 13
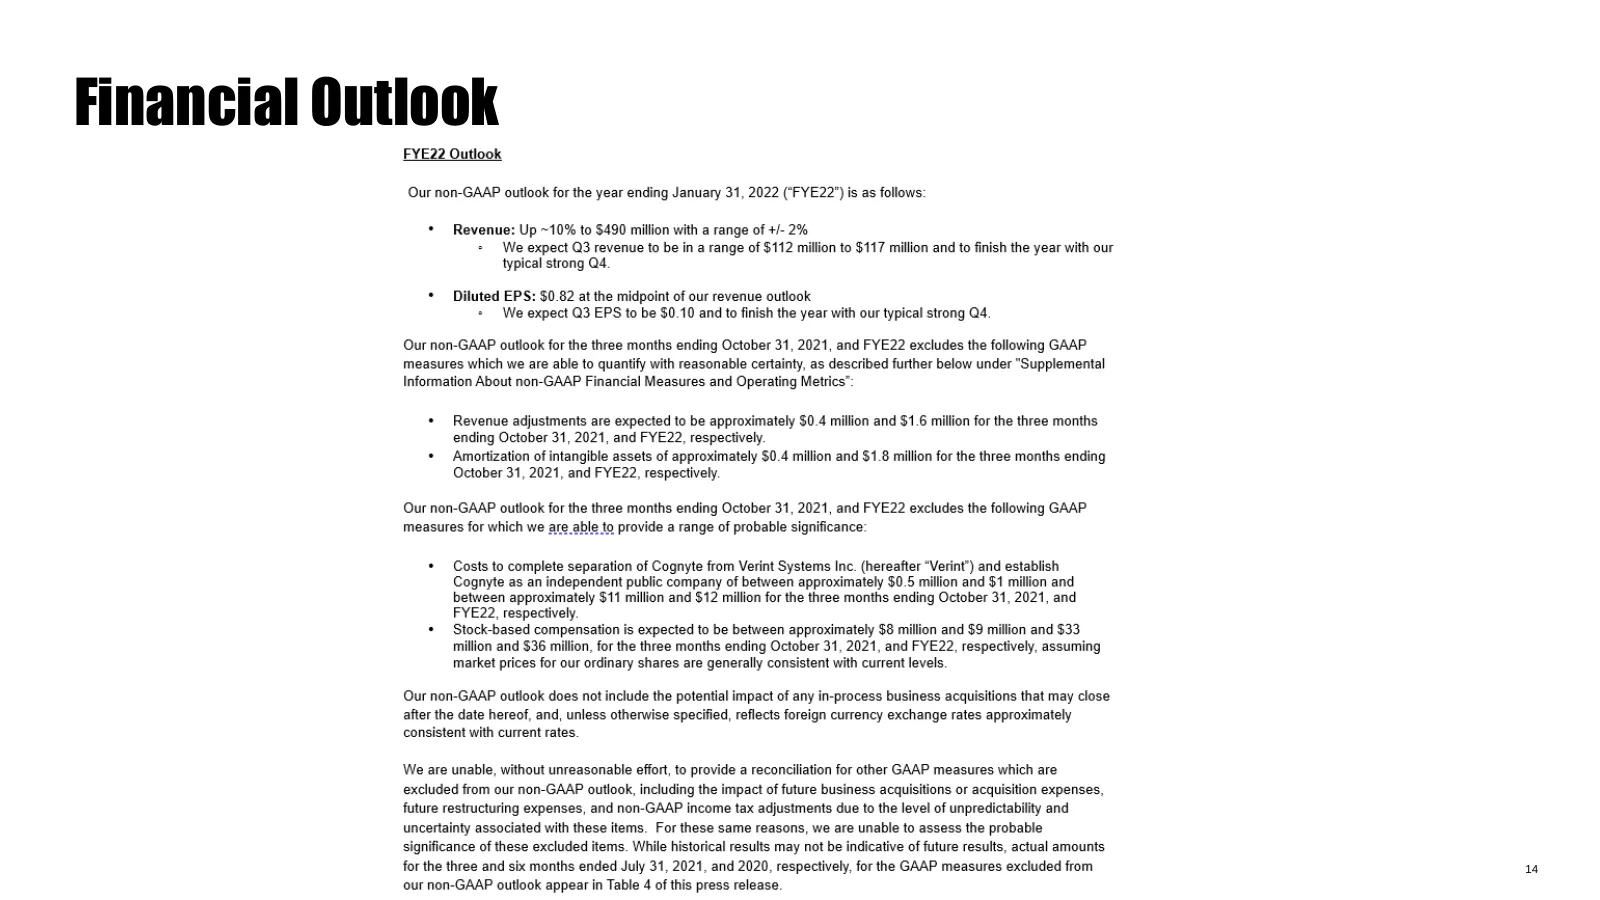
Slide 14: FYE22 Outlook
EYE22 Outlook Our non-GAAP outlook for the year ending January 31, 2022 (‘FYE22°) is as follows: + Revenue: Up ~10% to $490 million with a range of +/- 2% = We expect Q3 revenue to be in a range of $112 mi typical strong Q4. 1n to $117 million and to finish the year with our * Diluted EPS: $0.82 at
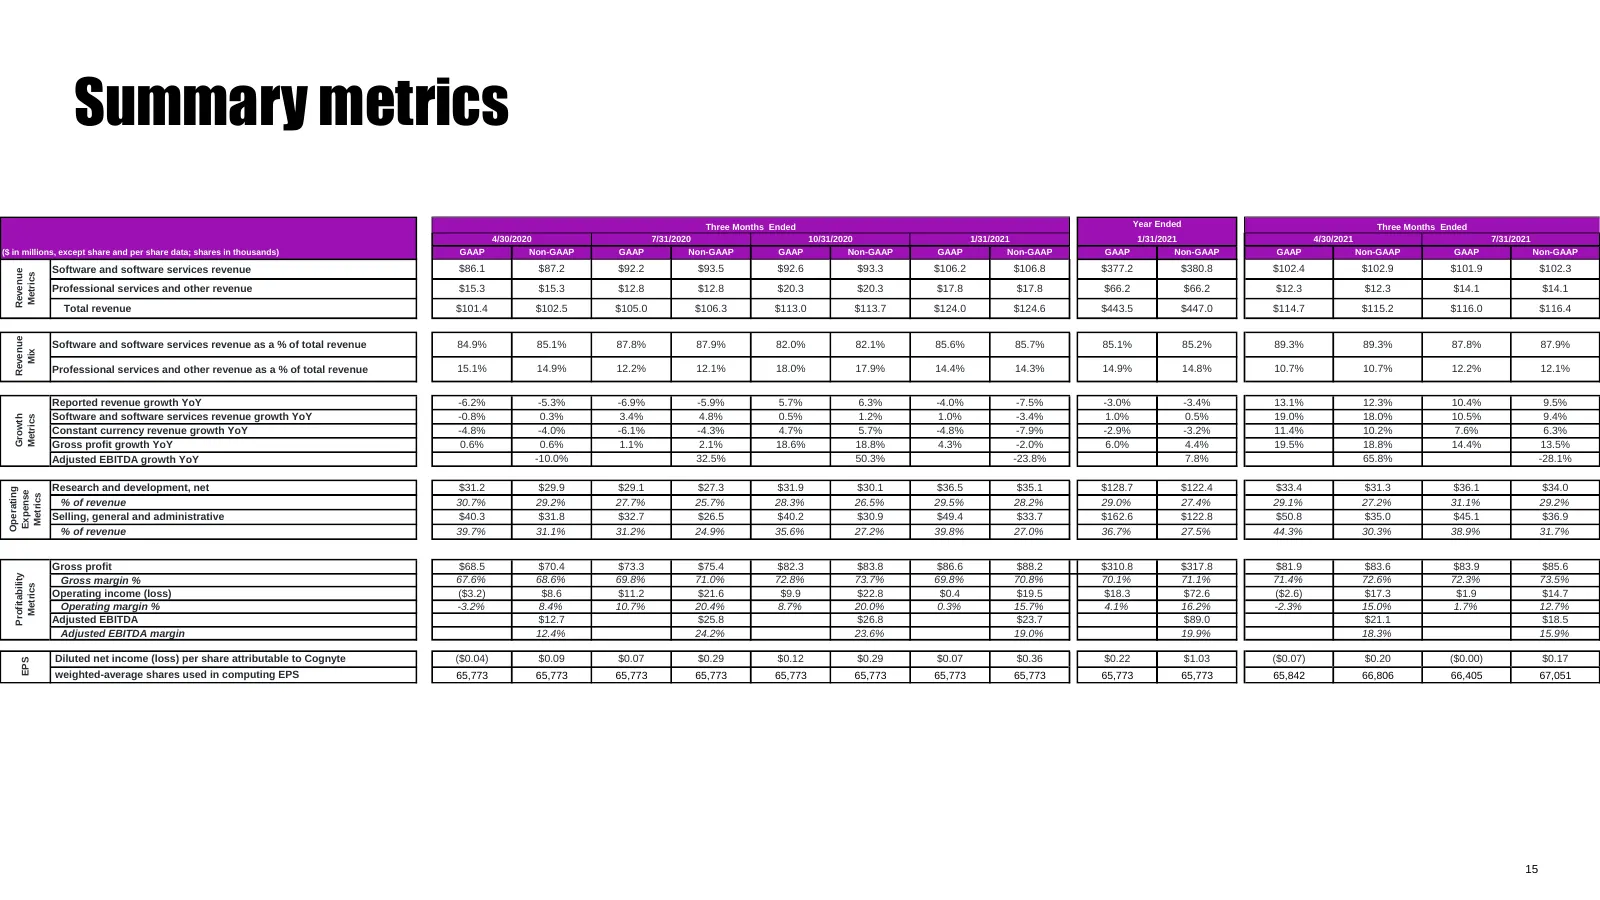
Slide 15: Summary metrics
Summary metrics Three Months Ended Year Ended Three Months Ended 4/30/2020 7/31/2020 10/31/2020 1/31/2021 1/31/2021 4/30/2021 7/31/2021 ($ in millions, except share and per share data; shares in thousands) GAAP Non-GAAP GAAP Non-GAAP GAAP Non-GAAP GAAP Non-GAAP GAAP Non-GAAP GAAP Non-GAAP GAAP Non-G
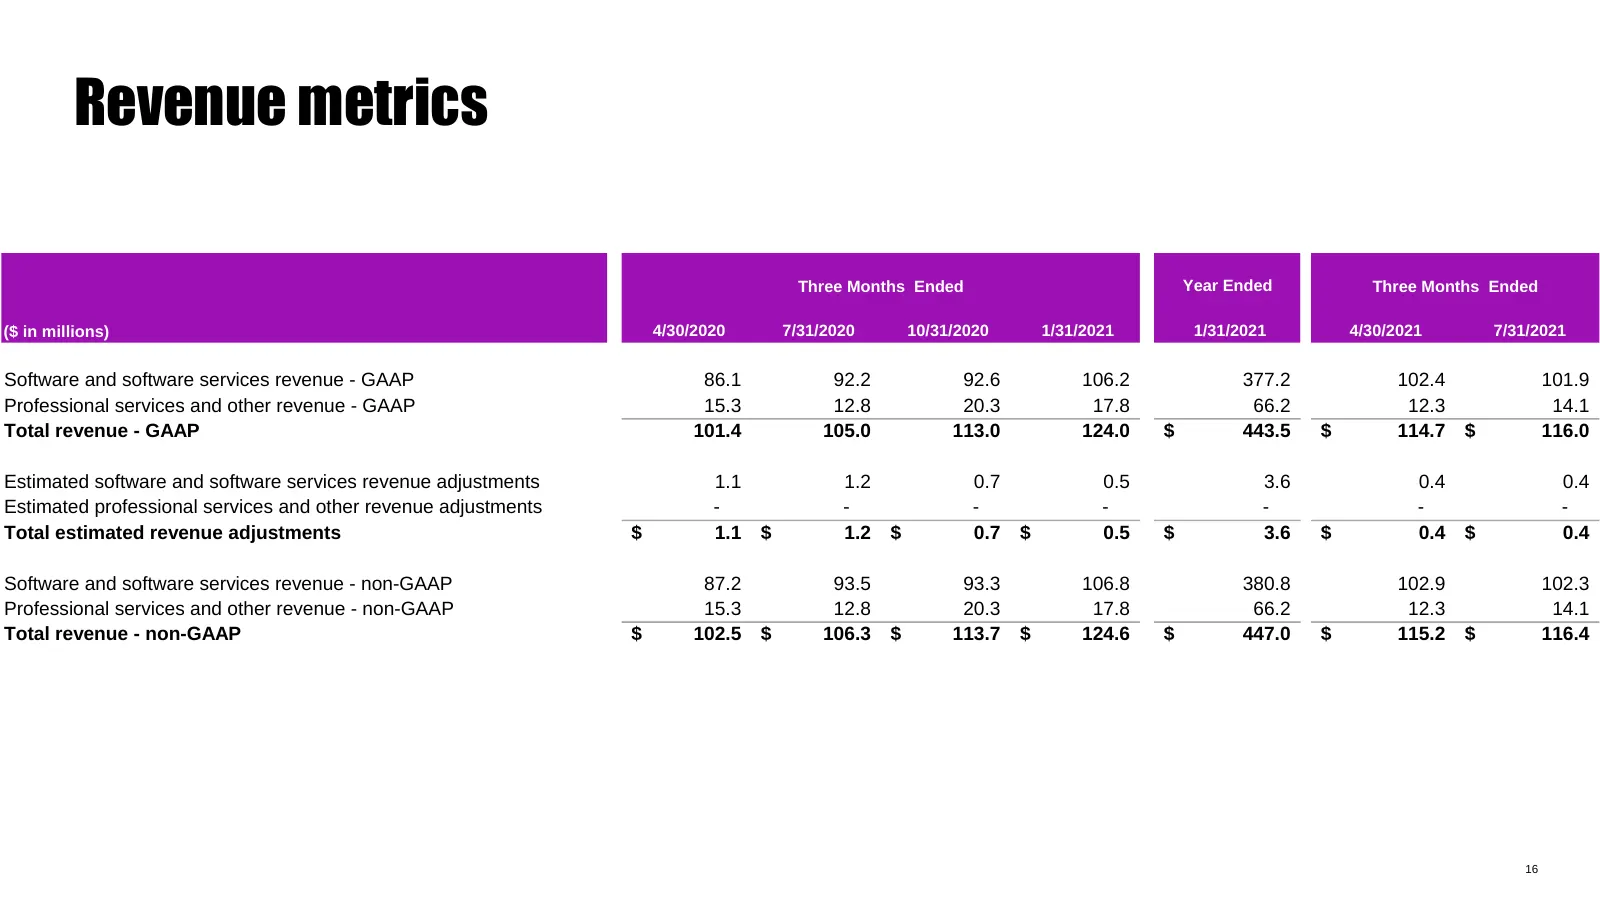
Slide 16: Revenue metrics
Revenue metrics Three Months Ended Year Ended Three Months Ended ($ in millions) 4/30/2020 7/31/2020 10/31/2020 1/31/2021 1/31/2021 4/30/2021 7/31/2021 Software and software services revenue - GAAP 86.1 92.2 92.6 106.2 377.2 102.4 101.9 Professional services and other revenue - GAAP 15.3 12.8 20.3 1
Slide 17: Constant currency metrics
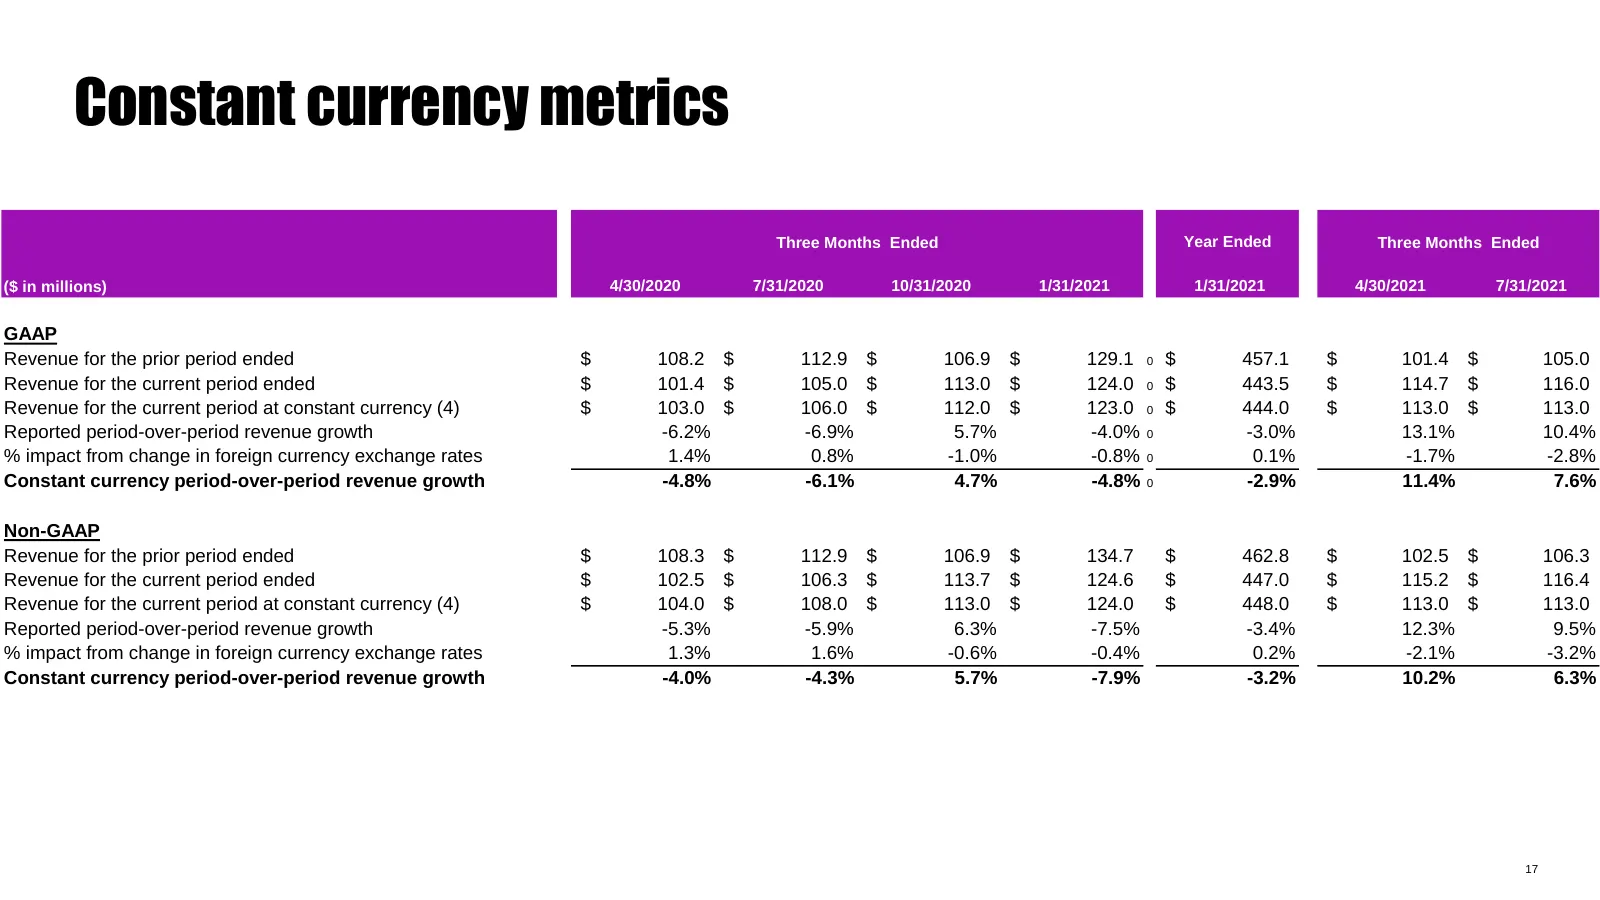
Constant currency metrics Three Months Ended Year Ended Three Months Ended ($ in millions) 4/30/2020 7/31/2020 10/31/2020 1/31/2021 1/31/2021 4/30/2021 7/31/2021 GAAP Revenue for the prior period ended $ 108.2 $ 112.9 $ 106.9 $ 129.1 0 $ 457.1 $ 101.4 $ 105.0 Revenue for the current period ended $ 1
Slide 18: Gross profit
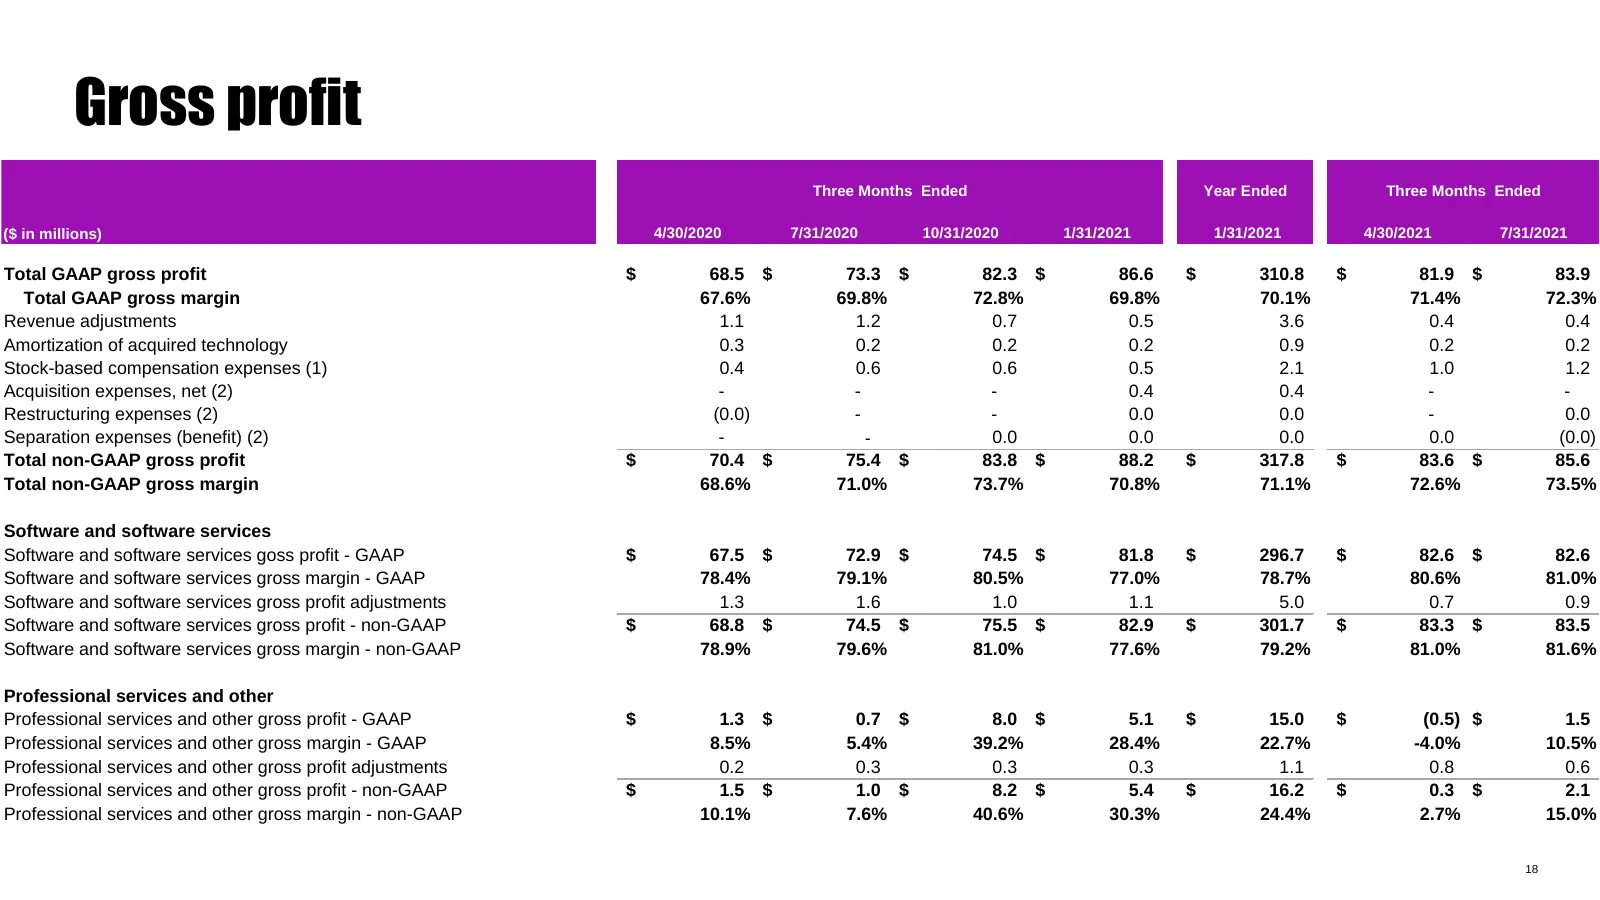
Gross profit Three Months Ended Year Ended Three Months Ended ($ in millions) 4/30/2020 7/31/2020 10/31/2020 1/31/2021 1/31/2021 4/30/2021 7/31/2021 Total GAAP gross profit $ 68.5 $ 73.3 $ 82.3 $ 86.6 $ 310.8 $ 81.9 $ 83.9 Total GAAP gross margin 67.6% 69.8% 72.8% 69.8% 70.1% 71.4% 72.3% Revenue adj
Slide 19: Operating expenses
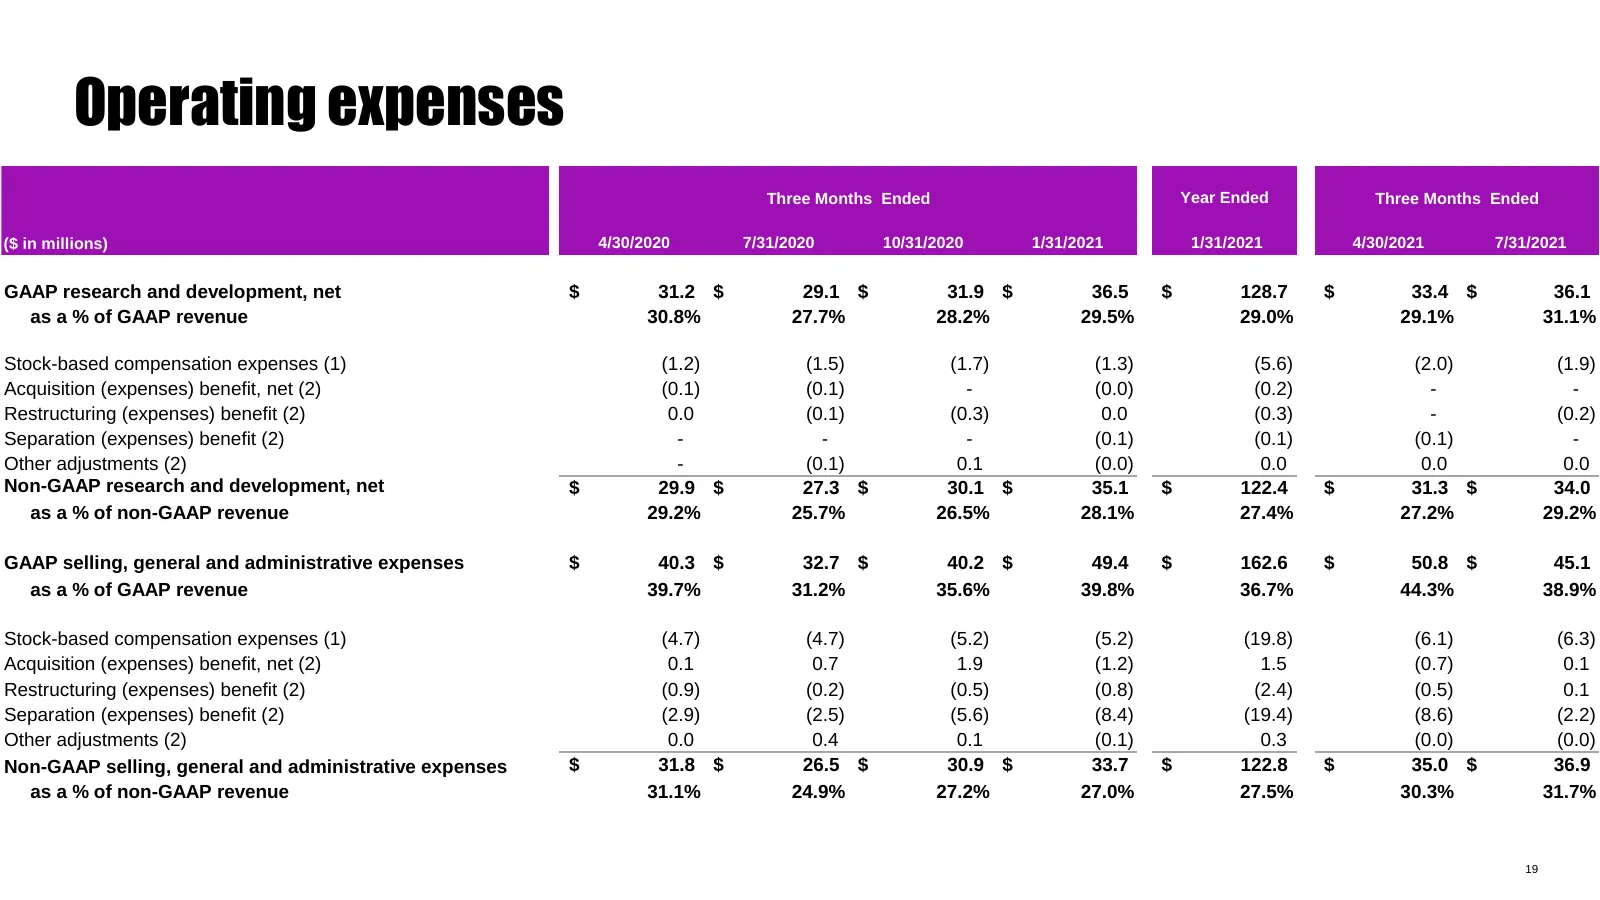
Operating expenses Three Months Ended Year Ended Three Months Ended ($ in millions) 4/30/2020 7/31/2020 10/31/2020 1/31/2021 1/31/2021 4/30/2021 7/31/2021 GAAP research and development, net $ 31.2 $ 29.1 $ 31.9 $ 36.5 0 $ 128.7 $ 33.4 $ 36.1 as a % of GAAP revenue 30.8% 27.7% 28.2% 29.5% 0 29.0% 29.
Slide 20: Operating and EBITDA margins
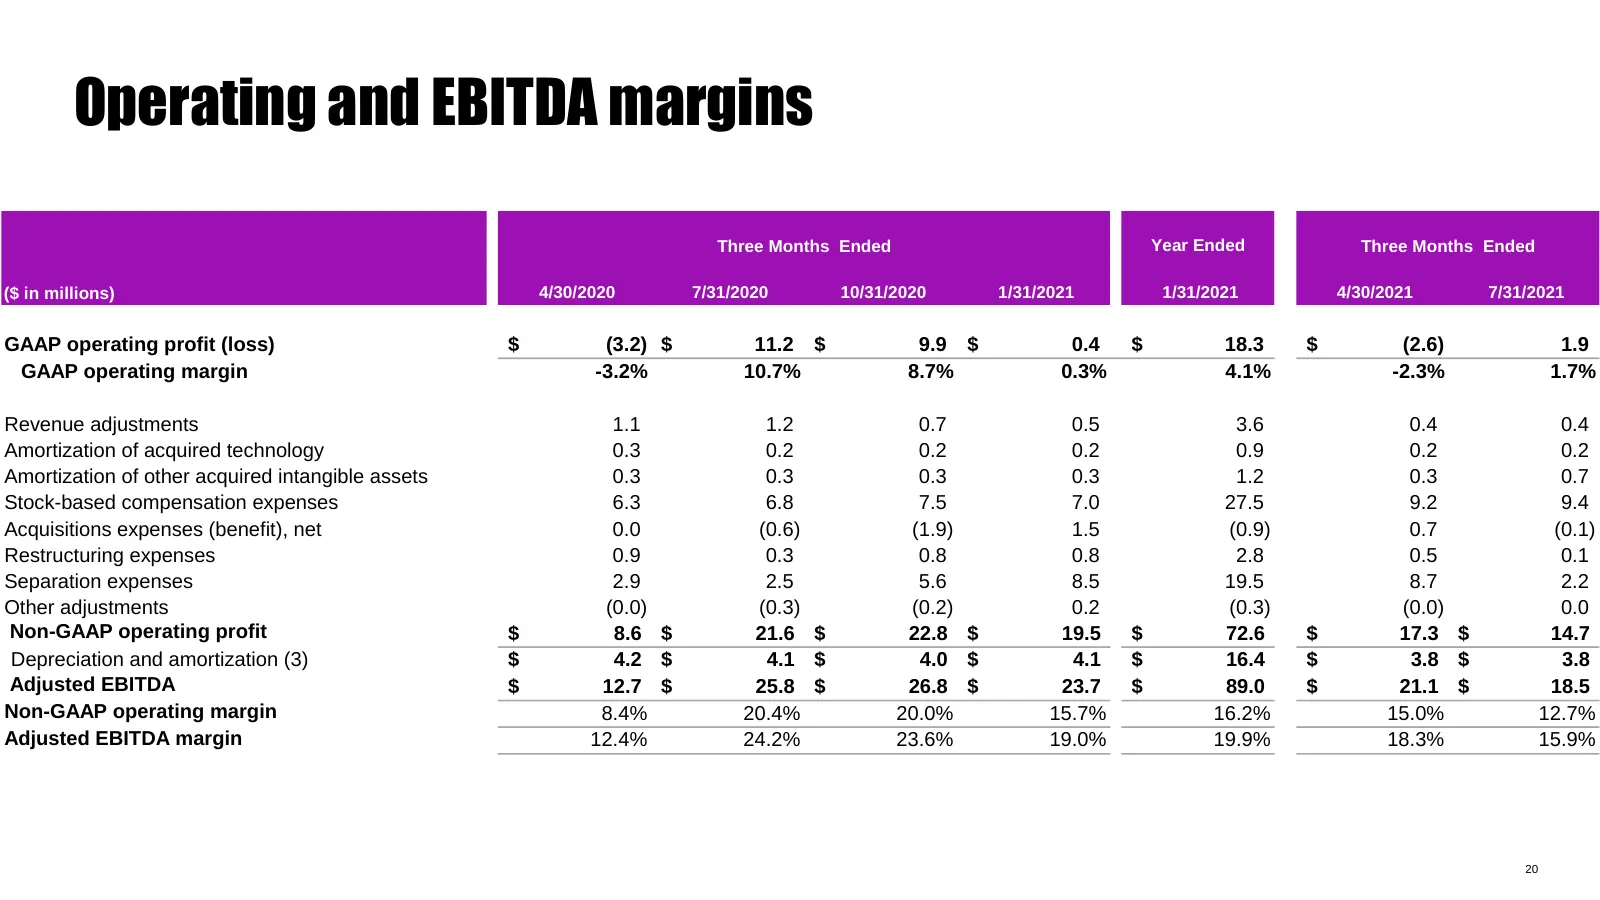
Operating and EBITDA margins Three Months Ended Year Ended Three Months Ended ($ in millions) 4/30/2020 7/31/2020 10/31/2020 1/31/2021 1/31/2021 4/30/2021 7/31/2021 GAAP operating profit (loss) $ (3.2) $ 11.2 $ 9.9 $ 0.4 $ 18.3 $ (2.6) 1.9 GAAP operating margin -3.2% 10.7% 8.7% 0.3% 4.1% -2.3% 1.7%
Slide 21: Other expense, tax and net income
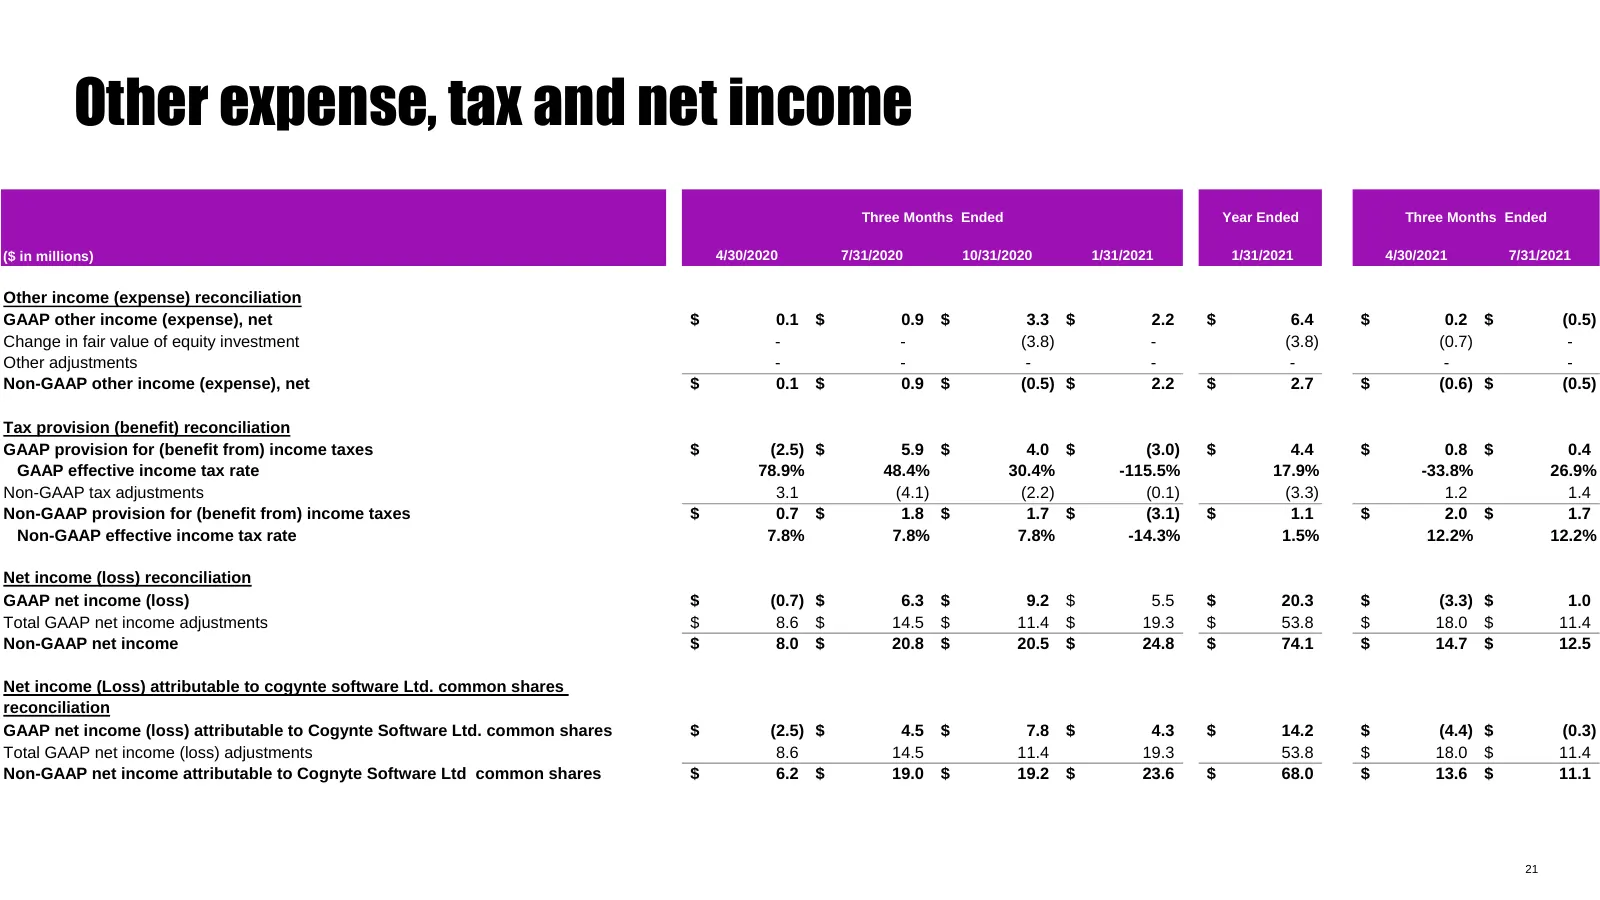
Other expense, tax and net income Three Months Ended Year Ended Three Months Ended ($ in millions) 4/30/2020 7/31/2020 10/31/2020 1/31/2021 1/31/2021 4/30/2021 7/31/2021 Other income (expense) reconciliation GAAP other income (expense), net 0 $ 0.1 $ 0.9 $ 3.3 $ 2.2 0 $ 6.4 $ 0.2 $ (0.5) Change in f
Slide 22: EPS
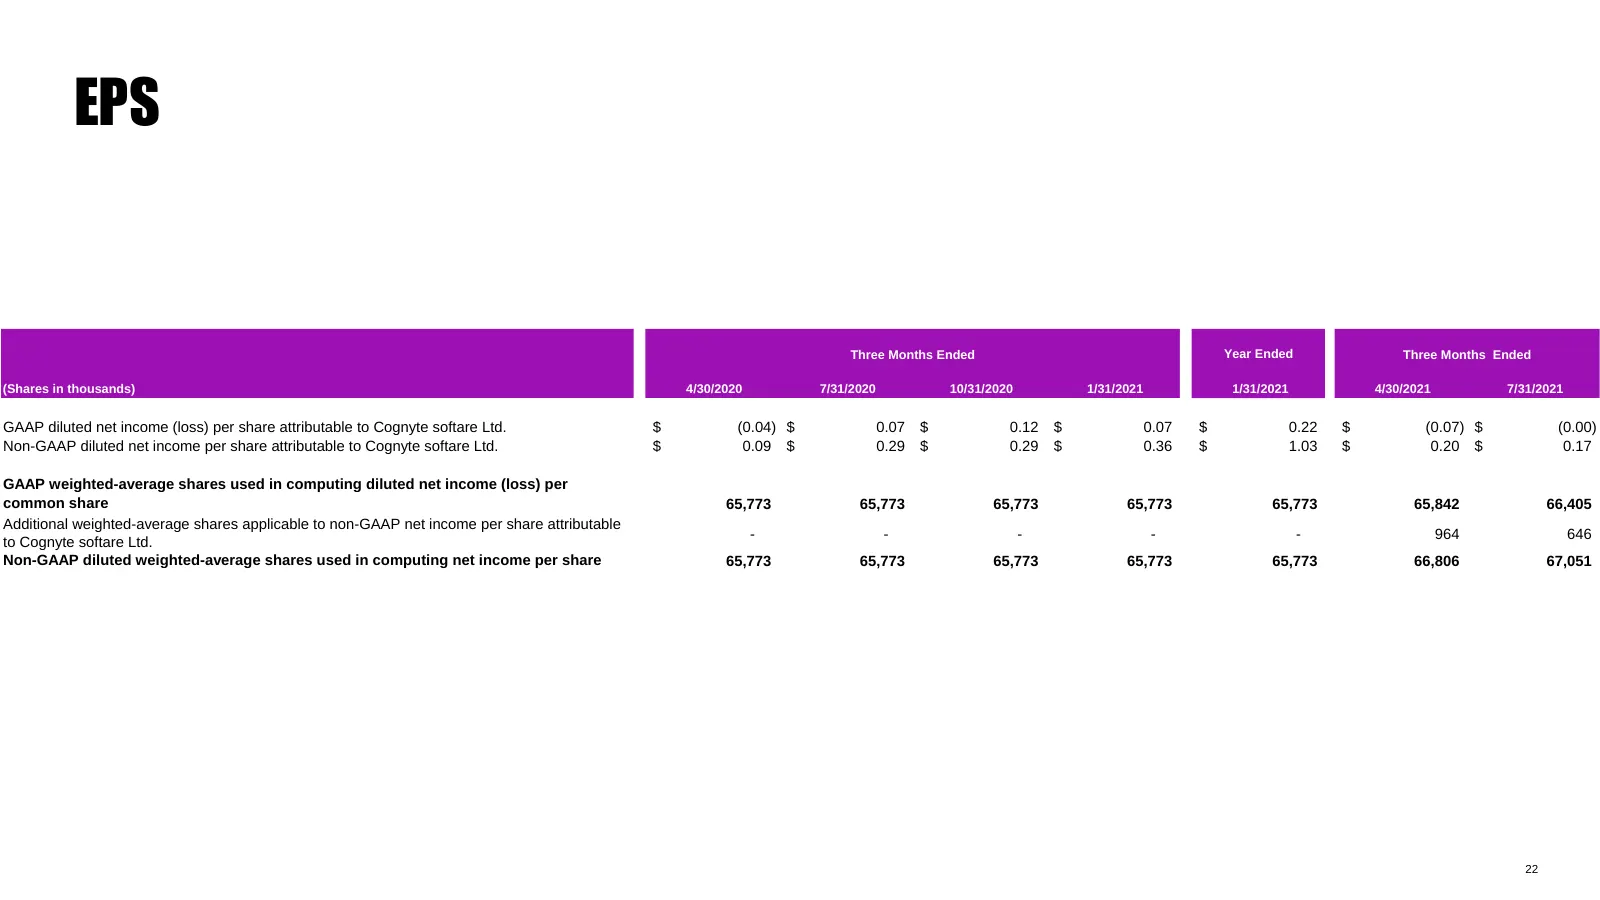
EPS Three Months Ended Year Ended Three Months Ended (Shares in thousands) 4/30/2020 7/31/2020 10/31/2020 1/31/2021 1/31/2021 4/30/2021 7/31/2021 GAAP diluted net income (loss) per share attributable to Cognyte softare Ltd. $ (0.04) $ 0.07 $ 0.12 $ 0.07 $ 0.22 $ (0.07) $ (0.00) Non-GAAP diluted net
Slide 23: Footnotes
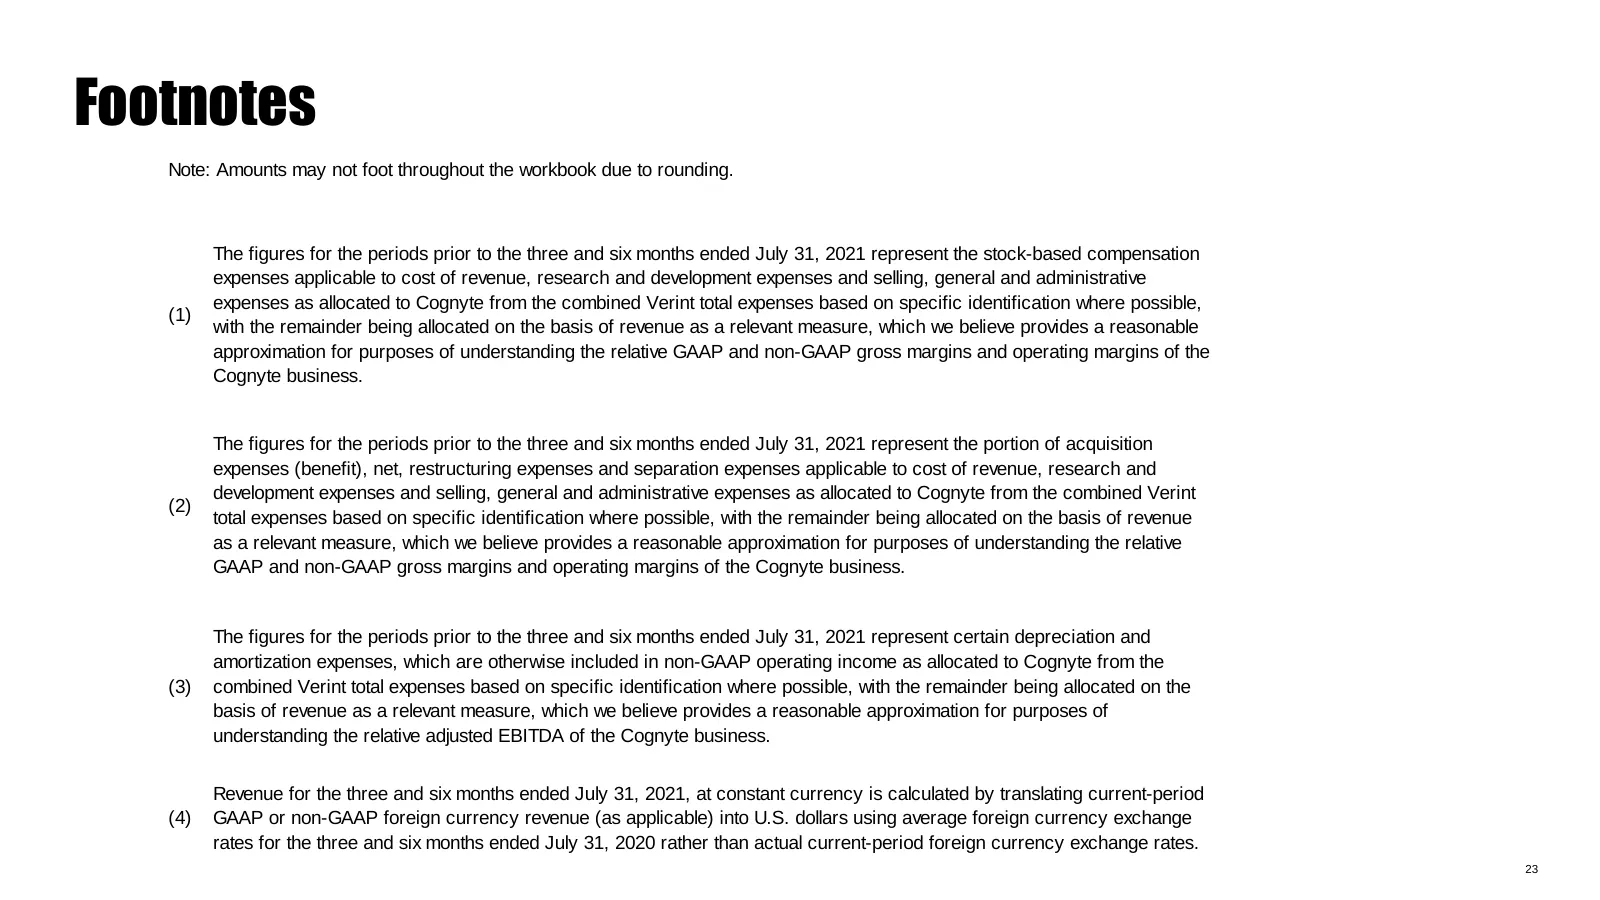
Footnotes Note: Amounts may not foot throughout the workbook due to rounding. The figures for the periods prior to the three and six months ended July 31, 2021 represent the stock-based compensation expenses applicable to cost of revenue, research and development expenses and selling, general and ad
Slide 24: Supplemental information and non-GAAP measures
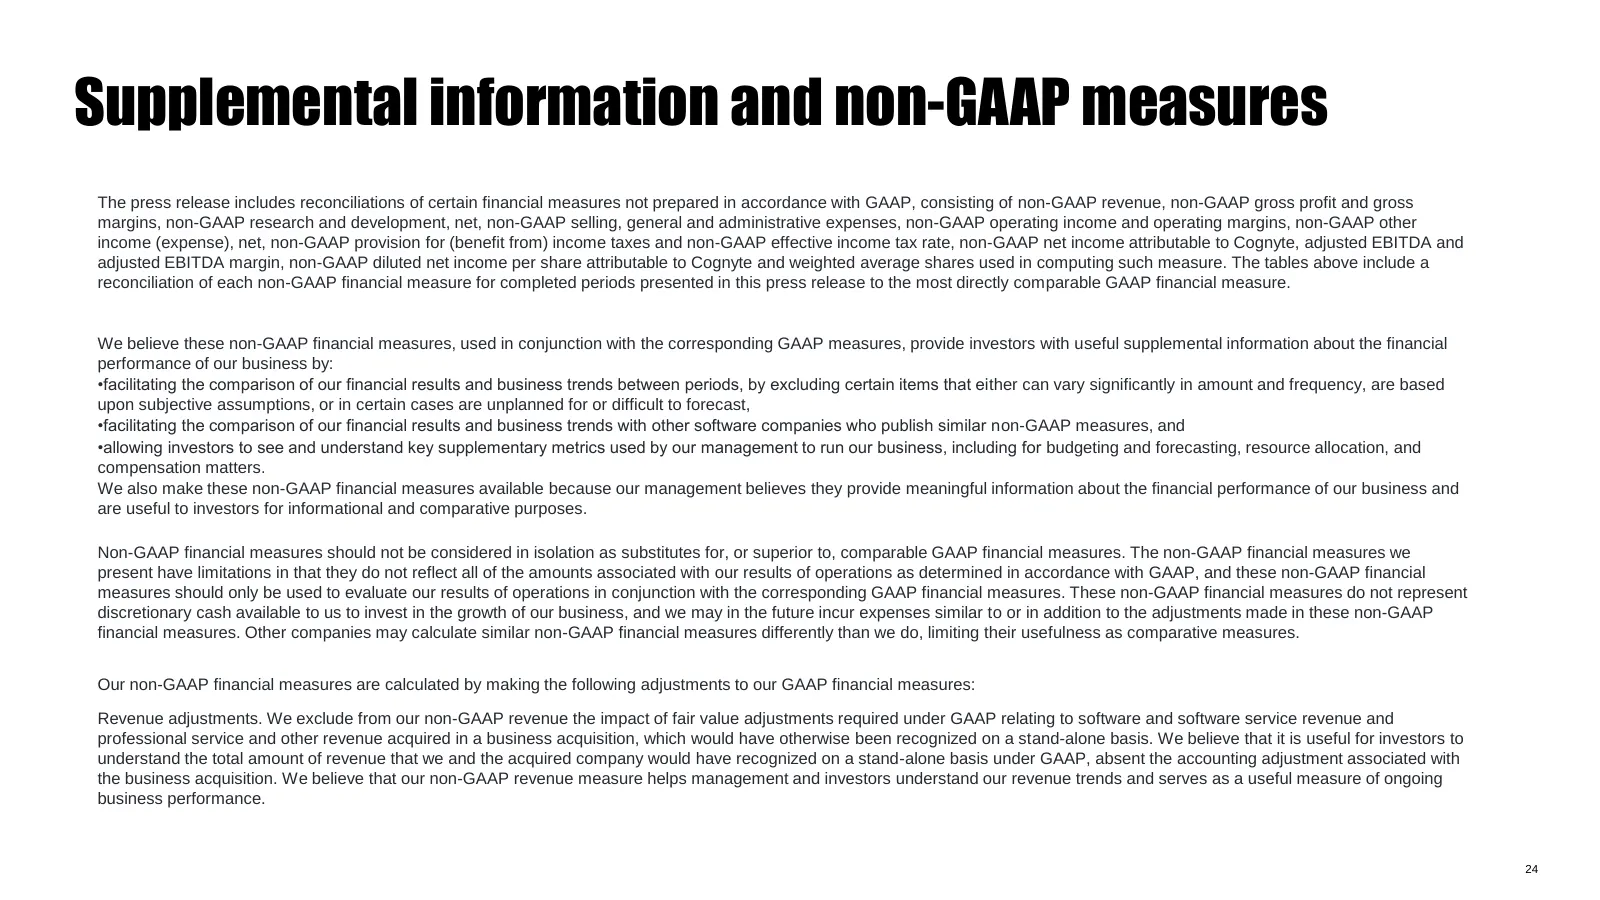
Supplemental information and non-GAAP measures The press release includes reconciliations of certain financial measures not prepared in accordance with GAAP, consisting of non-GAAP revenue, non-GAAP gross profit and gross margins, non-GAAP research and development, net, non-GAAP selling, general and
Slide 25: Supplemental information and non-GAAP measures
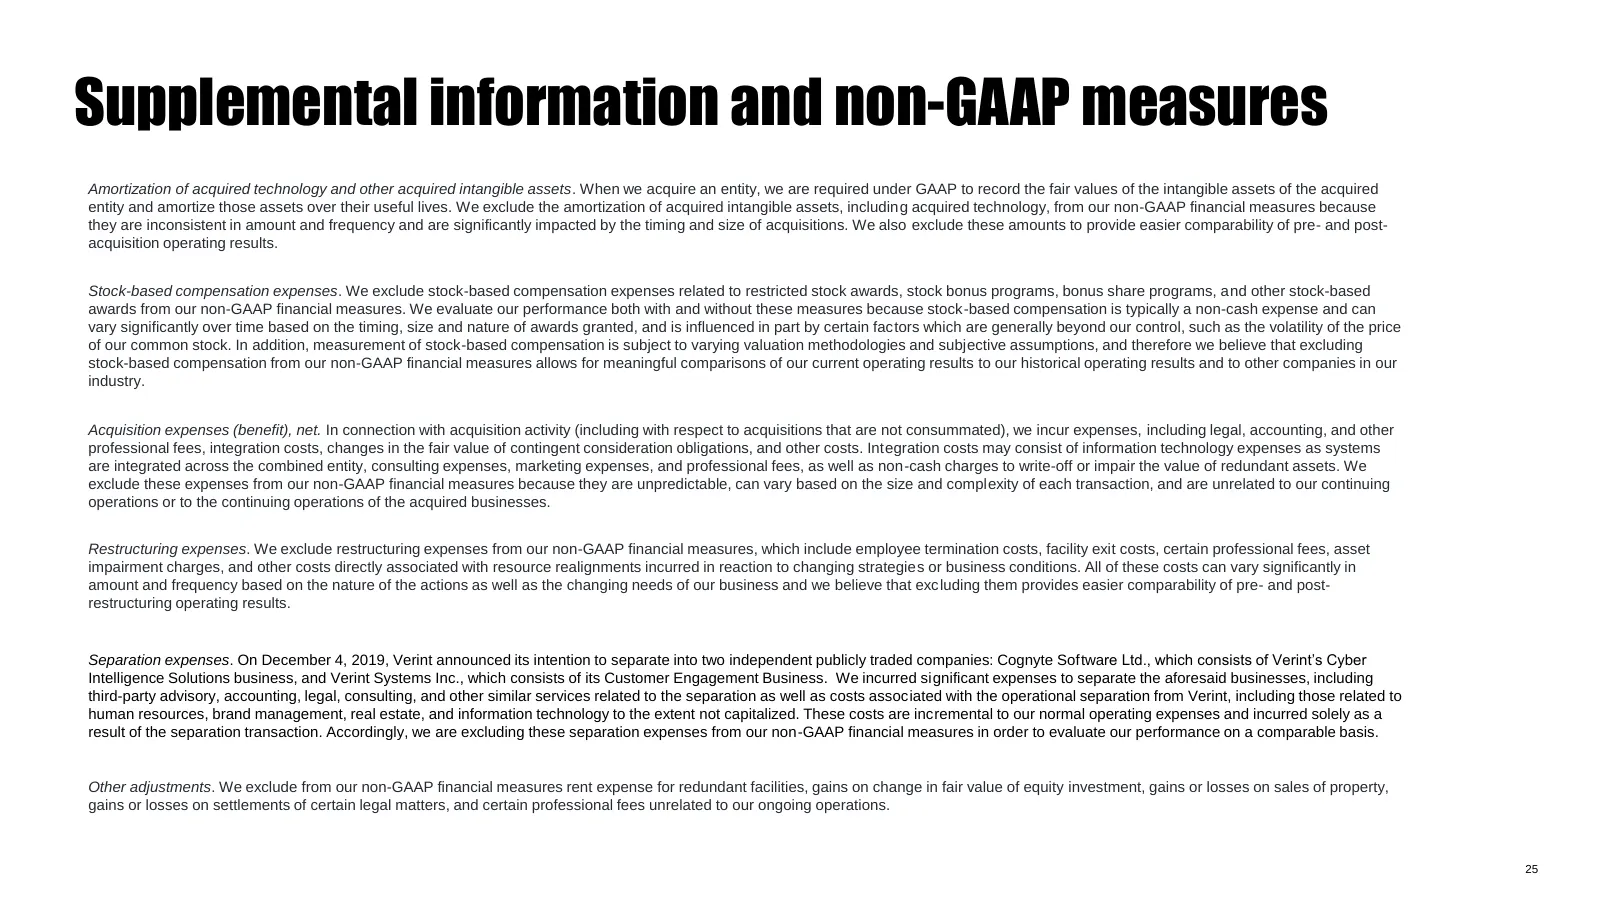
Supplemental information and non-GAAP measures Amortization of acquired technology and other acquired intangible assets. When we acquire an entity, we are required under GAAP to record the fair values of the intangible assets of the acquired entity and amortize those assets over their useful lives.
Slide 26: Supplemental information and non-GAAP measures
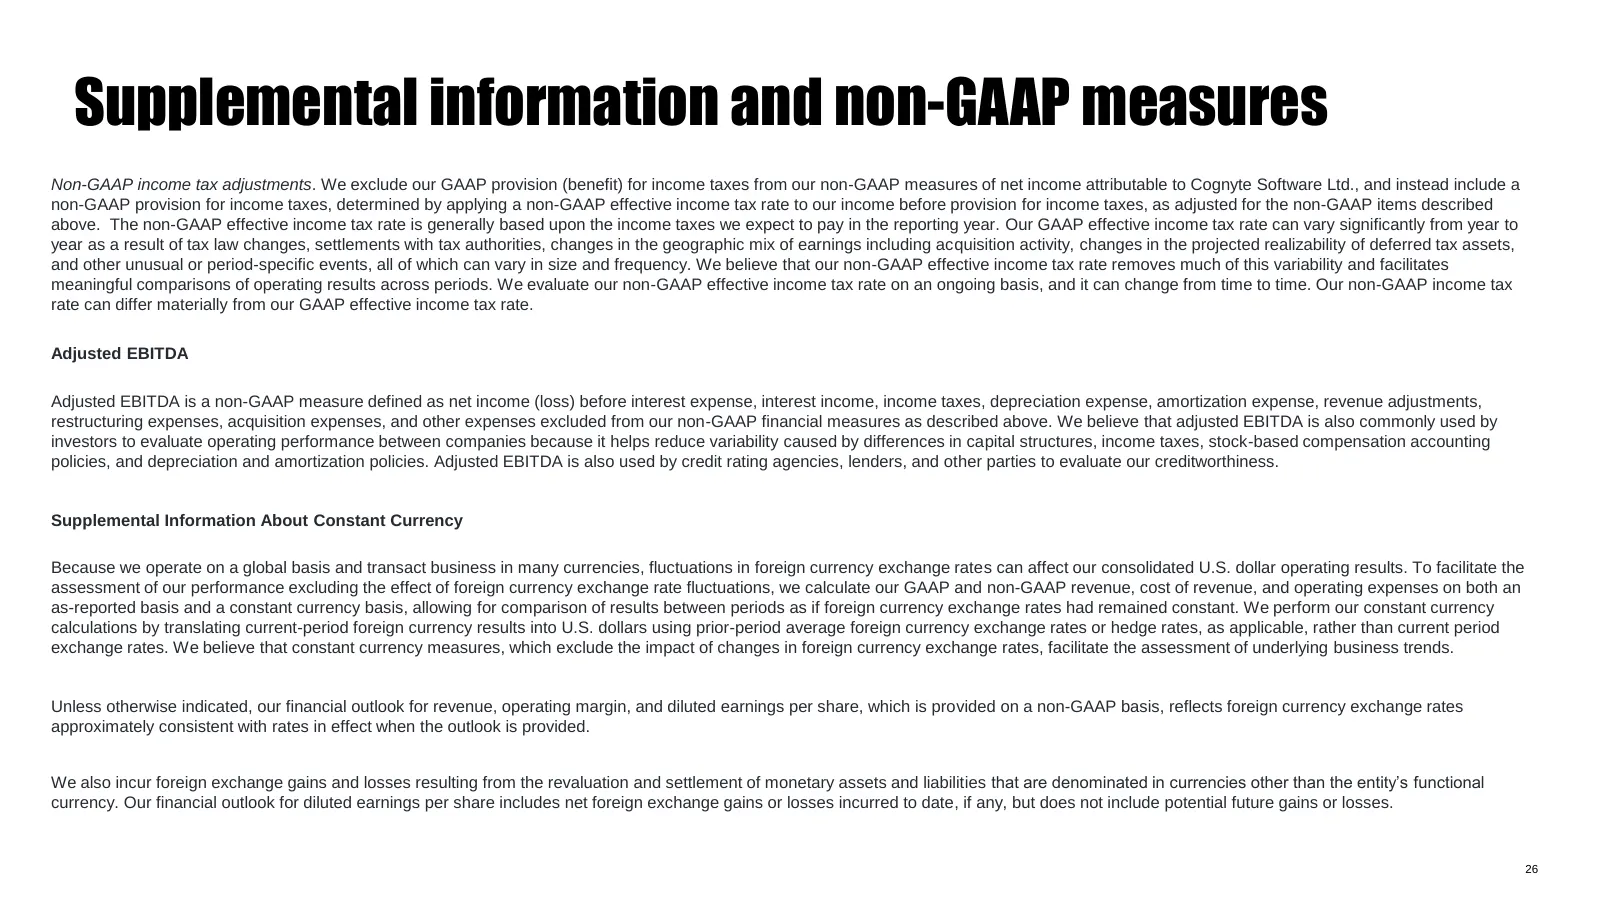
Supplemental information and non-GAAP measures Non-GAAP income tax adjustments. We exclude our GAAP provision (benefit) for income taxes from our non-GAAP measures of net income attributable to Cognyte Software Ltd., and instead include a non-GAAP provision for income taxes, determined by applying a
Source: Internet Archive copy of cognyte.com
More decks from Cognyte Software Ltd.
 Q2 FYE27 Earnings Presentation20 slides · Sep 9, 2026
 Investor Presentation (September 2026)22 slides · September 2026
 Q1 2027 Earnings Presentation17 slides · Jun 3, 2026
 Investor Presentation (June 2026)20 slides · June 2026
 Cognyte — Investor Presentation (April 2026)21 slides · April 2026
 Cognyte — Investor Presentation (April 2026)20 slides · April 2026