Alpha Natural Resources — Credit Suisse North American Metals and Mining Conference (November 2011)
29 slides from Alpha Natural Resources's conference presentation, Nov 15, 2011
Slide 1: Credit Suisse North American Metals and Mining Conference
Credit Suisse North American Metals and Mining Conference ToddAllen VP, Investor Relations
Slide 2: Forward-Looking Statements
A Alpha Natural Resources £ Ipha Forward-Looking Statements Statements in this presentation which are not statements of historical fact are “forwardJooking statements” within the Safe Harbor provision of the Private Securities Litigation Reform Act of 1995. Such statements are not guarantees of futu
Slide 3: Leading U.S. Producer with Global Reach
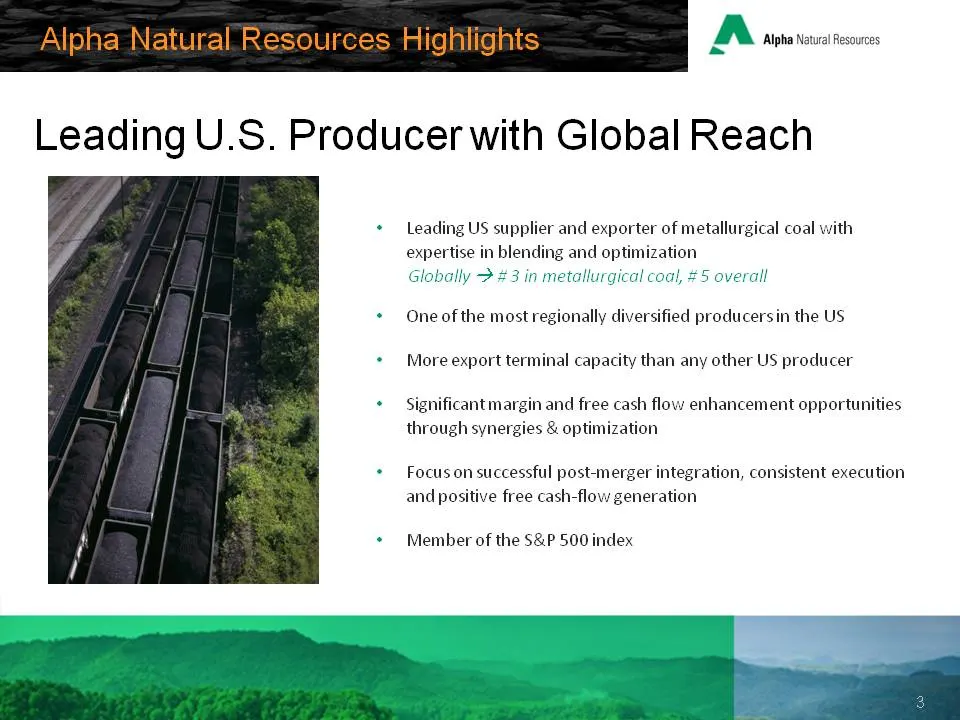
A Alpha Natural Resources ~ Leading U.S. Producer with Global Reach + Leading US supplier and exporter of metallurgical coal with expertise in blending and optimization = > + One of the most regionally diversified producersin the US + More export terminal capacity than any other US producer + Signif

Slide 4: ian :
— a ian :
Slide 5: Number of Years When Fuel Led Annual Growth
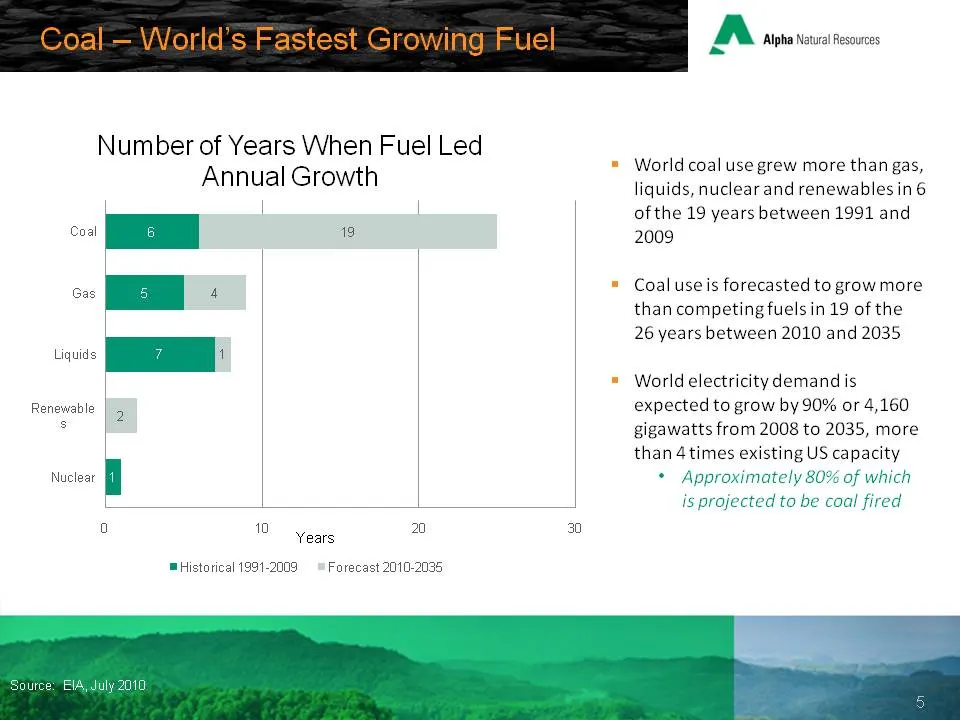
Number of Years When Fuel Led Annual Growth | Coal 19 Gas 4 Renewable 2 s Nuclear | i a fe Years a Historical 1931-2009 * Forecast 2010-2035 30 A Alpha Natural Resources ~ World coal use grew more than gas, liquids, nuclear and renewables in 6 of the 19 years between 1991 and 2009 Coal use is foreca
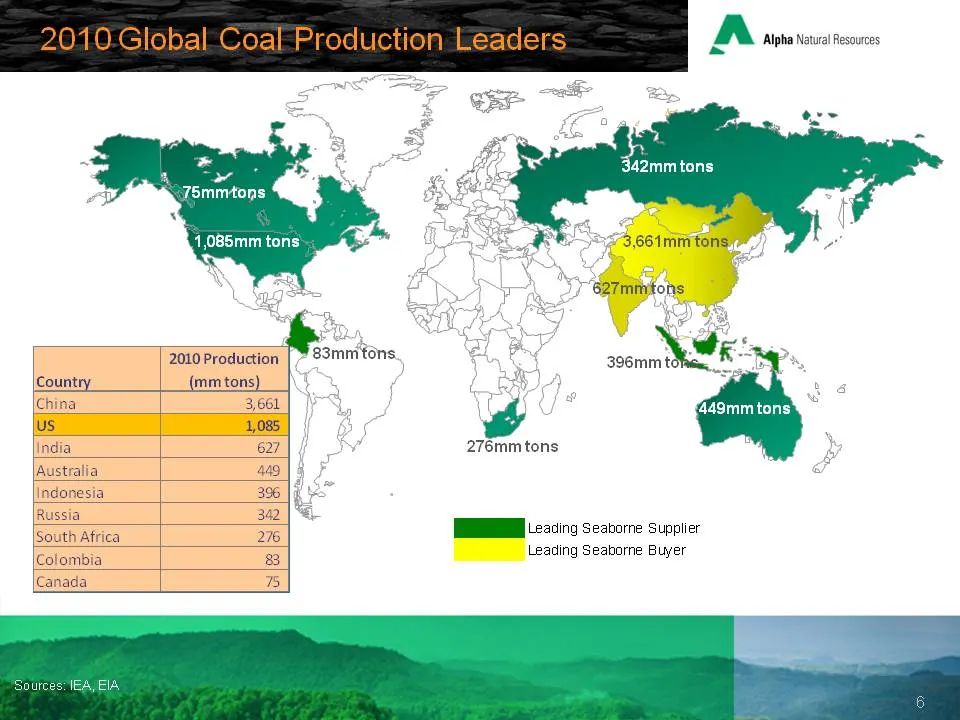
Slide 6: Global coal production and leading seaborne buyers and suppliers
A. Natural Re £ Ipha Natural Resources 4 75mmtons ars , Js 62Tminitons 2010 Production | Country (mmtons) _|\¢ China 3,661 | | us india 276mm tons ‘Australia indonesia Russia \South Africa 216 HE e2cing seabore supplier Leading Seaborne Buyer Colombia 83 Canada B
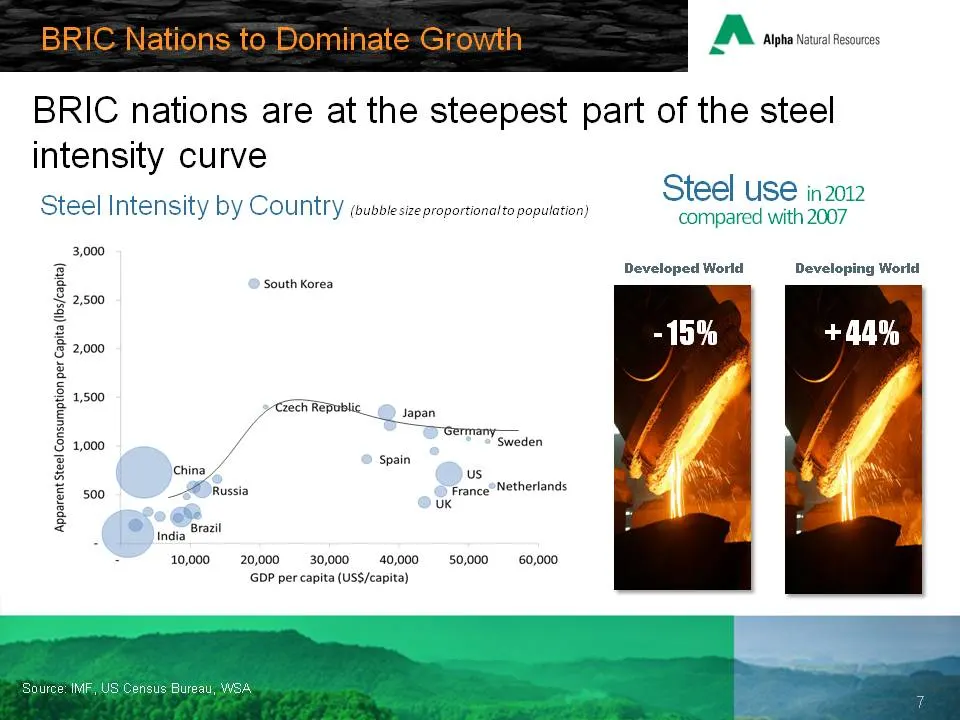
Slide 7: BRIC nations are at the steepest part of the steel intensity curve
a A Alpha Natural Resources ~ BRIC nations are at the steepest part of the steel intensity curve Steel Intensity by Country (oubbiesize proportion Steel Use in2012 compared with 2007 opulation) 3,000 Developed World Developing World South Korea 2,500 2,000 1,500 — y/ Cech Repoblic_© sapan / "ar Germ
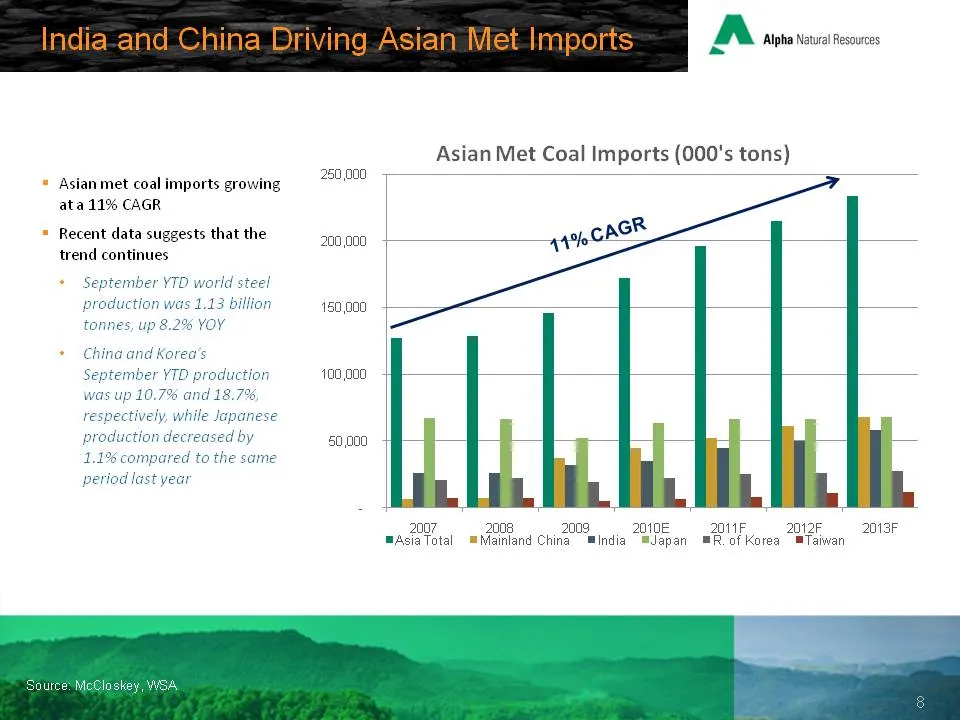
Slide 8: Asian met coal imports growing at a 11% CAGR
© Asian met coal imports growing ata 11% CAGR * Recent data suggests that the trend continues + September YTD world ste production was 1.13 bill 65, up 8.2% YOY D production was up 10.7% and 18.7%, production decreased by 1.1% compared to t period last year 250,000 200,000 160,000 700,000 0,000 As N
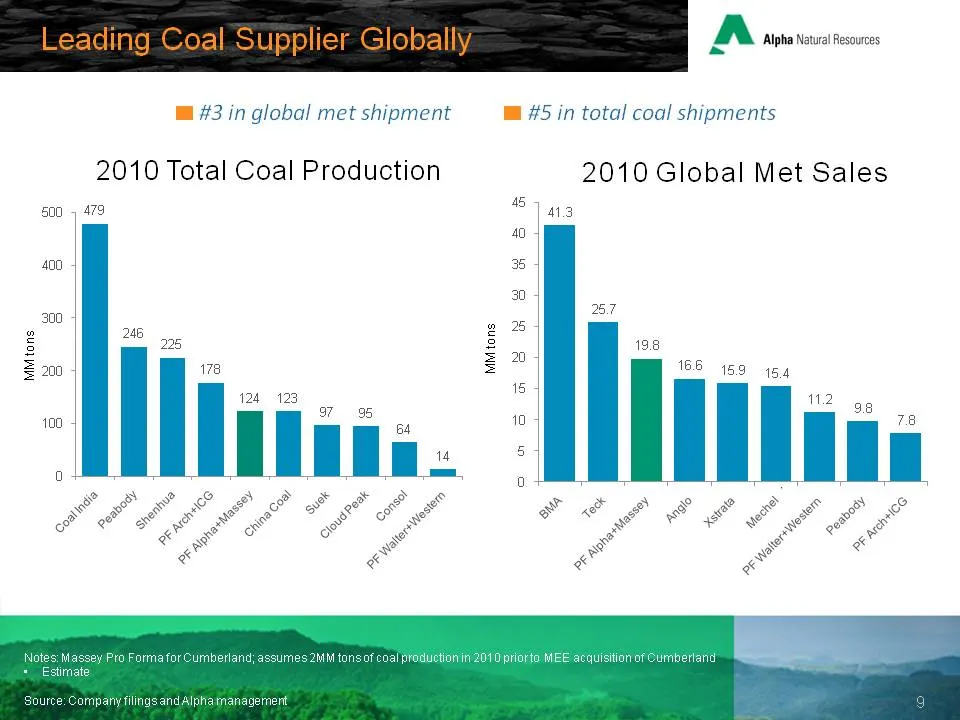
Slide 9: #3 in global met shipment, #5 in total coal shipments
A Alpha Natural Resources - 124 123 i #3 in global met shipment @ #5 in total coal shipments 2010 Total Coal Production 2010 Global Met Sales 00 5 479 [iit i | 400 36 30 | o 300 2 % | Bz s 228 s | | = 20 178 2 2 | | ‘Cumberland, al pr priorto MEE acquis indAlnhaian
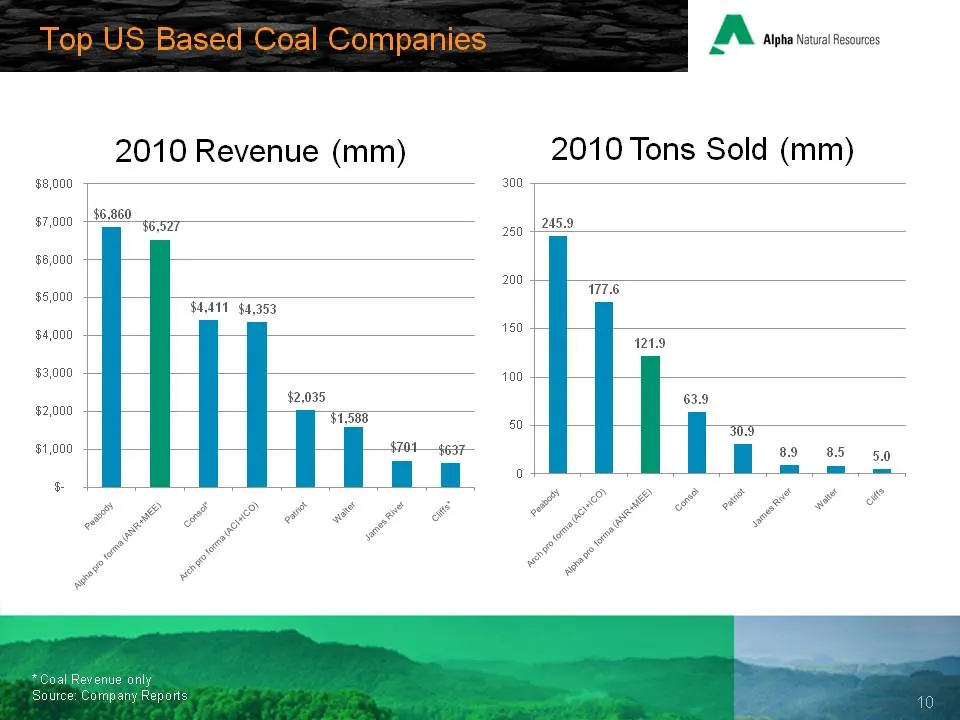
Slide 10: 2010 Revenue and Tons Sold
A. Natural Re 4 Ipha Natural Resources 2010 Revenue (mm) 2010 Tons Sold (mm) $8,000 300 $7,000 +$6:860 or 245.9 176 MAT §4,353
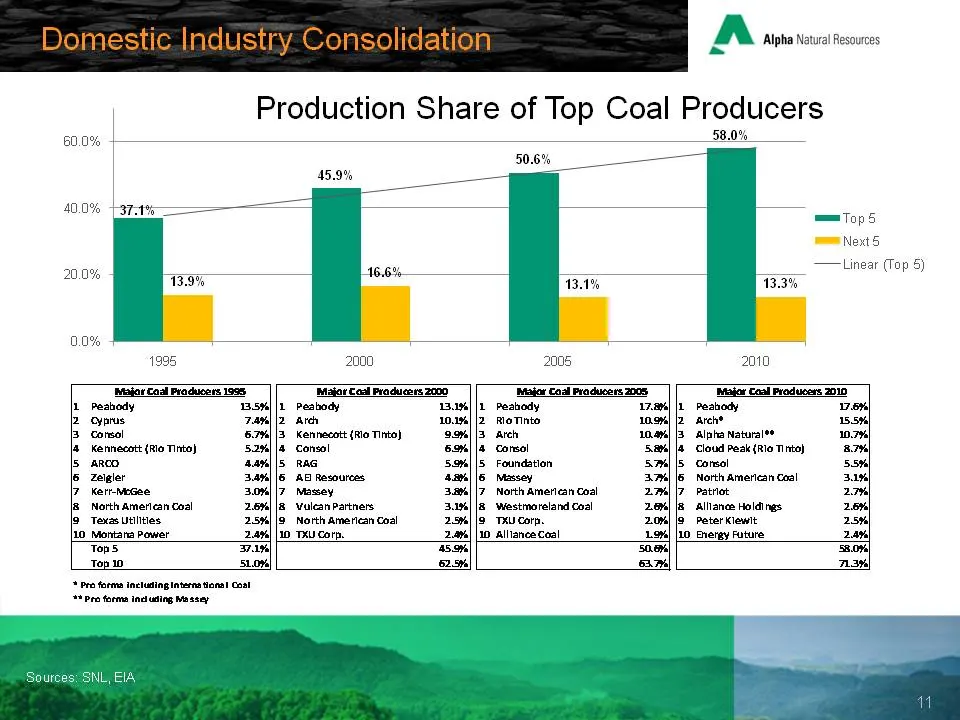
Slide 11: Production Share of Top Coal Producers
A Alpha Natural Resources - Production Share of Top Coal Producers 0% 60.0% 506% 45.9% _—— 10.0% ——= a Tops Next 5 —Linear (Top § 20.0% - 16.6% | u (op 5) : 1.4% : 0.0% J 1996 2000 2005 210 Taercad aS aoc ace E ilar cad aS Dre re Ty bh peabody 135%||1 peatody 13% |i Peshody 17:a4| [1 Peshody ven le
Slide 12: Alpha Natural Resources Overview
Alpha Natural Resources Overview Creating an y Industry Leader
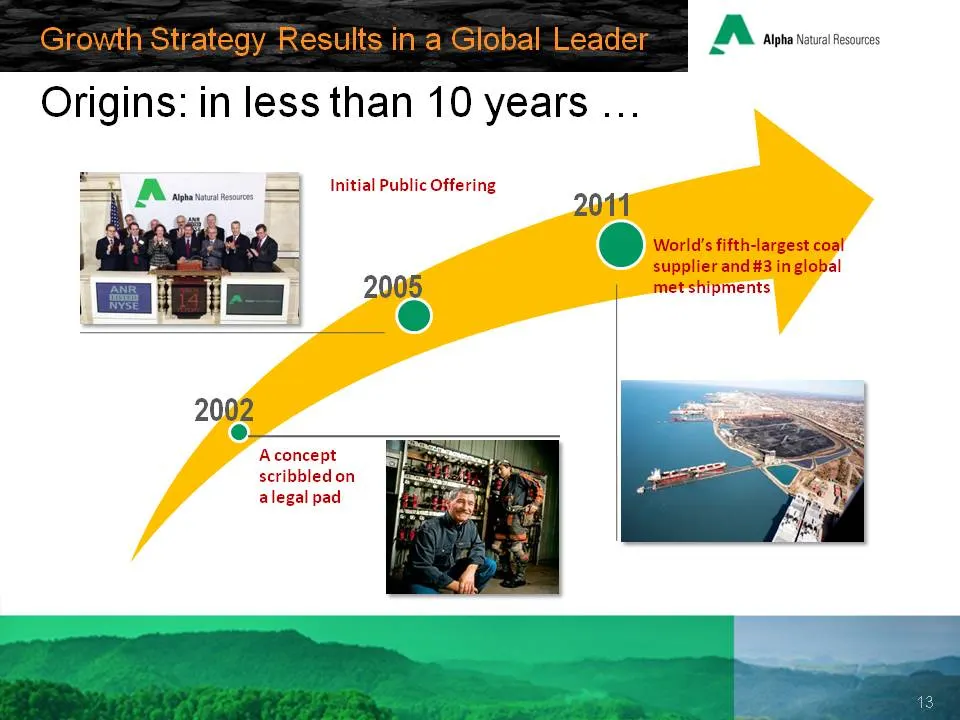
Slide 13: Origins: in less than years ...
r Origins: in less than 10 years ... Initial Public Offering 2011 World's fifth-largest coal supplier and #3 in global 2005 met shipments O) 2002 @ Aconcept scribbled on alegal pad
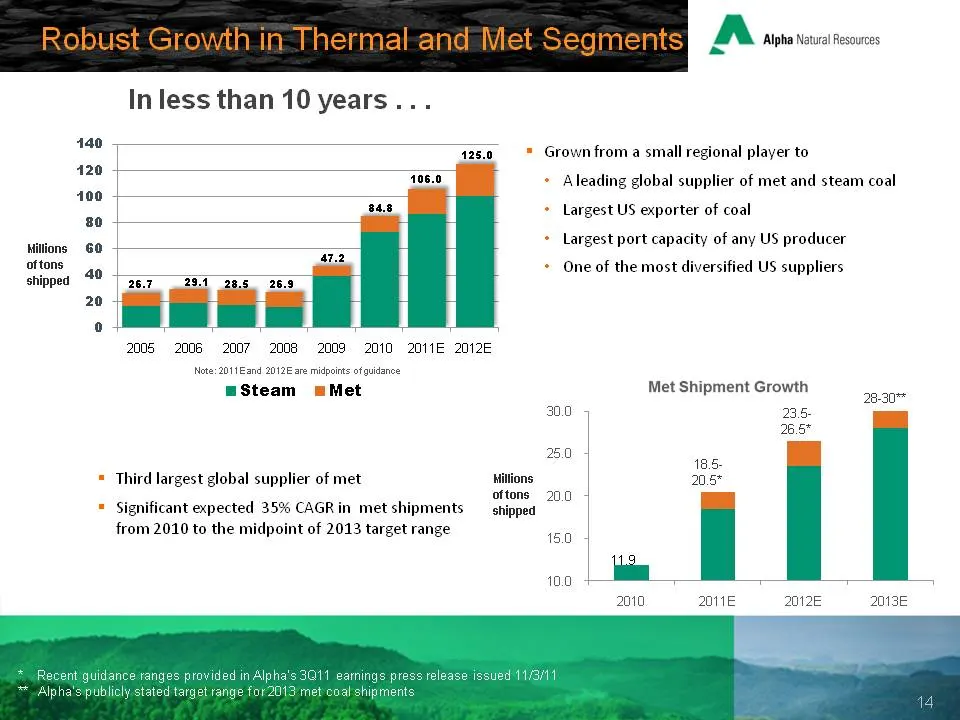
Slide 14: In less than years...
As Natural R 4 Ipha Natural Resources In less than 10 years... 425.0 © Grown from a small regional player to + Aleading global supplier of met and steam coal » Largest US exporter of coal + Largest port capacity of any US producer oftons shipped + One of the most diversified US suppliers 2005 2006 2
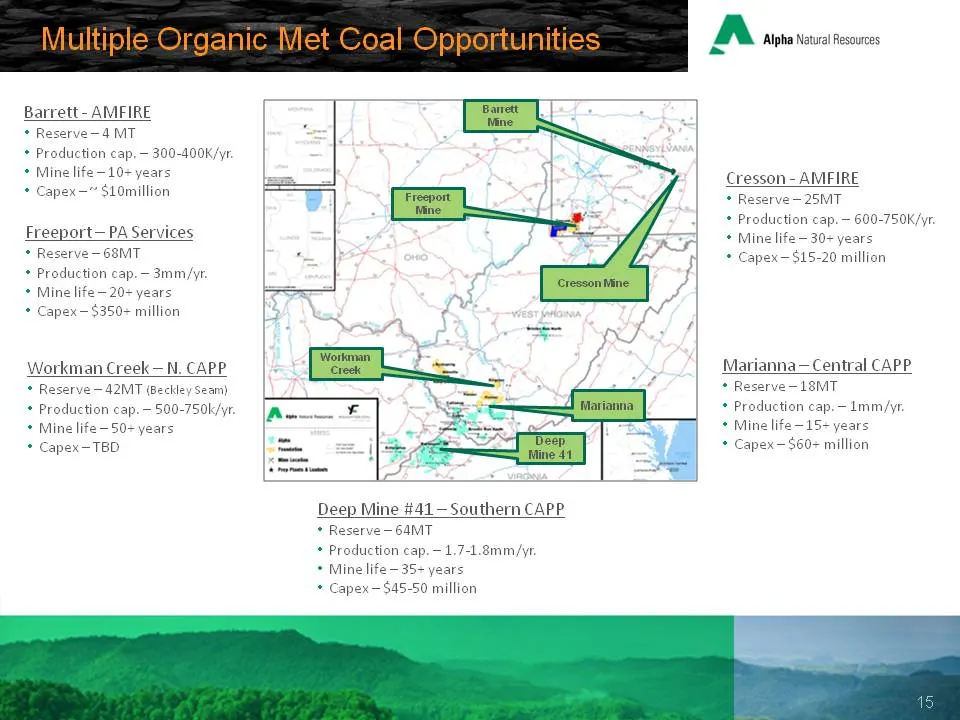
Slide 15: Mine development projects
Barrett - AMFIRE + Reserve—4 MT * Production cap. — 30! + Mine life—10- years * Capex” $L0million K yt Freeport—PA Services * Reserve — 68MT * Production cap.— 3mm/yr. * Mine life * Capex-$35¢ 20+ years million Workman Creek—N. CAPP * Reserve —42MT (Beckley Seam) + Production cap. — 500-750k/yt. * M
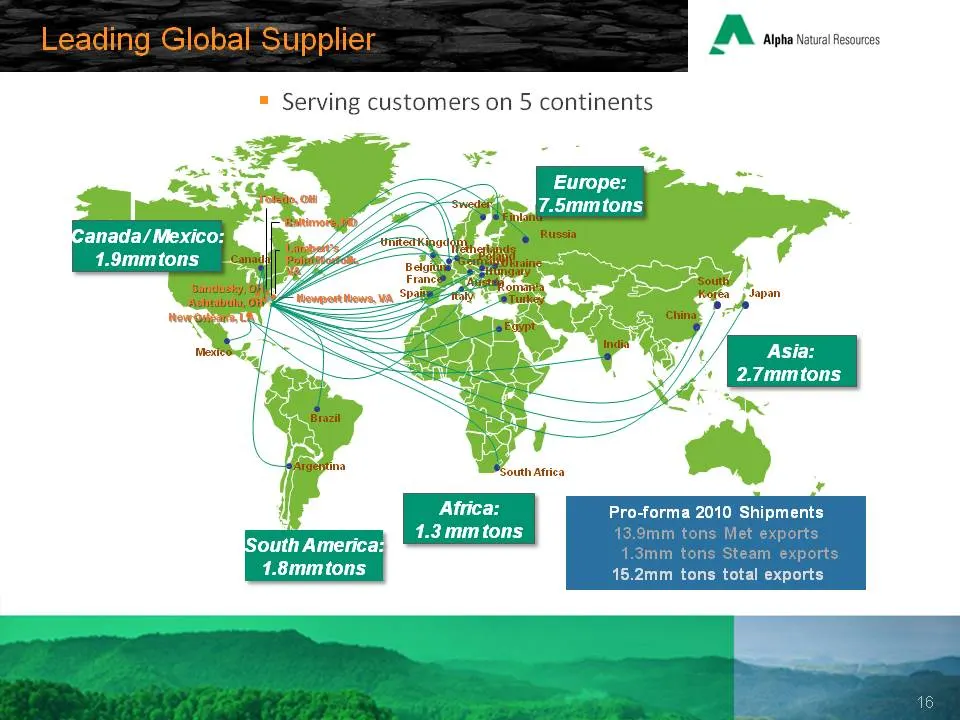
Slide 16: Serving customers on 5 continents
As Natural R r. Ipha Natural Resources = Serving customers on 5 continents Pro-forma 2010 Shipments 15.2mm tons total exports
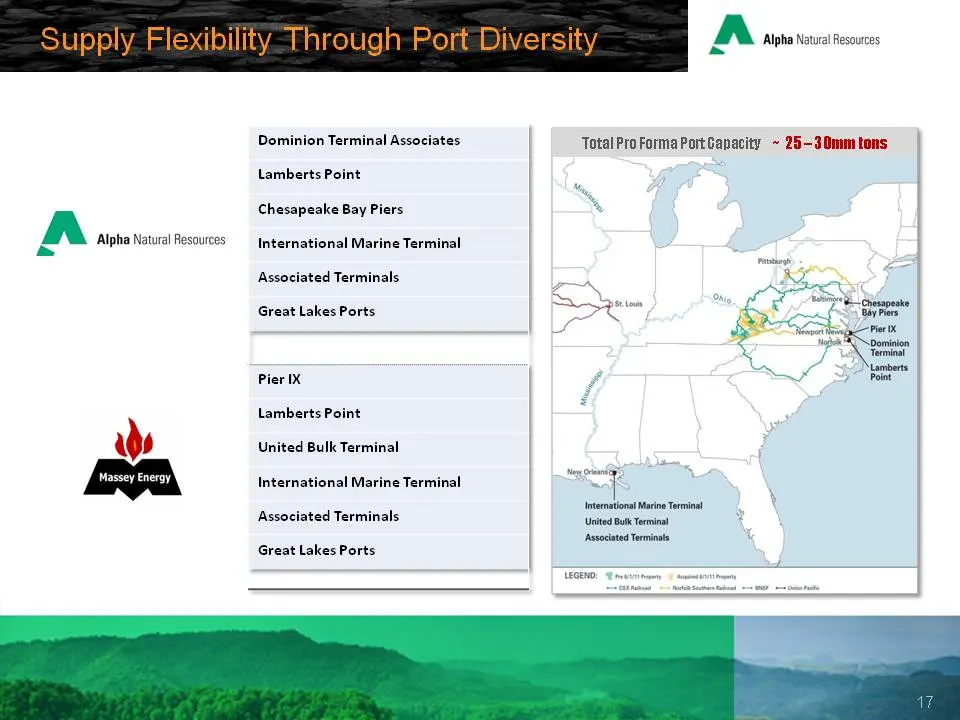
Slide 17: Export terminal access and port capacity
A ‘Alpha Natural Resources Dominion Terminal Associates Lamberts Point Chesapeake Bay Piers International Marine Terminal Associated Terminals Great Lakes Ports Pier IX Lamberts Point United Bulk Terminal International Marine Terminal Associated Terminals Great Lakes Ports A Alpha Natural Resources
Slide 18: Leading global supplier of metallurgical coal
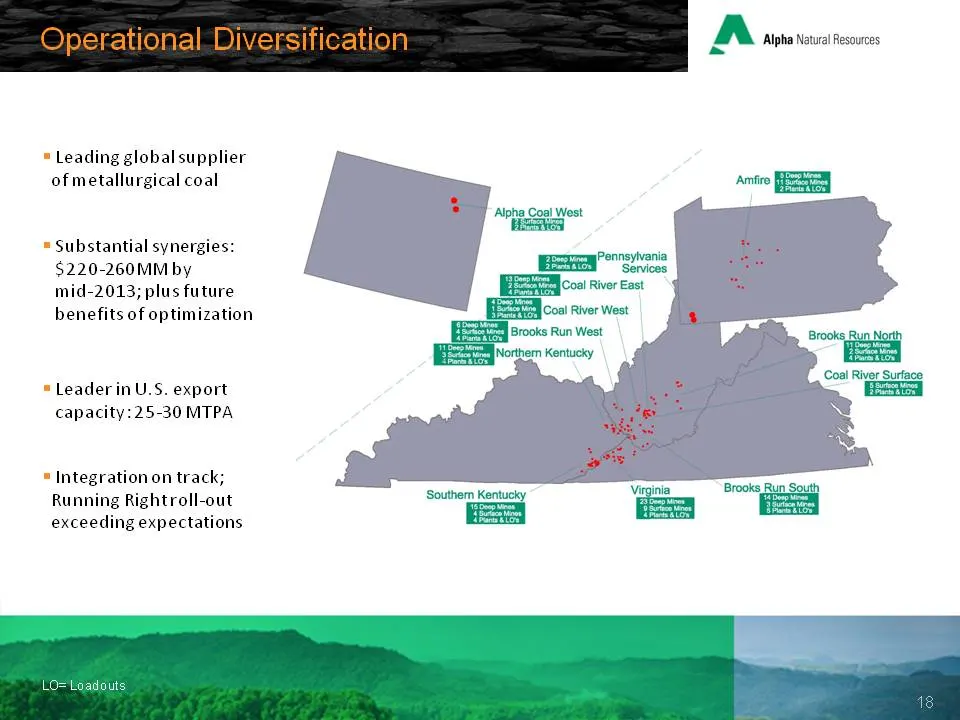
A Alpha Natural Resources - = Leading global supplier of metallurgical coal | J) Alpha Coal West aise f ’ = Substantial synergies: essen | i. 4 $220-260MM by a Senices Geet 4 mid-2013; plus future benefits of optimization a > Felon river west afl Fie rss run West Brooks, Run Noxth z FP ct River Suta
Slide 19: Annual Synergy Run Rates Grow Over Time
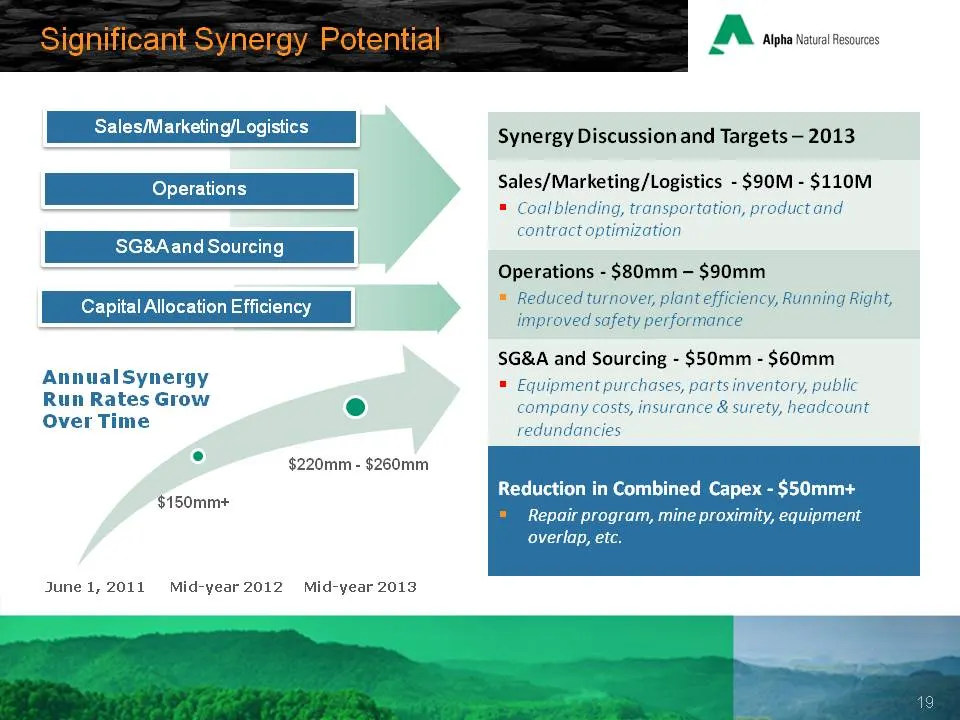
f AnnualSynergy Run Rates Grow @ Over Time & $220mm - $260mm $150mm+ June 1, 2011 Mid-year 2012 Mid-year 2013 Synergy Discussion and Targets — 2013 Sales/Marketing/Logistics - $90M - $110M * Coal blending, transportation, product and contract optimization Operations - $80mm - $90mm ® Reduced turnove
Slide 20: Optimization Process
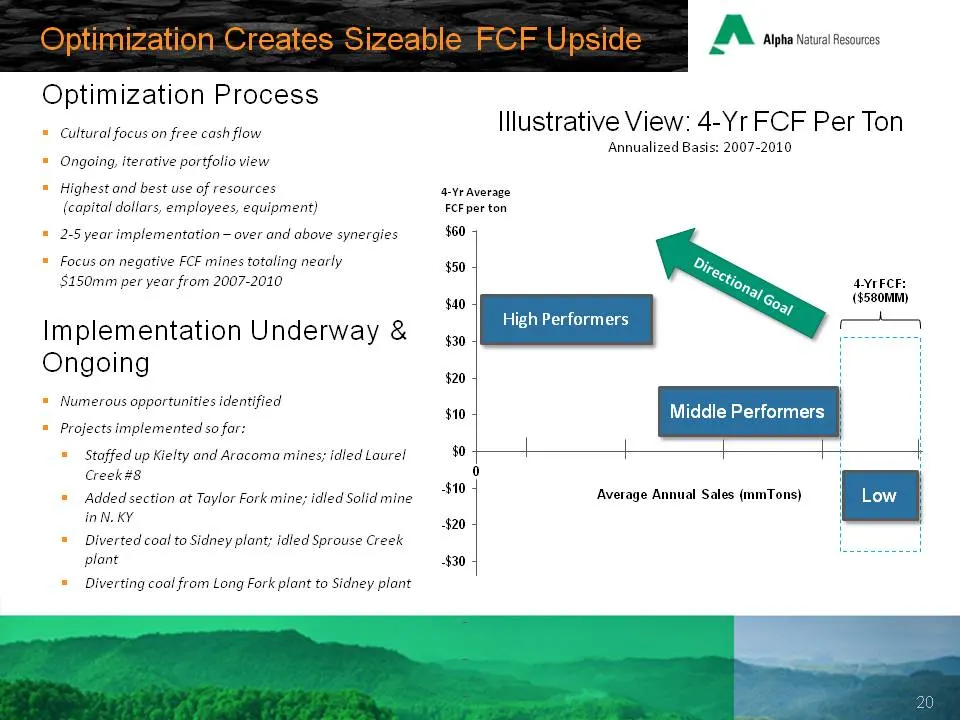
Optimization Process Cultural focus on free cash flow Ongoing, iterative portfolio view Highest and best use of resources (copital dolar, employees, equipment) 2-5 year implementation ~ over and above synergies Focus on negative FCF mines totaling nearly $150mm per year from 2007-2010 Implementation
Slide 21: Running Right Yields Results
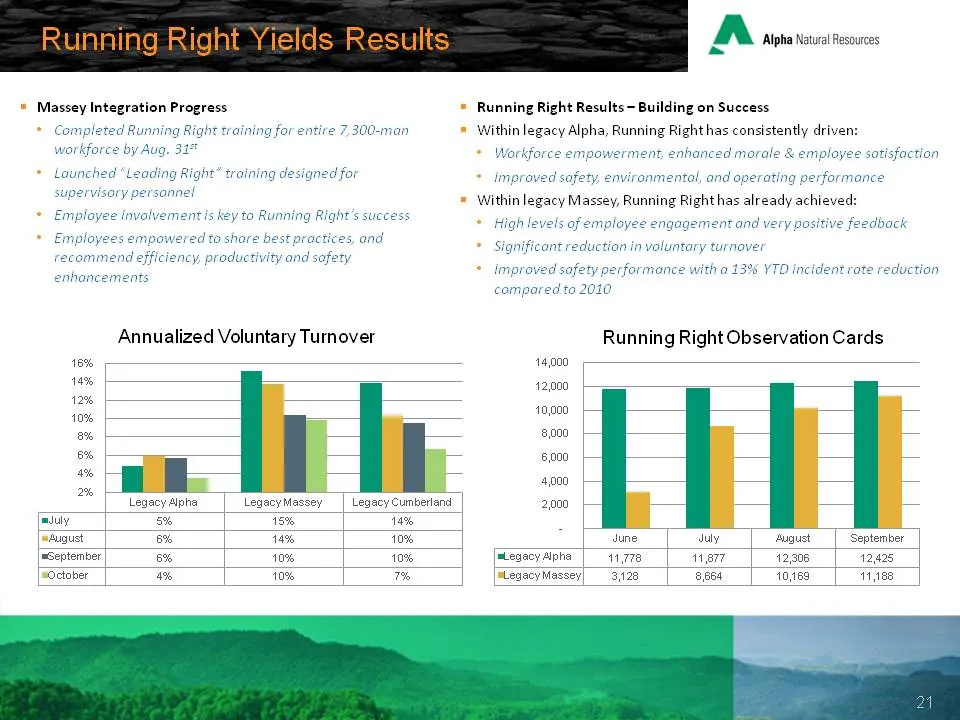
Running Right Yields Results Massey Integration Progress Running Right training fo 7,300-man Annualized Voluntary Turnover 16% 14% = 1% 10% . o% % an | BE m% Lesacyalphe | LeuecyMassey | Legacy Cunberend any 3% 5% 16% ut o% 16% 10% september o% 10% 10% clober 7% 10% 7% A Alpha Natural Resources ~ Ru
Slide 22: Financial Overview
Financial Overview Resources to Behance Shareholder Value
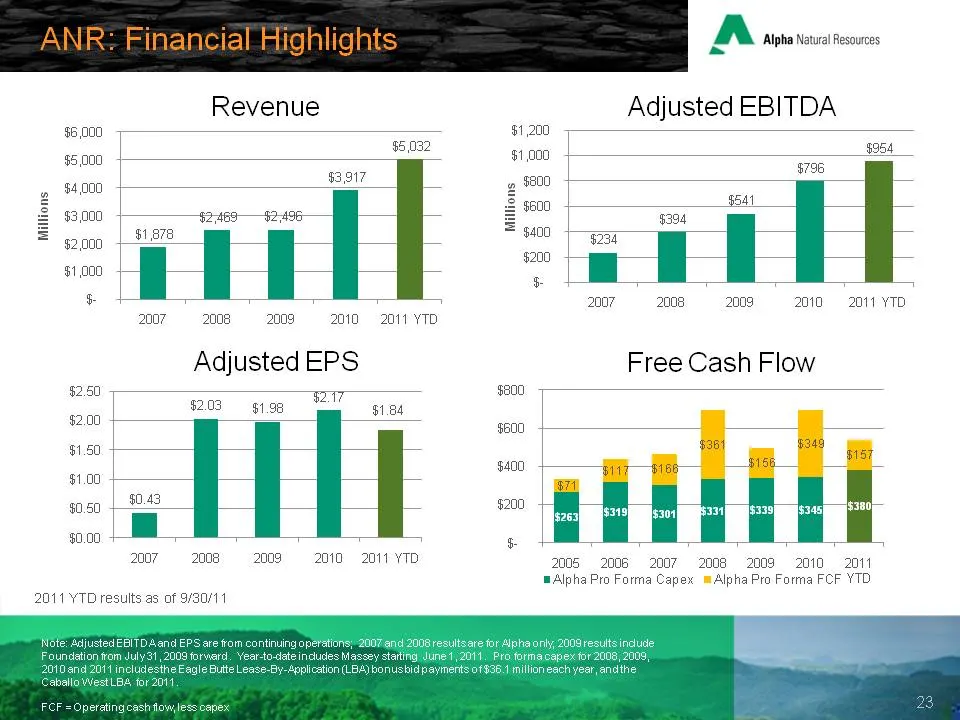
Slide 23: Revenue, Adjusted EBITDA, Adjusted EPS, Free Cash Flow
Revenue A. Natural Re 4 Ipha Natural Resources Adjusted EBITDA $796 2007 2008 2009 20102011 YTD 2007 2008 2009 2010 © 2011 YTD Adjusted EPS Free Cash Flow $2.50 $21 $800 $203 §198 $1.84 $2.00 $1.50 $1.00 $0.50 + $0.00 2007 -20B. «2092 2011 YTD results as of 9/30/11 2011 YTD 20052006 «2007 2008 2009
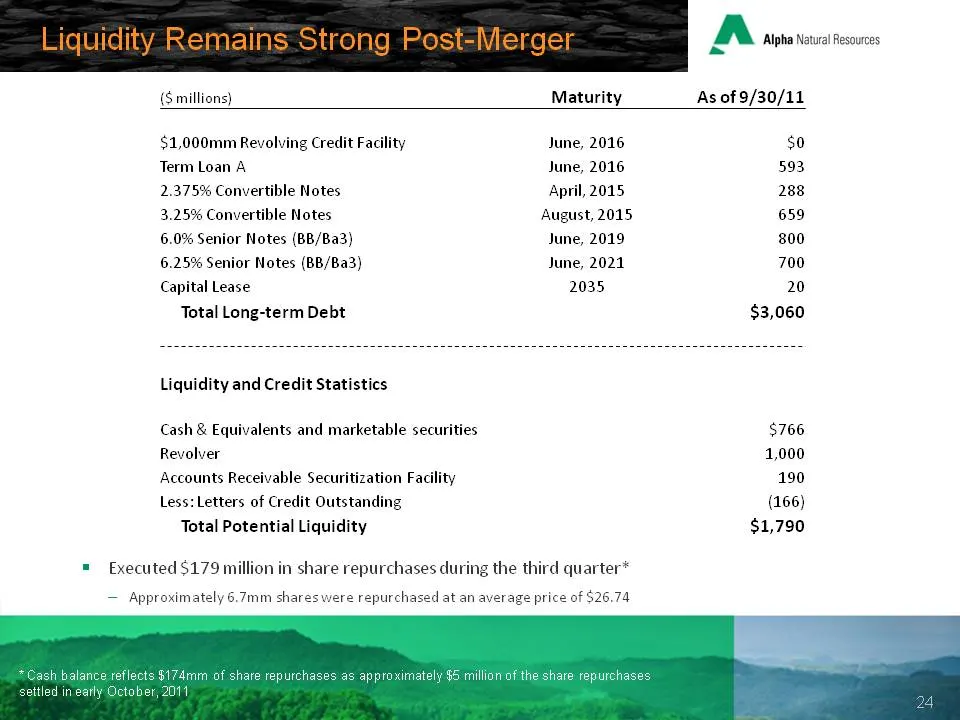
Slide 24: Debt maturities, liquidity and credit statistics
A Alpha Natural Resources ~ ($ millions) Maturity As of 9/30/11 $1,000mm Revolving Credit Facility June, 2016 so Term Loan A June, 2016 593 2.375% Convertible Notes April, 2015 288 3.25% Convertible Notes August, 2015 659 6.0% Senior Notes (BB/Ba3) June, 2019 800 6.25% Senior Notes (BB/Ba3) June, 20
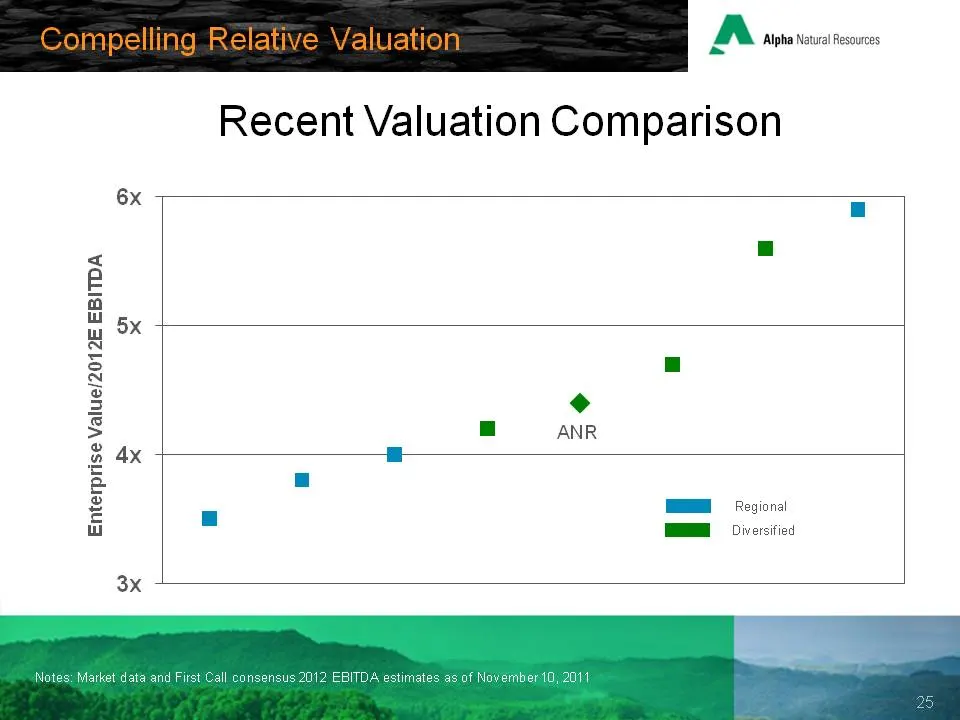
Slide 25: Recent Valuation Comparison
A Alpha Natural Resources ~ Recent Valuation Comparison 6x | 4 . a wy OX 4 S a s 2 o s a ANR B Ax = 2 | g ME Regional inf - ME Diversion arket data and Fir
Slide 26: Alpha Natural Resources
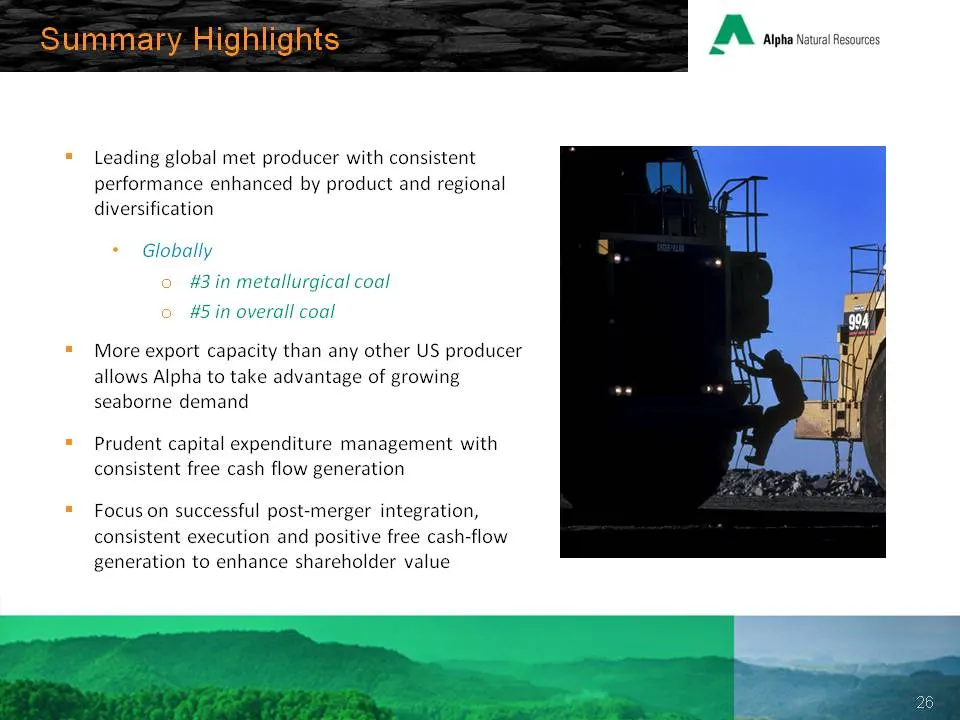
Alpha Natural Resources = Leading global met producer with consistent performance enhanced by product and regional diversification Globally #3 in metallurgical coal #5 in overall coal = More export capacity than any other US producer allows Alpha to take advantage of growing seaborne demand = Pruden
Slide 27: Appendices
A Alpha Natural Resources ~ A Alpha Natural Resources 7 ~ Appendices www.alphanr.com
Slide 28: B® diptea watt Resouces
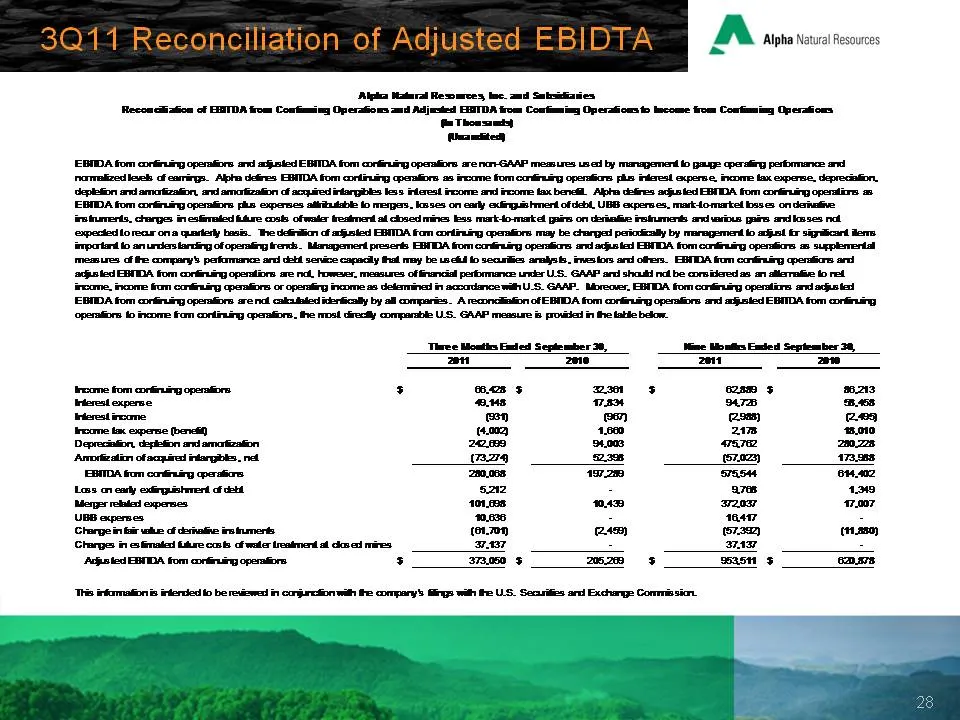
[aN B® diptea watt Resouces
Slide 29: Alpha Natural Resources
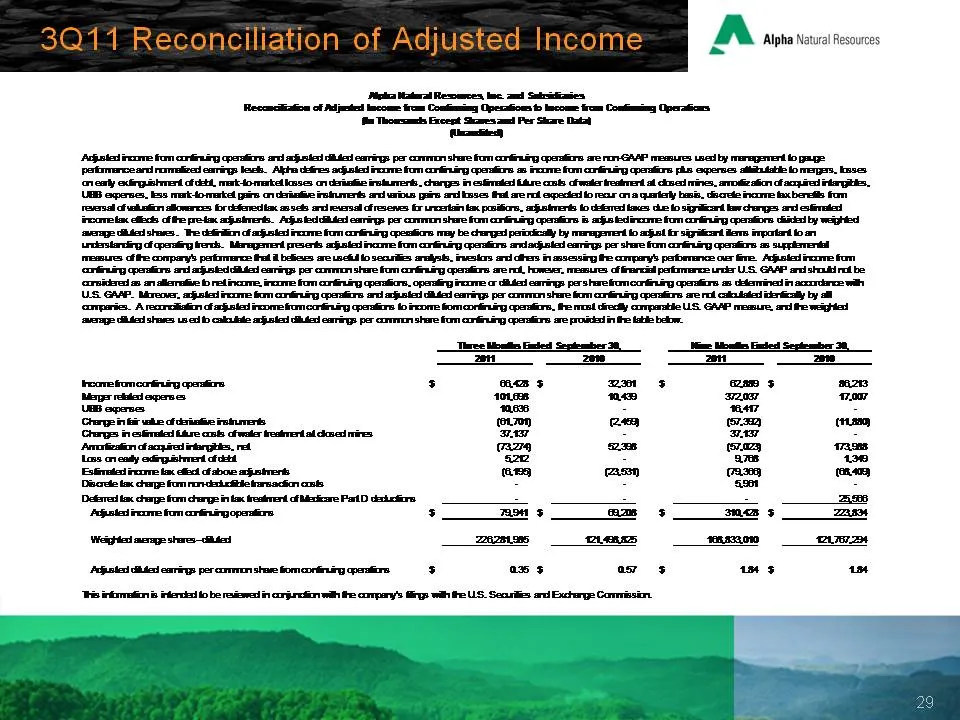
‘ Alpha Natural Resources
Source: SEC EDGAR · 8-K filed Nov 15, 2011
More decks from Alpha Natural Resources Inc
 J.P. Morgan Global High Yield & Leveraged Finance Conference (February 2015)36 slides · Feb 23, 2015
 Barclays CEO Energy-Power Conference 201435 slides · Sep 2, 2014
 2014 BMO 23rd Global Metals and Mining Conference; Sterne Agee 2014 Boston Executive Summi33 slides · Jun 17, 2014
 2014 BMO 23rd Global Metals and Mining Conference / Brean Capital 2014 Global Resources &30 slides · May 28, 2014
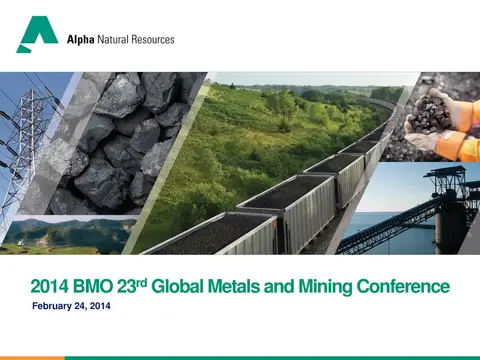 2014 BMO 23rd Global Metals and Mining Conference30 slides · Feb 24, 2014
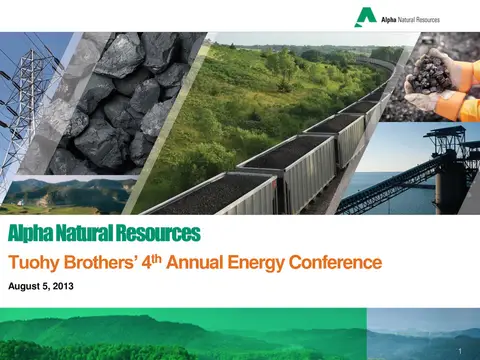 Tuohy Brothers' 4th Annual Energy Conference (August 2013)26 slides · Aug 5, 2013