Railamerica — Morgan Keegan Equity Conference 2004
22 slides from Railamerica's conference presentation, Sep 9, 2004
Slide 1: Morgan Keegan Equity Conference September 9, 2004
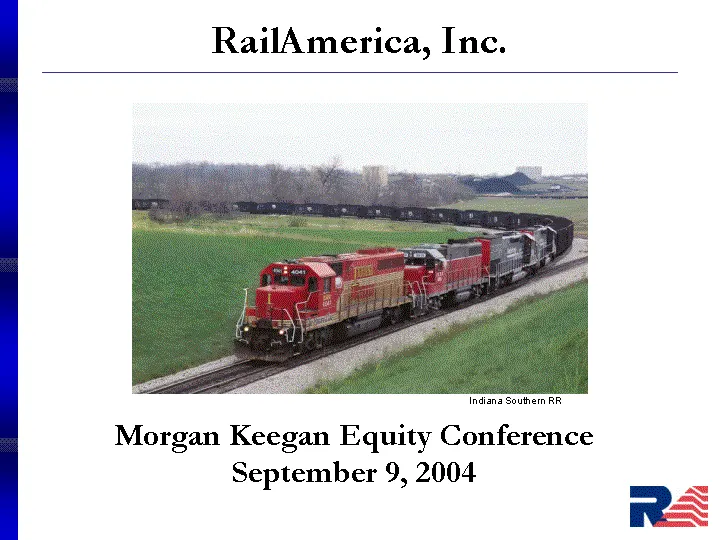
Morgan Keegan Equity Conference September 9, 2004 RailAmerica, Inc. Indiana Southern RR
Slide 2: Forward Looking Statements and Forecasts
Forward Looking Statements and Forecasts This presentation contains forward-looking statements, forecasts, and information regarding future events and the future performance of RailAmerica that involve risks and uncertainties that could cause actual results and actions to differ materially, includin
Slide 3: Corporate Review
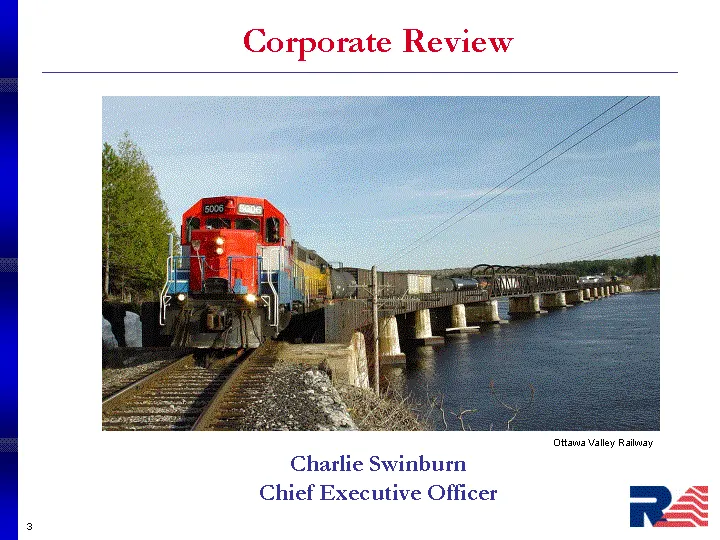
Corporate Review Corporate Review Charlie Swinburn Chief Executive Officer Ottawa Valley Railway
Slide 4: RailAmerica North American Rail Group
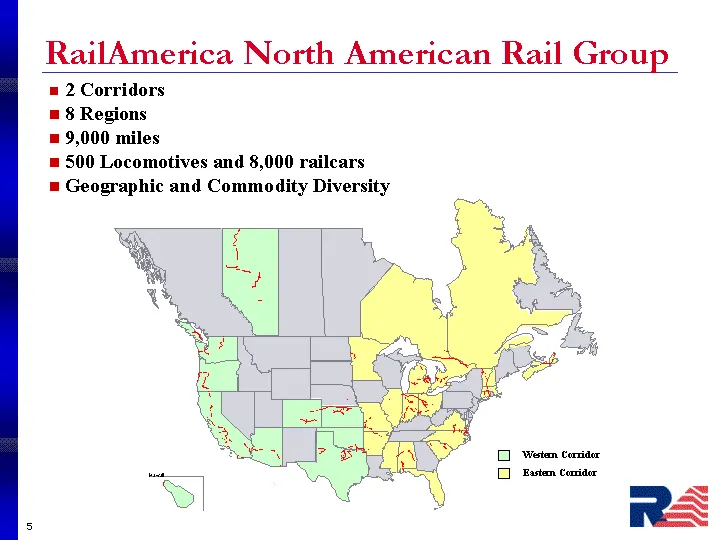
RailAmerica North American Rail Group 2 Corridors 8 Regions 9,000 miles 500 Locomotives and 8,000 railcars Geographic and Commodity Diversity Hawaii Western Corridor Eastern Corridor
Slide 5: North American Diversification
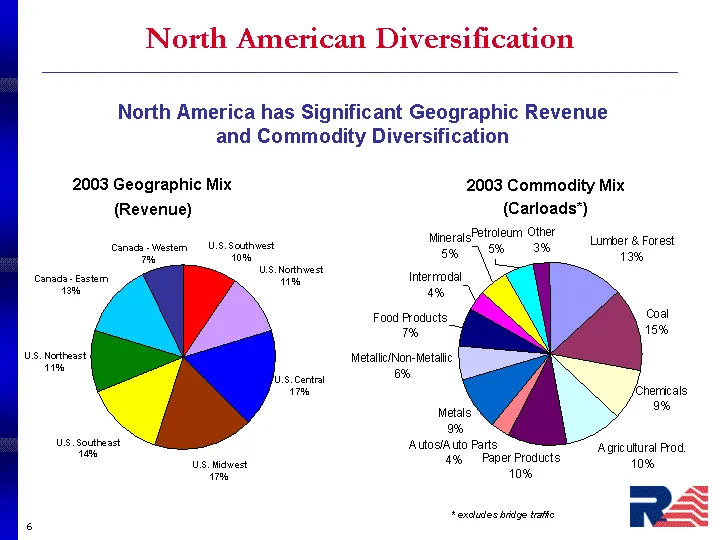
North American Diversification U.S. Southwest U.S. Northwest U.S. Central U.S. Midwest U.S. Southeast U.S. Northeast Canada - Eastern Canada - Western East 0.094 0.106 0.169 0.172 0.139 0.106 0.13 0.07 2003 Geographic Mix (Revenue) 2003 Commodity Mix (Carloads*) * excludes bridge traffic North Ameri
Slide 6: Growth Strategy
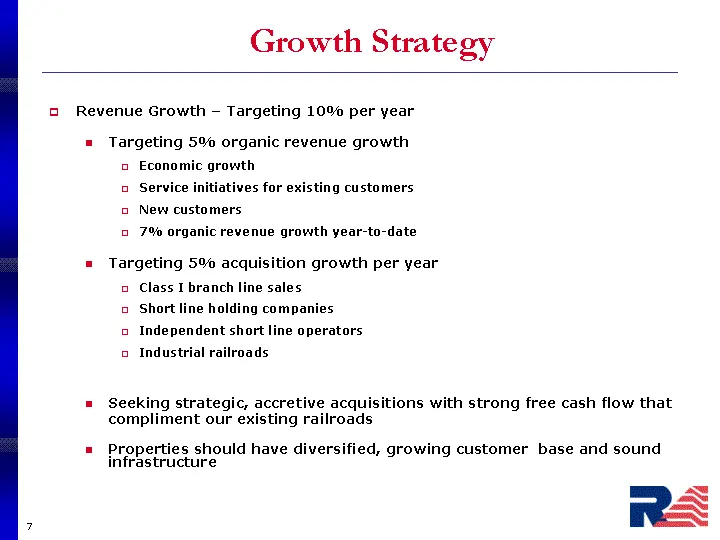
Growth Strategy Revenue Growth - Targeting 10% per year Targeting 5% organic revenue growth Economic growth Service initiatives for existing customers New customers 7% organic revenue growth year-to-date Targeting 5% acquisition growth per year Class I branch line sales Short line holding companies
Slide 7: Recent Events
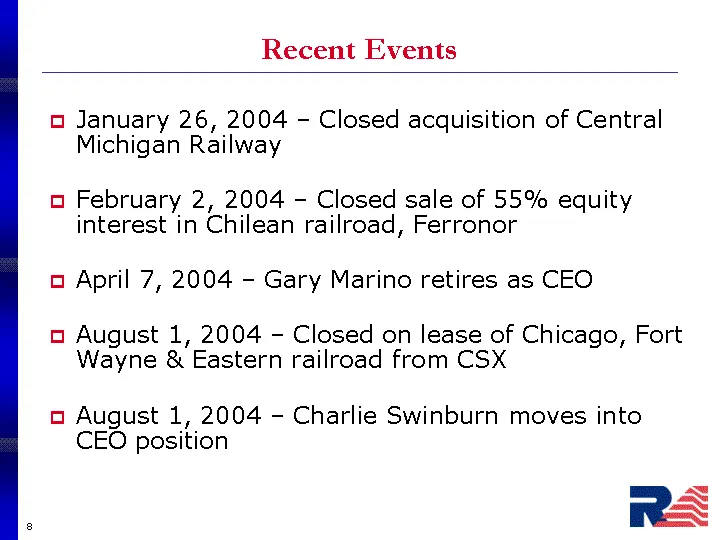
Recent Events January 26, 2004 - Closed acquisition of Central Michigan Railway February 2, 2004 - Closed sale of 55% equity interest in Chilean railroad, Ferronor April 7, 2004 - Gary Marino retires as CEO August 1, 2004 - Closed on lease of Chicago, Fort Wayne & Eastern railroad from CSX August 1,
Slide 8: Recent Events (Continued)
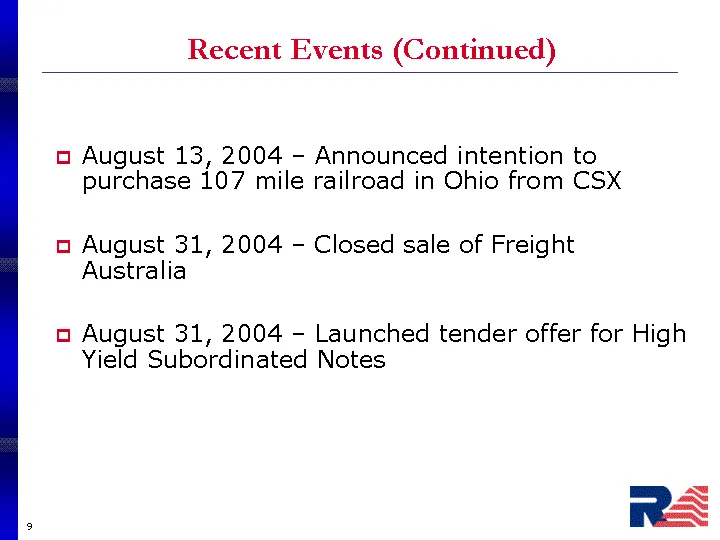
Recent Events (Continued) August 13, 2004 - Announced intention to purchase 107 mile railroad in Ohio from CSX August 31, 2004 - Closed sale of Freight Australia August 31, 2004 - Launched tender offer for High Yield Subordinated Notes
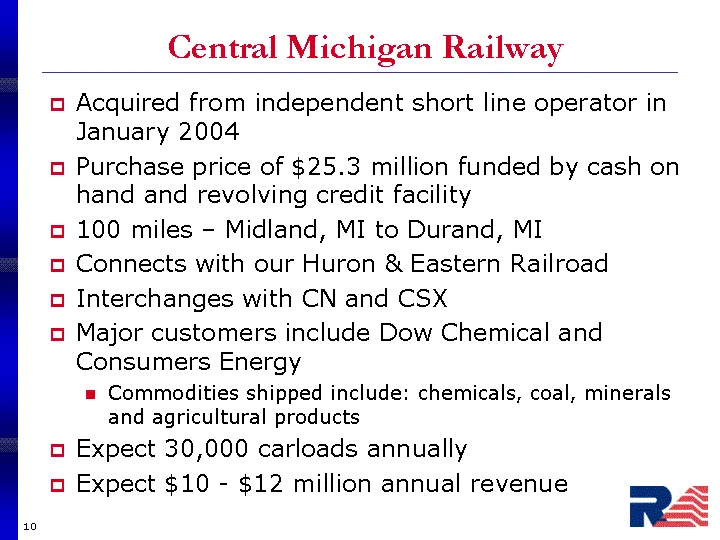
Slide 9: Central Michigan Railway
Central Michigan Railway Acquired from independent short line operator in January 2004 Purchase price of $25.3 million funded by cash on hand and revolving credit facility 100 miles - Midland, MI to Durand, MI Connects with our Huron & Eastern Railroad Interchanges with CN and CSX Major customers in
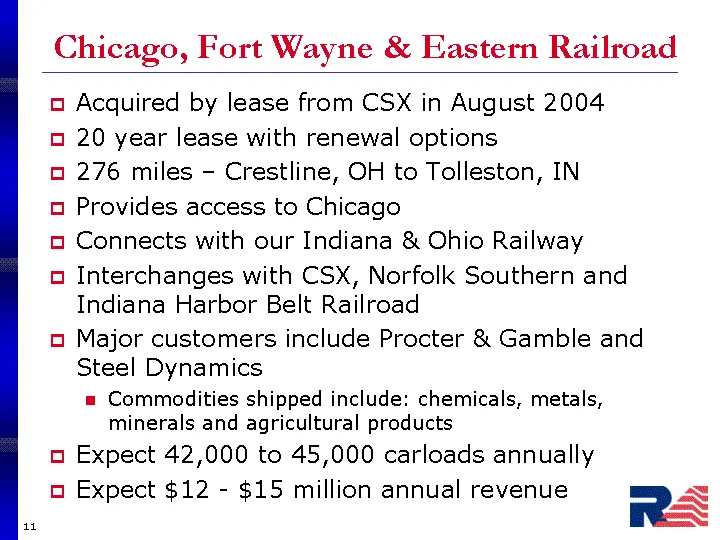
Slide 10: Chicago, Fort Wayne & Eastern Railroad
Chicago, Fort Wayne & Eastern Railroad Acquired by lease from CSX in August 2004 20 year lease with renewal options 276 miles - Crestline, OH to Tolleston, IN Provides access to Chicago Connects with our Indiana & Ohio Railway Interchanges with CSX, Norfolk Southern and Indiana Harbor Belt Railroad
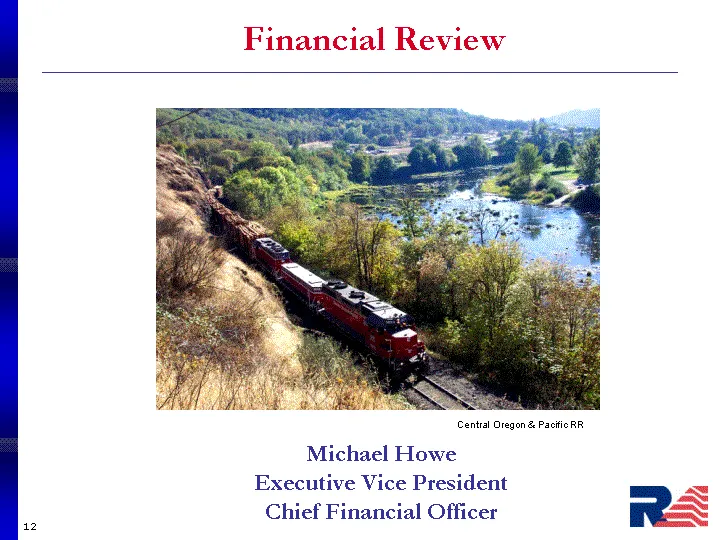
Slide 11: Financial Review
Financial Review Financial Review Central Oregon & Pacific RR Michael Howe Executive Vice President Chief Financial Officer
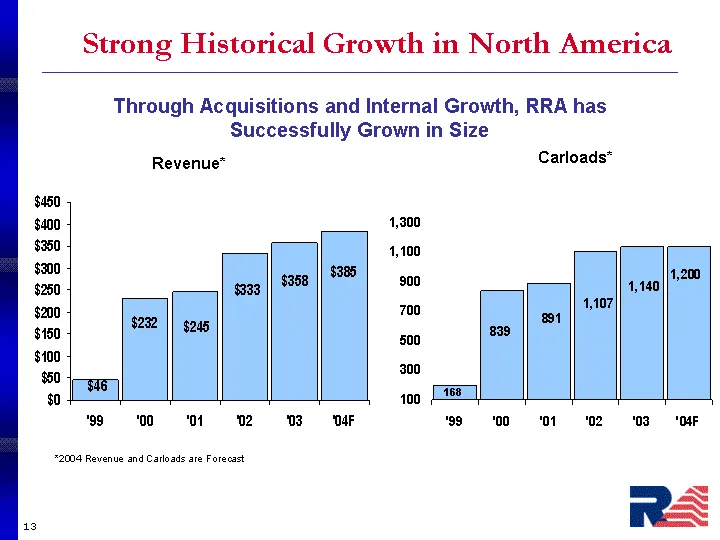
Slide 12: Strong Historical Growth in North America
Strong Historical Growth in North America '99 '00 '01 '02 '03 '04F East 200 839 891 1107 1140 1140 Through Acquisitions and Internal Growth, RRA has Successfully Grown in Size *2004 Revenue and Carloads are Forecast Revenue* Carloads* '99 '00 '01 '02 '03 '04F East 46 232 246 333 358 384
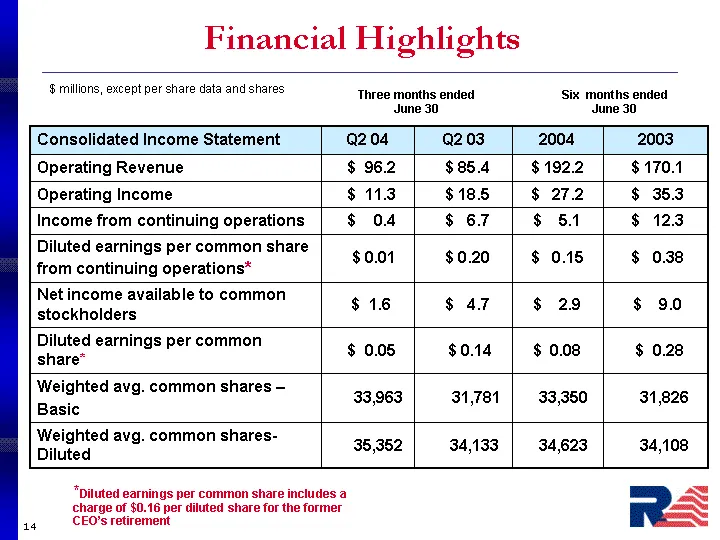
Slide 13: Financial Highlights: Consolidated Income Statement
Financial Highlights Consolidated Income Statement Q2 04 Q2 03 2004 2003 Operating Revenue $ 96.2 $ 85.4 $ 192.2 $ 170.1 Operating Income $ 11.3 $ 18.5 $ 27.2 $ 35.3 Income from continuing operations $ 0.4 $ 6.7 $ 5.1 $ 12.3 Diluted earnings per common share from continuing operations* $ 0.01 $ 0.20
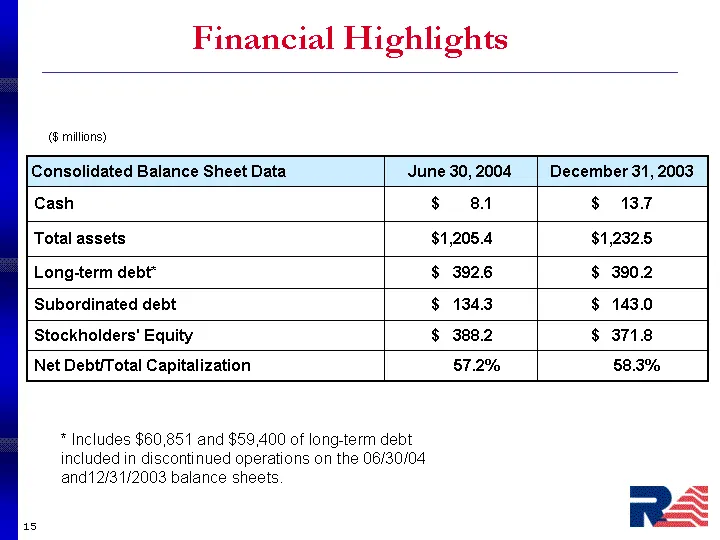
Slide 14: Financial Highlights: Consolidated Balance Sheet Data
Financial Highlights ($ millions) Consolidated Balance Sheet Data June 30, 2004 December 31, 2003 Cash $ 8.1 $ 13.7 Total assets $1,205.4 $1,232.5 Long-term debt* $ 392.6 $ 390.2 Subordinated debt $ 134.3 $ 143.0 Stockholders' Equity $ 388.2 $ 371.8 Net Debt/Total Capitalization 57.2% 58.3% * Includ
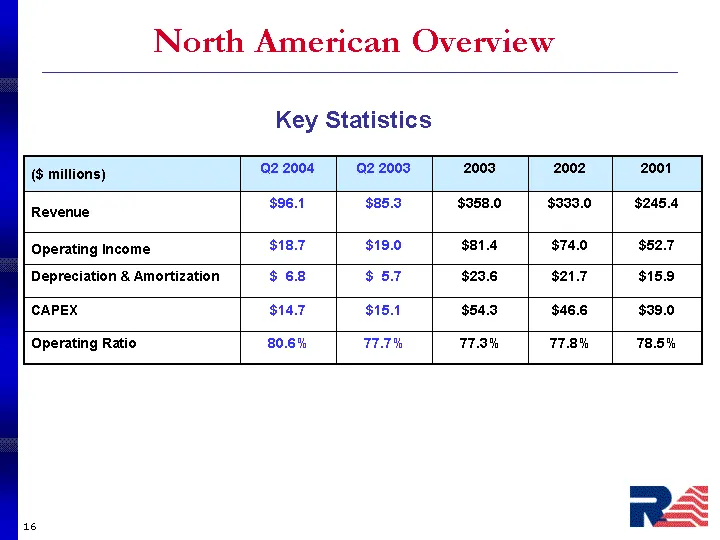
Slide 15: North American Overview Key Statistics
North American Overview Key Statistics ($ millions) Q2 2004 Q2 2003 2003 2002 2001 Revenue $96.1 $85.3 $358.0 $333.0 $245.4 Operating Income $18.7 $19.0 $81.4 $74.0 $52.7 Depreciation & Amortization $ 6.8 $ 5.7 $23.6 $21.7 $15.9 CAPEX $14.7 $15.1 $54.3 $46.6 $39.0 Operating Ratio 80.6% 77.7% 77.3% 7
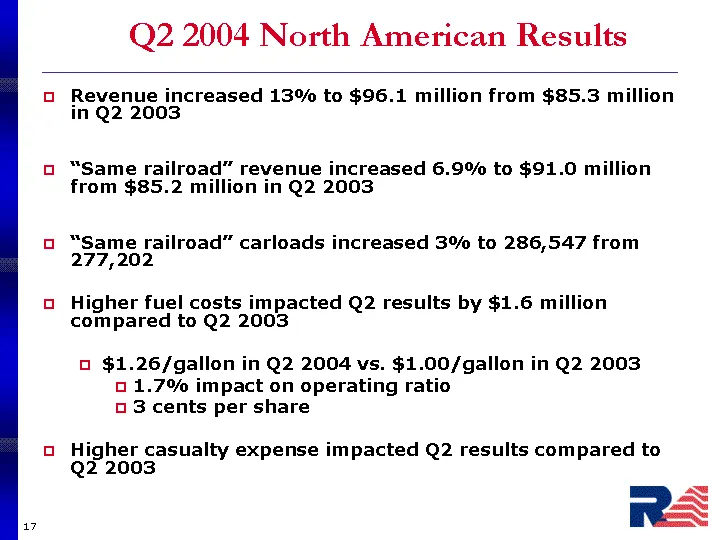
Slide 16: Q2 2004 North American Results
Q2 2004 North American Results Revenue increased 13% to $96.1 million from $85.3 million in Q2 2003 "Same railroad" revenue increased 6.9% to $91.0 million from $85.2 million in Q2 2003 "Same railroad" carloads increased 3% to 286,547 from 277,202 Higher fuel costs impacted Q2 results by $1.6 millio
Slide 17: Outlook for 2004
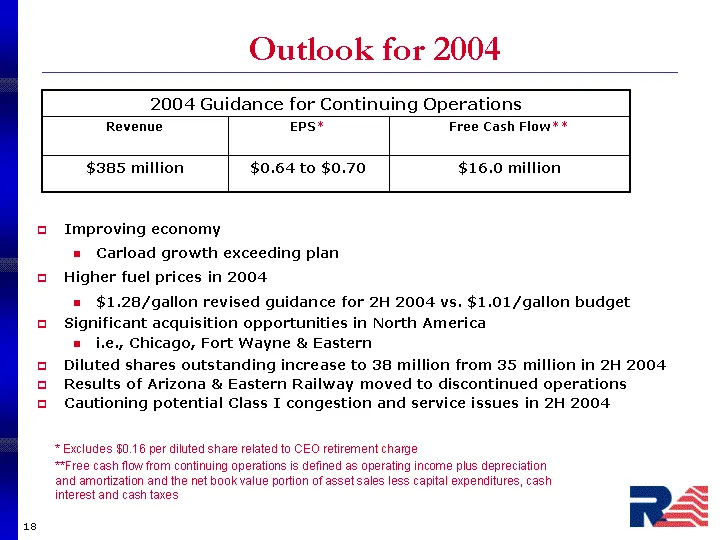
Outlook for 2004 2004 Guidance for Continuing Operations 2004 Guidance for Continuing Operations 2004 Guidance for Continuing Operations Revenue EPS* Free Cash Flow** $385 million $0.64 to $0.70 $16.0 million Improving economy Carload growth exceeding plan Higher fuel prices in 2004 $1.28/gallon rev
Slide 18: Sale of Freight Australia
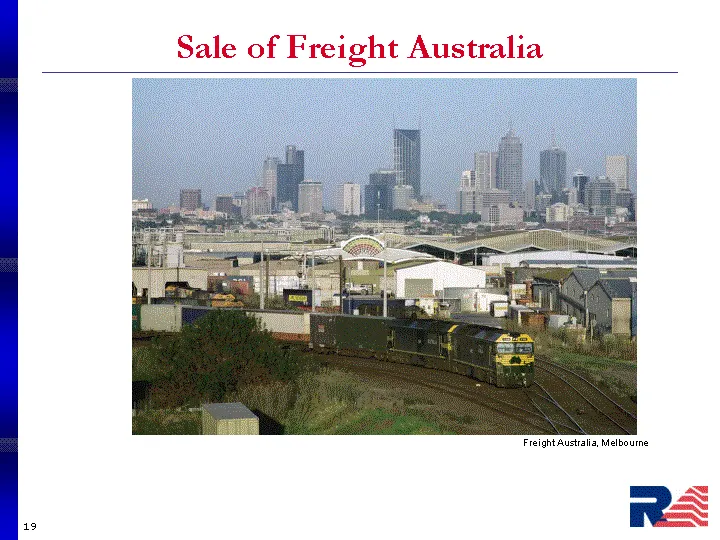
Sale of Freight Australia Sale of Freight Australia Freight Australia, Melbourne
Slide 19: Freight Australia
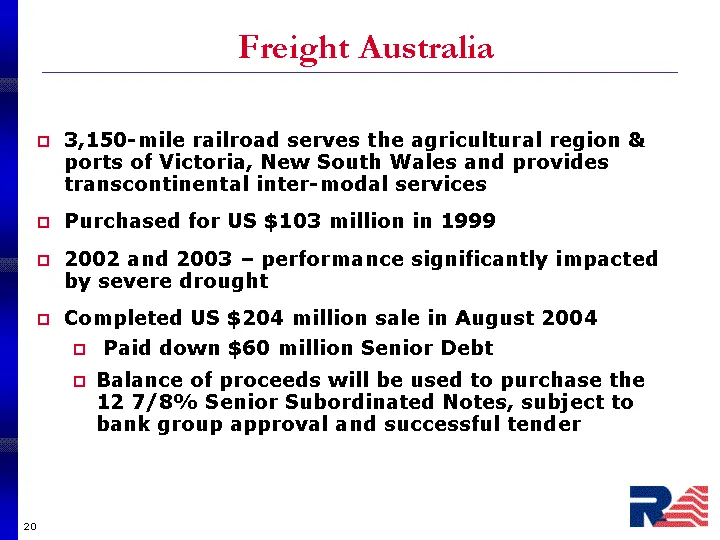
Freight Australia 3,150-mile railroad serves the agricultural region & ports of Victoria, New South Wales and provides transcontinental inter-modal services Purchased for US $103 million in 1999 2002 and 2003 - performance significantly impacted by severe drought Completed US $204 million sale in Au
Slide 20: Freight Australia Expected Use of Proceeds From Sale
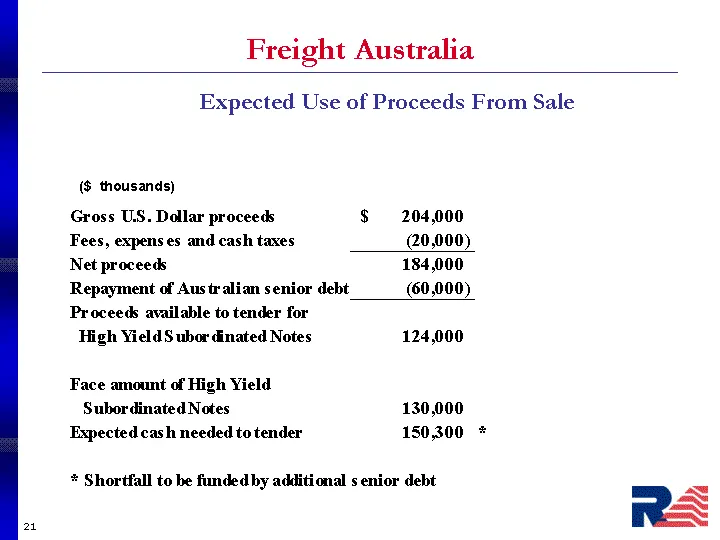
Freight Australia Expected Use of Proceeds From Sale ($ thousands)
Slide 21: Summary RRA Investment Highlights
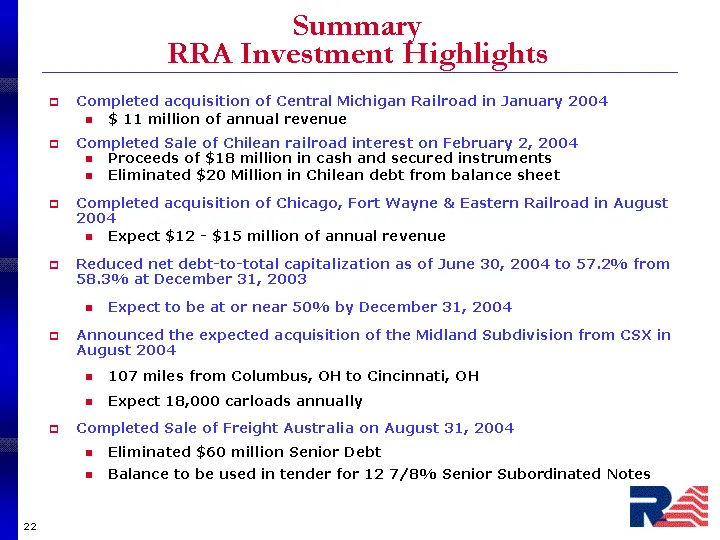
Summary RRA Investment Highlights Completed acquisition of Central Michigan Railroad in January 2004 $ 11 million of annual revenue Completed Sale of Chilean railroad interest on February 2, 2004 Proceeds of $18 million in cash and secured instruments Eliminated $20 Million in Chilean debt from bala
Slide 22: Morgan Keegan Equity Conference September 9, 2004
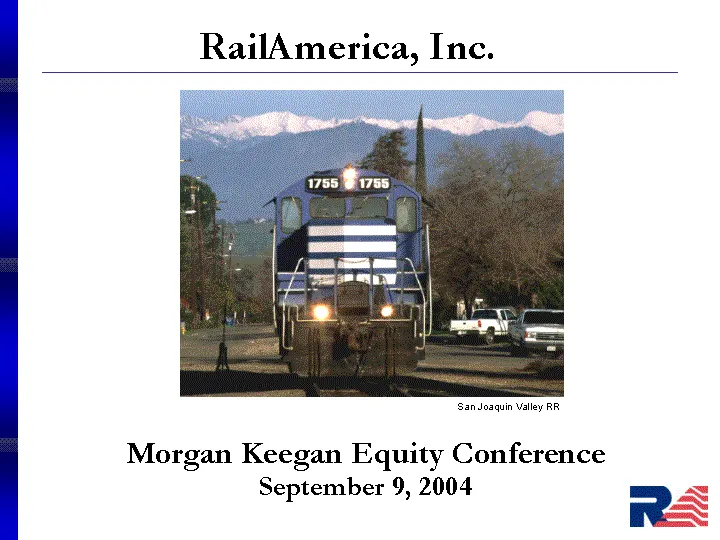
Morgan Keegan Equity Conference September 9, 2004 RailAmerica, Inc. San Joaquin Valley RR
Source: SEC EDGAR · 8-K filed Sep 9, 2004
More decks from Railamerica Inc
 Q2 2012 Earnings Presentation25 slides · Jul 25, 2012
 Q1 2012 Earnings Presentation29 slides · Apr 26, 2012
 Q4 2011 Earnings Presentation33 slides · Feb 9, 2012
 Q3 2011 Earnings Presentation28 slides · Oct 26, 2011
 Q2 2011 Earnings Presentation27 slides · Jul 28, 2011
 Q1 2011 Earnings Presentation28 slides · Apr 28, 2011